Palantir Technologies (NASDAQ: PLTR) reported third-quarter 2026 revenue of $2.313 billion, up +96% from a year earlier, and for the first time its US commercial business brought in more than the US government. Management raised full-year revenue guidance for the third time this year. The contracts that become future revenue did not keep pace: total contract value (TCV) signed in the quarter rose only +6%, US commercial remaining deal value (RDV) grew 4.5% from June, and remaining performance obligations (RPO) slipped. Revenue nearly doubled in a quarter when the backlog behind it stopped growing.
Palantir builds software that pulls an organization’s scattered data into one operating model, which it calls the ontology, and runs its AIP artificial intelligence platform on top. At $178.34 a share the company is worth $428.6 billion on market data, and third-quarter diluted GAAP earnings per share were $0.44.
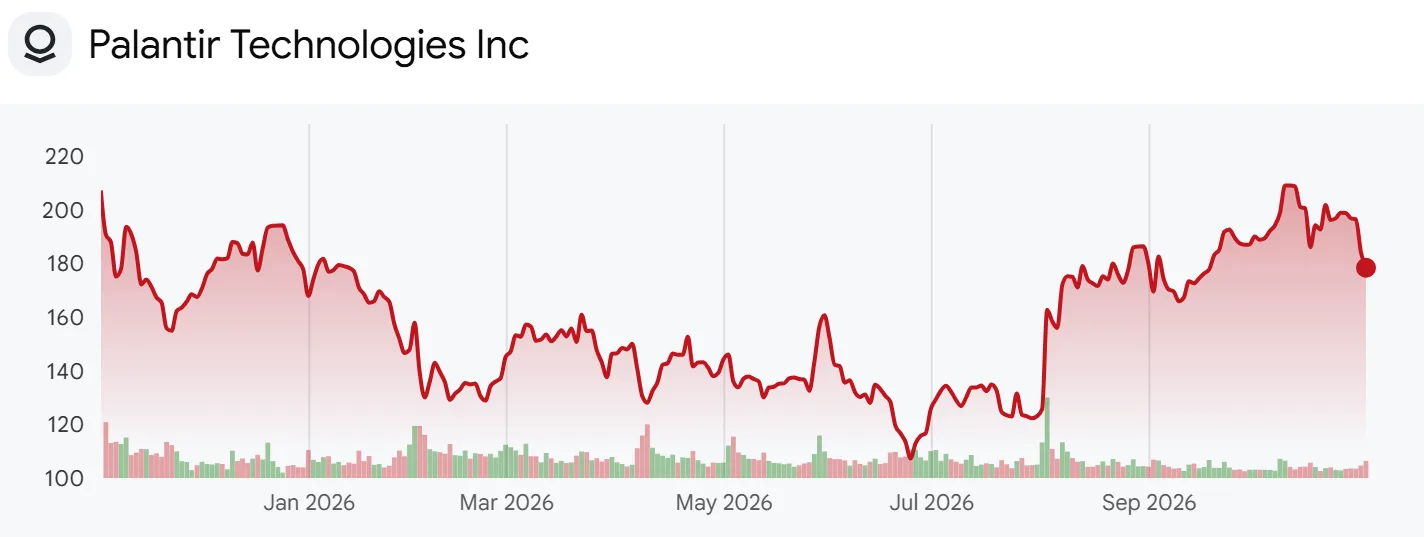
Palantir Technologies one-year share price chart
I lined up the Q3 2026 earnings release, the Q3 2026 10-Q, the 34-slide Q3 Business Update deck and 24 earnings releases going back to 2021 to measure how fast revenue is using up contracts already signed. The third-quarter earnings call is not part of this analysis. TCV and RDV are company metrics that assume customers exercise every option and do not cancel, while the 10-Q says the company allows many customers to “terminate contracts for convenience prior to the end of the stated term with less than twelve months’ notice.”
US Commercial Revenue and Customers in the Q3 Deck
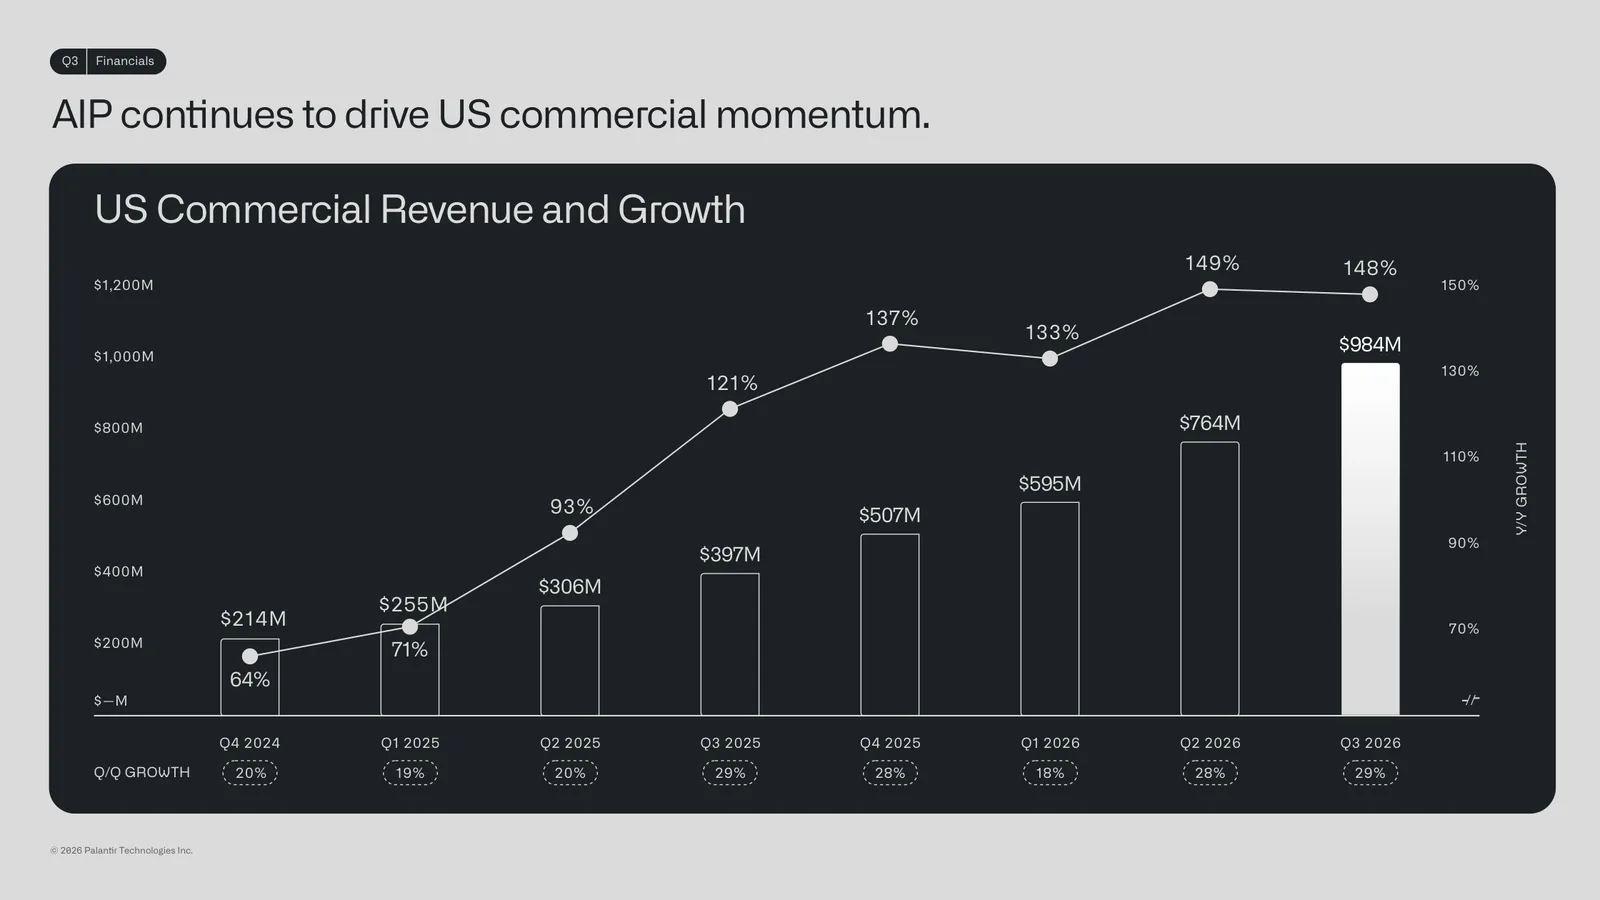
Q3 deck slide 12 with US commercial revenue and growth over eight quarters
Slide 12 plots US commercial revenue over eight quarters, starting from $214 million in the fourth quarter of 2024. The third quarter reached $984 million, up +148% from a year earlier and 29% from the second quarter, enough to pass US government revenue of $953 million for the first time. The slide’s headline credits AIP with driving US commercial growth. Year-over-year growth went from 121% in the third quarter of 2025 to 137%, 133%, 149% and 148%, holding at a high level. The quarter-over-quarter row underneath reads 20%, 19%, 20%, 29%, 28%, 18%, 28% and 29%, so the latest quarter is among the fastest of the eight and revenue shows no sign of slowing.
Other slides say the same. Total US revenue on slide 16 was $1.94 billion, up 119%, and US government revenue on slide 17 rose 96% from $486 million to $953 million. The company’s Rule of 40 on slide 15, revenue growth plus adjusted operating margin, rose for seven straight quarters from 81% in the fourth quarter of 2024 to 158%.
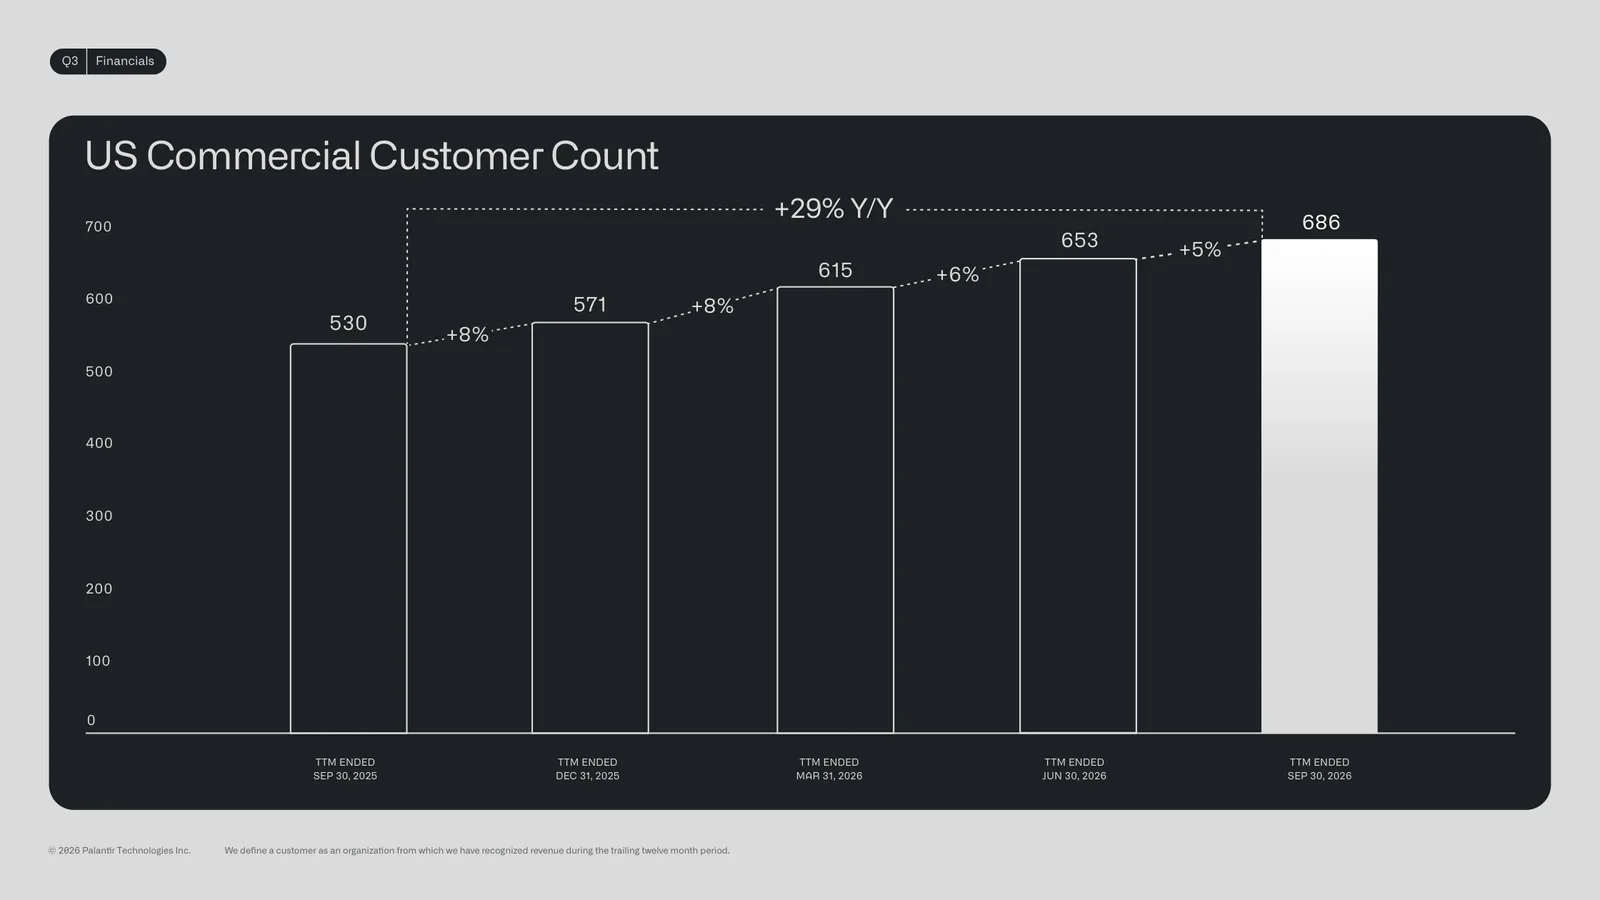
Q3 deck slide 21 with the US commercial customer count
Slide 21 counts US commercial customers that generated revenue over the trailing 12 months. There were 686 in the third quarter, 29% more than the 530 a year earlier, but quarter-on-quarter additions slowed from 8% and 8% to 6% and then 5%.
Own calculation (deck slide 21 and earnings releases): Trailing four-quarter US commercial revenue of $2.85 billion divided by 686 customers gives $4.15 million per customer, up 87.9% from $2.21 million a year earlier. Spending per customer, more than the number of customers, drove growth, and the 10-Q says average trailing 12-month revenue from the top 20 customers rose 76% to $146 million.
Remaining Performance Obligations and Net Retention
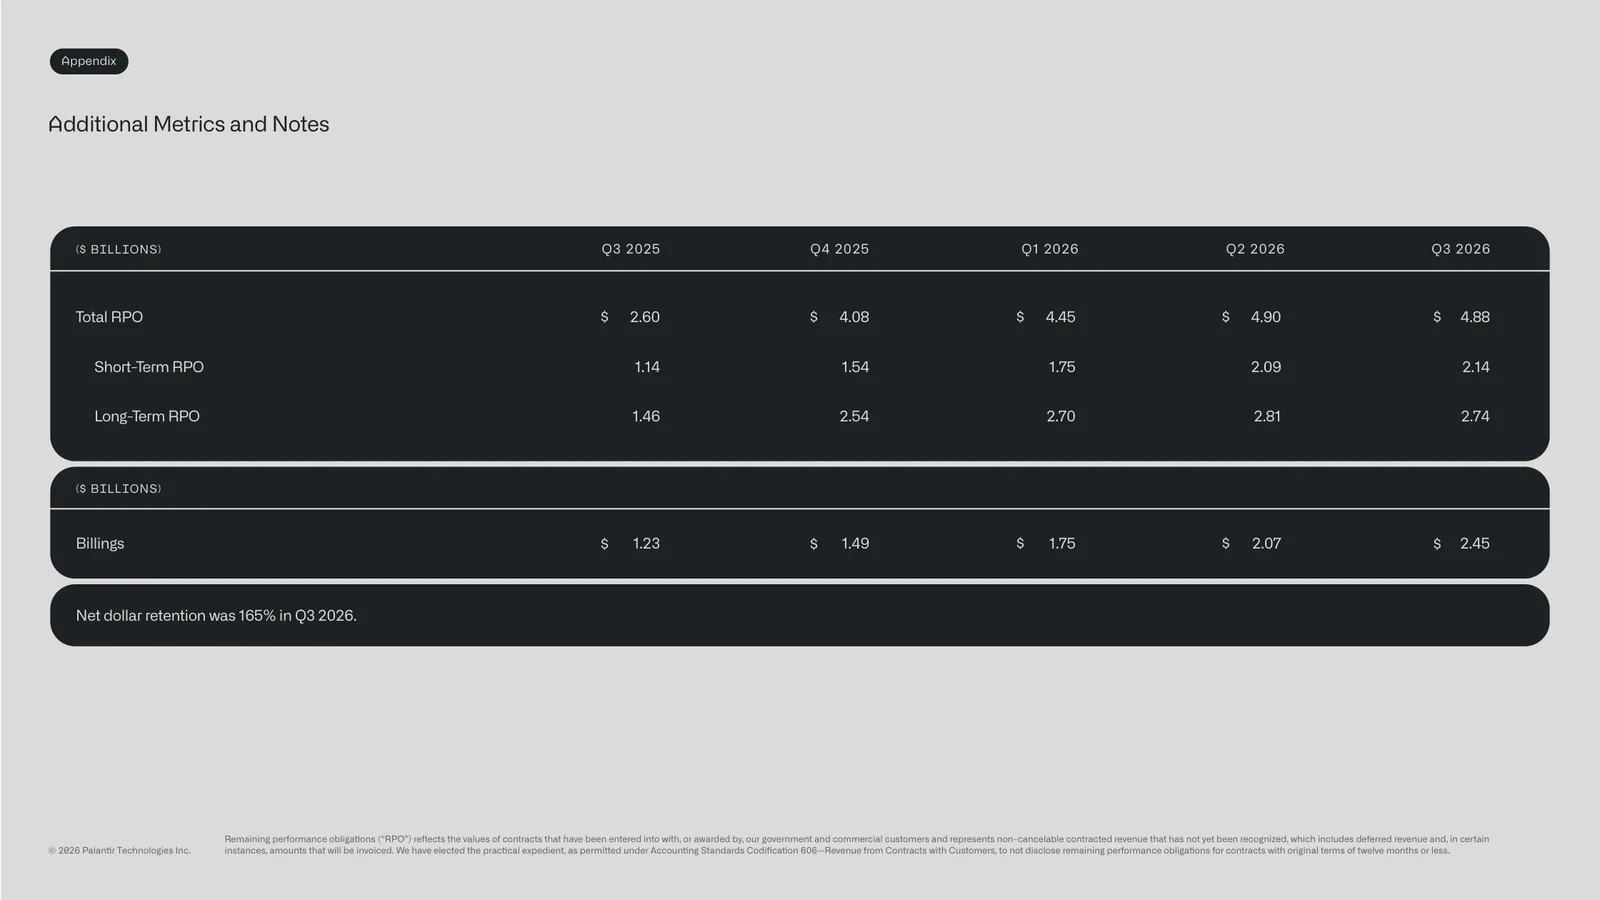
Q3 deck slide 27 with remaining performance obligations and billings and net dollar retention of 165%
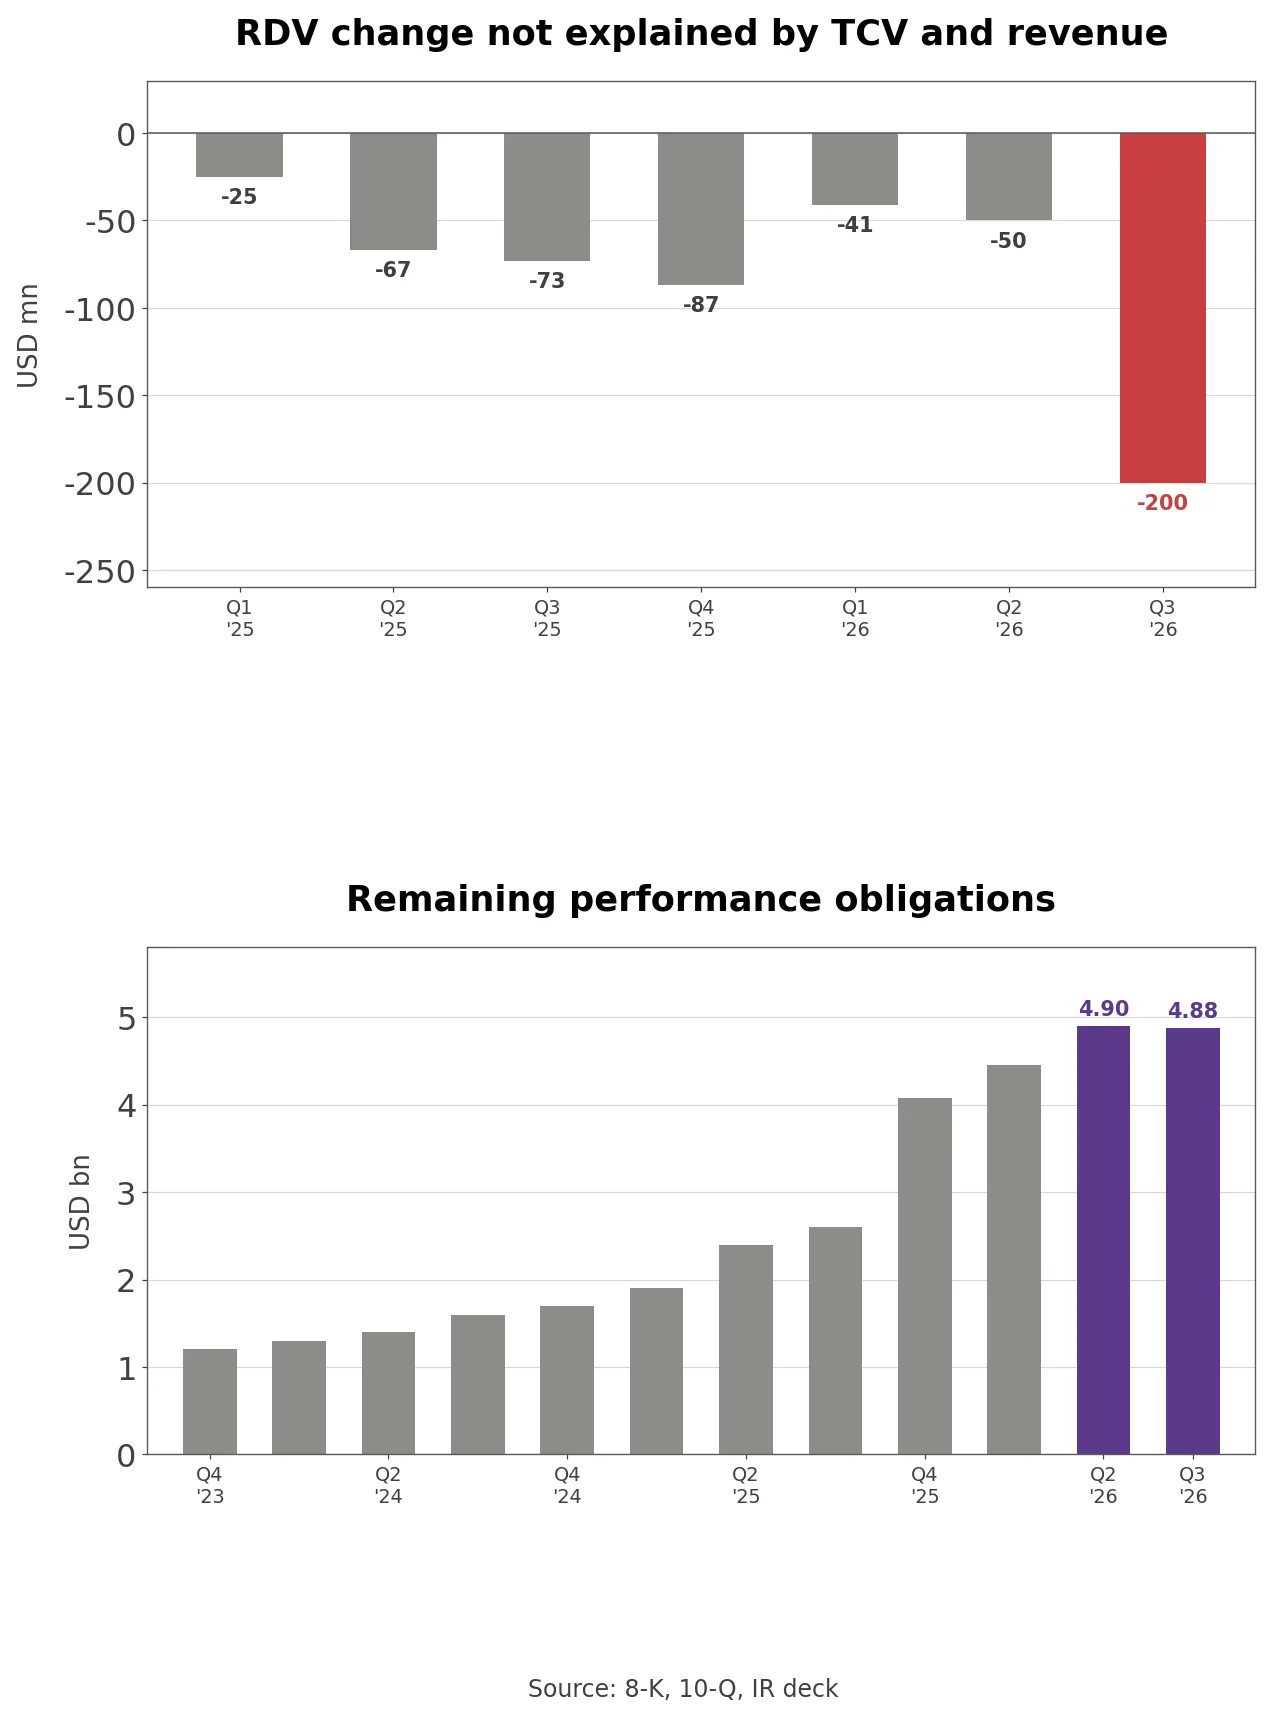
The table on slide 27 lists total RPO of $2.60 billion in the third quarter of 2025, $4.08 billion in the fourth, then $4.45 billion, $4.90 billion and $4.88 billion in the first three quarters of 2026. Total RPO on slide 27 fell from $4.90 billion in the second quarter to $4.88 billion in the third, the first sequential decline among the five quarters in the table. The 10-Q rounds both quarters to $4.9 billion, so the drop does not show there.
Split by timing, short-term RPO that becomes revenue within 12 months rose from $2.09 billion to $2.14 billion, while long-term RPO fell -2.5% from $2.81 billion to $2.74 billion. Billings on the same slide, revenue plus the change in contract liabilities, were $2.45 billion, up 99%, and net dollar retention was 165%. Existing customers spent 65% more than a year earlier while the long-dated part of the contract book shrank. RPO counts only non-cancellable contracts, so it is narrower than RDV, which includes contracts with termination clauses.
Own calculation (deck slide 27 and XBRL): Year-over-year growth in total RPO slowed from 140.0% in the fourth quarter of 2025 to 134.2%, 104.2% and 87.7%, while revenue growth in the same quarters rose from 70.0% to 84.7%, 92.8% and 95.9%. In the third quarter backlog growth fell below revenue growth for the first time. Short-term RPO of $2.14 billion is 0.81 times the $2.651 billion midpoint of fourth-quarter revenue guidance, so the non-cancellable share of next year’s revenue is smaller than one quarter’s sales.
Three Guidance Raises and the Q4 US Commercial Bar
Q3 deck slide 25 with fourth-quarter and full-year guidance
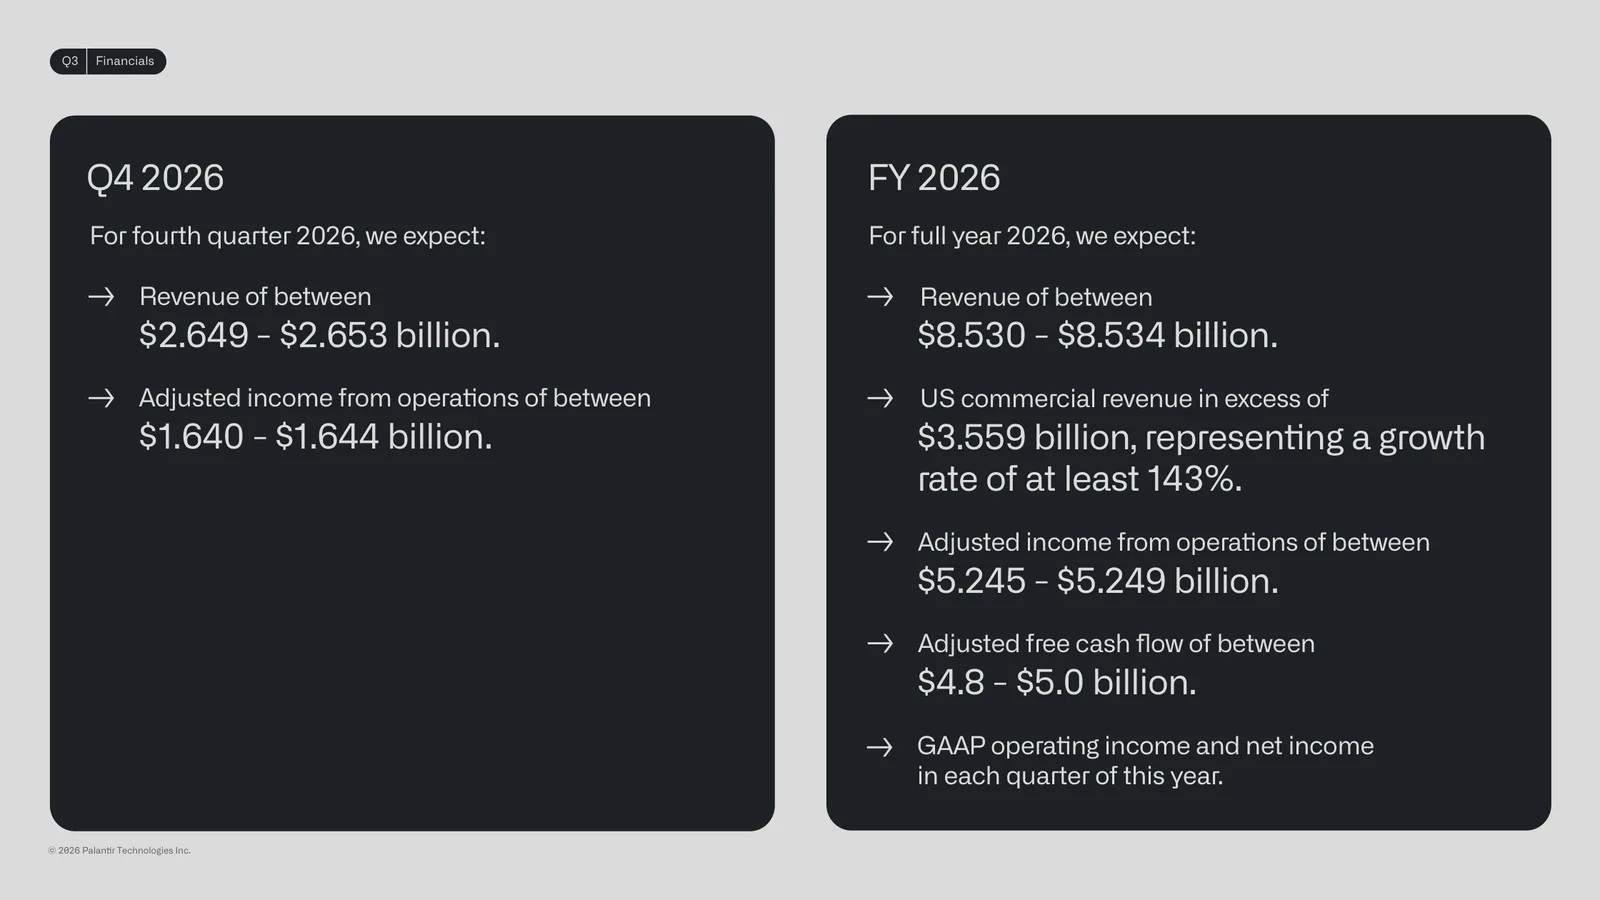
Company disclosure (Q3 2026 deck slide 25 and earnings release, November 2): Palantir guided fourth-quarter revenue of $2.649 billion to $2.653 billion and adjusted operating income of $1.640 billion to $1.644 billion. The $2.651 billion midpoint is 88.4% above the $1.4068 billion of a year earlier and 14.6% above the third quarter. For the full year it now expects revenue of $8.530 billion to $8.534 billion, up 91%, and US commercial revenue above $3.559 billion, up 143%.
The full-year revenue guide midpoint went from $7.190 billion in February to $7.656 billion in May, $8.154 billion in August and $8.532 billion in November, three raises worth +18.7% in total. Actual quarterly revenue beat the midpoint of the prior quarterly guide by 5.9% in the fourth quarter of 2025, then 6.4%, 7.6% and 7.0% in 2026. The adjusted operating income guide moved up with it, from $4.134 billion to $4.446 billion, $4.893 billion and $5.247 billion. If Palantir beats by the same margin again, fourth-quarter revenue would land near $2.8 billion.
Own calculation (four earnings releases): Subtracting first-to-third-quarter US commercial revenue of $2.343 billion from the $3.559 billion full-year floor leaves at least $1.216 billion for the fourth quarter, 23.6% more than the third. Management is guiding to another quarter of 20%-plus sequential US commercial growth right after the quarter in which US commercial bookings fell.
The Bull and Bear Case for Palantir Stock
The bull case is the pace of results. Revenue growth of 96% plus adjusted operating margin gives the company’s Rule of 40 score of 158%, and revenue has beaten the midpoint of its own guidance by 5.9% to 7.6% for four straight quarters. Net dollar retention of 165% means existing customers spent 65% more in a year, and Palantir holds $10.4 billion of cash and US Treasury securities with no debt. US commercial passing US government also spreads revenue across corporate and defense budgets.
The bear case is the pace of bookings. TCV was 1.26 times revenue, the lowest in six quarters, US commercial RDV fell to 6.62 times quarterly US commercial revenue, and RPO declined. Price to sales of 58.9 is 2.4 times its 63-month median, a multiple that assumes revenue keeps growing fast next year, yet the contracts that would become that revenue stopped growing in the third quarter. US commercial TCV fell -31.4% from the second quarter, and quarterly growth in US commercial customers slowed two quarters running.
From Direct Listing to GAAP Profits
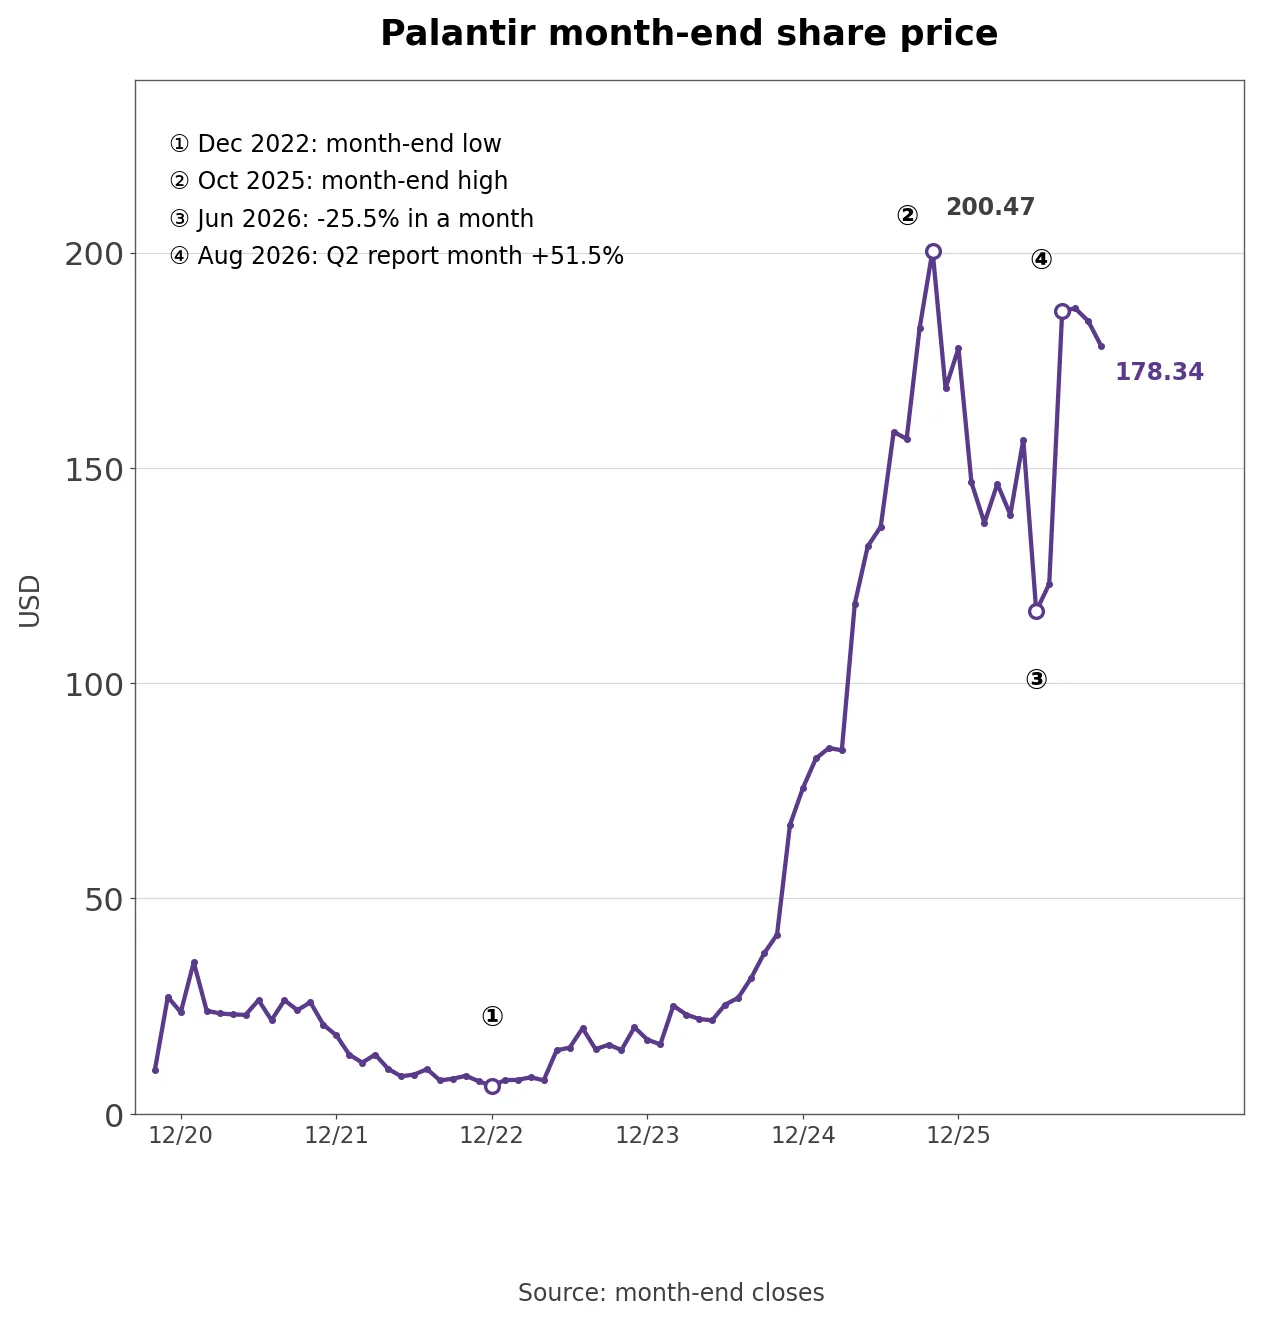
Palantir month-end share price over 74 months with four dates
Palantir went public through a direct listing on the New York Stock Exchange at the end of September 2020 and closed its first month at $10.13. The shares fell -22.7% in 2021 and -64.7% in 2022, reaching a month-end low of $6.42 in December 2022. After the company launched AIP in 2023 and began reporting GAAP profits every quarter, the stock rose +167.4% in 2023, 340.5% in 2024 and 135.0% in 2025. The highest month-end close was $200.47 in October 2025.
The stock is up only 0.3% so far in 2026, with wide swings inside the year: it fell -25.5% in June and rose +51.5% in August, the month second-quarter results came out. Quarterly diluted EPS grew from $0.01 in the first quarter of 2023 to $0.44 in the third quarter of 2026, and annual revenue went from $1.542 billion in 2021 to a 2026 guide of $8.532 billion.
The growth rate turned before the stock did. Annual revenue growth slowed to 23.6% in 2022 and 16.7% in 2023, then picked up to 28.8% in 2024 and 56.2% in 2025 once AIP reached revenue, and the 2026 guide implies 90.6%. Until 2023 Palantir was mostly a government contractor. From 2024 US companies drove its growth, and the stock began rising at that turn.
Revenue Against Contract Value Signed
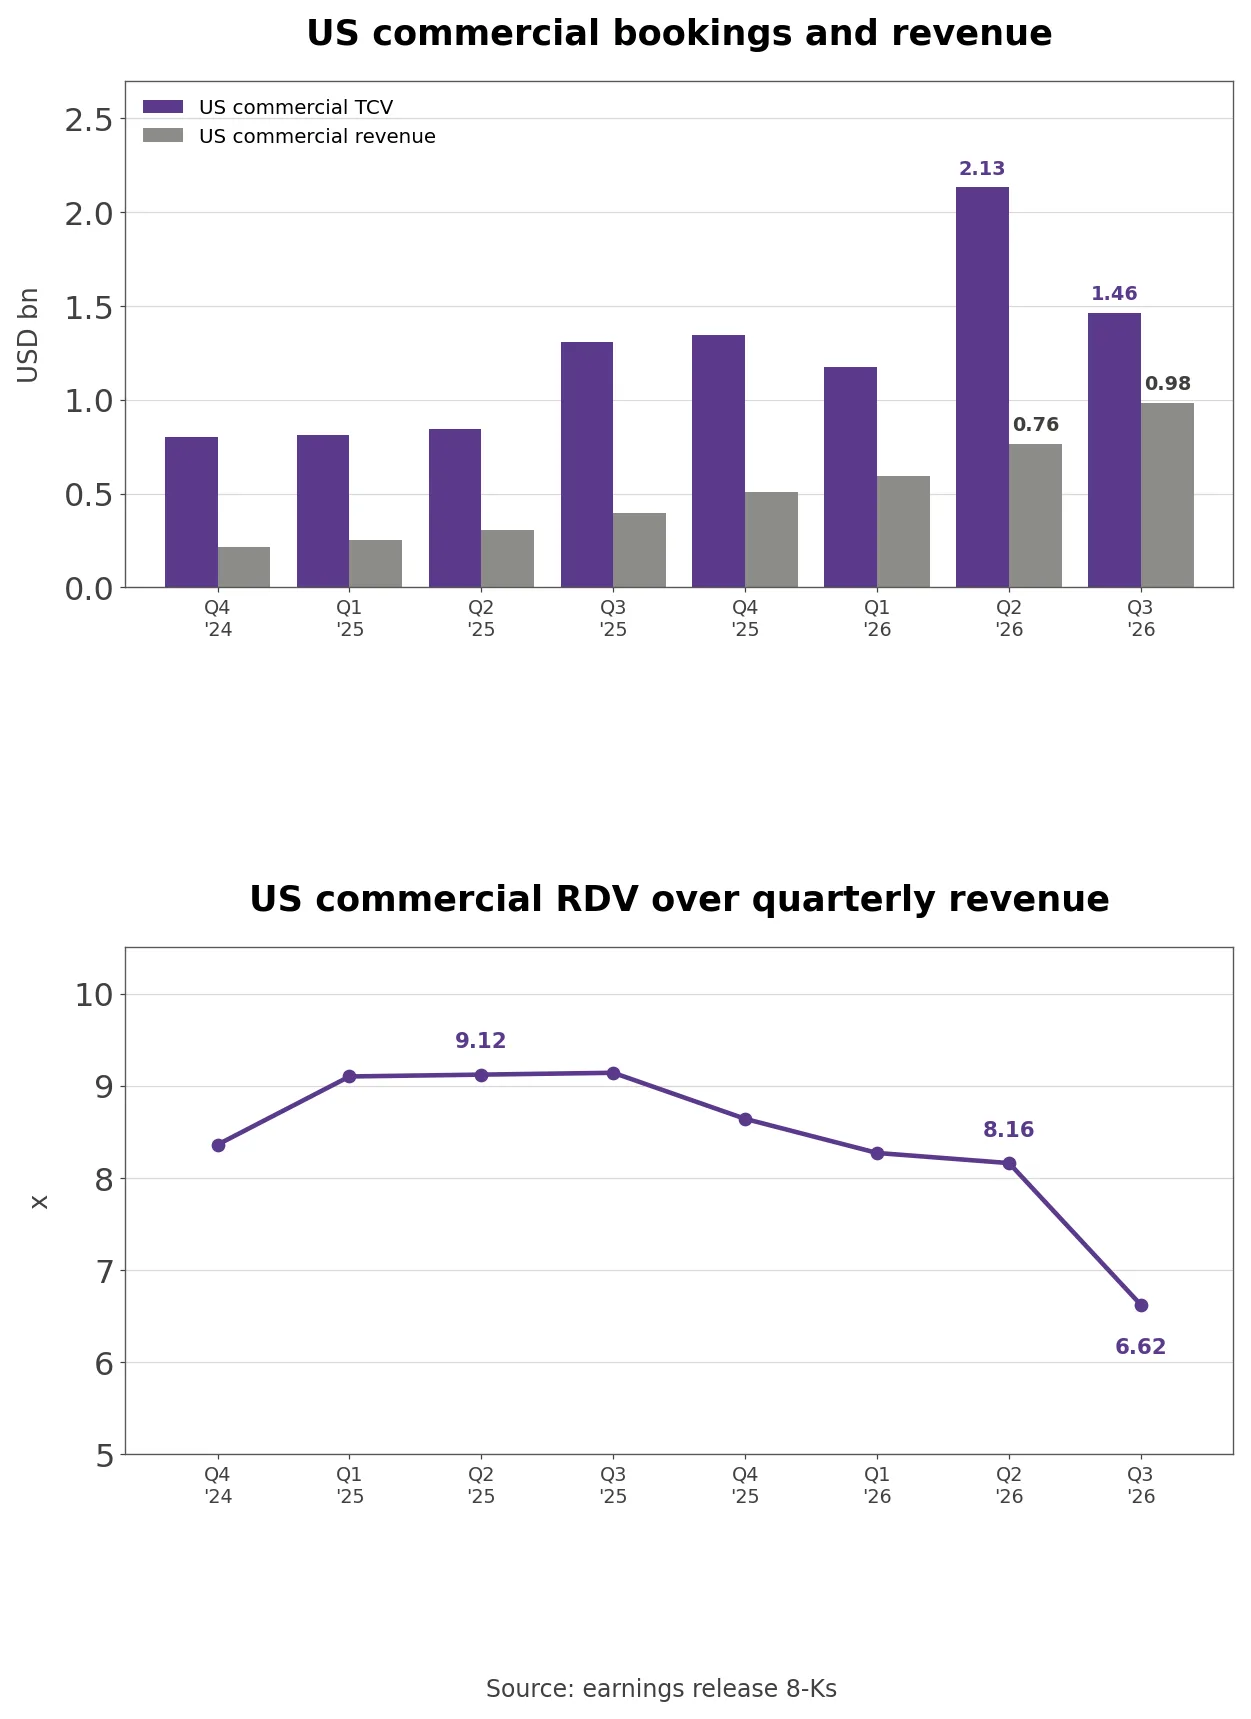
US commercial TCV against revenue and RDV coverage over eight quarters
Third-quarter TCV was $2.918 billion, up 6% from a year earlier and down -13.5% from the second quarter. TCV is the lifetime value of contracts signed in a quarter, so it swings and needs revenue beside it for scale. Total TCV divided by revenue was 2.26 times in the second quarter of 2025, 2.34 in the third and 3.03 in the fourth, then 1.48, 1.74 and 1.26 in 2026. For each dollar of revenue recognized, Palantir signed $1.26 of new contracts, the lowest of the six quarters.
The gap is wider in US commercial. US commercial TCV of $1.463 billion was up 11.7% from a year earlier but down 31.4% from $2.132 billion in the second quarter, and US commercial TCV divided by US commercial revenue fell from 3.75 times in the fourth quarter of 2024 to 1.49 times, the lowest of eight quarters. Deals of at least $1 million dropped from 220 to 212 and deals of at least $10 million from 73 to 64. Outside US commercial, government and international commercial TCV rose 17.2% from $1.241 billion to $1.455 billion, so the whole third-quarter decline came from US commercial.
TCV depends on a handful of large contracts. It hit a record $4.262 billion in the fourth quarter of 2025, fell to $2.410 billion the next quarter and rebounded to $3.373 billion in the second quarter. One weak quarter does not set a trend, which is why the backlog measure, RDV, matters.
What US Commercial Remaining Deal Value Shows
Unexplained change in US commercial RDV over seven quarters and remaining performance obligations over 12 quarters
RDV is the contract value left at quarter end, so it should roughly equal the prior quarter’s RDV plus new TCV minus the quarter’s revenue. Whatever is left over reflects cancellations, adjustments and excluded contracts.
Own calculation (eight quarterly earnings releases): Prior-quarter RDV of $6.238 billion plus third-quarter US commercial TCV of $1.463 billion minus US commercial revenue of $984 million gives $6.717 billion, but reported RDV was $6.517 billion, $200 million lower. The same gap from the first quarter of 2025 on was -$25 million, -$67 million, -$73 million, -$87 million, -$41 million and -$50 million, so the third quarter’s -$200 million is 2.3 times the previous largest.
Palantir does not break the gap down, but the definitions point somewhere. The release says RDV can exclude value from some commercial contracts after the company assesses customers’ financial condition, including their “ability and intention to pay.” The 10-Q adds that strategic commercial contracts signed with companies Palantir invested in total $326 million “with no remaining contractual options,” and that “some of our early-stage Investee customers filed for bankruptcy or terminated their contracts with us,” without saying when or for how much. US commercial RDV growth also slowed from 144.7% in the fourth quarter of 2025, 112.1% and 123.6% to 79.5% in the third quarter, more than 68 percentage points below US commercial revenue growth for the first time.
US commercial RDV was about 9.1 times quarterly US commercial revenue in the first three quarters of 2025 and 6.62 times in the third quarter of 2026. RDV rose $279 million from the second quarter while quarterly US commercial revenue rose $220 million, so at this pace the backlog covers fewer quarters each time. Third-quarter RDV divided by the implied fourth-quarter US commercial revenue of $1.216 billion is 5.36 times.
How Palantir Sells Software to Governments and Companies
Palantir sells four products: Foundry for data integration and analytics, Gotham for defense and intelligence agencies, AIP, which adds generative AI on top of both, and Apollo, which deploys all three in any environment. Customers pay for software access and deployment support, and third-quarter gross margin was 83.4%. Most contracts run several years, but because many customers can cancel for convenience, non-cancellable RPO of $4.88 billion is smaller even than US commercial RDV of $6.517 billion.
The sales model is unusual. The 10-Q says Palantir runs pilots and bootcamps with customers “generally at our own expense and without a guarantee of future returns,” and manages customers account by account rather than by industry. Small first contracts spread across departments, which is why revenue per customer grew 87.9% while customer count grew 29%. Over nine months government was 51% of revenue and commercial 49%, and US customers were 81%.
Government work carries its own risks. The 10-Q says the US federal government cannot exercise contract options more than a year in advance, that Palantir has not always realized the full value of its contracts, and lists the federal shutdown in the fourth quarter of 2025 among its risks. That matters because TCV and RDV assume every option is exercised.
Third-quarter revenue split almost evenly between commercial at $1.17 billion, up 113%, and government at $1.15 billion, up 81%. US revenue of $1.94 billion, up +119%, was 84% of the total, while international revenue of $376.4 million grew 26.3%. US commercial is now 42.5% of revenue, and US government revenue accelerated to 96% growth, so commercial is not carrying the company alone. The deck’s examples follow the same lines: the US Army gave Palantir a prime contract to produce eight TITAN AI ground stations, the Federal Aviation Administration uses AIP to bring safety systems onto one screen, and Nvidia puts supply chain data into the ontology to train its own models.
Third-quarter GAAP operating margin was 46.9% and adjusted operating margin, which excludes stock-based compensation, was 61.7%. Most of the gap is $319 million of stock compensation, 13.8% of revenue, up from $172 million a year earlier but shrinking as a share of sales. Net income was $1.128 billion, helped by $89 million of interest income, and the diluted share count of 2.574 billion was roughly flat. Buybacks were $1.5 million over nine months, so earnings growth, not repurchases, is offsetting the dilution from stock pay.
Palantir vs ServiceNow Snowflake and Datadog
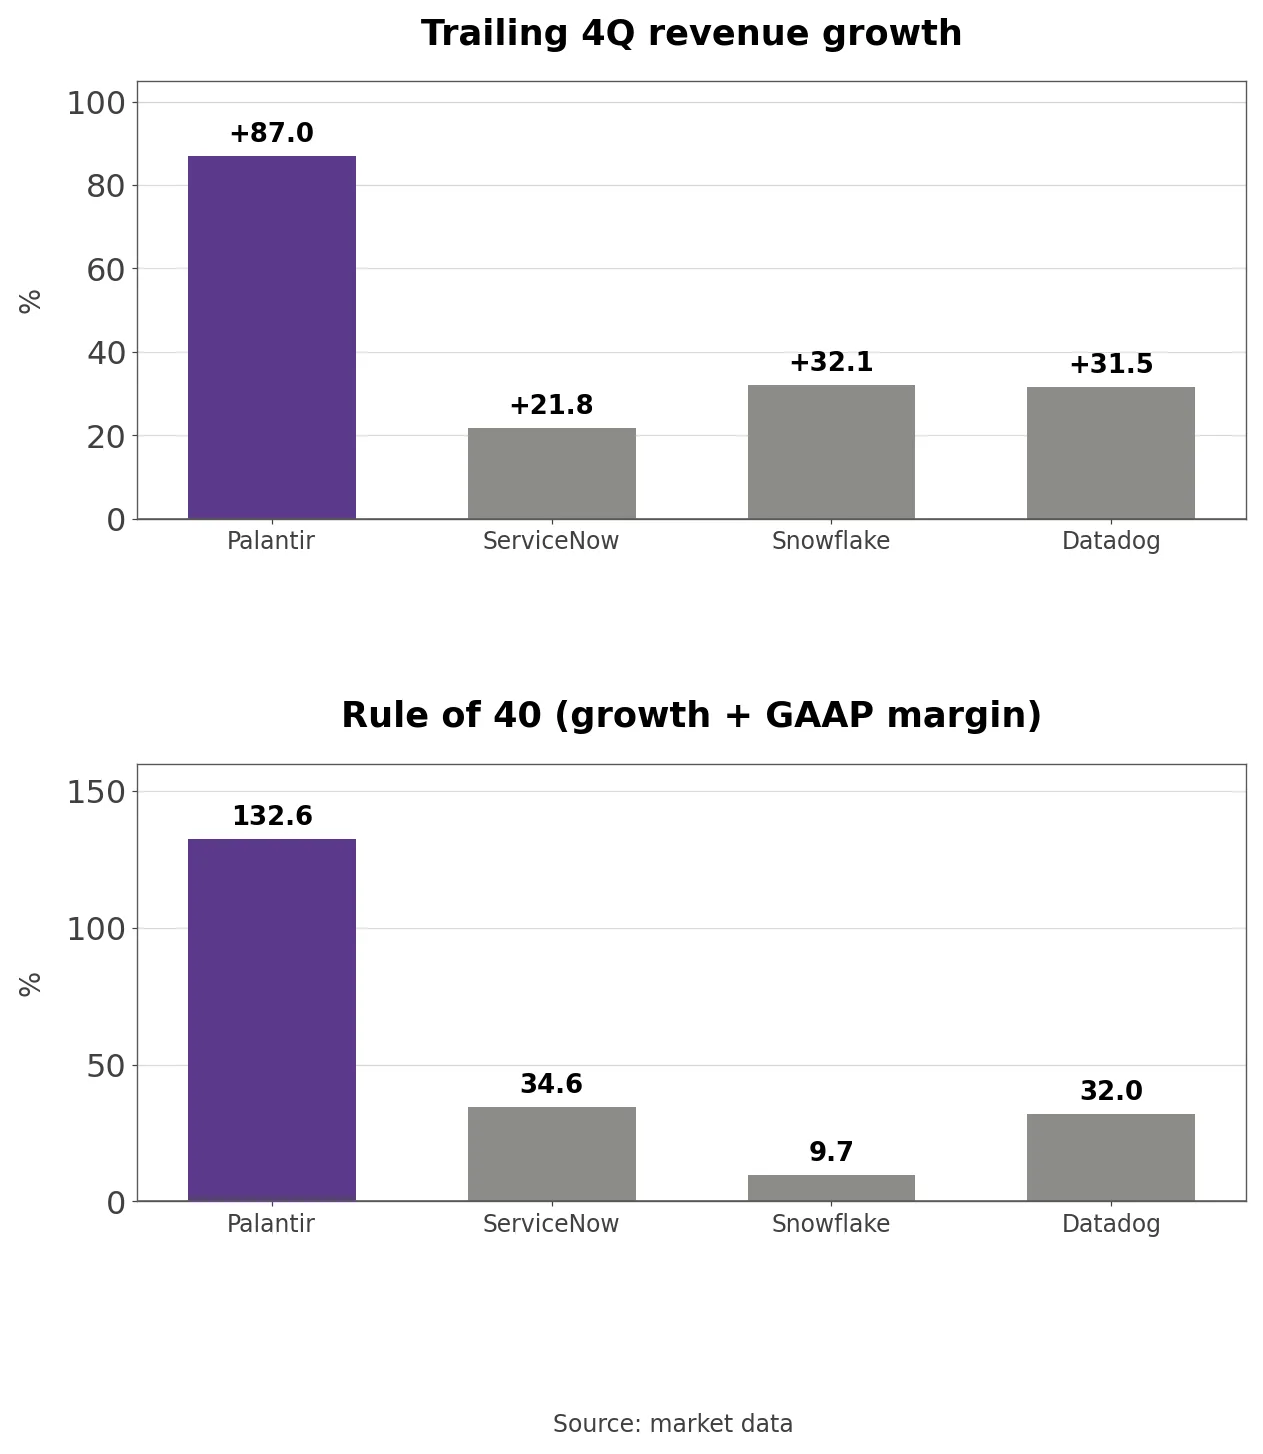
Trailing revenue growth and Rule of 40 at Palantir ServiceNow Snowflake and Datadog
Trailing four-quarter revenue growth was +87.0% at Palantir against 21.8% at ServiceNow, 32.1% at Snowflake and 31.5% at Datadog. Revenue growth plus trailing GAAP operating margin gives 132.6 for Palantir, 34.6 for ServiceNow, 32.0 for Datadog and 9.7 for Snowflake. Trailing gross margin is also highest at Palantir, 84.76% against 79.55% at Datadog, 73.08% at ServiceNow and 67.03% at Snowflake. None of the three peers combines the fastest growth with the highest margin. Peer figures run through September for ServiceNow, July for Snowflake and June for Datadog.
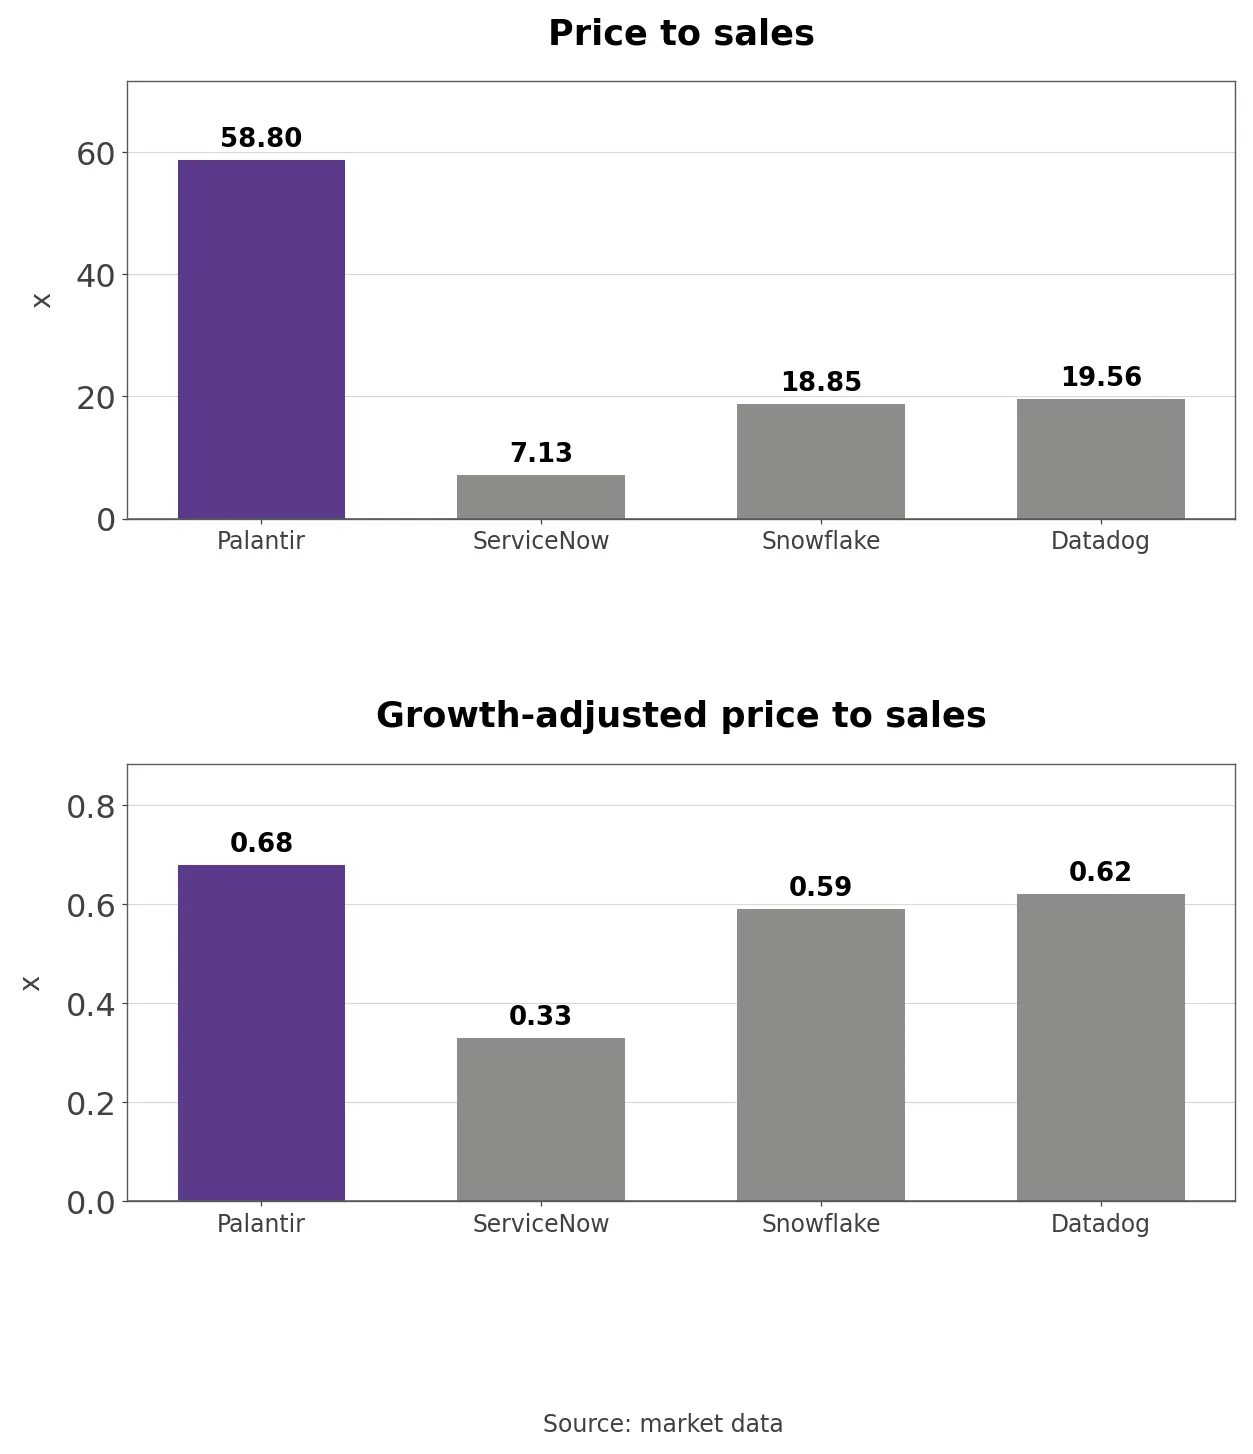
Price to sales and growth-adjusted price to sales at Palantir ServiceNow Snowflake and Datadog
Price to sales on market data is 58.8 for Palantir, 7.13 for ServiceNow, 18.85 for Snowflake and 19.56 for Datadog. Forward P/E is 80.91 for Palantir, above ServiceNow’s 23.35 and close to Datadog’s 81.49, while Snowflake has no trailing P/E because it is still unprofitable on a GAAP basis. Palantir’s $428.6 billion market value is 3.9 times ServiceNow’s even though its trailing revenue of $7.288 billion is less than half of ServiceNow’s $15.431 billion.
Dividing price to sales by trailing revenue growth gives 0.68 for Palantir, close to 0.59 for Snowflake and 0.62 for Datadog and about twice ServiceNow’s 0.33. On that measure the multiple is priced in line with growth, provided the growth holds, and the bookings figures above are what puts that in doubt. Dilution is modest too: Palantir’s share count rose about 0.7% over the year on market data, against 3.43% at Snowflake and 1.66% at Datadog, while ServiceNow’s fell 0.64%.
The Price-to-Sales and P/E Band
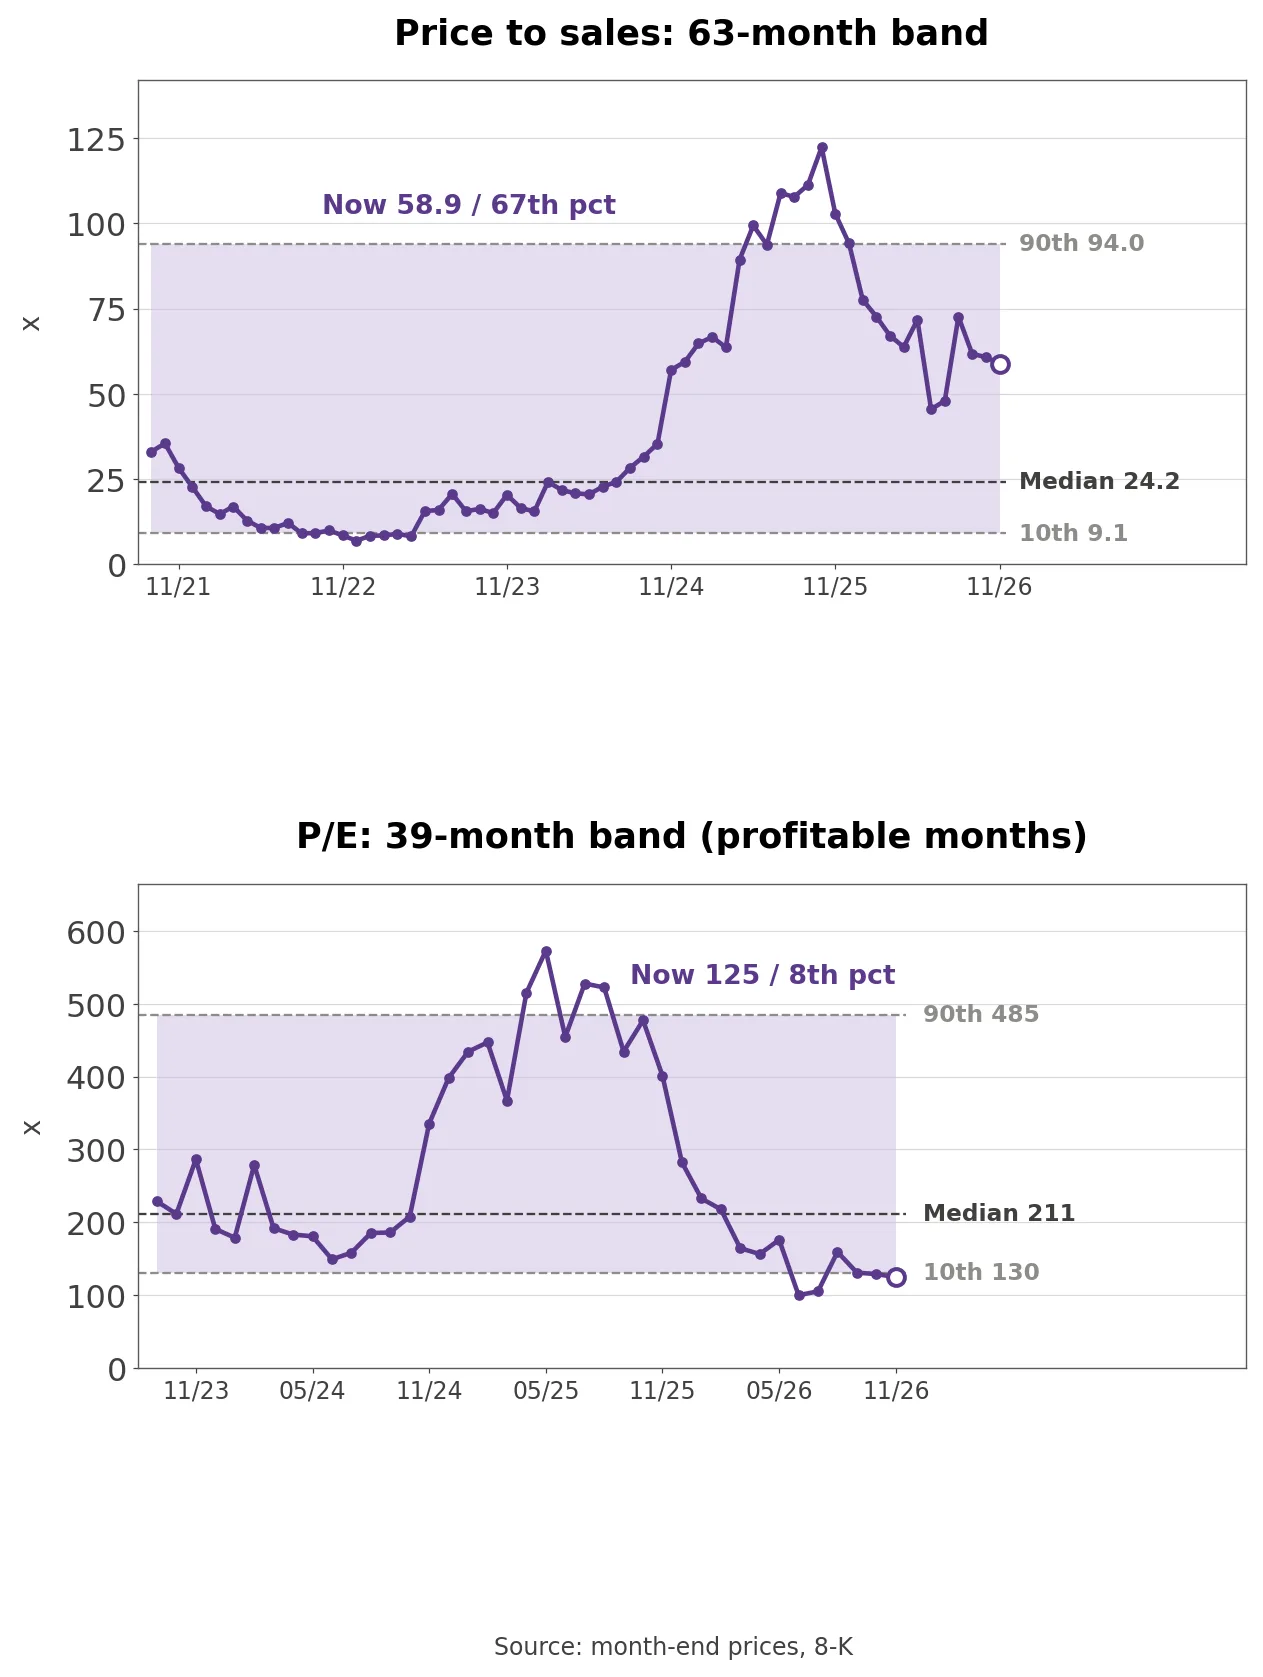
Palantir price to sales over 63 months and P/E over 39 months
Own calculation (month-end closes, earnings releases and 10-Q): Market value divided by trailing revenue of $7.288 billion gives price to sales of 58.87, 2.4 times the 63-month median of 24.21 since September 2021, with 66.7% of months lower than now. The high was 122.31 in October 2025 and the low 6.95 in December 2022.
The trailing P/E sits at the other end. At trailing diluted EPS of $1.43 it is 124.71, below the 211.43 median of the 39 profitable months since September 2023, and only 7.7% of those months were lower. Earnings have grown faster than the stock, so the P/E is near its low since Palantir turned profitable while price to sales is still more than twice its median. Margin explains the difference: quarterly GAAP operating margin rose from 33.3% a year earlier to 46.9%.
Three Conditions That Move the Stock
TCV relative to revenue is the first. If fourth-quarter TCV returns to more than twice revenue, as in the fourth quarter of 2025 at 3.03 times, the third quarter looks like a temporary gap, which would support the shares; TCV stuck near 1.3 times revenue would confirm a shrinking backlog and weigh on them.
The US commercial guide is the second. It implies at least $1.216 billion in the fourth quarter. Another beat of around 6% would mean revenue is covering for slower bookings and would support the stock; a smaller beat, or a first 2027 guide with US commercial growth below half the 115% in the first 2026 guide, would weigh on it.
RPO is the third. If total RPO grows again from $4.88 billion and long-term RPO recovers, non-cancellable contracts are building again, which would support the shares; a second straight decline would suggest that 165% net dollar retention is drawing down existing contracts, which would weigh on them.
Can Q4 TCV Get Back Above Twice Revenue?
Fourth-quarter results usually arrive in early February, together with the first full-year guide for 2027. The numbers to check are total and US commercial TCV, US commercial RDV and its coverage of revenue, and total and long-term RPO in the deck. Palantir’s first 2026 guide was 60.7% above 2025 revenue, so the growth rate in the first 2027 guide will show whether the bookings slowdown is temporary. The same report should show whether the company explains the third-quarter RDV gap and whether quarterly US commercial customer growth drops below 5%.
The open question is what the unexplained $200 million of RDV was, cancelled contracts or value removed after a credit review, and whether fourth-quarter TCV can get back above twice revenue and restore coverage.