AppLovin Corporation (NASDAQ: APP) reported third-quarter 2026 revenue of $2.18 billion, up +55% from a year earlier and $99.8 million above the top of the guidance range it gave in August. The stock rose +31.0% the next day. One quarter earlier revenue had landed $21.3 million below the top of guidance, and the stock fell -19.7% the day after that report. Of the 16 quarters with reported results, revenue missed the top of guidance only once, in the second quarter of 2026, and the average beat over the top end was 4.26%.
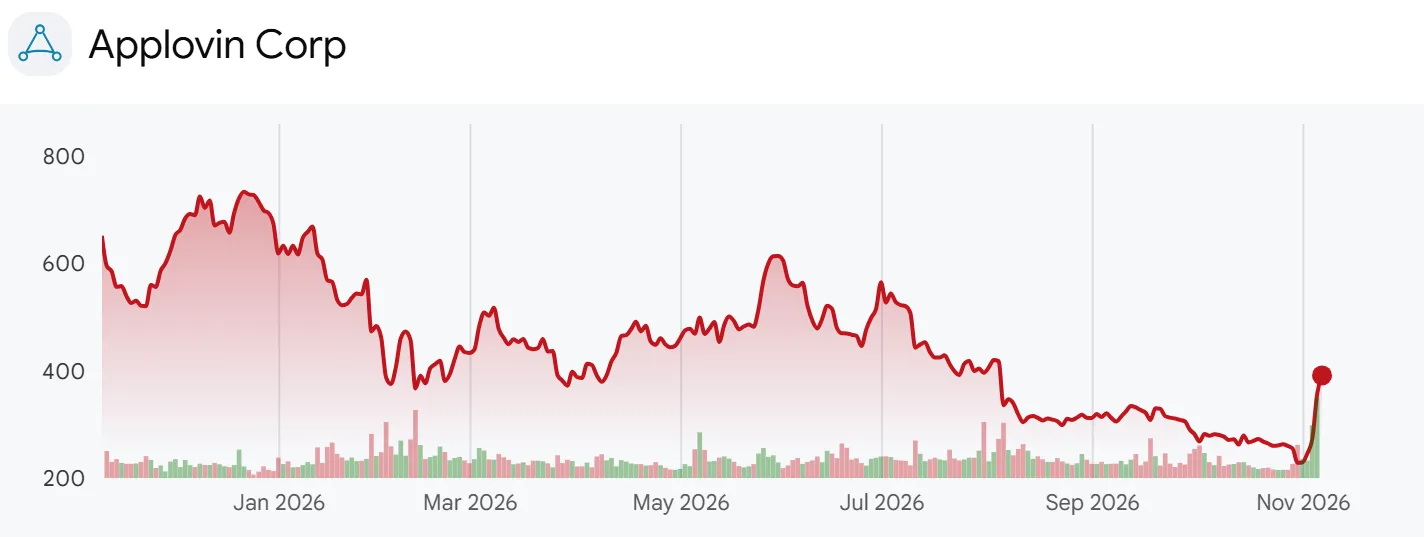
AppLovin one-year share price chart ending near 391 dollars
AppLovin is a Palo Alto mobile advertising company. It places ads from game studios and online shops into the ad slots of mobile games, and it books as revenue what advertisers pay minus what it passes on to app publishers. The company was incorporated in Delaware in July 2011, listed on Nasdaq in April 2021, and is led by co-founder Adam Foroughi as CEO and chairperson. At $391.22 a share and 331.32 million Class A and Class B shares, the market value is about $129.6 billion.
I compared the Q3 2026 10-Q, the earnings release, the eight-page Q3 financial update and the November 4 call transcript with every next-quarter guidance range in 17 earnings releases and shareholder letters since November 2022. Two limits matter. AppLovin does not split revenue between gaming and consumer advertisers, so the mix rests on management comments. Guidance through Q4 2024 covered total revenue including the apps business, while guidance from Q1 2025 covers advertising alone.
Twelve Quarters of Revenue and Net Income in the IR Update
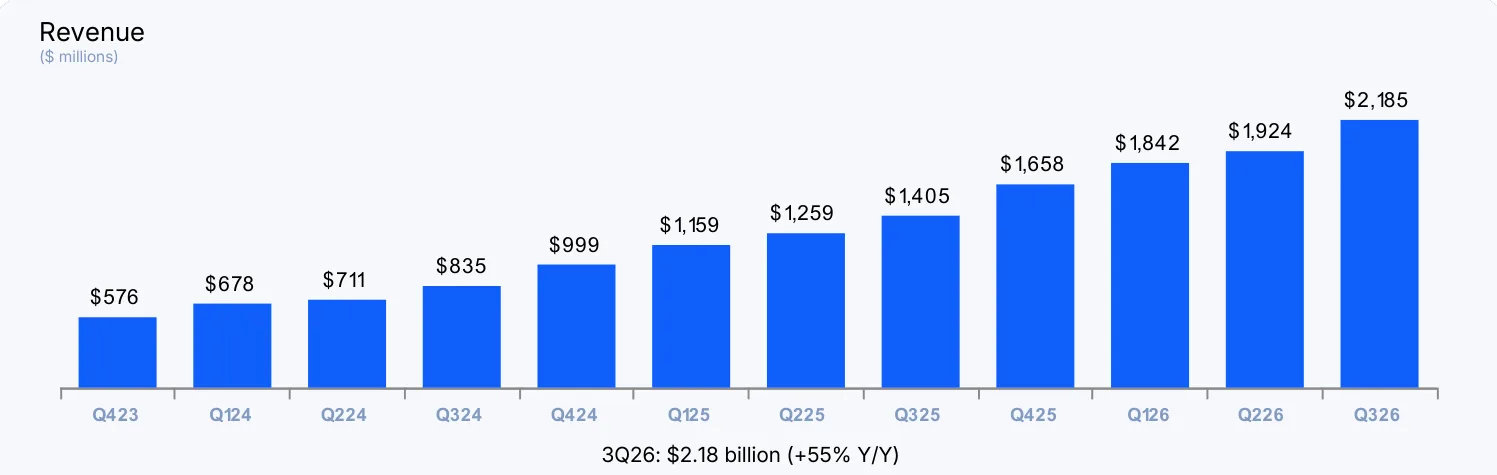
Q3 2026 financial update page 2 with 12 quarters of revenue up to 2185 million dollars
AppLovin does not publish a slide presentation with results. It posts an eight-page financial update: a cover, one page with four charts, then financial statements and reconciliations. The first chart stacks 12 quarters of revenue from $576 million in Q4 2023 to $2,185 million in Q3 2026 under the caption “3Q26: $2.18 billion (+55% Y/Y)”. None of the 12 bars is lower than the one before it.
These bars are restated for continuing operations. The Q4 2024 bar shows $999 million, but the total revenue AppLovin reported for that quarter at the time, including apps, was $1,372.8 million. The $373.3 million gap is the game business that now belongs to Tripledot, so the chart should not be read against the numbers announced in 2024.
The sequential dollar increase tells a different story from the bars. Revenue rose $252.9 million in Q4 2025, $184.5 million in Q1 2026, $81.2 million in Q2 and $261.1 million in Q3. The Q3 step is what Foroughi called “the largest sequential dollar step-up in revenue”, and the Q2 step was the smallest since Q2 2024. Year-over-year growth slowed for four straight quarters, from +77.0% in Q2 2025 to +52.8% in Q2 2026, before turning up to +55.5%. On the second-quarter call management explained: “This quarter came down to timing. Our pace of meaningful model improvement was lighter than normal during the quarter”.
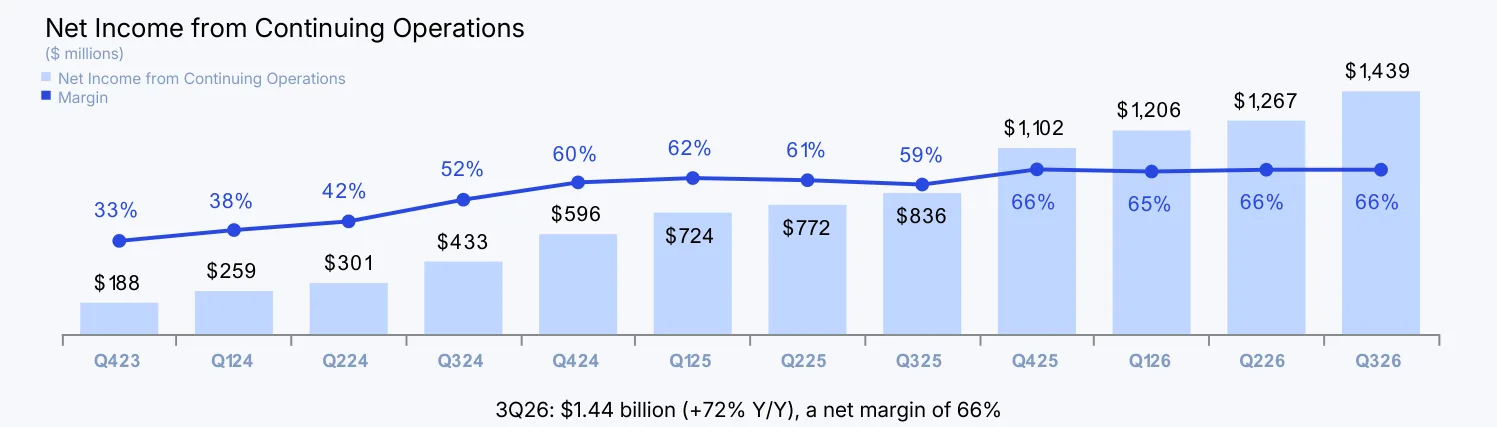
Q3 2026 financial update page 2 with net income from continuing operations and a 66 percent margin
The second chart shows net income from continuing operations of $1,439 million in Q3, up +72%, with a 66% margin for the fourth quarter in a row. This bar is also restated: the Q1 2025 bar of $724 million is $147.1 million higher than total net income that quarter because it leaves out losses in the divested apps business.
Filing footnote (Q3 10-Q, management discussion): Other income was $86.0 million in Q3 against a $6.6 million loss a year earlier. It includes a $46.9 million fair value gain on non-marketable equity securities and $15.9 million of additional interest income from a larger cash balance.
Operating income alone rose +58.4% to $1,709.0 million, a 78.2% operating margin. The 66% net margin is that operating margin after a 17.5% effective tax rate, plus a small lift from the equity gain.
EBITDA Margin and Operating Cash Flow Against Share Count
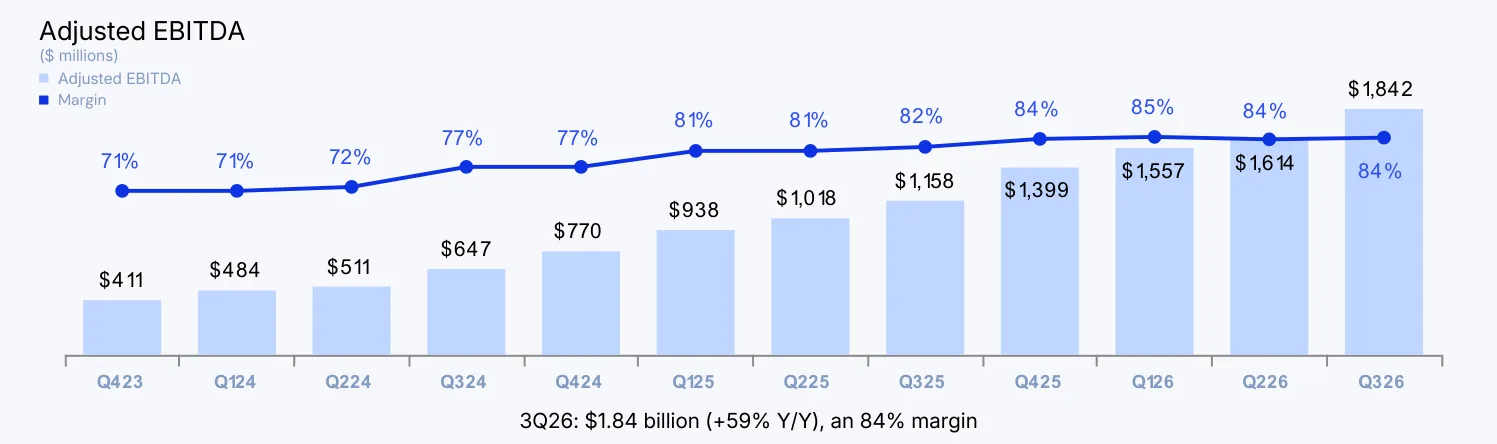
Q3 2026 financial update page 2 with adjusted EBITDA of 1842 million dollars and an 84 percent margin
The third chart puts adjusted EBITDA at $1,842 million, up +59%, with an 84% margin. The margin line climbed from 71% in Q4 2023 to 84% in Q4 2025 and then flattened at 85%, 84% and 84%. CFO Matt Stumpf said, “We manage this business to EBITDA dollars and free cash flow rather than to a margin percentage”, and put quarter-over-quarter flow-through to adjusted EBITDA at 87%. The release numbers agree: revenue grew $261.1 million from Q2 to Q3 and adjusted EBITDA grew $228.4 million, or 87.5%.
From the Q3 release reconciliation, the 6.1-point gap between the 84.3% adjusted EBITDA margin and the 78.2% GAAP operating margin breaks down into 3.85 points of stock-based compensation, 1.56 points of amortization and 0.71 points of transaction costs. A year ago the gap was 5.6 points, with stock-based pay at 2.40 points.
Stock-based compensation was $84.2 million in Q3, 2.5 times the $33.8 million of a year earlier, so the flat margin hides a larger share of costs that adjusted EBITDA leaves out.
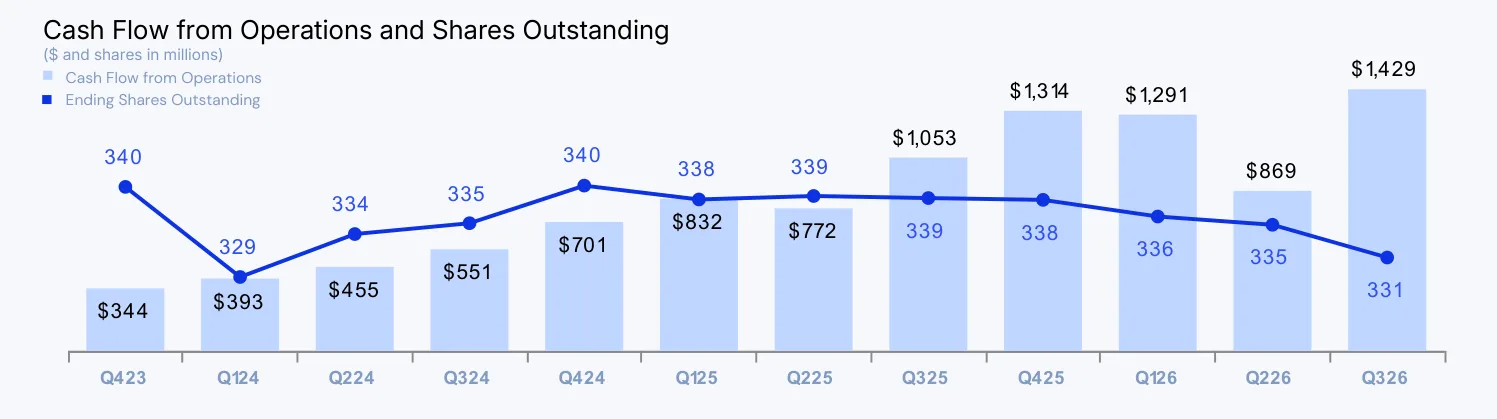
Q3 2026 financial update page 2 with operating cash flow and shares outstanding falling to 331 million
The fourth chart overlays operating cash flow bars and the quarter-end share count. Operating cash flow went from $1,314 million in Q4 2025 and $1,291 million in Q1 2026 to $869 million in Q2 and back to $1,429 million in Q3. The share line fell from 340 million in Q4 2023 to 331 million. Free cash flow is operating cash flow minus capital spending and finance lease payments, and in Q3 that difference was only $10.4 million.
The Q2 dip came from tax timing rather than operations. Splitting the 10-Q year-to-date cash flow into quarters, cash taxes paid were $533.1 million in Q2 against $106.7 million in Q1. On the first-quarter call Stumpf said cash tax payments are weighted toward the second and third quarters. What the chart does not show is that the tax bill itself has grown. Stumpf also said the weighted average diluted share count has declined for eight consecutive quarters, and the release shows 334.8 million diluted shares in Q3 against 341.0 million a year earlier, -1.82%.
The Bull and Bear Case for AppLovin Stock
The bull case is that model improvements are landing again, gaming grew close to 50%, and spending by consumer advertisers grew triple digits from a year earlier from a small base. Management targets roughly 30% annual growth over the long term, and Q4 guidance implies +42.6% to +44.5%. The bear case sits in the same numbers. Growth depends on when model gains land, so one late quarter means a miss, and a securities class action filed in September 2026 targets statements about exactly that pace of improvement. Cash taxes now keep free cash flow behind adjusted EBITDA, and founders hold two-thirds of the vote. The third quarter restored the beat; the other three issues remain.
From Mobile Games to a Pure Ad Platform
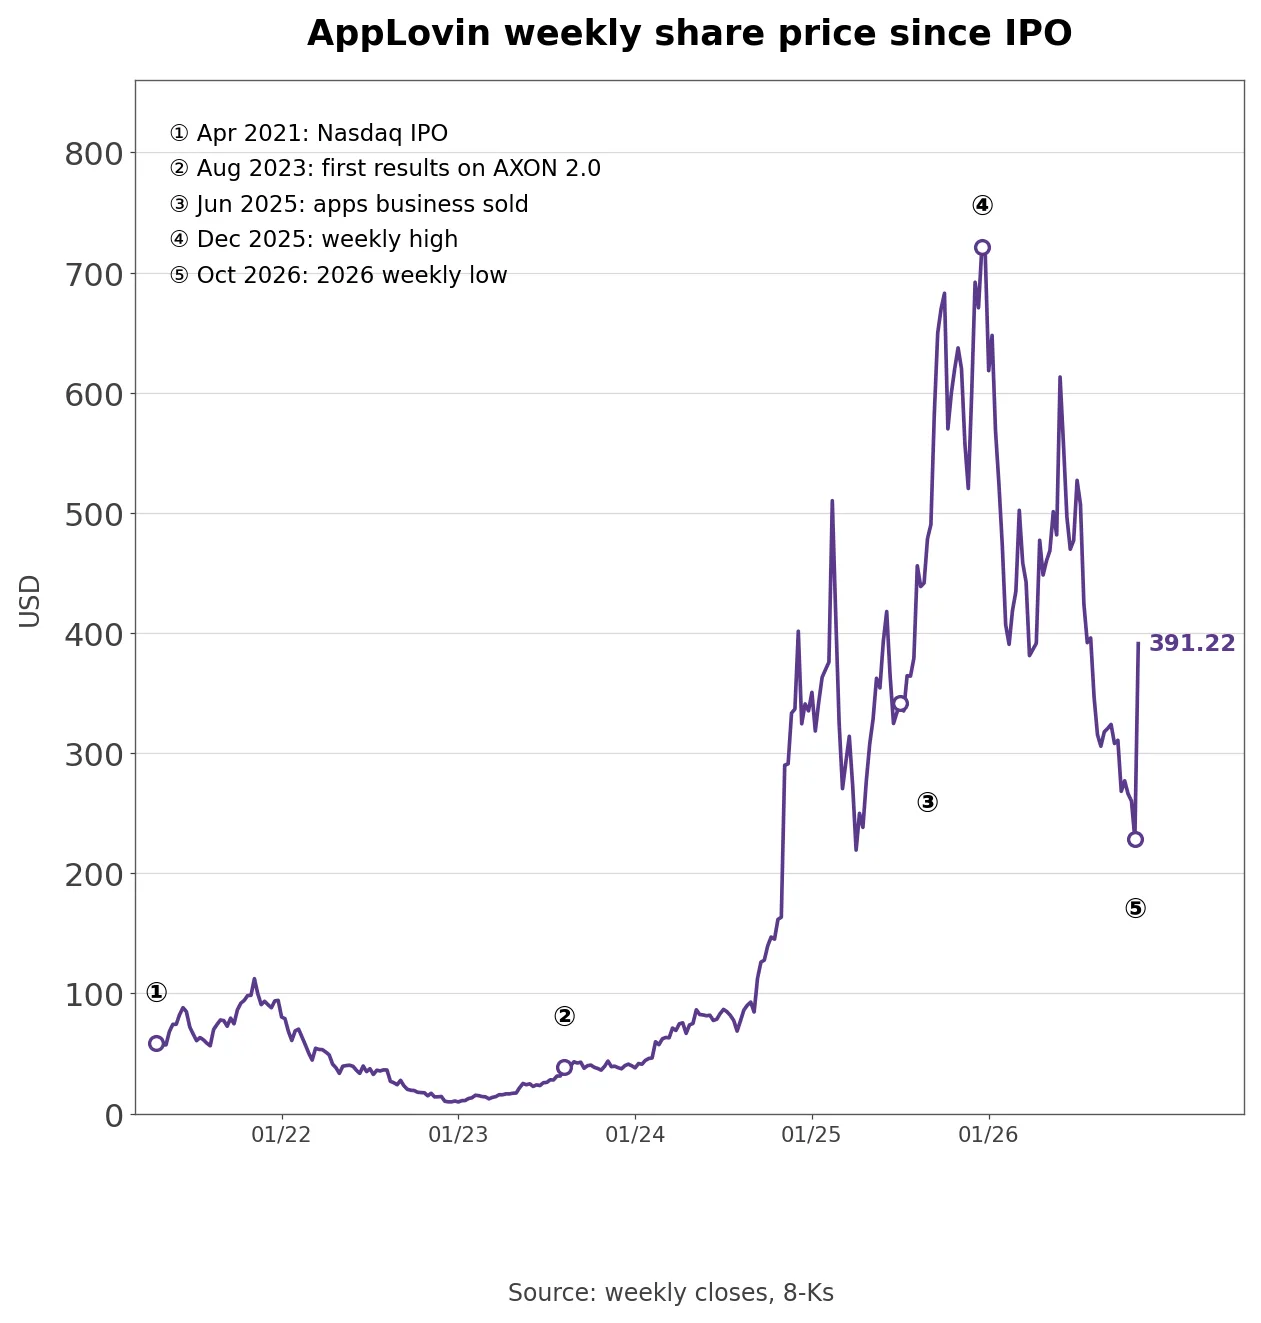
AppLovin weekly share price since the April 2021 IPO with five dates
At its April 2021 IPO, AppLovin ran mobile games it built or bought and sold its advertising software alongside them. The stock fell -88.8% in 2022 and closed the first week of January 2023 at $9.72.
The turn came with AXON 2.0, the ad recommendation engine rolled out in Q2 2023. The Q2 2023 shareholder letter said revenue, adjusted EBITDA and margin all beat the top of guidance and credited AXON 2.0, and Software Platform revenue rose 14% sequentially to $406 million. On June 30, 2025 AppLovin sold its apps business to Tripledot for $430.6 million in cash and about 22% of Tripledot’s shares, valued at $285.0 million, leaving a pure advertising company.
On March 27, 2025 the stock fell -20.1% in a day with no filing, the last day of the class period in the first securities class action filed that month. It reached a weekly high of $721.37 in December 2025, fell to $228.50 in the last week of October 2026, -68.3% from the high, and finished the week of the Q3 report at $391.22.
Sixteen Quarters Against the Top of Guidance
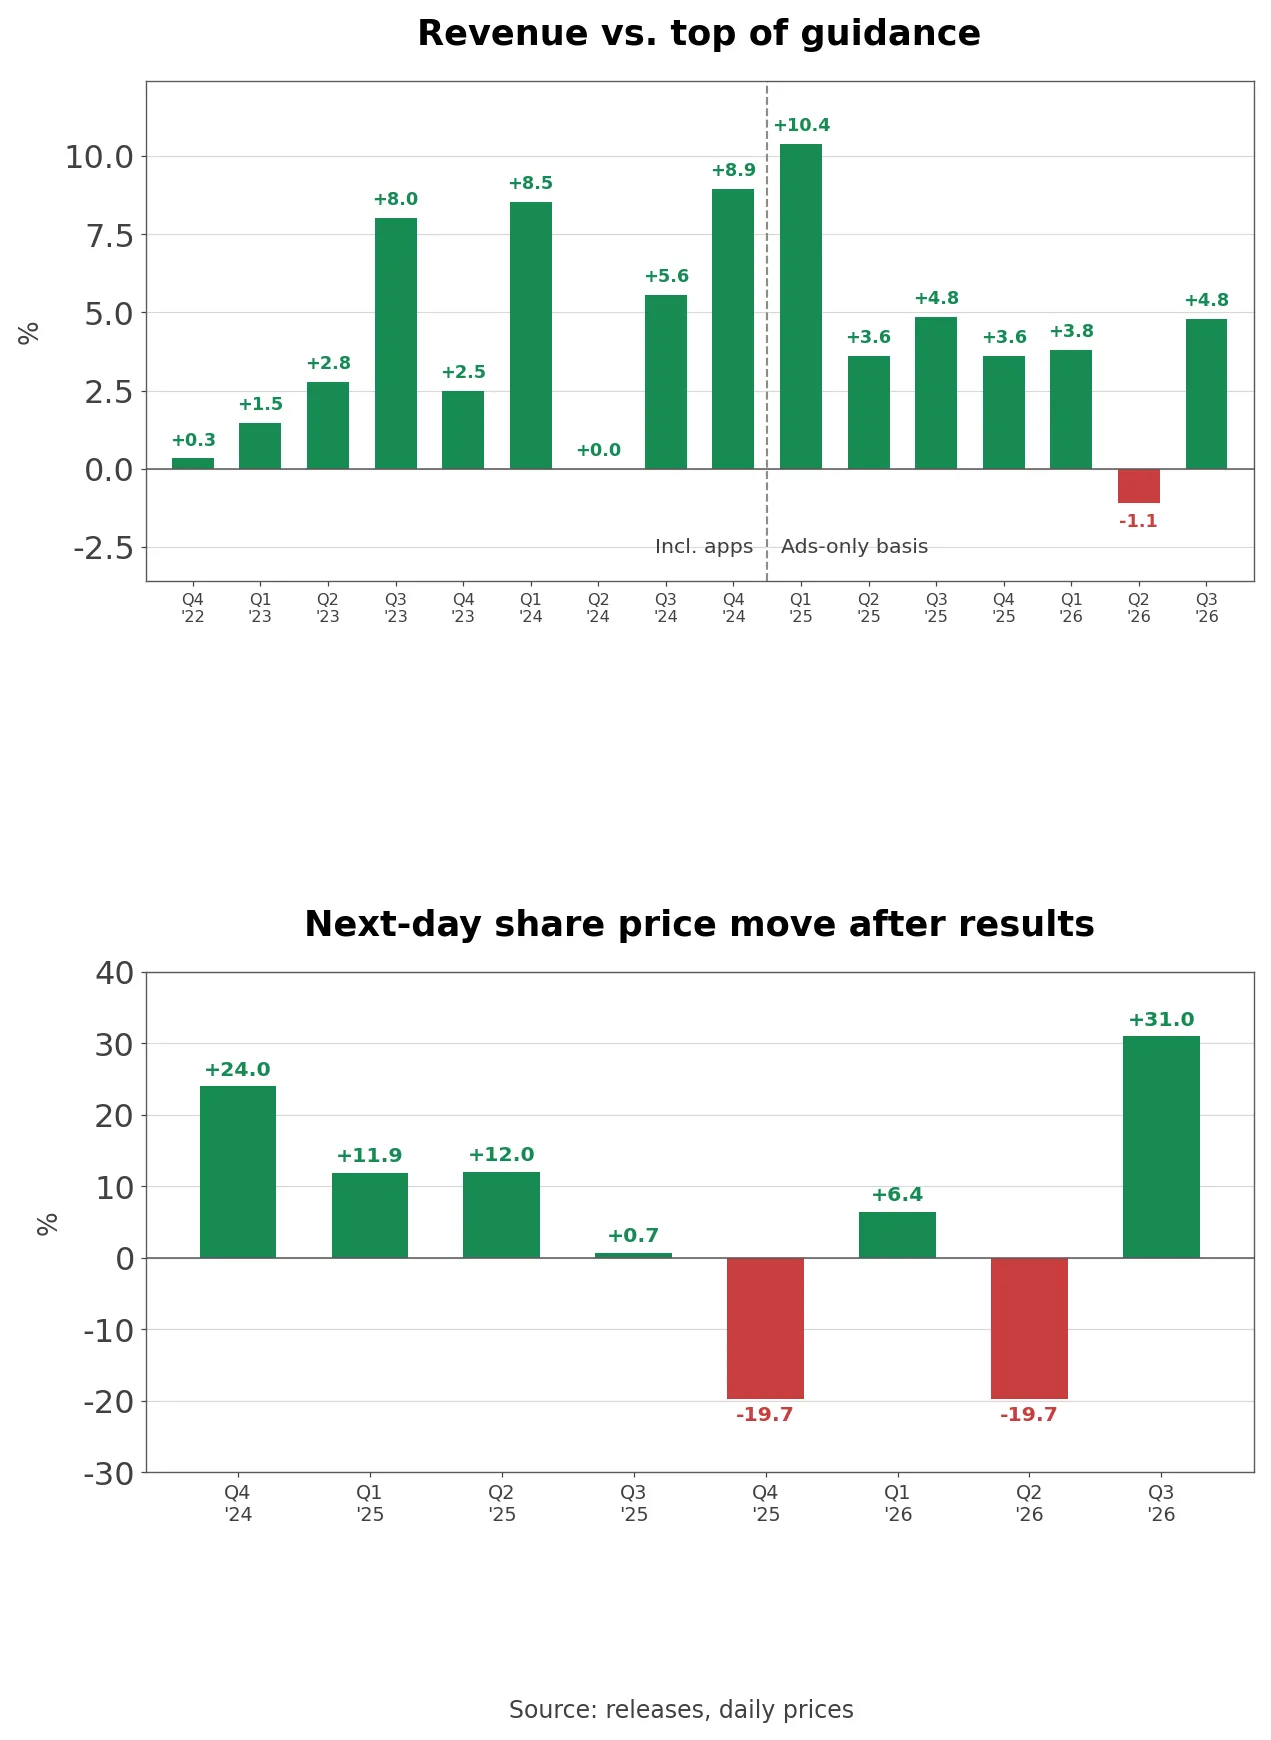
Revenue against the top of guidance over 16 quarters and the next-day share price move
Own calculation (17 earnings releases and shareholder letters, November 2022 to November 2026): I matched each release’s next-quarter revenue guidance with the revenue actually reported. Through Q4 2024 that means total revenue guidance against originally reported total revenue; from Q1 2025 it means advertising guidance against advertising revenue.
Of the 16 quarters with reported results, only Q2 2026 finished below the top of the range. The widest beat was Q1 2025 (+10.38%), the first guidance after the apps business was carved out, and Q2 2024 matched the top almost exactly (+0.01%). Q2 2026 came in at $1,923.7 million against a $1,945 million top, -1.1%, though still above the $1,915 million bottom. The Q3 beat of +4.79% is close to the 16-quarter average.
Company disclosure (Q3 2026 earnings call, Nov 4 2026): Foroughi opened the call with: “Both revenue and EBITDA came in well above the high end of our guidance. That’s the standard we’ve always run this business by”.
The record supports that. The market’s response does not line up with it. On daily closes, the stock rose +24.0% the day after the Q4 2024 report (top beaten by 8.95%), +0.7% after Q3 2025 (4.85%), and fell -19.7% after Q4 2025 (3.62%). The Q2 2026 miss produced the same -19.7%.
Fourth-quarter guidance is $2,365 million to $2,395 million, up 42.6% to 44.5% year over year. Beating the top by the 16-quarter average would mean about $2,497 million, but that is arithmetic on history, not a company forecast.
Cash Taxes and the Lower Conversion Rate
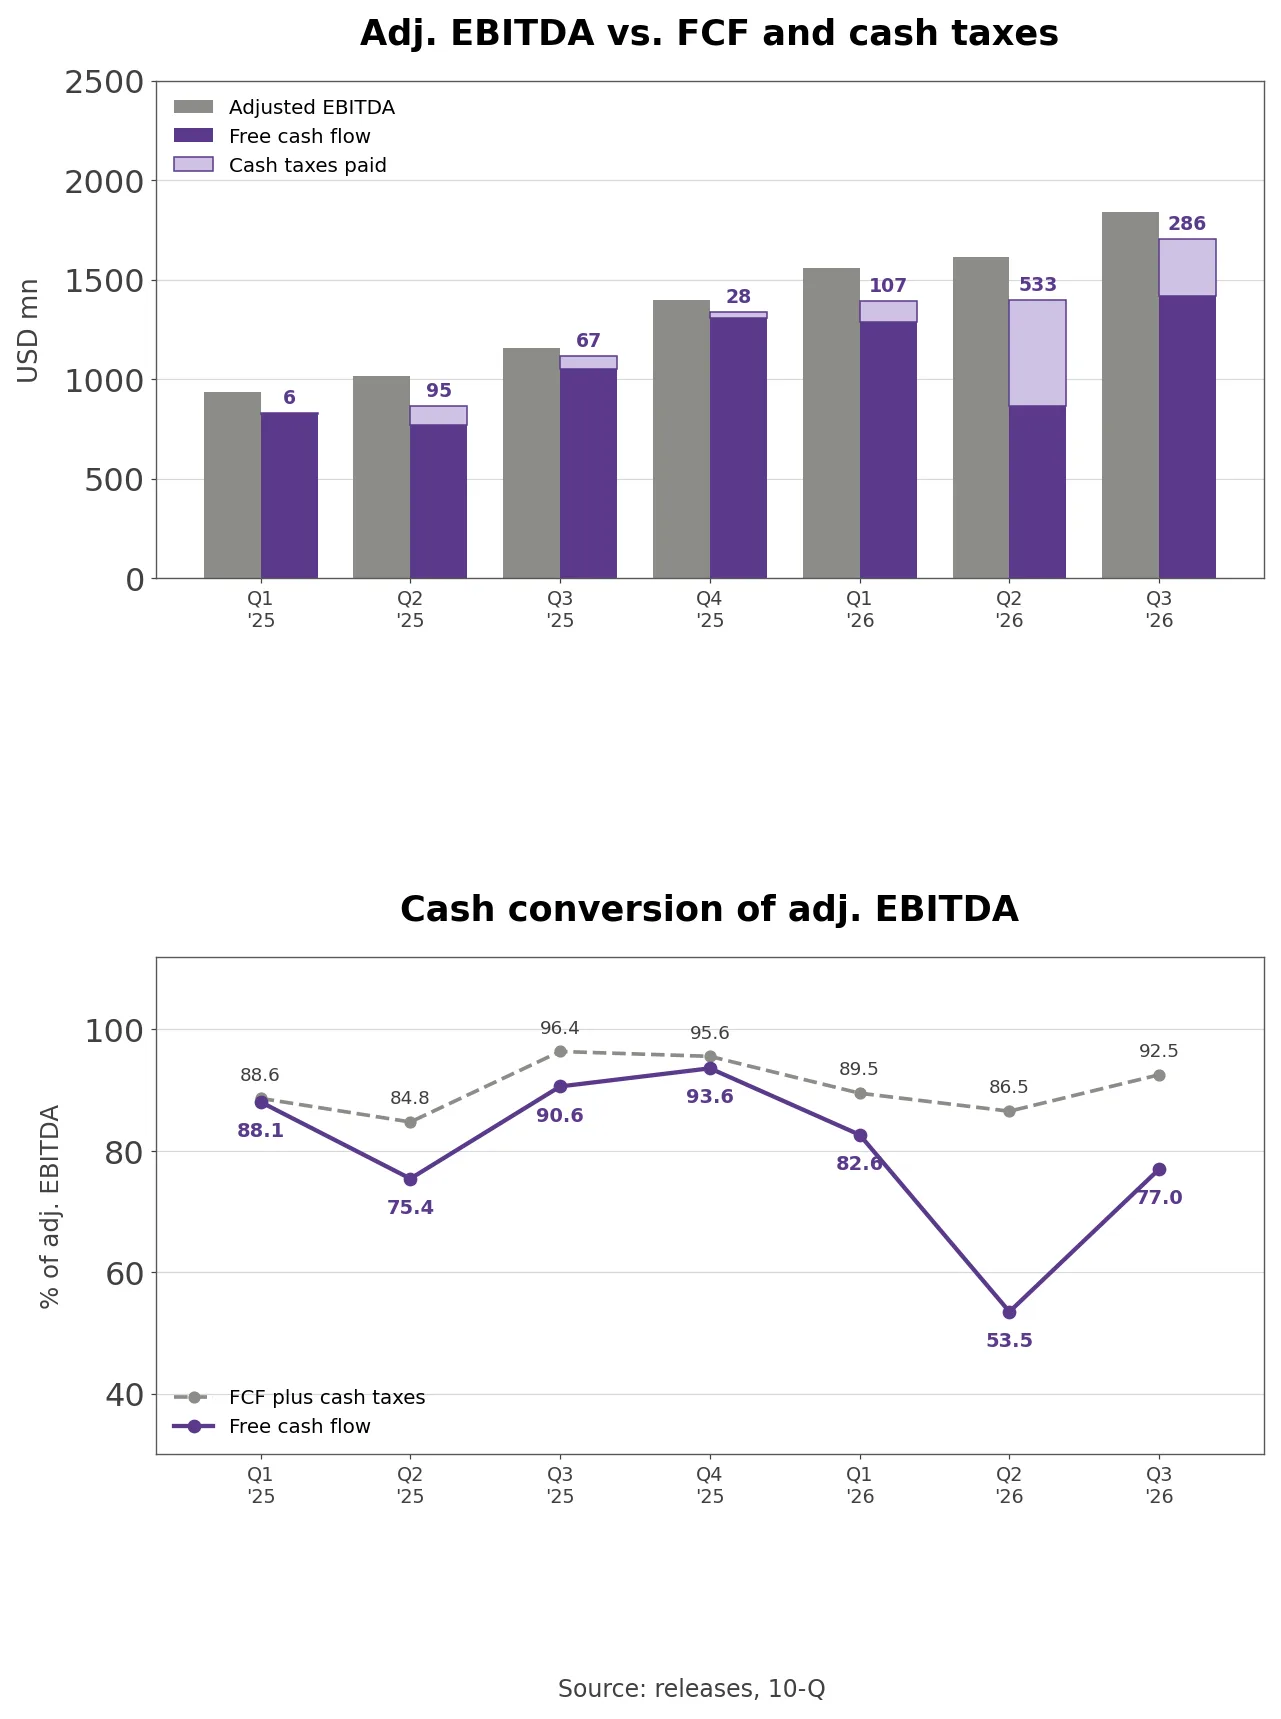
Adjusted EBITDA against free cash flow and cash taxes paid with cash conversion rates
Q3 free cash flow was $1,418.4 million, 77.0% of adjusted EBITDA. That ratio was 87.6% for full-year 2025 and 71.2% for the first nine months of 2026. Over those nine months adjusted EBITDA grew +61.0% while free cash flow grew +35.0%.
Filing footnote (10-Q supplemental cash flow information): Cash paid for income taxes, net of refunds, was $926.2 million in the first nine months of 2026, 5.5 times the $167.3 million of a year earlier. The income statement tax provision for the same period was $769.8 million.
Adding cash taxes back to free cash flow gives 90.2% of adjusted EBITDA for the first nine months of 2025 and 89.7% for the same period of 2026. The drop in conversion is about the size of the extra tax. In 2025 the company paid $194.8 million in cash against a $519.7 million book tax charge; in 2026 it is paying more than the charge.
The company guided full-year 2026 free cash flow conversion to about 75% on its first- and second-quarter calls, then to roughly 70% to 75% on the third-quarter call. In Stumpf’s words this time: “We still expect full-year free cash flow conversion of roughly 70%-75% of adjusted EBITDA.” Working back from nine-month free cash flow and Q4 EBITDA guidance, 75% for the year needs $1,687 million to $1,710 million of Q4 free cash flow, an 84% to 85% quarterly conversion. Seventy percent needs $1,337 million to $1,358 million, or 67%. No quarter of 2026 has reached 84%, so the lower end fits the year so far.
Buyback Prices and the Share Count
In Q3 AppLovin spent $1.4 billion to repurchase and withhold 4.1 million shares, an average of $341.5. That is below Q2 (1.1 million shares at $501.2) and Q1 (2.2 million at $454.5). Over nine months it bought 7.4 million shares for $2,951 million, $398.8 on average, buying the most in the quarter when the stock was lowest. In late October the board added $3.2 billion to the authorization, leaving $3.6 billion.
Stumpf said that since the program began AppLovin has “repurchased and withheld a total of 104 million shares for $9.4 billion at an average price of $90 per share”, returning 85% of free cash flow. The $90 average includes 2022 and 2023 purchases made when the stock traded between $10 and $40. From Q1 2024 through Q3 2026 the company spent $5,984.5 million on repurchases and $1,591.8 million on tax withholding, $7,576.2 million in all, while shares outstanding fell from 339.89 million to 331.32 million, -2.52%.
Stock-based compensation for the first nine months of 2026 was $253.4 million, up +98.9%, and the more stock goes out as pay, the fewer shares each buyback dollar can retire.
How the AppLovin Auction Makes Money
AppLovin has four products. Axon Ads Manager is the advertiser tool, and the Axon AI recommendation engine matches advertiser demand with publisher inventory through auctions. MAX is the publisher tool, a mediation auction that invites many ad networks to bid for each slot. Adjust measures campaign results, and Wurl distributes and monetizes connected TV content. The 10-K opens with “We generate revenue when our advertisers achieve their return on advertising spend targets”, which describes a business that buys inventory within an advertiser’s return target and keeps the spread. The game studio business is gone; the Tripledot shares received in the sale sit on the balance sheet as a $298.3 million equity method investment.
The 2025 10-K revenue note says AppLovin does not control inventory before it reaches the advertiser, so it acts as an agent and reports revenue net of amounts owed to publishers. Cost of revenue is therefore mostly amortization of acquired technology, server lease amortization and cloud data center costs: $240.8 million in Q3, 11% of revenue. Sales and marketing and general and administrative were about 3% each, which is how the operating margin reaches 78.2%. Research and development grew fastest, up +132.2% to $101.8 million, and at the end of 2025 about 380 employees, 42% of the total, worked in R&D.
The auction grows with the inventory flowing through MAX. Foroughi said on the earnings call that the MAX market grows at a strong double-digit rate every year, and that because higher prices raise what publishers are paid, AppLovin’s models have to improve faster than the market for its own take to grow. By region, US revenue rose +59.6% to $1,098.1 million and the rest of the world +51.5% to $1,086.8 million.
How Fast Are Consumer Advertisers Growing?
On the Q3 call Foroughi said “Our gaming business grew nearly 50% year-over-year”, and Stumpf said consumer advertiser spend was up double digits sequentially and “growing triple digits from the same quarter last year”. The Q2 call had stated plainly that “Gaming is still the majority of our revenue”. Consumer advertisers are shops and brands outside gaming, and the 2024 10-K said AppLovin had opened its tools to e-commerce advertisers while still early in that market.
The 10-Q reports one operating segment, with the CEO allocating resources on that single set of numbers, so the consumer share cannot be calculated. If gaming grew close to 50% inside total growth of 55%, consumer spending filled the remaining few points. Foroughi describes one auction in which both groups bid for the same impressions: a gaming advertiser might value a slot at a $20 CPM and a consumer advertiser win it at $21. The long-term 30% target counts on both.
Since Q2 AppLovin has recruited consumer advertisers through partners such as one of the larger e-commerce analytics companies, preferring sophisticated customers over running ads everywhere. Foroughi also noted a learning curve for shops asked to produce 60 seconds of ad content. On connected TV he was blunt: “I wouldn’t bank on it at all for being accretive to numbers anytime soon”.
Growth and Multiples Against Trade Desk Unity and Meta
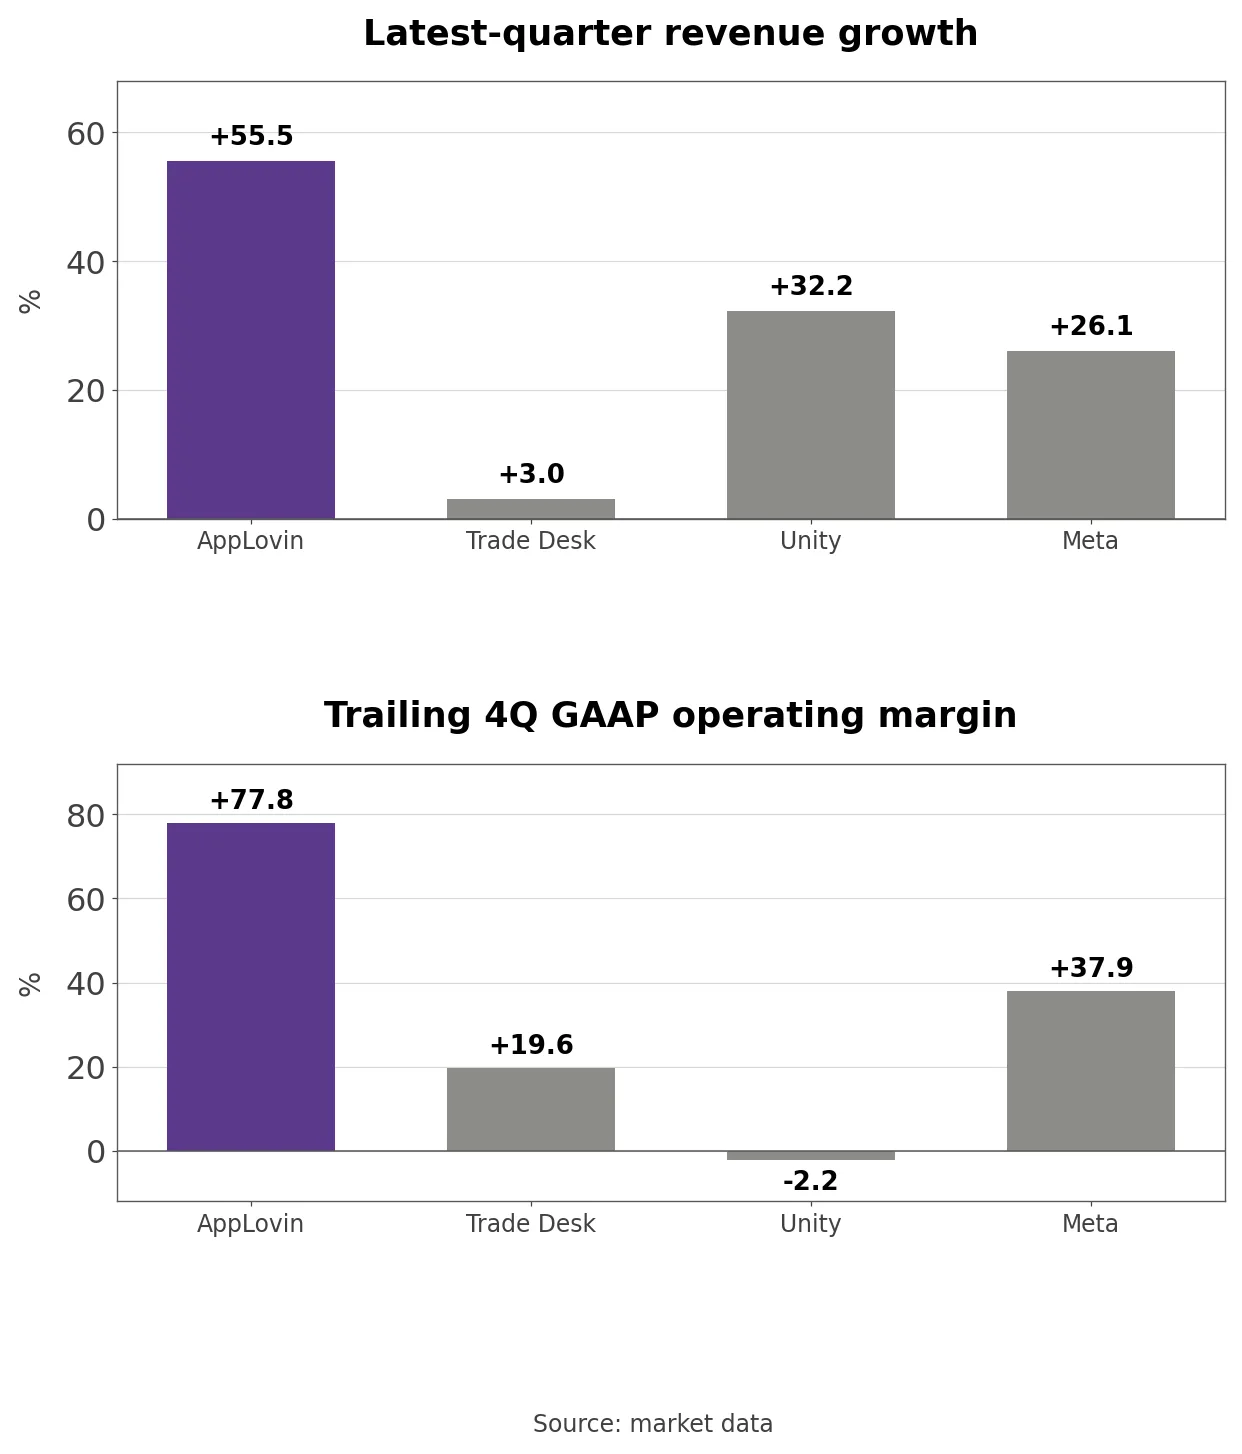
Latest-quarter revenue growth and GAAP operating margin at AppLovin Trade Desk Unity and Meta
I picked three peers. The Trade Desk runs a buying platform for web and connected TV ads, Unity competes with AppLovin head to head in mobile game ad networks and mediation, and Meta sets the benchmark for the performance advertising AppLovin wants consumer advertisers to buy.
On market data, latest-quarter revenue growth is +55.5% for AppLovin, +32.2% for Unity and +26.1% for Meta, with The Trade Desk at +3.0% on its latest reported quarter, Q2 2026. AppLovin’s trailing GAAP operating margin of 77.8% is more than double Meta’s 37.9%, while Unity is still at -2.2%.
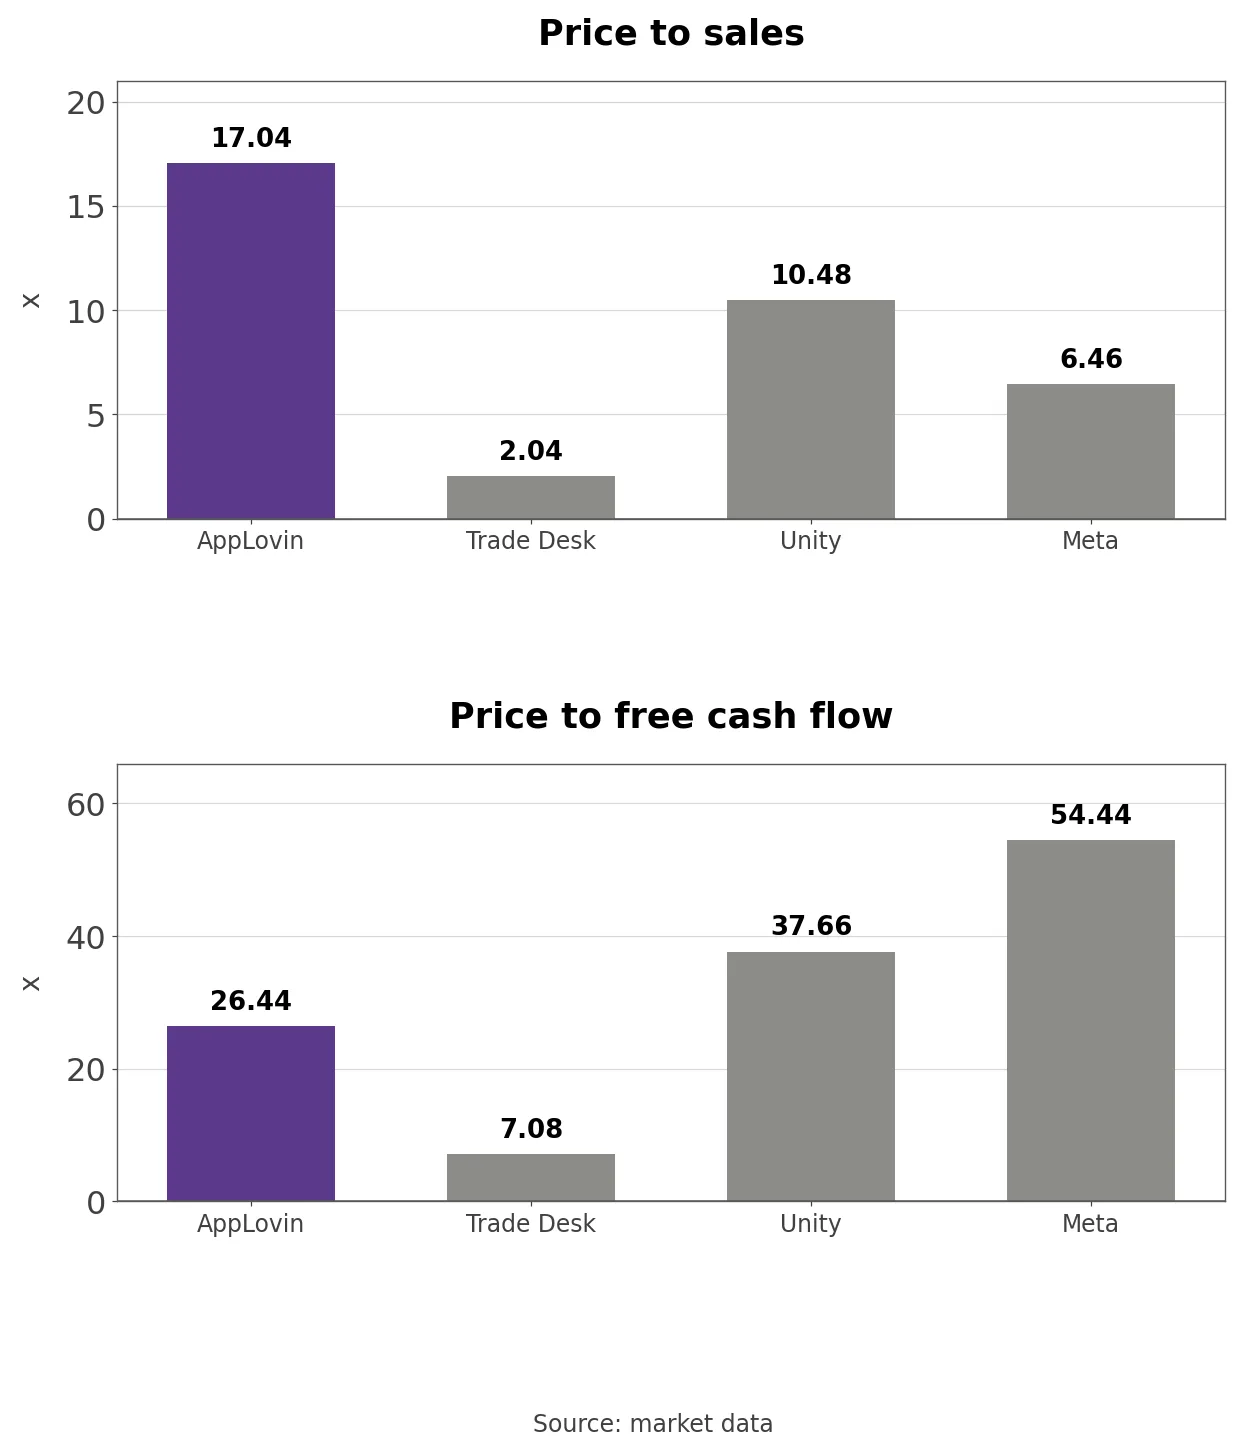
Price to sales and price to free cash flow at AppLovin Trade Desk Unity and Meta
The multiples depend on the yardstick. AppLovin’s price-to-sales ratio of 17.04 is the highest of the four and 2.6 times Meta’s 6.46. Its price to free cash flow of 26.44 is less than half of Meta’s 54.44, because AppLovin turned 64.4% of trailing revenue into free cash flow against Meta’s 11.9%. The Trade Desk, with growth down to 3.0%, trades at 2.04 times sales and 7.08 times free cash flow, a reminder of how far an ad tech multiple can fall once growth stalls.
The Price-to-Earnings and Price-to-Sales Band
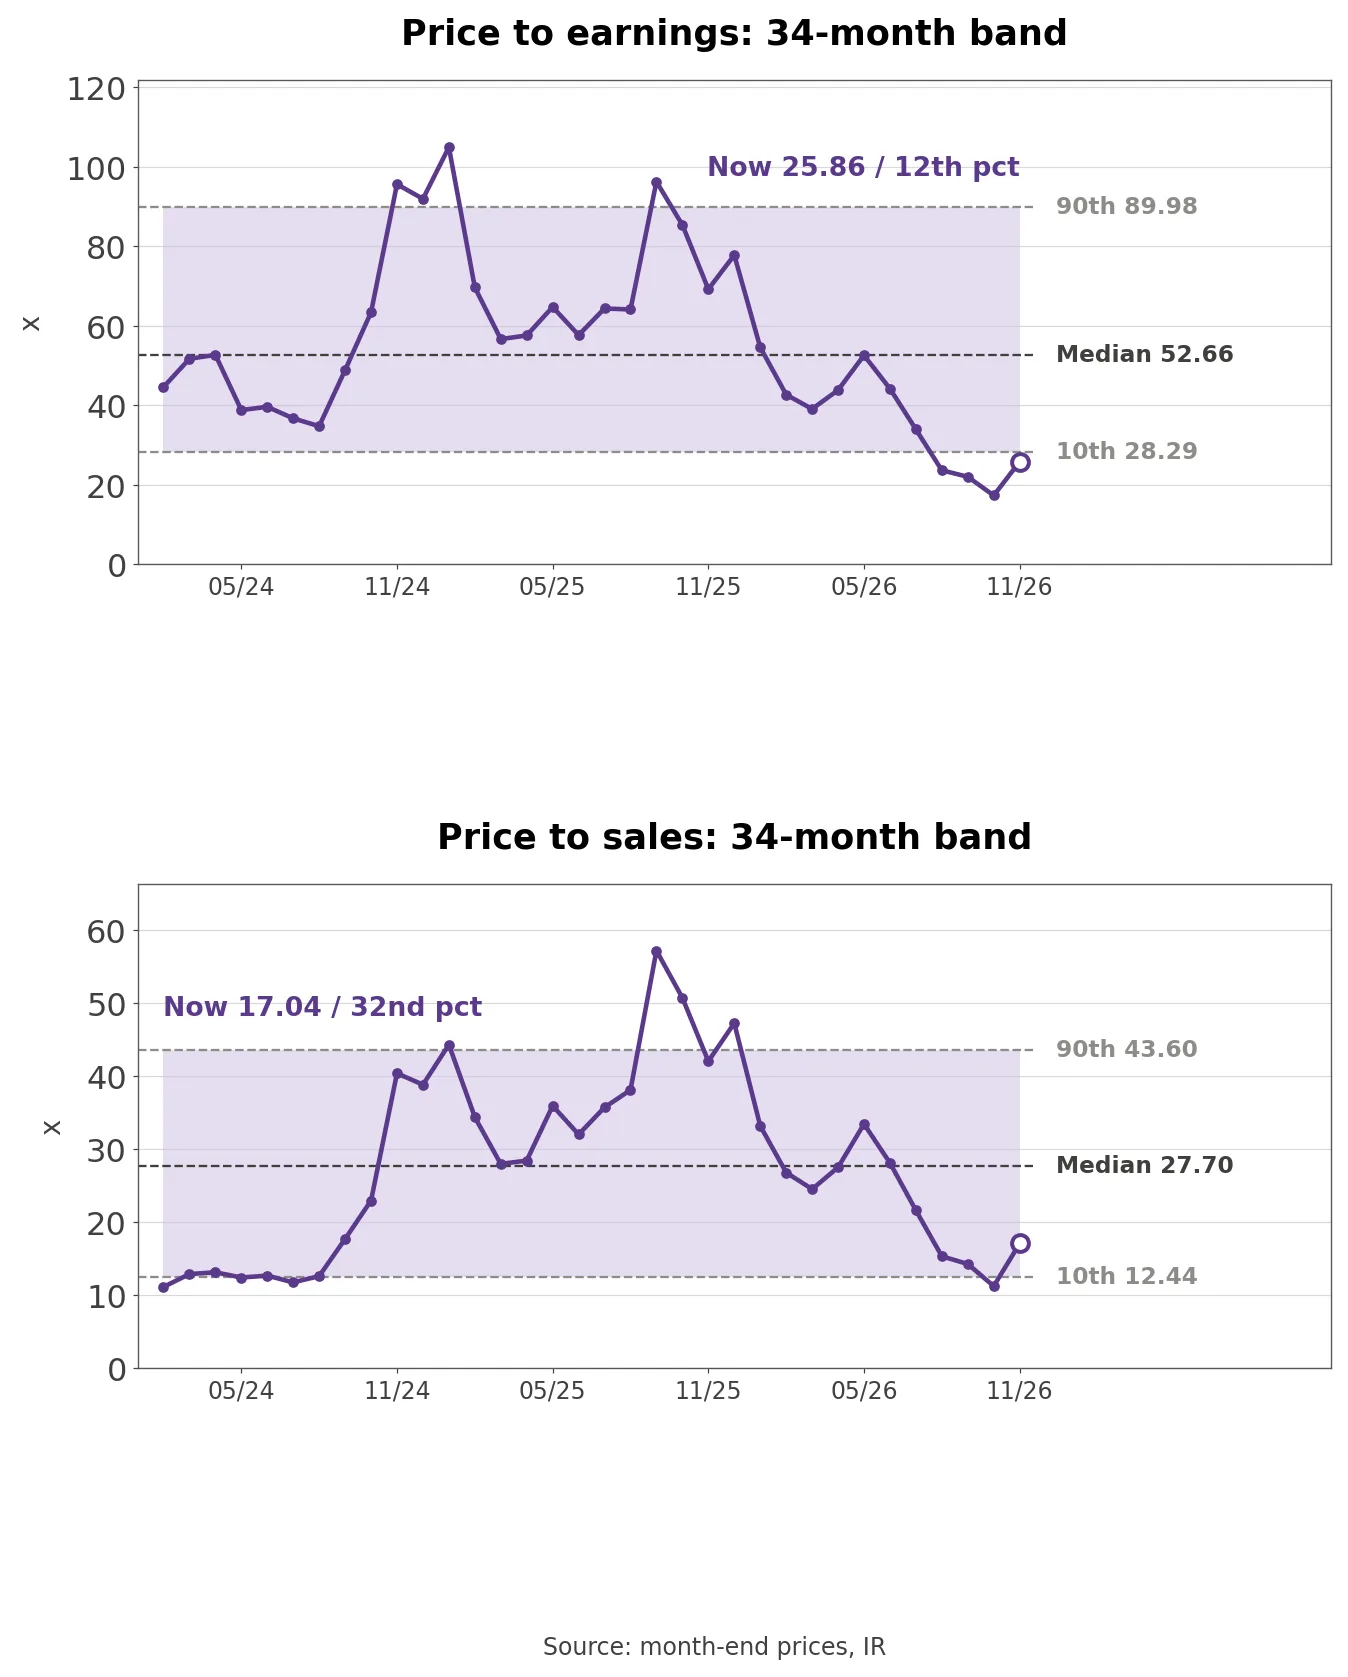
AppLovin price-to-earnings and price-to-sales bands over 34 months
Own calculation (month-end prices and IR update, 34 months): Month-end prices times shares from the latest 10-Q or 10-K cover, divided by trailing four-quarter net income and revenue from continuing operations, with each quarter counted from the month it was reported.
The price-to-earnings ratio is 25.86, in the bottom 11.8% of 34 months, against a median of 52.66. At the end of October it was 17.34. The price-to-sales ratio is 17.04, in the bottom 32.4%. The P/E peaked at 104.94 in January 2025 and was 77.80 when the stock peaked in December 2025; P/S peaked at 57.16 in September 2025. A year of rising earnings and a falling stock brought both below their medians. Market data shows a 26.24 P/E because it uses diluted earnings per share.
Three Conditions That Move the Stock
The beat over the top of guidance is the first condition. If Q4 revenue clears the $2,395 million top by something near the 16-quarter average of about 4%, the standard restored in Q3 holds, which is positive. The negative case is another quarter below the top, and the last one was followed by a -19.7% day.
Free cash flow conversion is the second. Positive is Q4 free cash flow above $1,687 million, enough to deliver the full-year rate the company gave on its first two calls. Negative is Q4 free cash flow short of $1,337 million, missing even the bottom of the range set in Q3, with the difference mostly cash taxes.
The buyback price and share count are the third. Positive is steady quarterly buying from the remaining $3.6 billion with shares outstanding falling below 330 million. Negative is equity pay doubling again, as it did in 2026, so that buybacks mostly offset new stock.
Nevada Reincorporation and Founder Voting Control
Filing footnote (Q3 8-K, Item 5.07, October 29 2026): Foroughi, director Herald Chen and family trusts holding 2,370,615 Class A shares and 30,063,730 Class B shares, about 67% of the voting power, approved by written consent, without a stockholder meeting, moving AppLovin’s incorporation from Delaware to Nevada.
Class B shares carry 20 votes each, so the 30.06 million Class B shares are 9.1% of the shares and 66.6% of the votes. AppLovin is a controlled company under Nasdaq rules, and the move can take effect 20 days after an information statement on Schedule 14C is mailed.
The same 10-Q lists two securities class actions. The first, filed from March 2025, has a class period of November 7, 2024 to March 27, 2025. The second, filed September 16, 2026, covers February 12 to August 5, 2026 and alleges misleading statements about “the pace of improvement of the Company’s advertising models and the development timeline for a certain ad-generation tool”. AppLovin says both lack merit. Moving the state of incorporation while these suits are pending may change what shareholders can bring against the board, and that will be set out in the Nevada articles and bylaws attached to the 14C. When the 14C is filed, should the director liability provisions be the first thing to read?