Arista Networks (NYSE: ANET) grew third-quarter revenue +58.5% to $3.658 billion, its fastest pace since going public, but three-quarters of that gain came out of revenue it had already shipped and deferred. The deferred revenue balance that had risen for 12 straight quarters slipped for the first time. In the same quarter Arista raised its purchase commitments for parts to $11.4 billion and guided 2027 revenue to about $18.5 billion. The supply side of the story is now running ahead of the demand evidence.
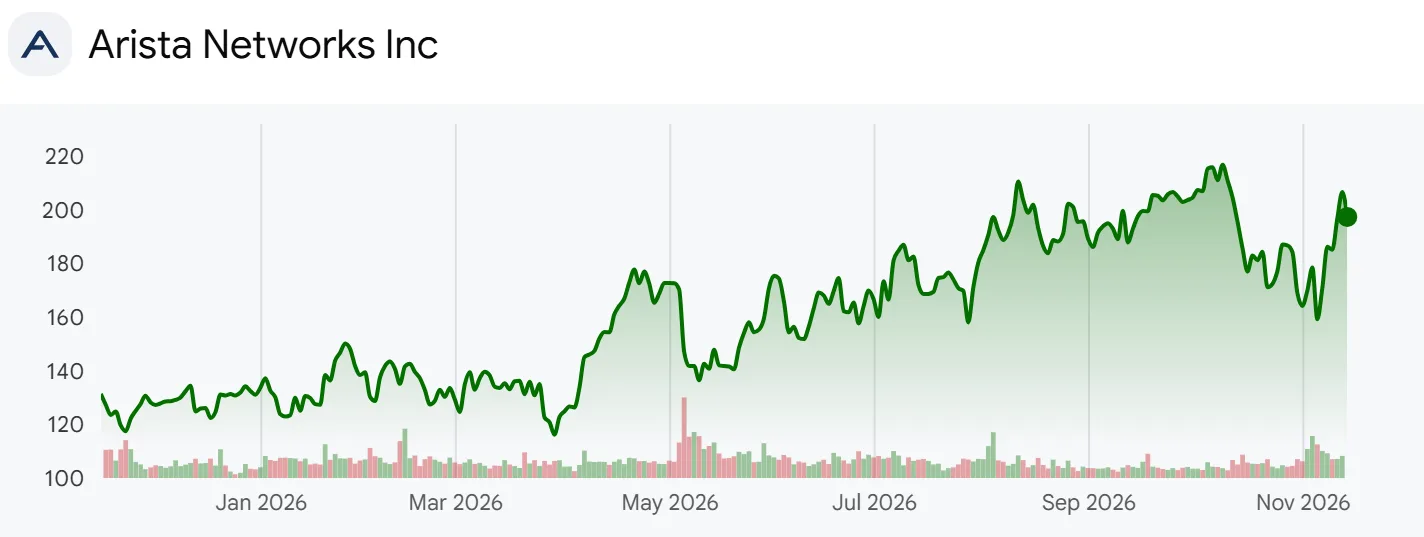
Arista Networks one-year share price chart
Arista sells the Ethernet switches that connect servers and GPUs inside data centers, the EOS operating system that runs on every one of them and the CloudVision software that manages them. Products were 87.2% of third-quarter revenue and the U.S. was 80.8%. Non-GAAP EPS was $1.20, +55.8% from a year earlier. The market value is about $249.3 billion.
I worked through the third-quarter 10-Q, the earnings release, the 17-slide earnings deck, the November 3 call, 23 earnings releases since 2021 and the quarterly purchase commitment disclosures back to 2013. The open question is whether the $9.3 billion of parts Arista has agreed to receive within 12 months points to more revenue than the 2027 guide, or to inventory piling up the way it did in 2022.
Two limits apply. The 10-Q discloses revenue recognized from the opening deferred balance on a three-month basis only for the first three quarters, so there is no fourth-quarter figure. The 2027 cost of revenue is my own estimate from the midpoint of guidance ($18.5 billion of revenue at a 63% non-GAAP gross margin), not a company number.
Slide 5 and the First Drop in Deferred Revenue
Q3 2026 earnings slide 5 with deferred revenue change at 29 percent of 2025 revenue
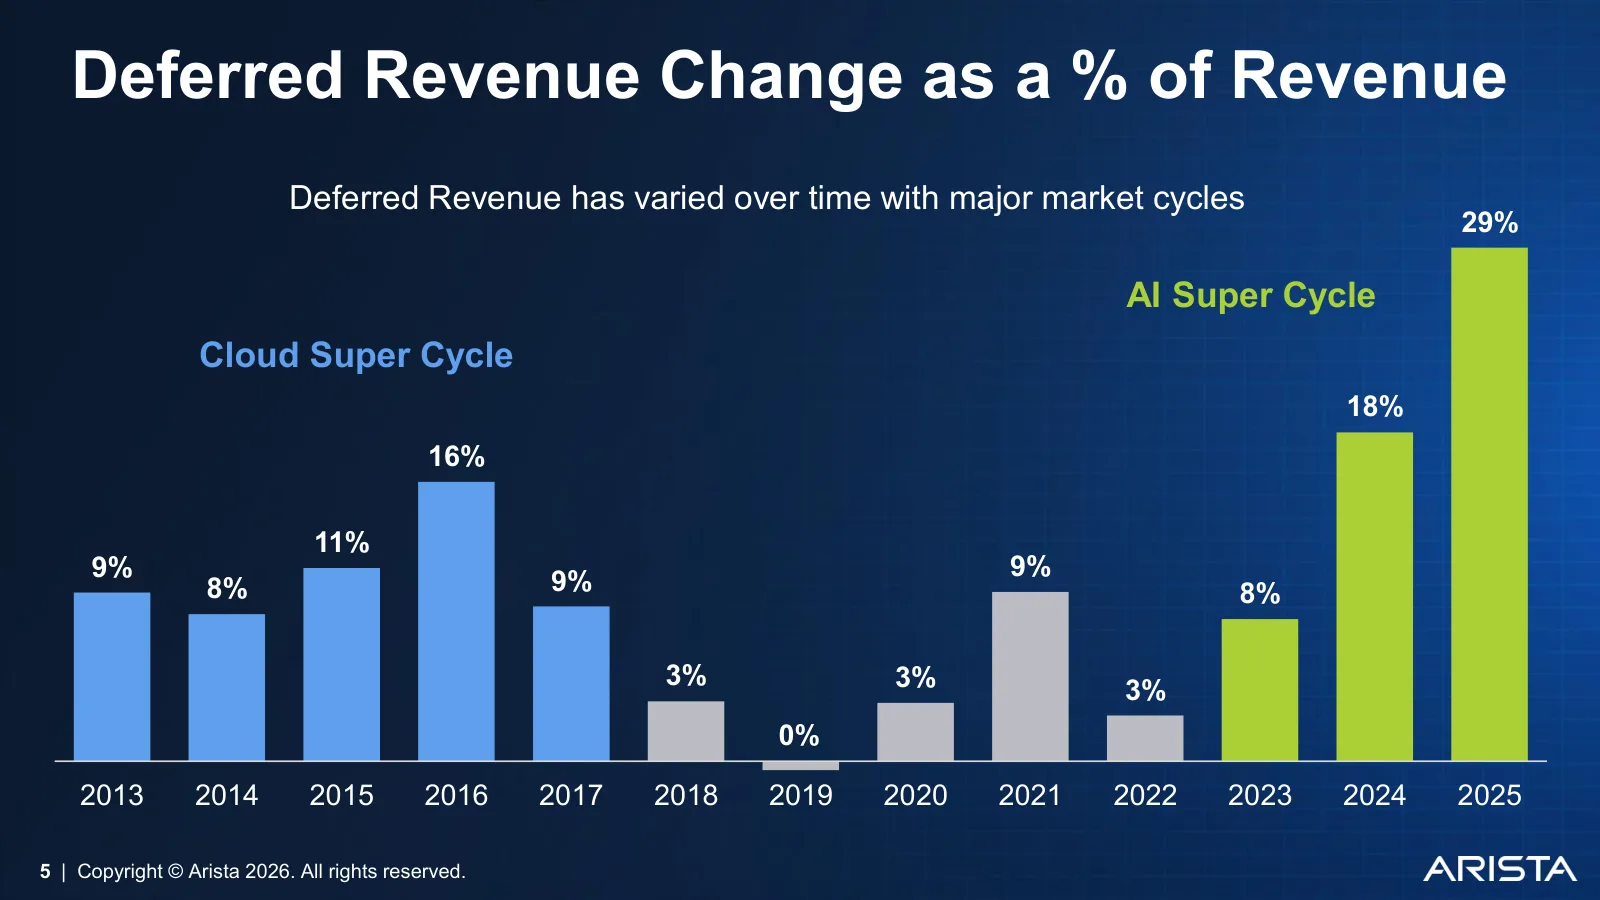
Slide 5 of the deck plots the yearly change in deferred revenue as a share of that year’s revenue from 2013 to 2025, under the line “Deferred Revenue has varied over time with major market cycles.” The cloud cycle peaked at 16% in 2016. The AI cycle reached 29% in 2025. Rebuilding 2025 from the release balances, deferred revenue grew $2.581 billion on revenue of $9.006 billion, or 28.7%, so the slide holds.
The same slide carries a pattern Arista did not point out. In the cloud cycle the ratio peaked in 2016 and revenue growth peaked a year later at +45.8% in 2017. The ratio then fell to 3% in 2018 and 0% in 2019. Revenue growth over those two years slowed to +30.7% and +12.1%, and 2020 came in at -3.9%. Last time, the deferred ratio turned before revenue did.
Applied to 2026, deferred revenue grew $1.467 billion in nine months, 15.6% of revenue, but the third quarter alone was -0.7%. Deferred revenue here is mostly two things: equipment already delivered to customers whose acceptance tests are not finished, and multi-year support contracts paid up front. AI gear sold under acceptance clauses stays in the balance until the customer signs off.
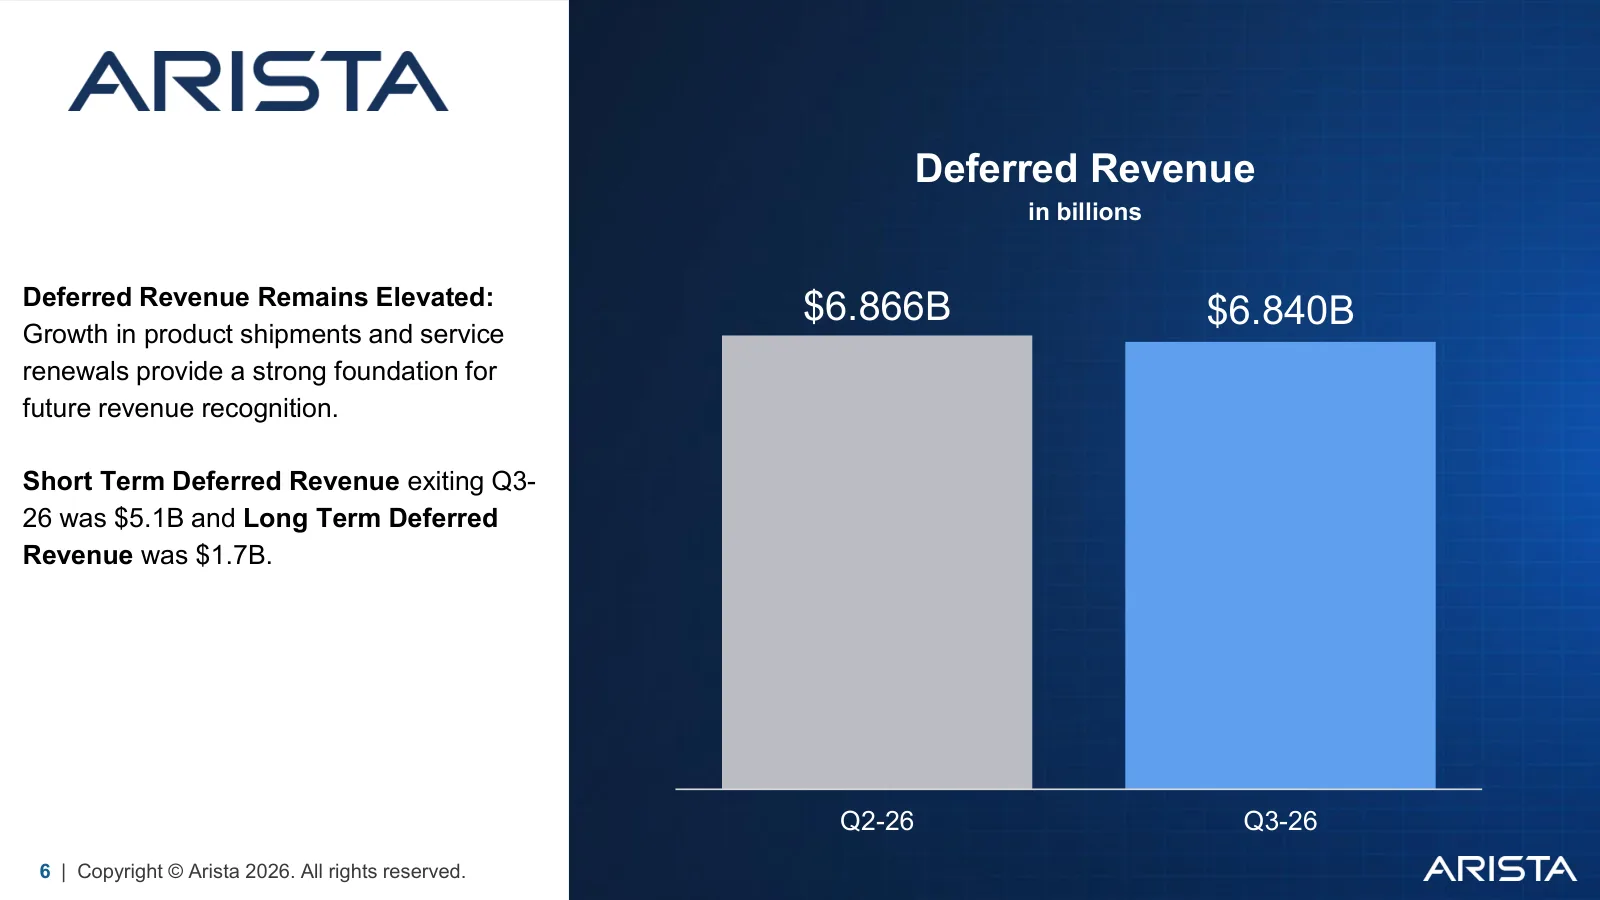
Slide 6 is titled “Deferred Revenue Remains Elevated” and shows two bars, $6.866 billion and $6.840 billion. The current portion was flat at $5.102 billion and the non-current portion fell from $1.765 billion to $1.737 billion. The balance is high. It also fell by -$26.4 million, the first decline after 12 straight quarterly increases since the second quarter of 2023.
Earnings slide 6 with deferred revenue of 6.866 billion and 6.840 billion
Company disclosure (Q3 call, November 3, 2026): CFO Chantelle Breithaupt said product deferred revenue fell $86 million from the prior quarter and that “These trends have resulted in increased customer-specific acceptance clauses and an increase in the volatility of our product deferred revenue balances.” In the Q&A she added that “deferred revenue actually had the largest churn in and out and still remained flat and still delivered a 58.5% revenue growth quarter.”
The 10-Q table shows what that churn looked like. Of the $6.866 billion opening balance, $1.715 billion became revenue and $1.689 billion of new deferrals came in. More went out than came in, and whether the balance refills in the fourth quarter is the first thing to check.
Slide 7 Commitments and the 2027 Guide
Earnings slide 7 with purchase commitments rising to 11.4 billion
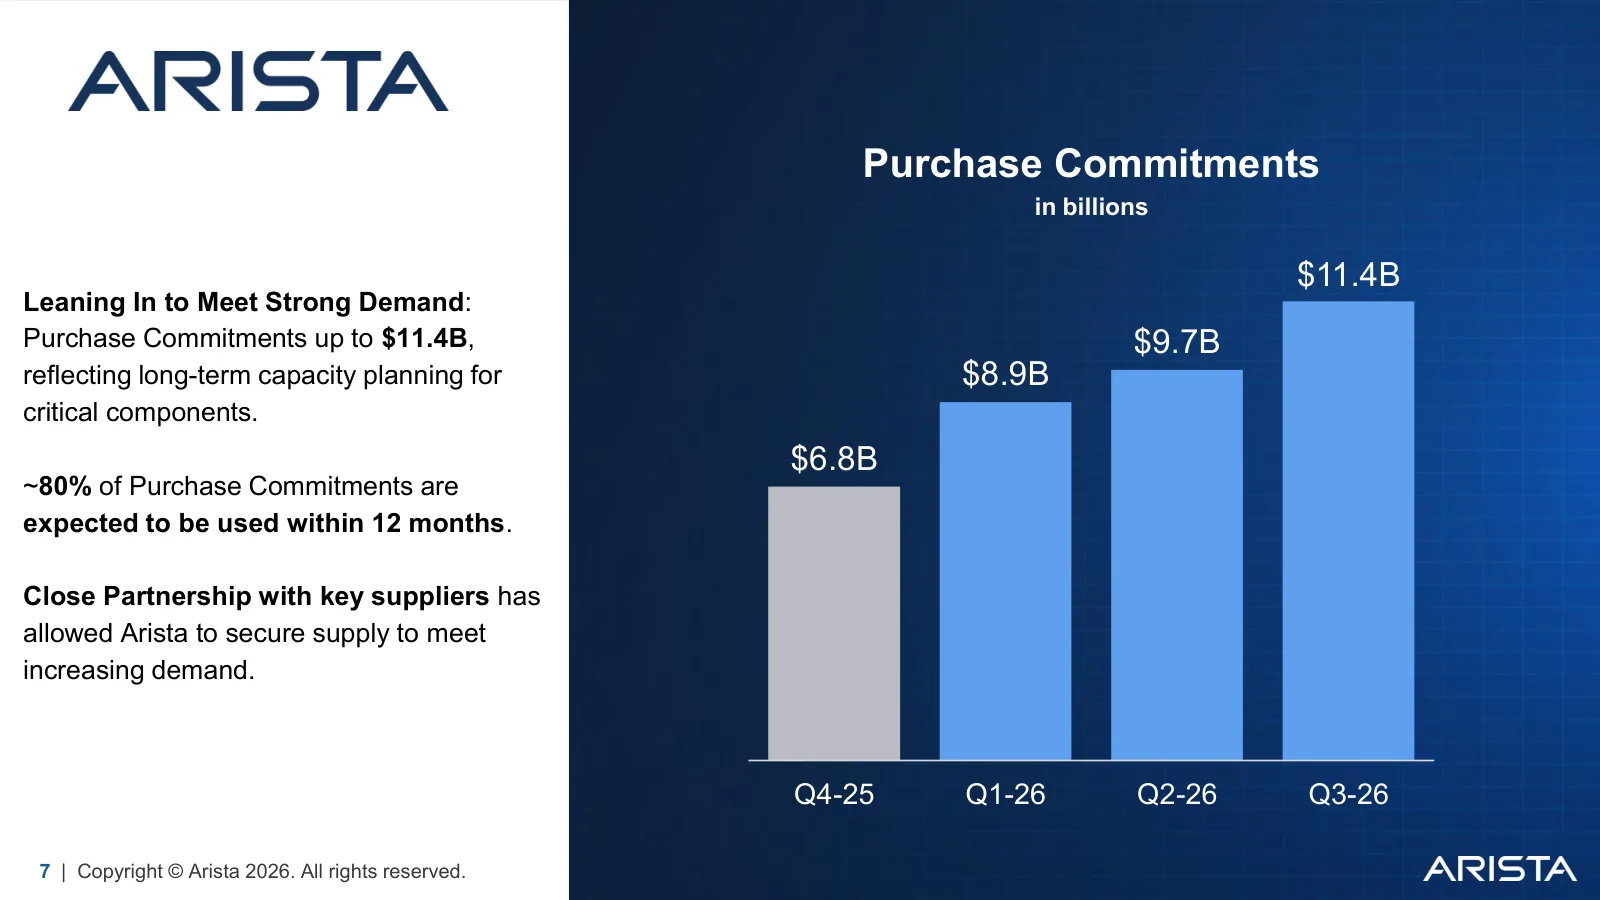
Slide 7 is headed “Leaning In to Meet Strong Demand.” Purchase commitments went from $6.8 billion at the end of 2025 to $8.9 billion, $9.7 billion and $11.4 billion, and the slide says about 80% will be used within 12 months. The 10-Q note splits the $11.4 billion into $9.3 billion with expected receipt within 12 months and $2.1 billion after that. The longer-dated piece was $0.3 billion a quarter earlier, so it grew about sevenfold in three months, and the CFO said on the call that a multi-year memory supply agreement was added.
Most commitments carry fixed prices and quantities, but the 10-Q says some arrangements include variable pricing. Deposits with contract manufacturers rose from $53.0 million at the end of 2025 to $152.8 million.
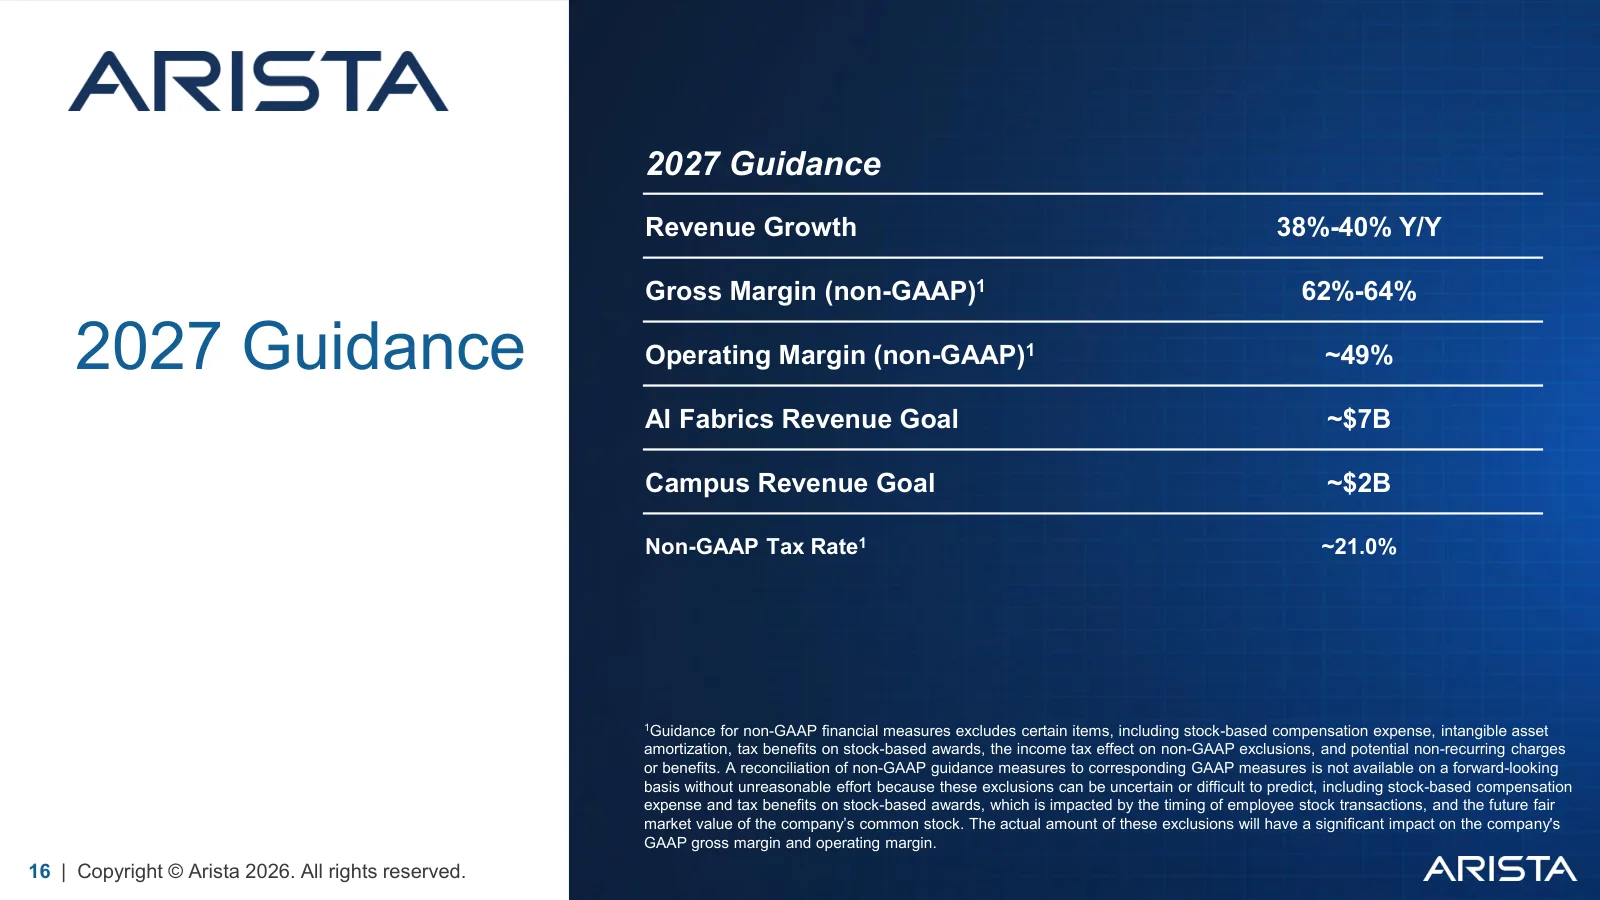
Slide 16 sets 2027 guidance at 38% to 40% revenue growth, a 62% to 64% non-GAAP gross margin and a non-GAAP operating margin of about 49%. The AI networking revenue goal is about $7 billion and the campus goal about $2 billion. The base is the 2026 revenue guide of $13.3 billion, raised for the fourth time this year, which puts the midpoint near $18.5 billion.
Earnings slide 16 with 2027 guidance of 38 to 40 percent revenue growth
Slide 15 guides the fourth quarter to revenue of $3.9 billion to $4.0 billion, a 63% to 64% gross margin, a 48% to 49% operating margin and non-GAAP EPS of $1.26 to $1.30. The $1.28 midpoint is +56.1% from $0.82 a year earlier and in line with the $1.29 consensus. Third-quarter non-GAAP EPS of $1.20 came in +11.1% above the $1.08 consensus.
Own calculation: Adding the $3.95 billion fourth-quarter midpoint to $9.402 billion of nine-month revenue gives $13.352 billion for 2026, 48.3% above 2025. Applying a 49% operating margin and a 21% tax rate to $18.5 billion, adding four times the third quarter’s $138.6 million of non-GAAP other income and dividing by the 1.28 billion guided shares gives 2027 non-GAAP EPS of about $5.94. Consensus sits at $18.75 billion of revenue and $6.04 of EPS, 1.4% and 1.7% above those figures.
The guidance record is tight. In the 22 quarters since the second quarter of 2021, revenue never fell below the low end of the prior quarter’s guide, and it missed the high end only once, in the fourth quarter of 2023. The average beat over the midpoint was 3.3% in 2023 and 2024 and widened to 4.2%, 8.4% and 10.8% in 2026. The 2022 average was 8.3%, the year purchase commitments first passed $4 billion.
The Bull and Bear Case for Arista
The bull case is that demand is ahead of supply. The 2027 plan doubles AI revenue from $3.5 billion to $7 billion, and in 22 quarters revenue has never landed below the bottom of guidance. Parts due within 12 months already exceed the estimated 2027 cost of revenue, which reads as a conservative guide.
The bear case reads the same numbers the other way. Three-quarters of the third-quarter revenue gain came out of the deferred balance, and the balance fell. The commitment ratio is the highest since the 1.41x peak in the third quarter of 2022, after which inventory nearly tripled. The stock trades at 50.46x trailing non-GAAP EPS, the 86.7th percentile of 60 months.
From Cloud Switches to AI Networking
Arista month-end share price since 2021 and daily closes since August 2026
Arista was founded in 2004 by Andy Bechtolsheim and partners, hired Jayshree Ullal as CEO in 2008 and listed on the New York Stock Exchange in 2014. For its first decade it took share from Cisco by selling switches into cloud data centers, the period slide 5 labels the cloud super cycle. The shares split 4-for-1 in 2021 and again in 2024.
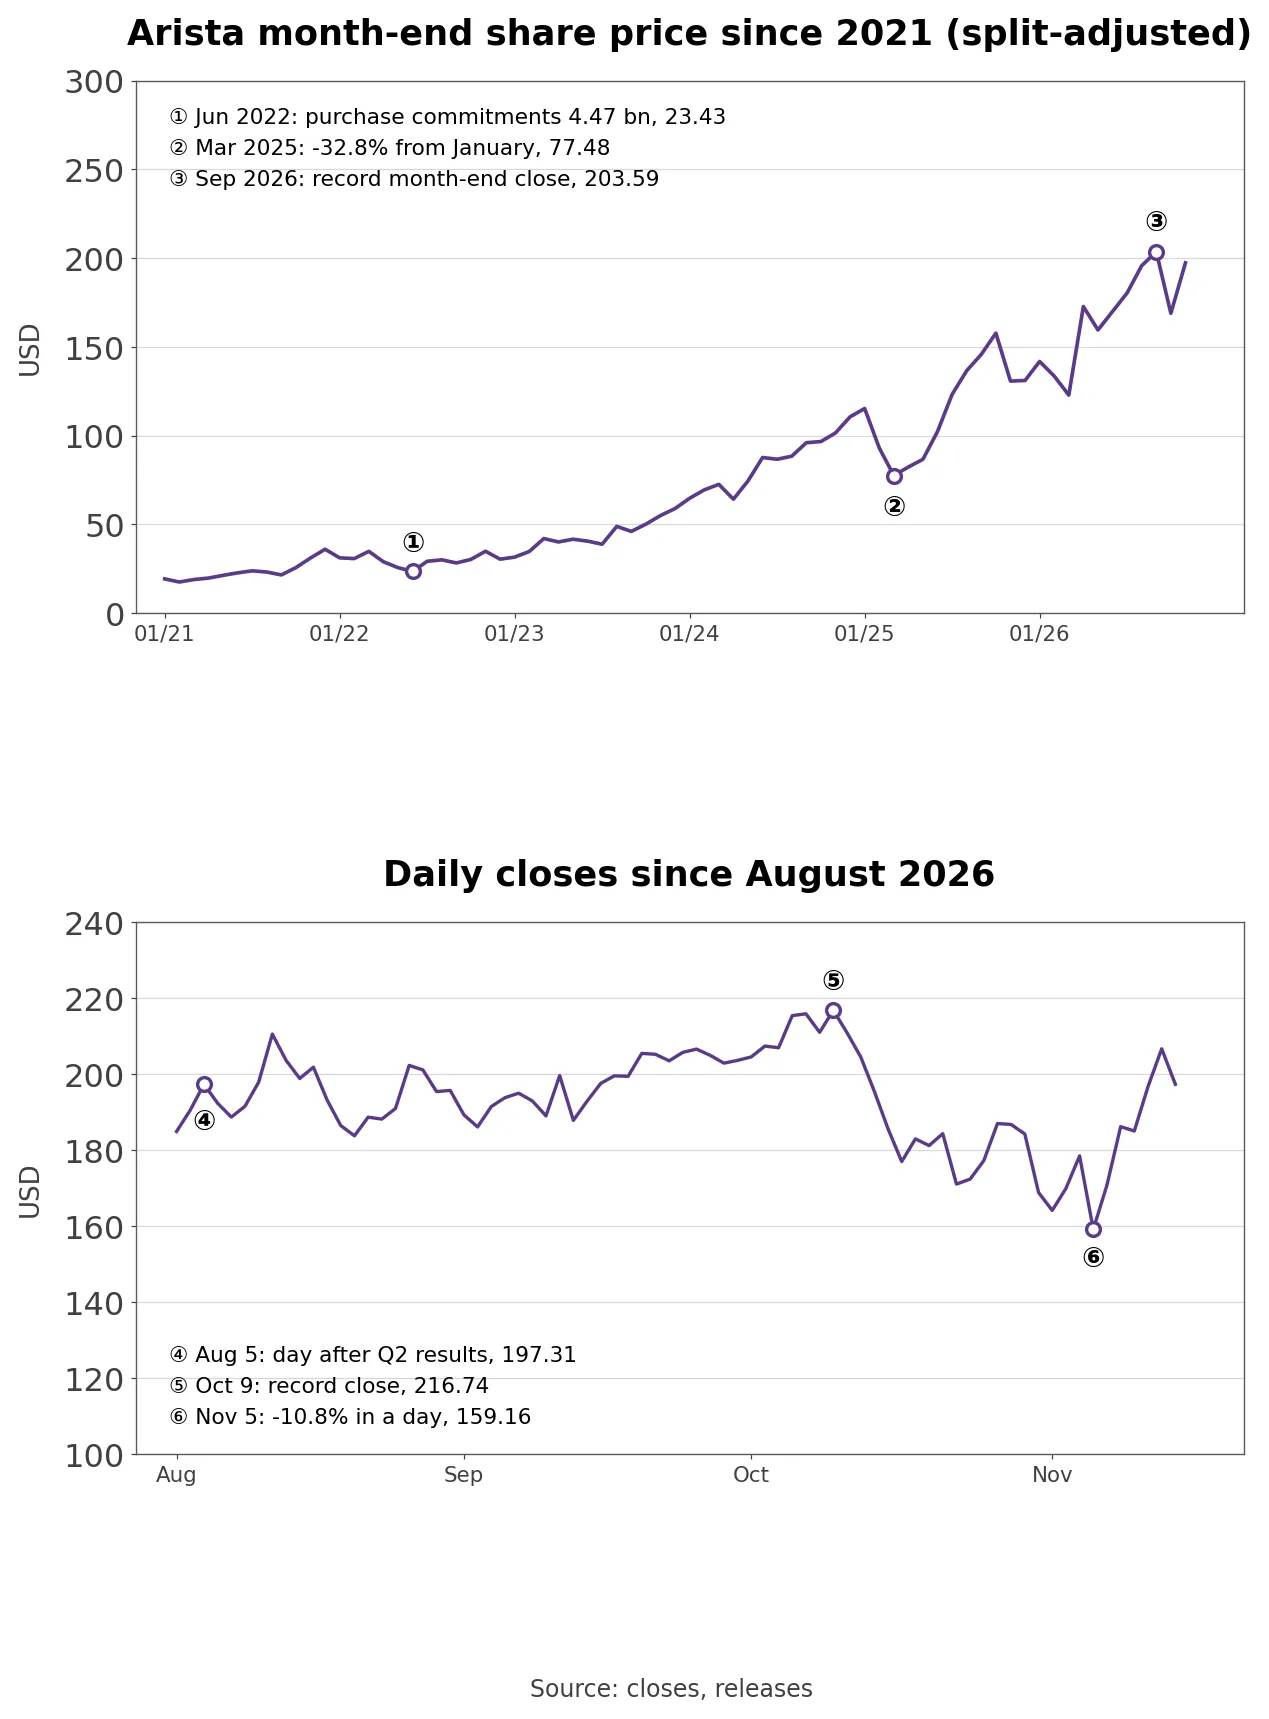
The second turn came in 2022. During the chip shortage, purchase commitments climbed from $2.147 billion in the third quarter of 2021 to $4.472 billion in the second quarter of 2022, while the stock fell to a split-adjusted $23.43 at the end of June 2022. AI data centers then began linking tens of thousands of GPUs, which created demand for Ethernet between them. Ullal said on the call that what began as four or five AI customers three years ago has passed 100 customers for the Etherlink AI line.
In 2025 the stock fell -32.8% from $115.23 at the end of January to $77.48 at the end of March, yet deferred revenue grew by 29% of revenue that year. In September 2026 Arista joined the S&P 100 and closed the month at a record month-end $203.59.
Day to day, the stock fell -26.6% from a record close of $216.74 on October 9 to $159.16 on November 5. It rose +5.0% the day after the results, fell -10.8% the next day and then rose +29.8% from that low to $206.63 on November 12.
Deferred Revenue Supplied 75% of the Growth
Share of quarterly revenue released from the opening deferred balance and the Q3 revenue bridge
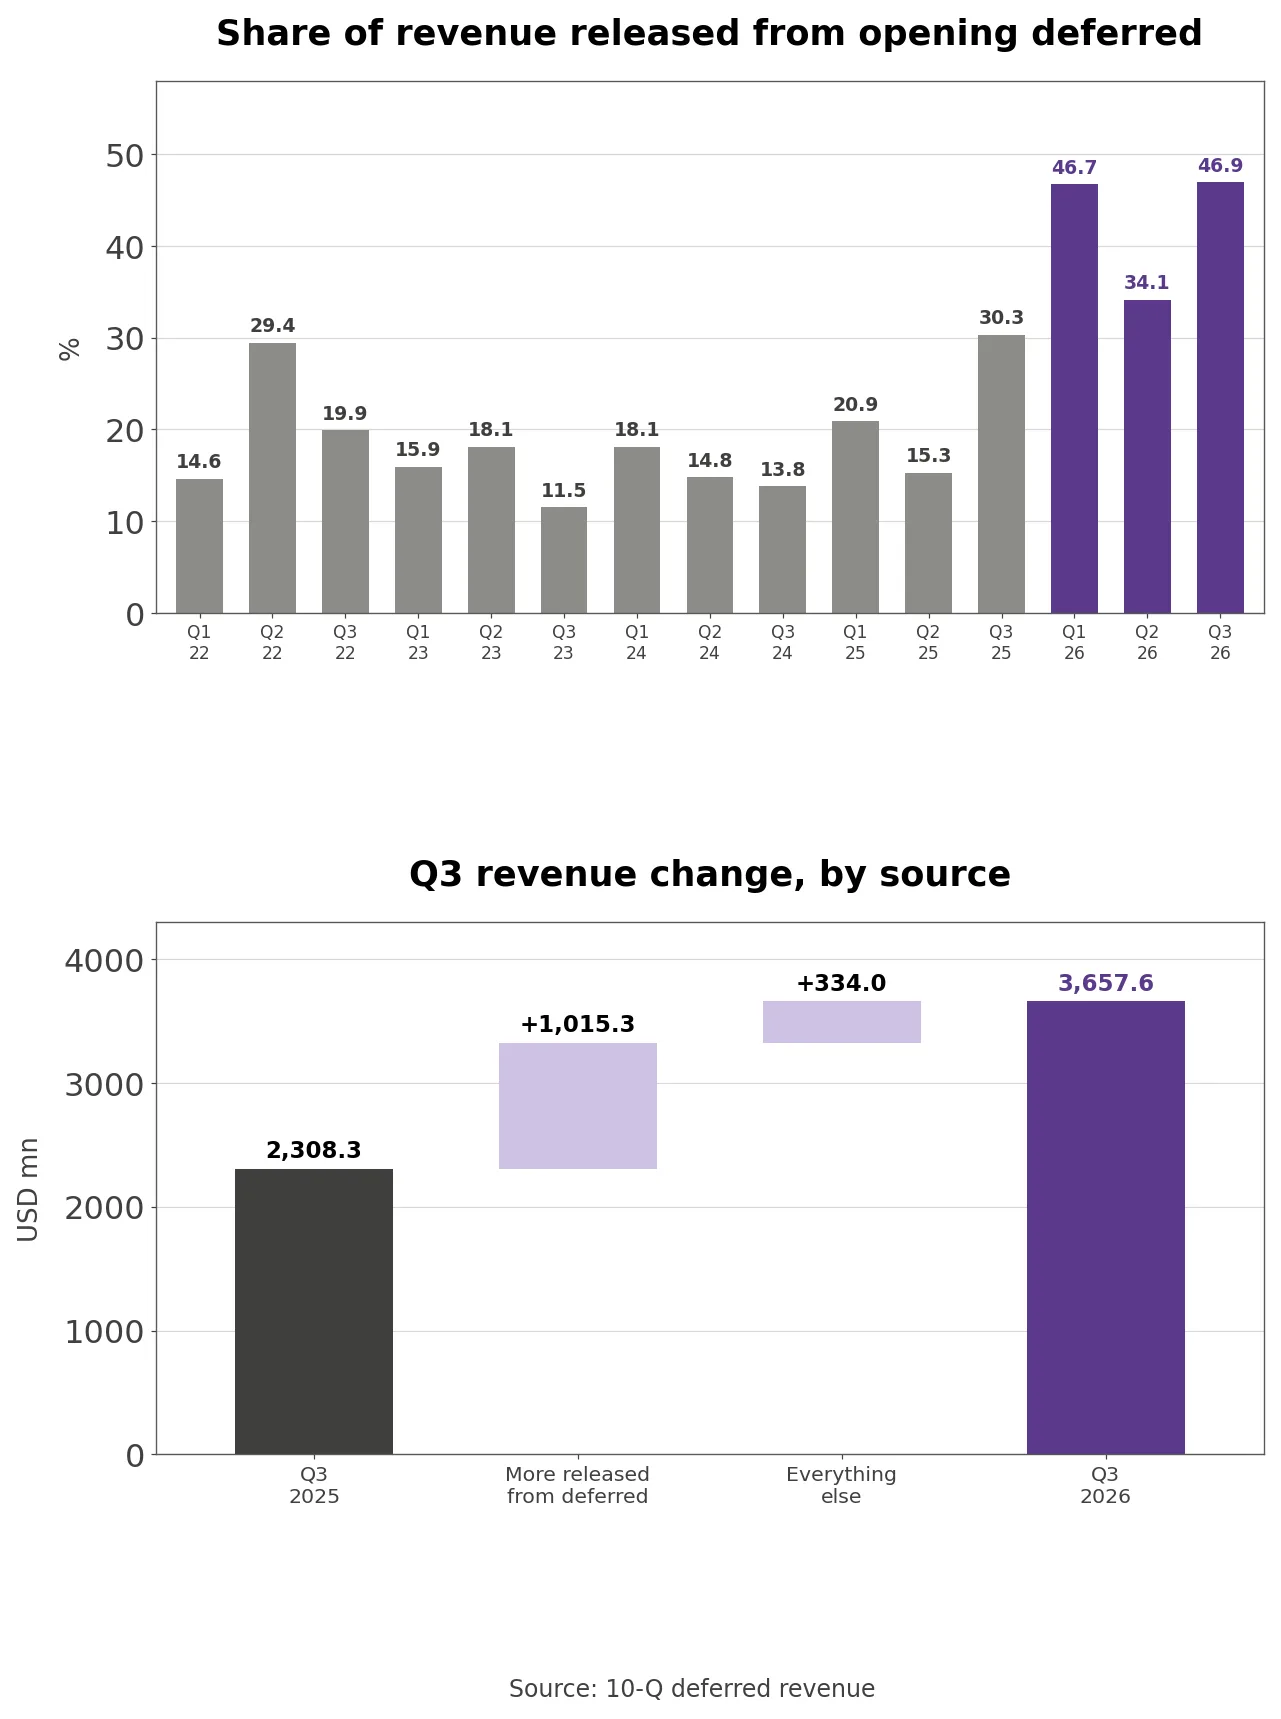
Of the $1.349 billion increase in third-quarter revenue, $1.015 billion, or 75.2%, came from more revenue being recognized out of the opening deferred balance. The 10-Q deferred revenue table shows $1.715 billion of the $6.866 billion opening balance turned into revenue in the quarter, against $699.7 million a year earlier.
Own calculation: Revenue excluding the release from the opening balance was $1.943 billion, 20.8% above $1.609 billion a year earlier. Even if all $467.6 million of service revenue came from that balance, at least $1.247 billion, or 39.1%, of the $3.190 billion in product revenue was gear waiting for acceptance, compared with 15.9% a year earlier.
The share of quarterly revenue that came from the opening balance ranged from 11.5% to 29.4% in 2022 through 2024, reached 30.3% in the third quarter of 2025 and then ran 46.7%, 34.1% and 46.9% in the first three quarters of 2026. New deferrals in the quarter were $1.689 billion, +27.5% from $1.324 billion a year earlier, but they did not cover the $1.715 billion released.
Adding the change in deferred revenue to revenue gives a billings-style figure of $3.631 billion for the third quarter, -1.9% from $3.703 billion in the second quarter and +23.8% from $2.933 billion a year earlier. The 34.7-point gap between reported growth and that measure is the real issue in this quarter. The fourth-quarter guide implies +58.8% growth, and unless the balance rebuilds, much of that revenue also has to come out of deferrals.
What Happened the Last Time Commitments Ran This Hot
Purchase commitments and inventory with 12-month commitments over next-four-quarter cost of revenue
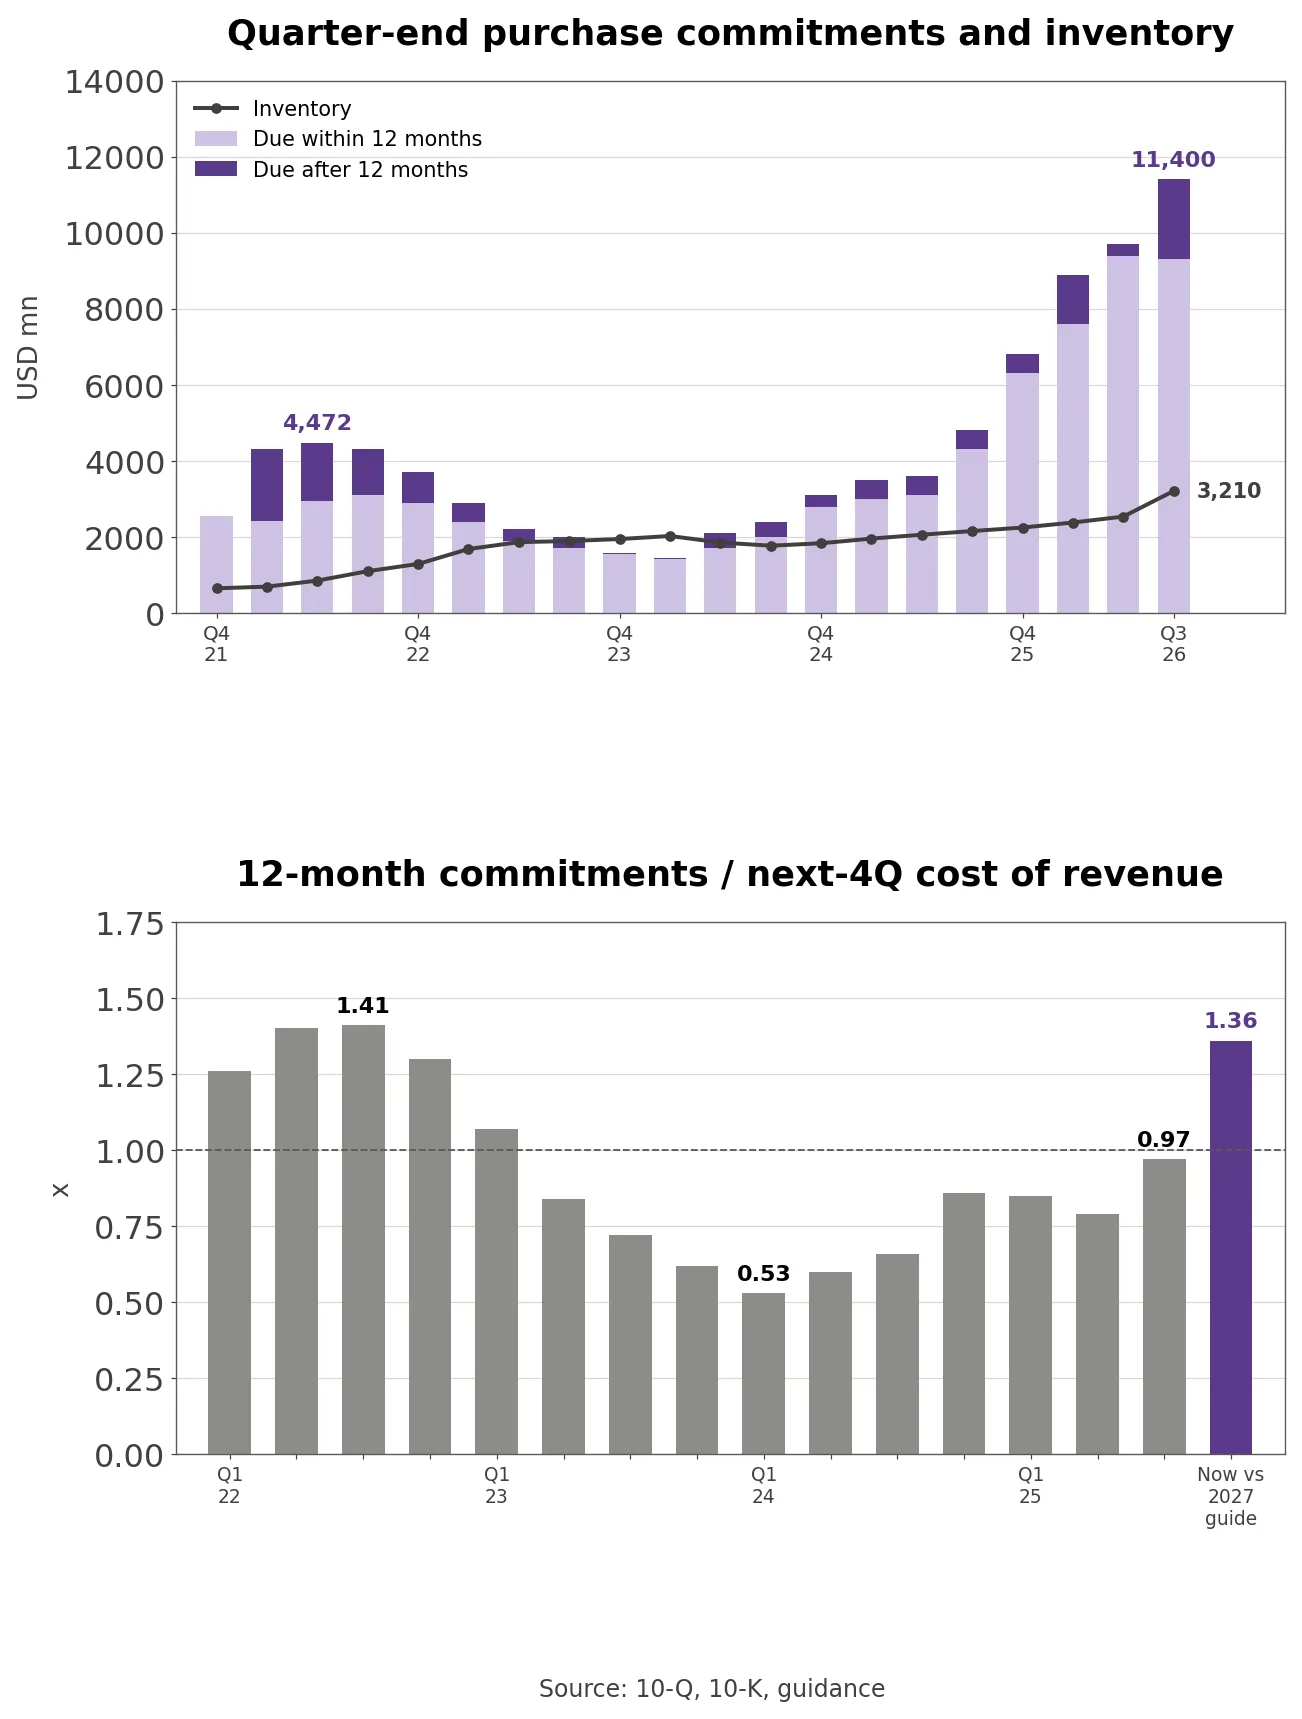
The $9.3 billion of purchase commitments due within 12 months is 1.36 times the roughly $6.845 billion of 2027 cost of revenue implied by guidance. Dividing each quarter’s 12-month commitments by the actual cost of revenue of the following four quarters, the ratio rose from 1.26x in the first quarter of 2022 to 1.41x in the third quarter, fell to 0.53x in the first quarter of 2024 and was 0.97x in the third quarter of 2025.
The current figure uses full-year 2027 cost because the next four quarters have not happened. While revenue is growing, the next four quarters cost less than calendar 2027, so the true ratio is above 1.36x. Using the 62% low end or the 64% high end of the gross margin guide gives 1.32x to 1.40x.
Inventory went from $694.2 million in the first quarter of 2022 to $2.025 billion in the first quarter of 2024, 2.92 times as much. Over that stretch the non-GAAP gross margin fell from 63.9% to 60.3% in the first quarter of 2023 before recovering to 65.4% in the fourth quarter of 2023. Revenue still grew +33.8% in 2023, so the 2022 build did not turn into write-off losses. It tied up margin and cash for several quarters.
Inventory now stands at $3.210 billion, +26.6% from the second quarter and +48.9% from a year earlier, and turns slipped from 1.7 to 1.6. On the call the CFO warned that “This could result in quarters of elevated inventory balances affecting the timing of cash flow from operations ahead of customer deployments.” The 10-Q also cites tighter memory and silicon supply as a pressure on gross margin, and the 2027 margin guide of 62% to 64% sits below the third quarter’s 64.0% and the year-earlier 65.2%.
There is one difference from 2022. Then the commitments were about securing parts during a shortage. This time they come with a $18.5 billion revenue guide attached. Fourth-quarter inventory and deferred revenue will show which way the commitments are going.
How Arista Makes Money
Product revenue comes from switches, routers and the network software sold with them, and service revenue comes from support contracts bought alongside the hardware. In the third quarter, product revenue was $3.190 billion and service revenue $467.6 million. Based on the 10-Q income statement, product gross margin was 60.7% and service gross margin 83.6%.
Every Arista switch runs the same EOS operating system, which is the company’s main point of difference. Customers keep one software stack across hardware generations and manage thousands of switches from CloudVision. That is a large part of why cloud operators moved to Arista when Cisco still ran different operating systems across product lines.
The cost base is lean. Third-quarter non-GAAP operating expenses were $545.3 million, 14.9% of revenue, including $408.5 million of R&D (11.2%) and $110.9 million of sales and marketing (3.0%). R&D rose +46.9% from $278.1 million in the second quarter, which the company tied to liquid cooling, high-radix switching and AI software. Sales spending stays near 3% of revenue because there are few customers and each order is large, and that is where the 49.1% non-GAAP operating margin comes from.
Customers are concentrated. Two end customers accounted for 26% and 16% of 2025 revenue, about $2.341 billion and $1.441 billion, up from 20% and 15% in 2024. Ullal called them “M&M” on the call and said: “We fully expect our top prior 10%-plus customers to continue to be with us in ’26, and we hope beyond.” She expects one or two more to cross 10%.
Where the 2027 Growth Comes From
Of the roughly $5.2 billion of growth in the 2027 plan, $3.5 billion, or 67.3%, comes from AI networking. The CFO gave the 2026 baseline as $13.3 billion, with AI at $3.5 billion and campus at $1.25 billion. With 2027 goals of $7 billion for AI and $2 billion for campus, everything else grows from $8.55 billion to $9.5 billion, +11.1%.
That other bucket covers cloud and enterprise data center switching and routing outside the AI and campus labels, 64.3% of 2026 revenue. Its 2027 growth rate is less than a quarter of the +48.3% for 2026 as a whole, so the 2027 number leans much more on one line of business. AI rises from 26.3% to 37.8% of revenue. Campus, the wired and wireless networks in offices and plants, carries a +60.0% growth goal.
AI networking comes in three forms. Scale-up connects accelerators inside a rack, scale-out connects racks into a cluster and scale-across connects data centers. Ullal put the 2026 AI mix at roughly 70% scale-out and 30% scale-across and said scale-up trials start in 2027 with production in 2028.
Asked whether the chips and memory for the 2027 plan were secured, President Todd Nightingale said long-term agreements now cover silicon, circuit boards and memory and that “we have very high confidence in the ability to deliver supply to the forecast.” The $11.4 billion of commitments is the number behind that answer.
Arista vs. Cisco and Other Networking Peers
Revenue growth and operating margin at Arista Cisco HPE Ciena and Nvidia
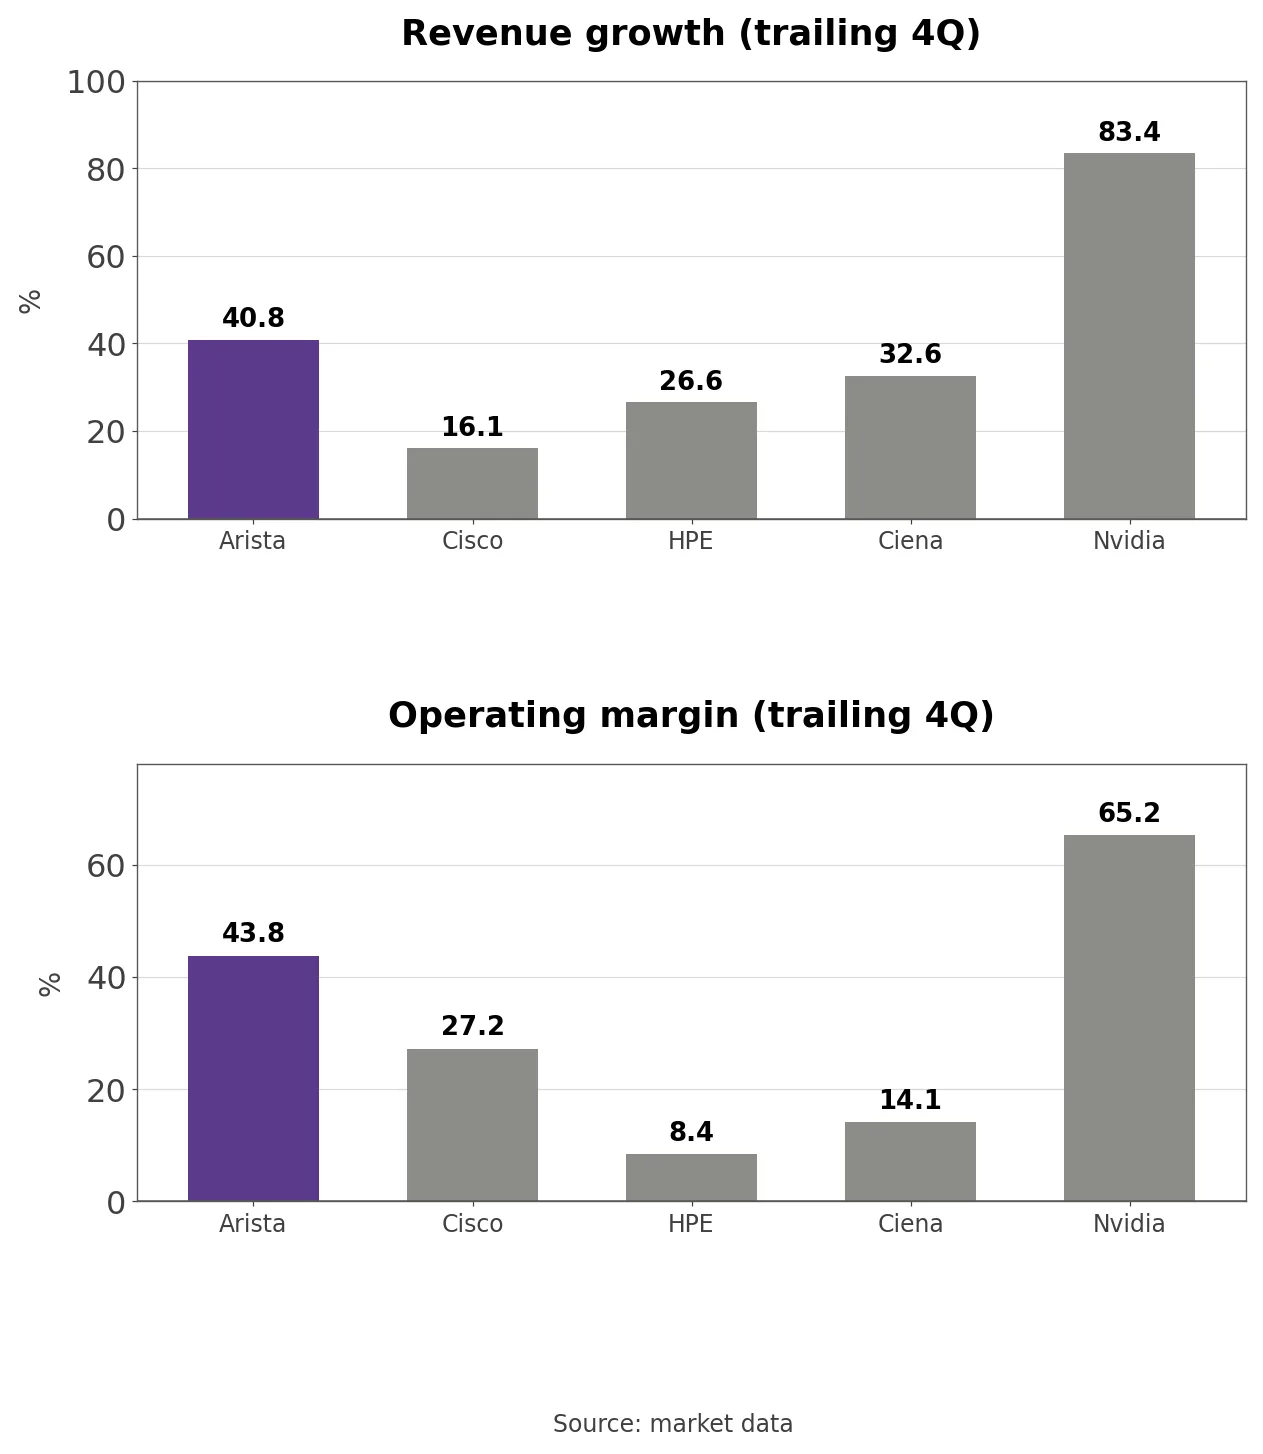
Arista’s trailing four-quarter revenue growth of 40.8% beats Cisco at 16.1%, HPE at 26.6% and Ciena at 32.6%, and trails Nvidia at 83.4%. Its GAAP operating margin of 43.8% is second to Nvidia’s 65.2%, and growth plus margin gives a Rule of 40 score of about 85, with roughly $14.4 billion of cash and investments and no debt. Fiscal years differ, so the trailing periods end between July and October.
Cisco is the long-time leader in campus and data center switching. HPE bought Juniper Networks in 2025, so its growth includes acquired revenue, and its operating margin is 8.4%. Ciena makes the optical gear that links data centers and pairs with Arista in scale-across. Nvidia bundles Spectrum-X Ethernet switches with its GPUs and is Arista’s largest competitor in AI networking, which is why Arista pitches networks that work with any accelerator.
Trailing and forward P/E at Arista and four networking peers
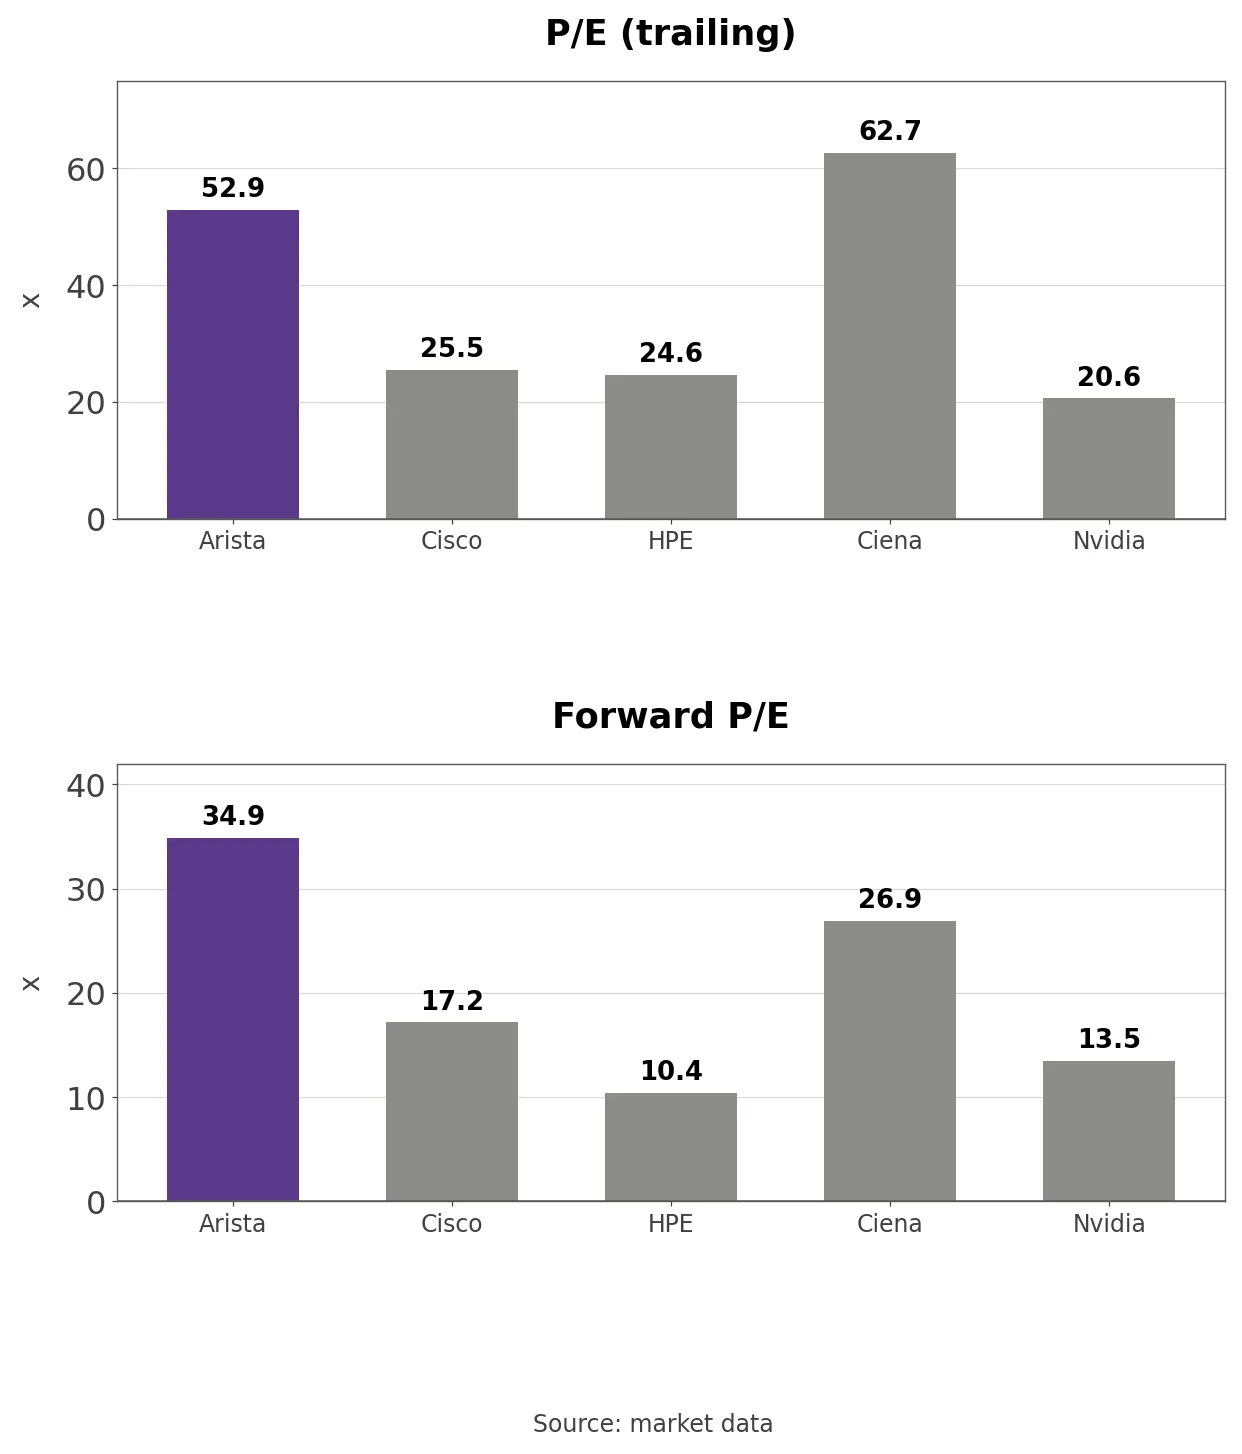
On trailing P/E Arista’s 52.9x is second to Ciena’s 62.7x, and its forward P/E of 34.9x is the highest of the five, against 17.2x for Cisco, 10.4x for HPE and 26.9x for Ciena. Nvidia grows faster at higher margins and trades at 20.6x trailing and 13.5x forward. Growth and margins alone do not explain Arista’s premium, which looks like the price of being the network customers buy when they do not want to depend on Nvidia for everything.
GAAP P/E and Non-GAAP P/E Bands
Arista GAAP P/E and non-GAAP P/E over 60 months
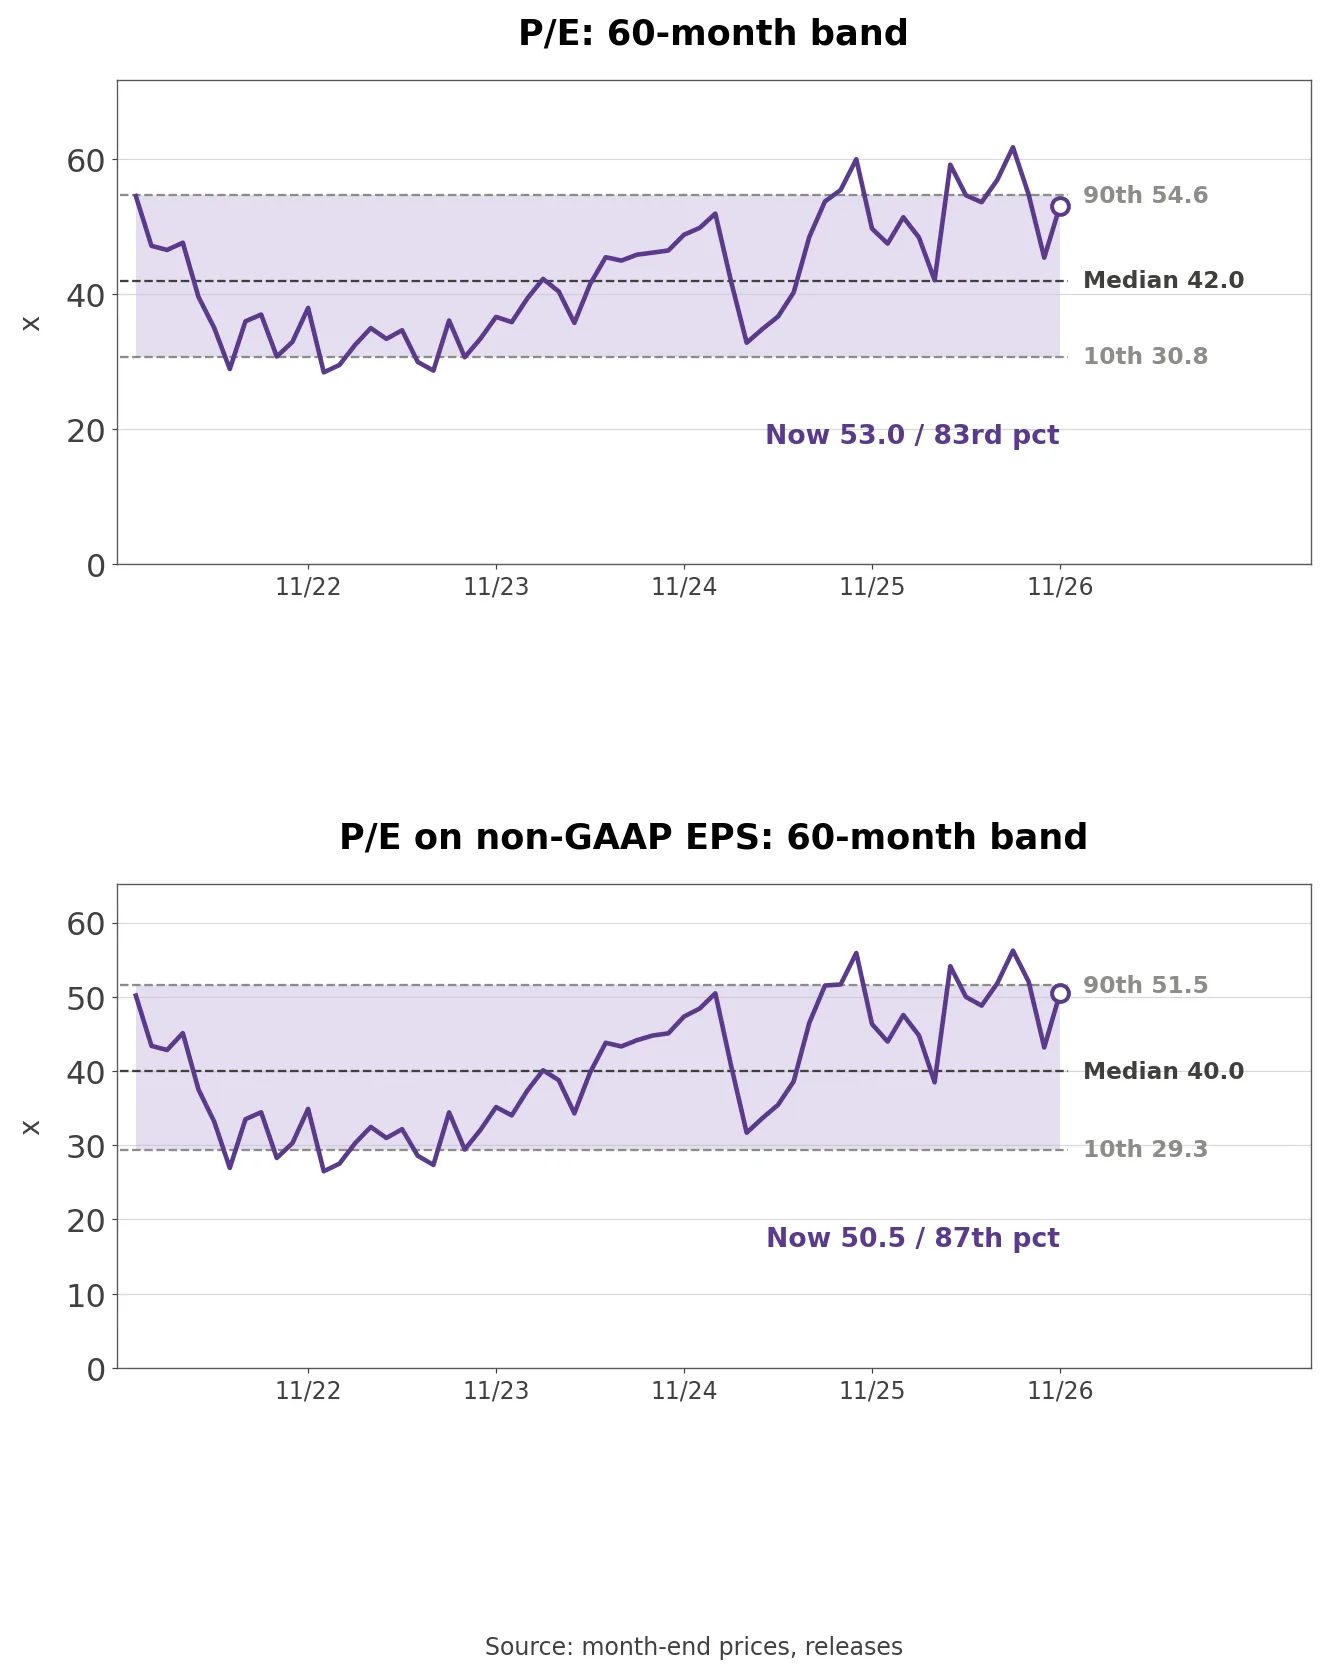
At $197.29, the stock trades at 50.46x trailing non-GAAP EPS of $3.91, the 86.7th percentile of 60 months. Trailing GAAP EPS is $3.72 and the GAAP P/E 53.03x, the 83.3rd percentile. The 60-month medians are 41.98x GAAP and 39.95x non-GAAP. The highs were 61.73x and 56.23x in August 2026 and the lows 28.42x and 26.50x in December 2022.
Own calculation: At the end of November 2025 the stock was $130.68 and the non-GAAP P/E 46.34x. Since then the stock has risen +51.0% while trailing non-GAAP EPS grew +38.7% from $2.82. The multiple expanded only 8.9%, so most of the gain came from earnings.
On 2027 consensus EPS of $6.04 the stock is at 32.7x, and on the guidance-implied $5.94 it is at 33.2x. Third-quarter GAAP EPS of $1.22 exceeded non-GAAP EPS of $1.20 because a $134.5 million investment gain counts only under GAAP. Quarterly EPS is split-adjusted and uses restated non-GAAP figures where later releases revised them.
Three Conditions That Move the Stock
The deferred revenue balance shows where revenue is coming from. If new deferrals exceed releases in the fourth quarter and the balance grows again, the third-quarter dip becomes a matter of acceptance timing. Two quarters of decline in a row would support the reading that much of the growth was drawn from inventory already shipped.
Non-GAAP gross margin shows what the commitments cost. If inventory rises past $3.210 billion while margin holds inside the 63% to 64% fourth-quarter guide, the inventory is following demand. A margin below 62% would retrace the 2022 path toward 60.3%.
AI infrastructure trading moves the multiple. On November 5 the S&P 500 fell -4.4% and Arista fell -10.8%. Trefis argued on November 6 that peers fell together that day and that the selling was sector-wide rather than about Arista’s results. The S&P 500 move is confirmed from FRED closes and the peer moves were not checked.
Will $9.3 Billion of Parts Become Sales or Inventory?
The gap between $9.3 billion of parts due within 12 months and the estimated $6.845 billion of 2027 cost of revenue is $2.455 billion. Cost of revenue also includes contract manufacturing, freight and service costs, so the gap on parts alone is larger. It closes in one of three ways: revenue above guidance, more inventory, or higher part prices such as memory inflating the dollar value of commitments.
The 22-quarter record of beating guidance and the $18.75 billion 2027 consensus lean toward the first. The 10-Q does not say how much of the commitment value is price rather than volume. Shouldn’t the size and pricing terms of the multi-year memory agreement in the 10-K be the first thing to check?