Ciena (CIEN) Stock Analysis: Can Growth Catch the Price?
by Global Stock Brief2026. 9. 1.
Ciena (CIEN): growth arrived, but the price ran first
Ciena (NYSE: CIEN) stock analysis has become a study in two very different speeds. The business is moving quickly: fiscal second-quarter revenue rose 39.5%, margins recovered, and free cash flow reached $218.7 million.
Ciena fiscal Q2 2026 earnings presentation, cover (source: company filing, June 4, 2026)
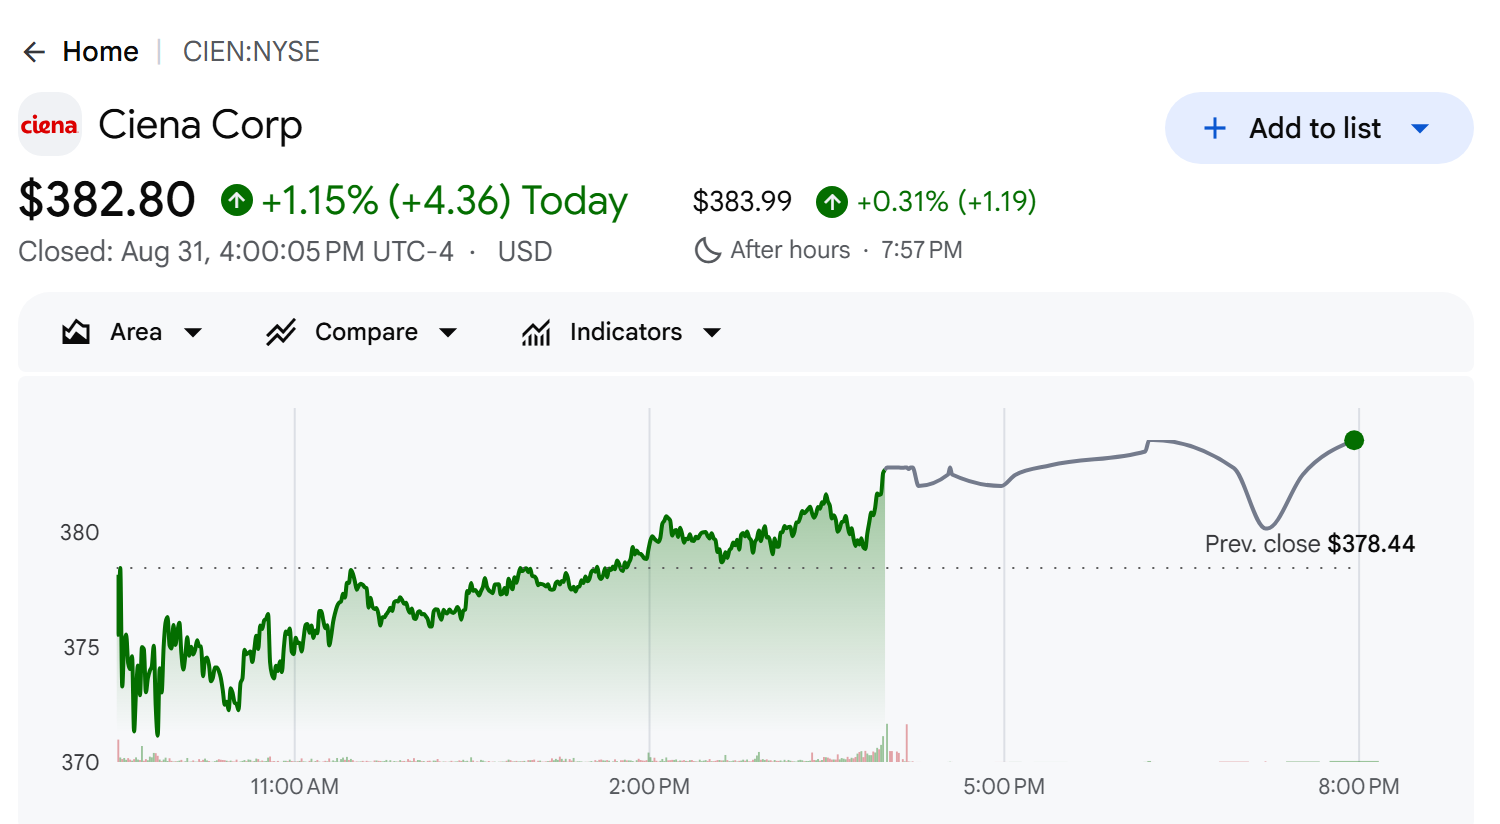
The stock moved faster. At the August 31 close of $382.80, Ciena carried a $54.19 billion market value and traded at 9.73 times trailing revenue. The question is no longer whether demand has improved. It is whether the next several years of growth can catch a valuation that already assumes a great deal of success.
Ciena (CIEN) intraday chart, August 31, 2026 close and after-hours quote (source: Google Finance capture)
Ciena at a Glance
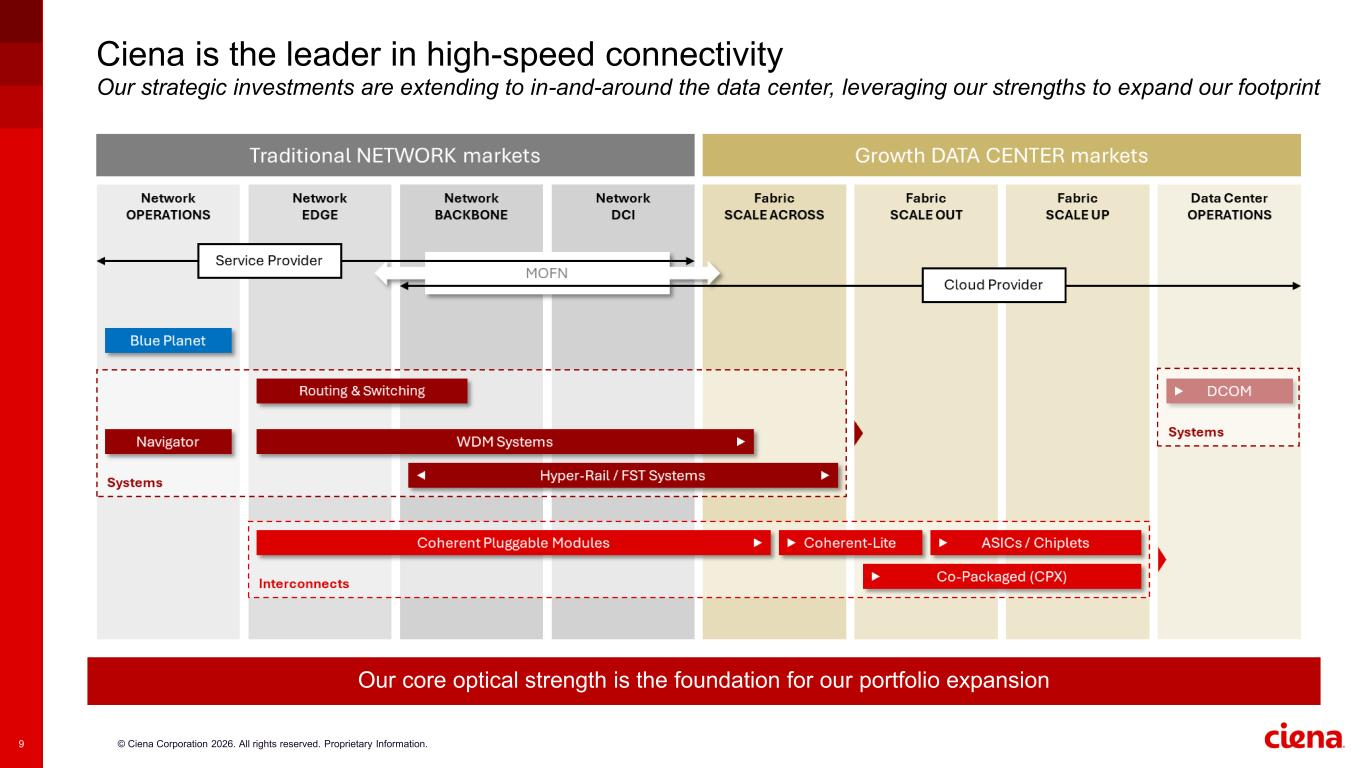
Ciena builds the equipment and software that move large amounts of data across telecom and cloud networks. Its strongest position is in optical networking, where coherent optics allow carriers and data-center operators to send more traffic through existing fiber. Routing, switching, network-control software, maintenance, deployment, and advisory services round out the portfolio.
Ciena's position across optical, routing, switching, and automation (source: company earnings presentation)
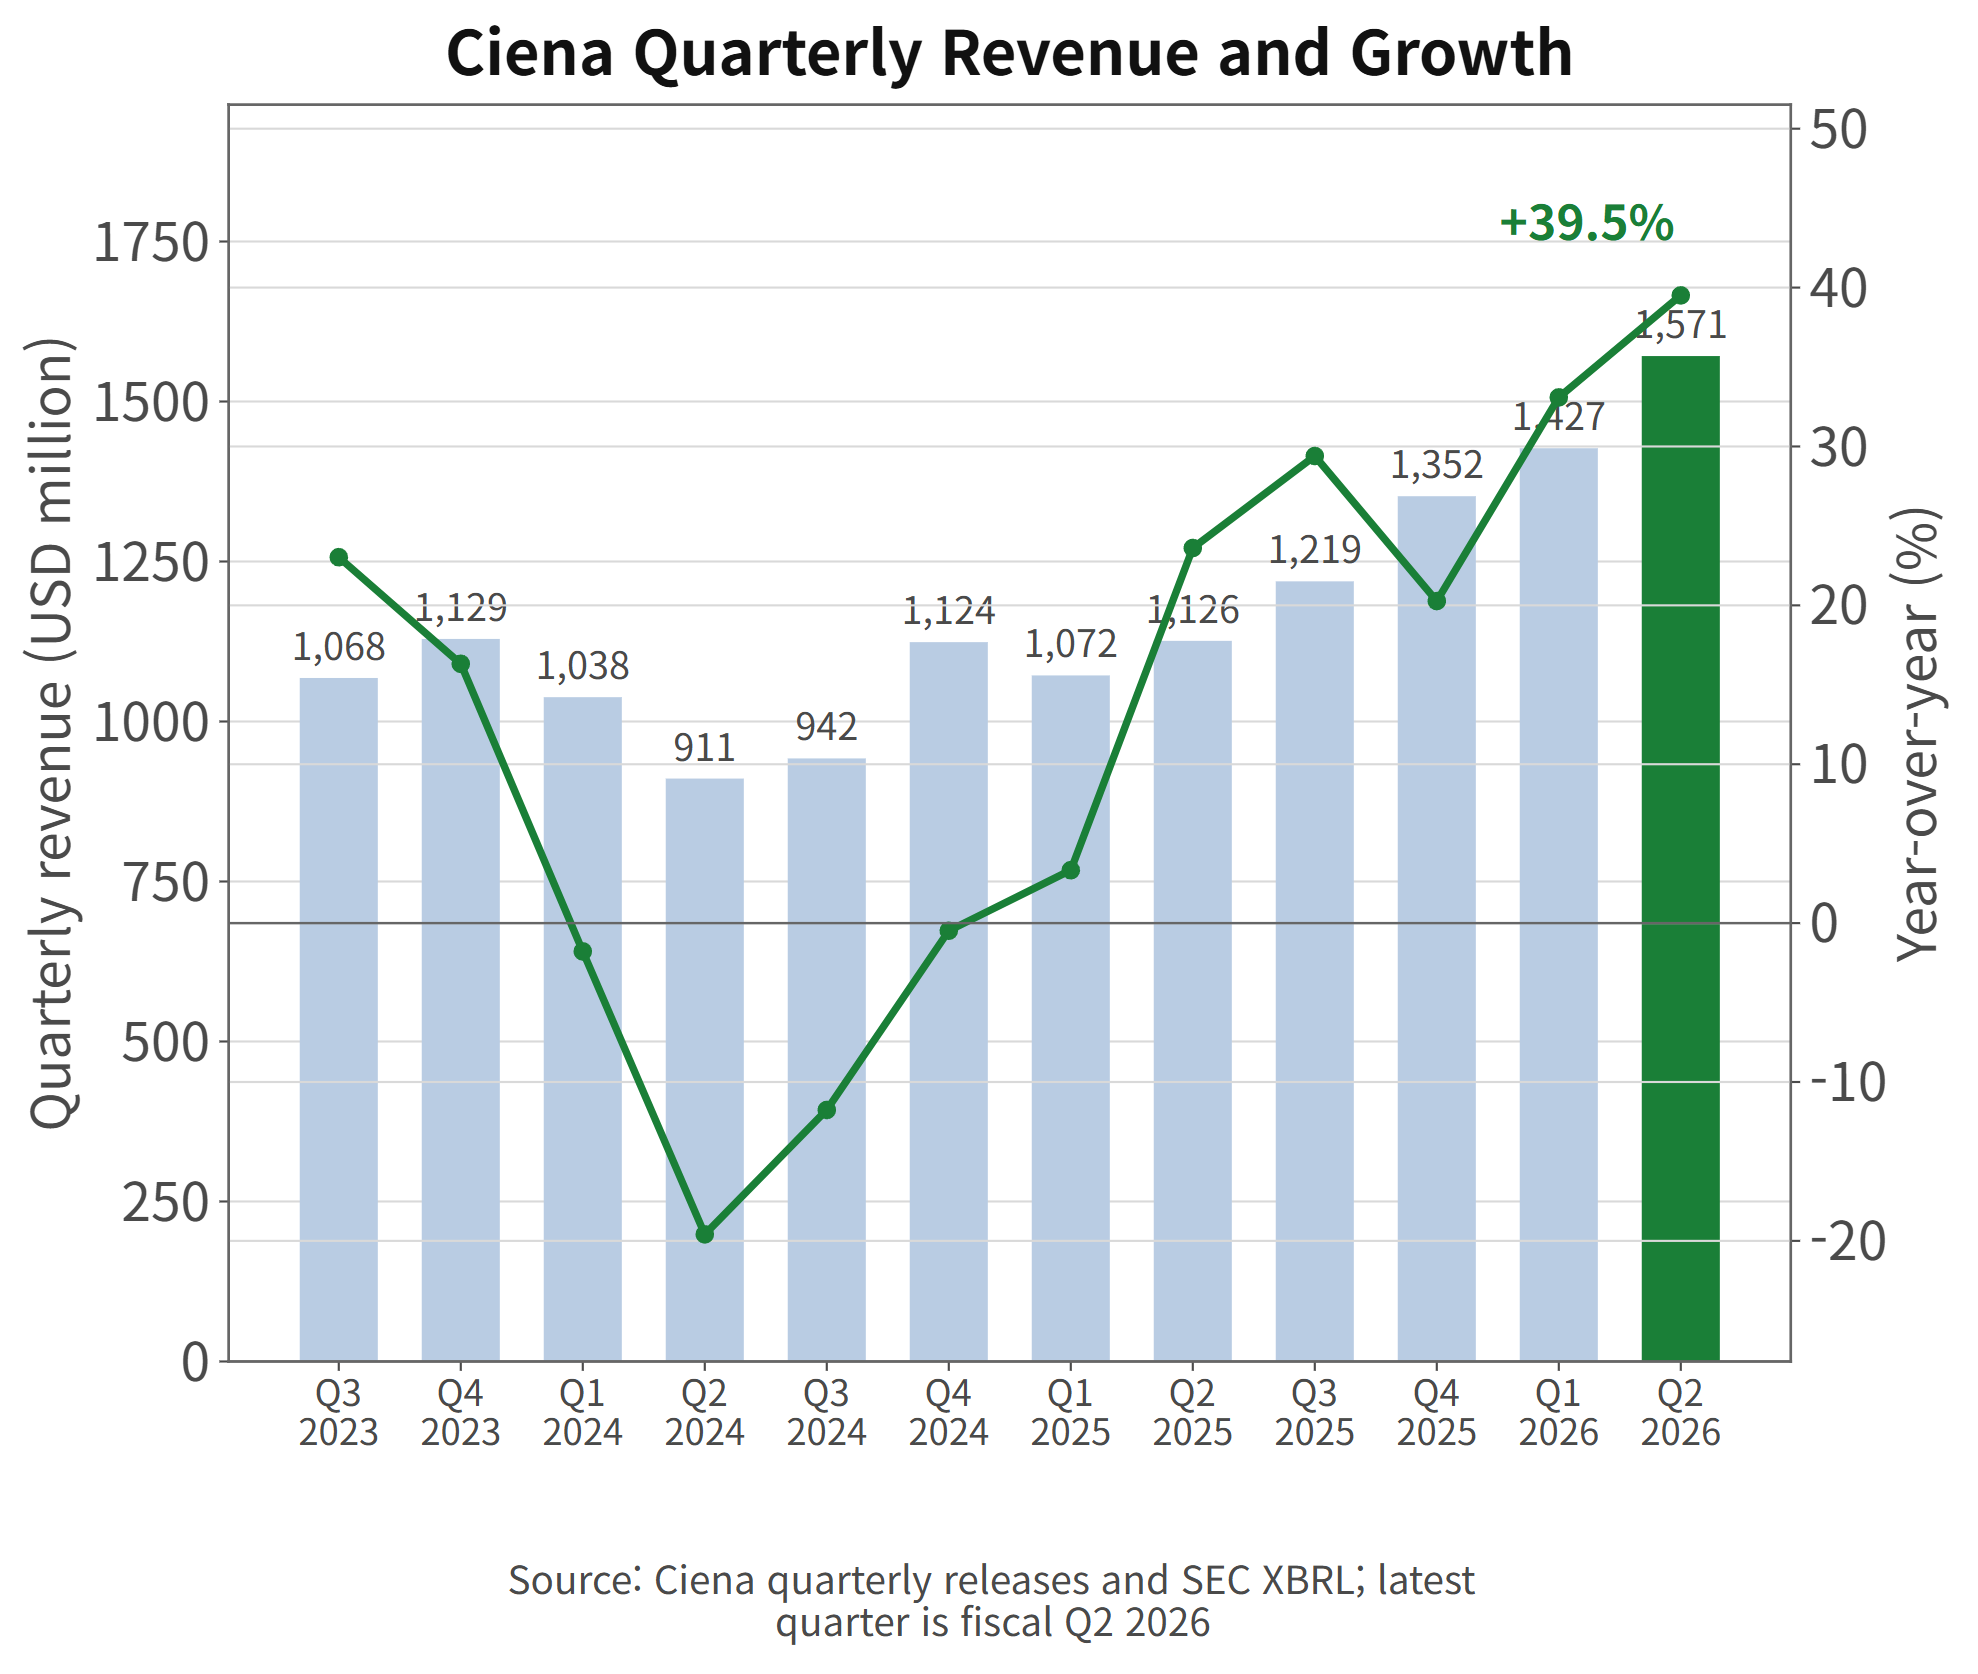
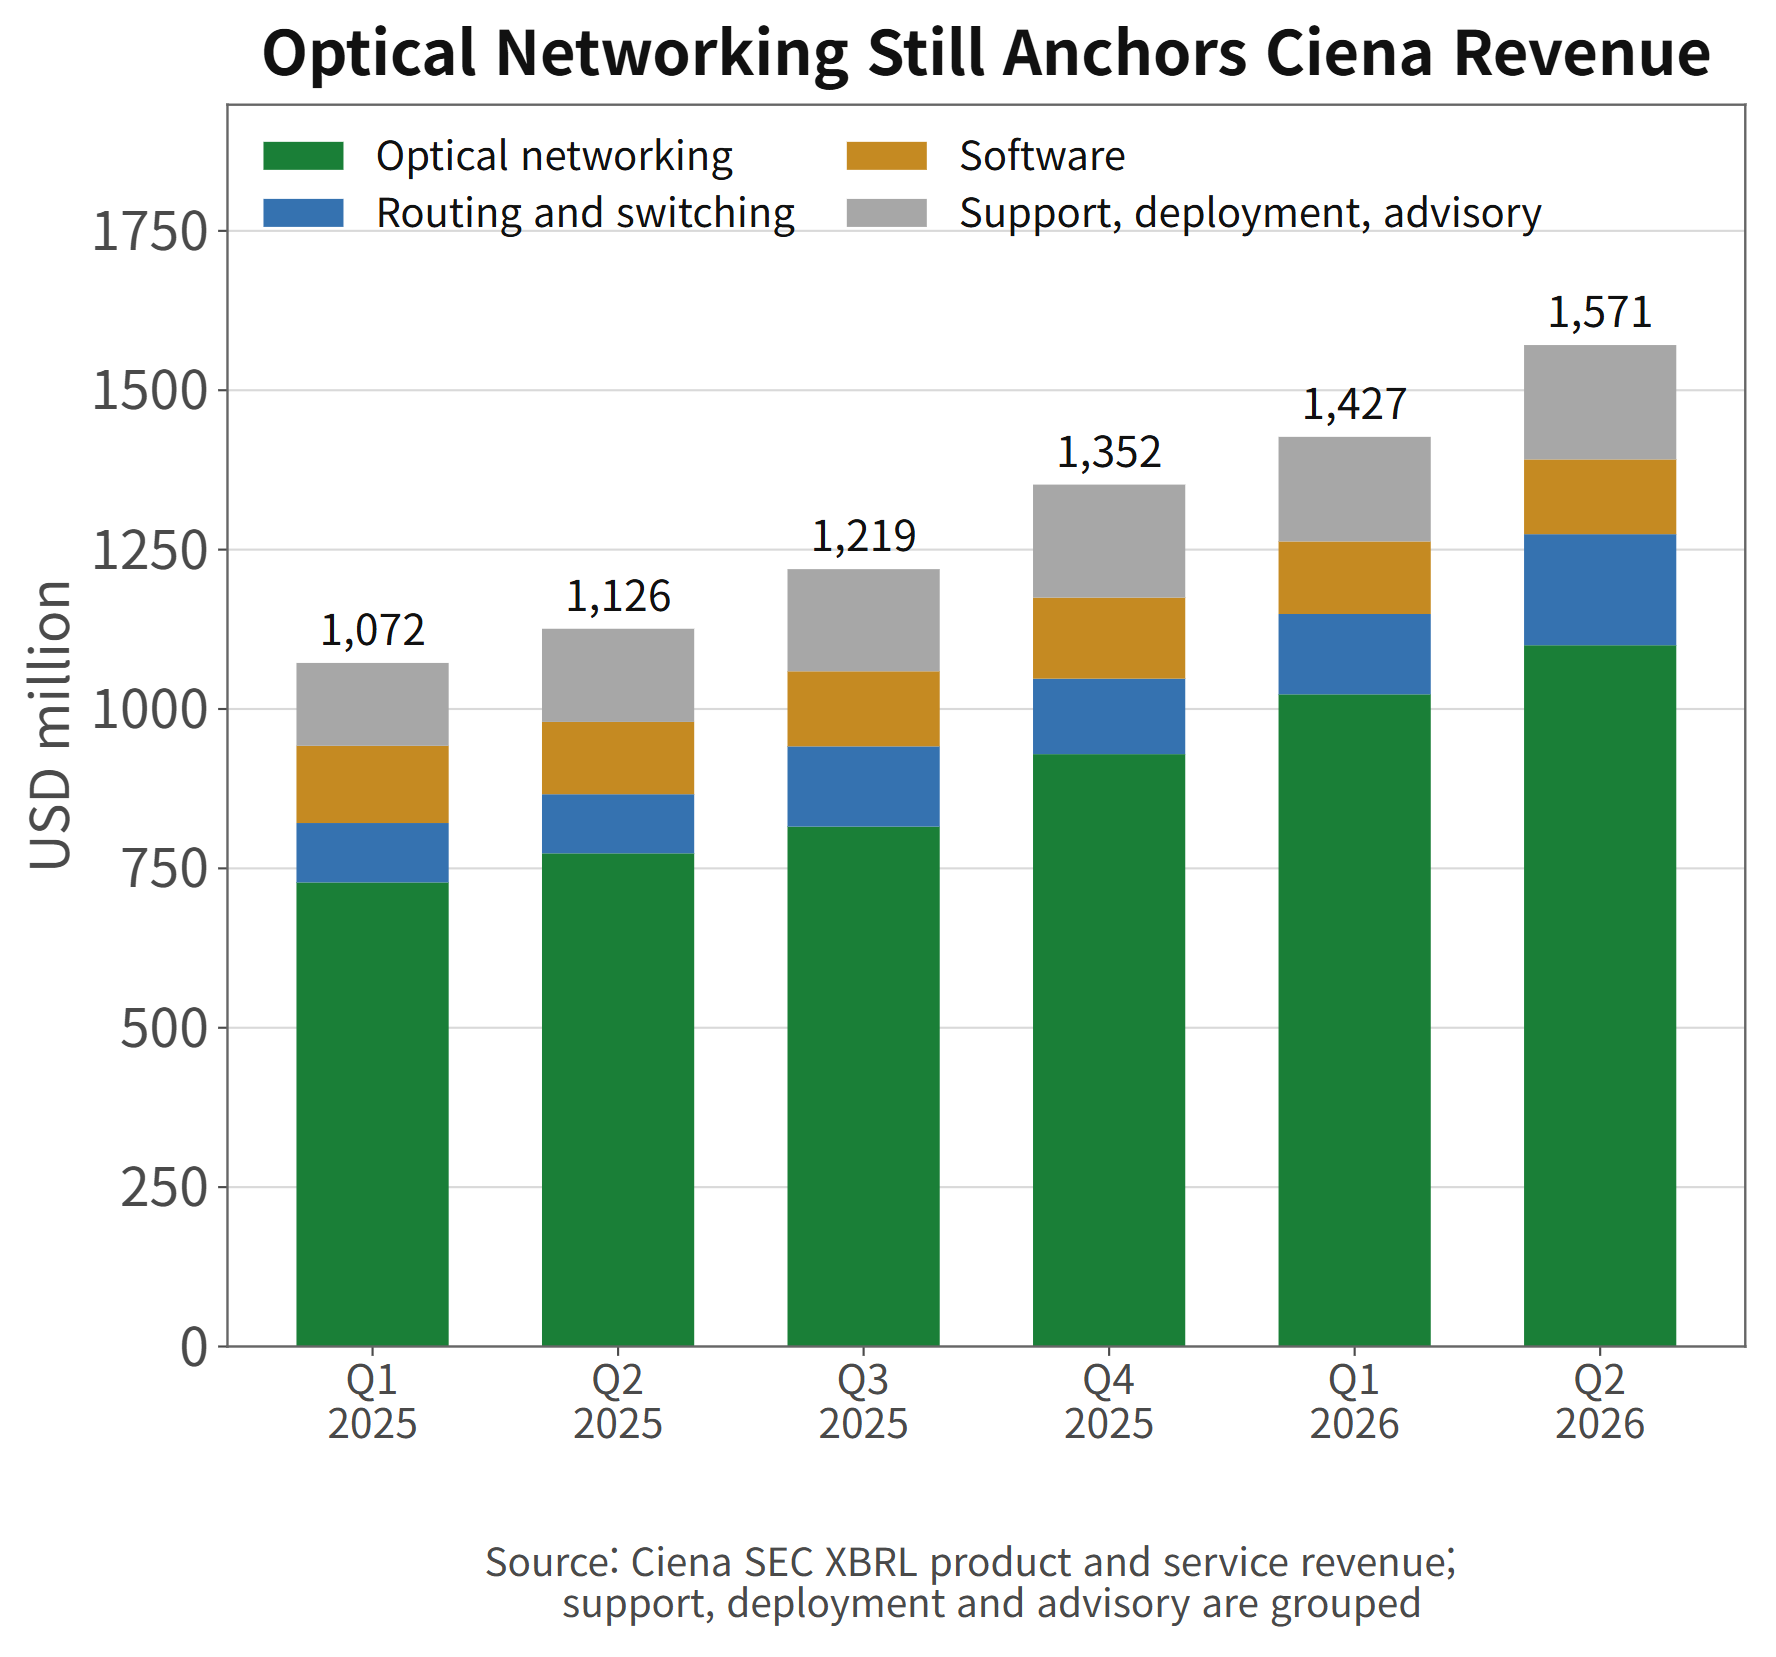
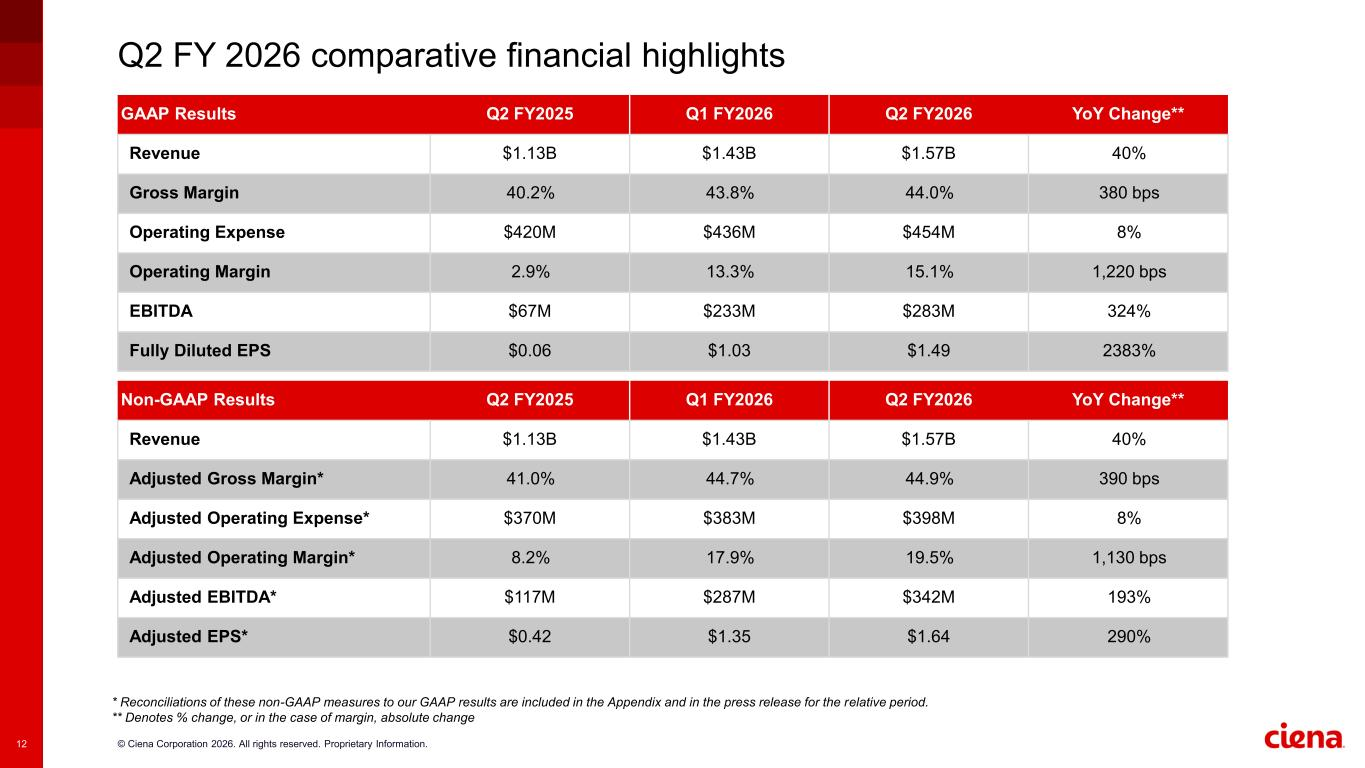
The fiscal second quarter ended May 2, 2026. Revenue reached $1.571 billion, up 39.5% from a year earlier. GAAP earnings were $1.49 per share, while adjusted earnings were $1.64 per share, up roughly 290%. Those results were not a one-quarter rebound from an unusually weak comparison alone. Quarterly revenue has now climbed from $1.072 billion in fiscal Q1 2025 to $1.571 billion five quarters later.
Ciena quarterly revenue and year-over-year growth
Fiscal Q2 2026
Result
Year-earlier result
Revenue
$1.571B
$1.126B
GAAP gross margin
44.0%
40.2%
GAAP operating margin
15.2%
3.1%
Free cash flow
$218.7M
$128.2M
Adjusted EPS
$1.64
$0.42
The broad shape is favorable: sales, margins, earnings, and cash generation improved together. That matters because Ciena's previous upcycles did not always translate cleanly into operating leverage. This time they did.
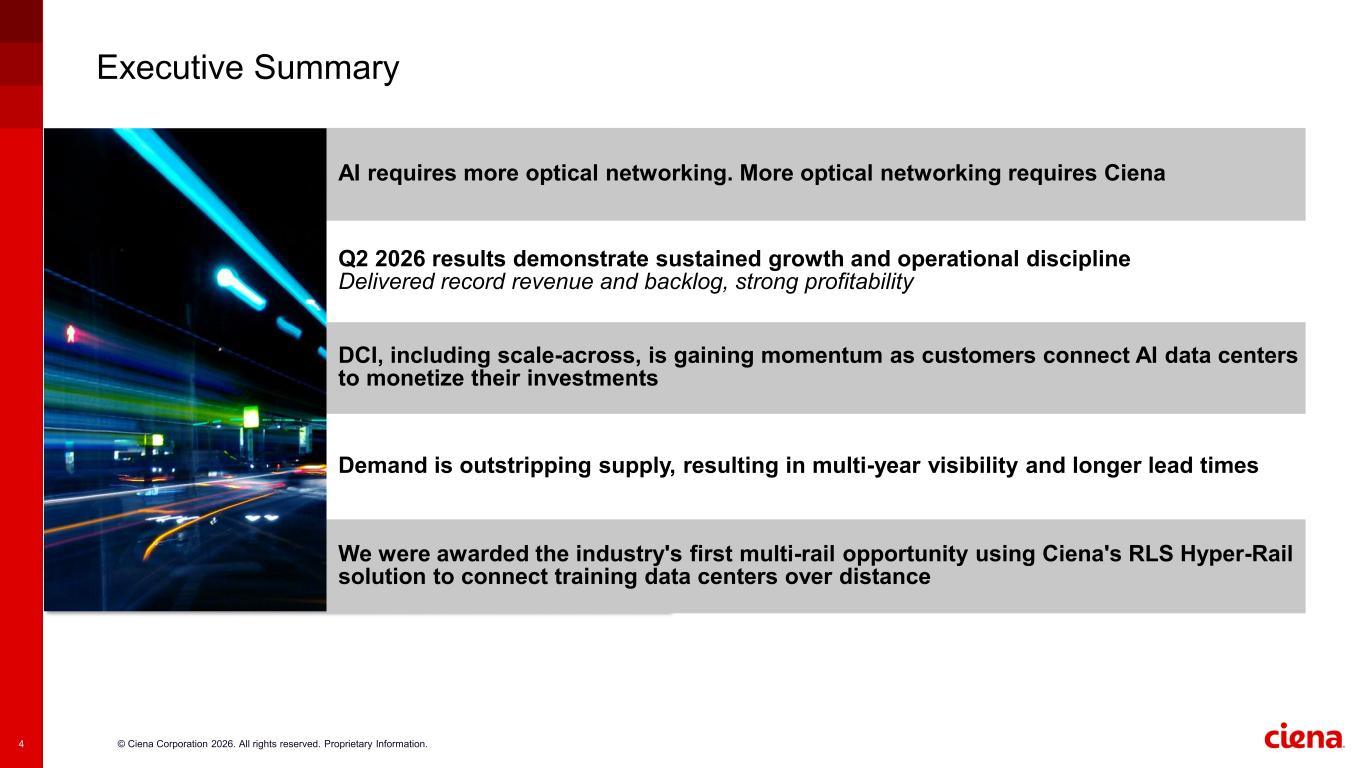
Ciena's fiscal Q2 2026 executive summary (source: company earnings presentation)
What Does Ciena Sell?
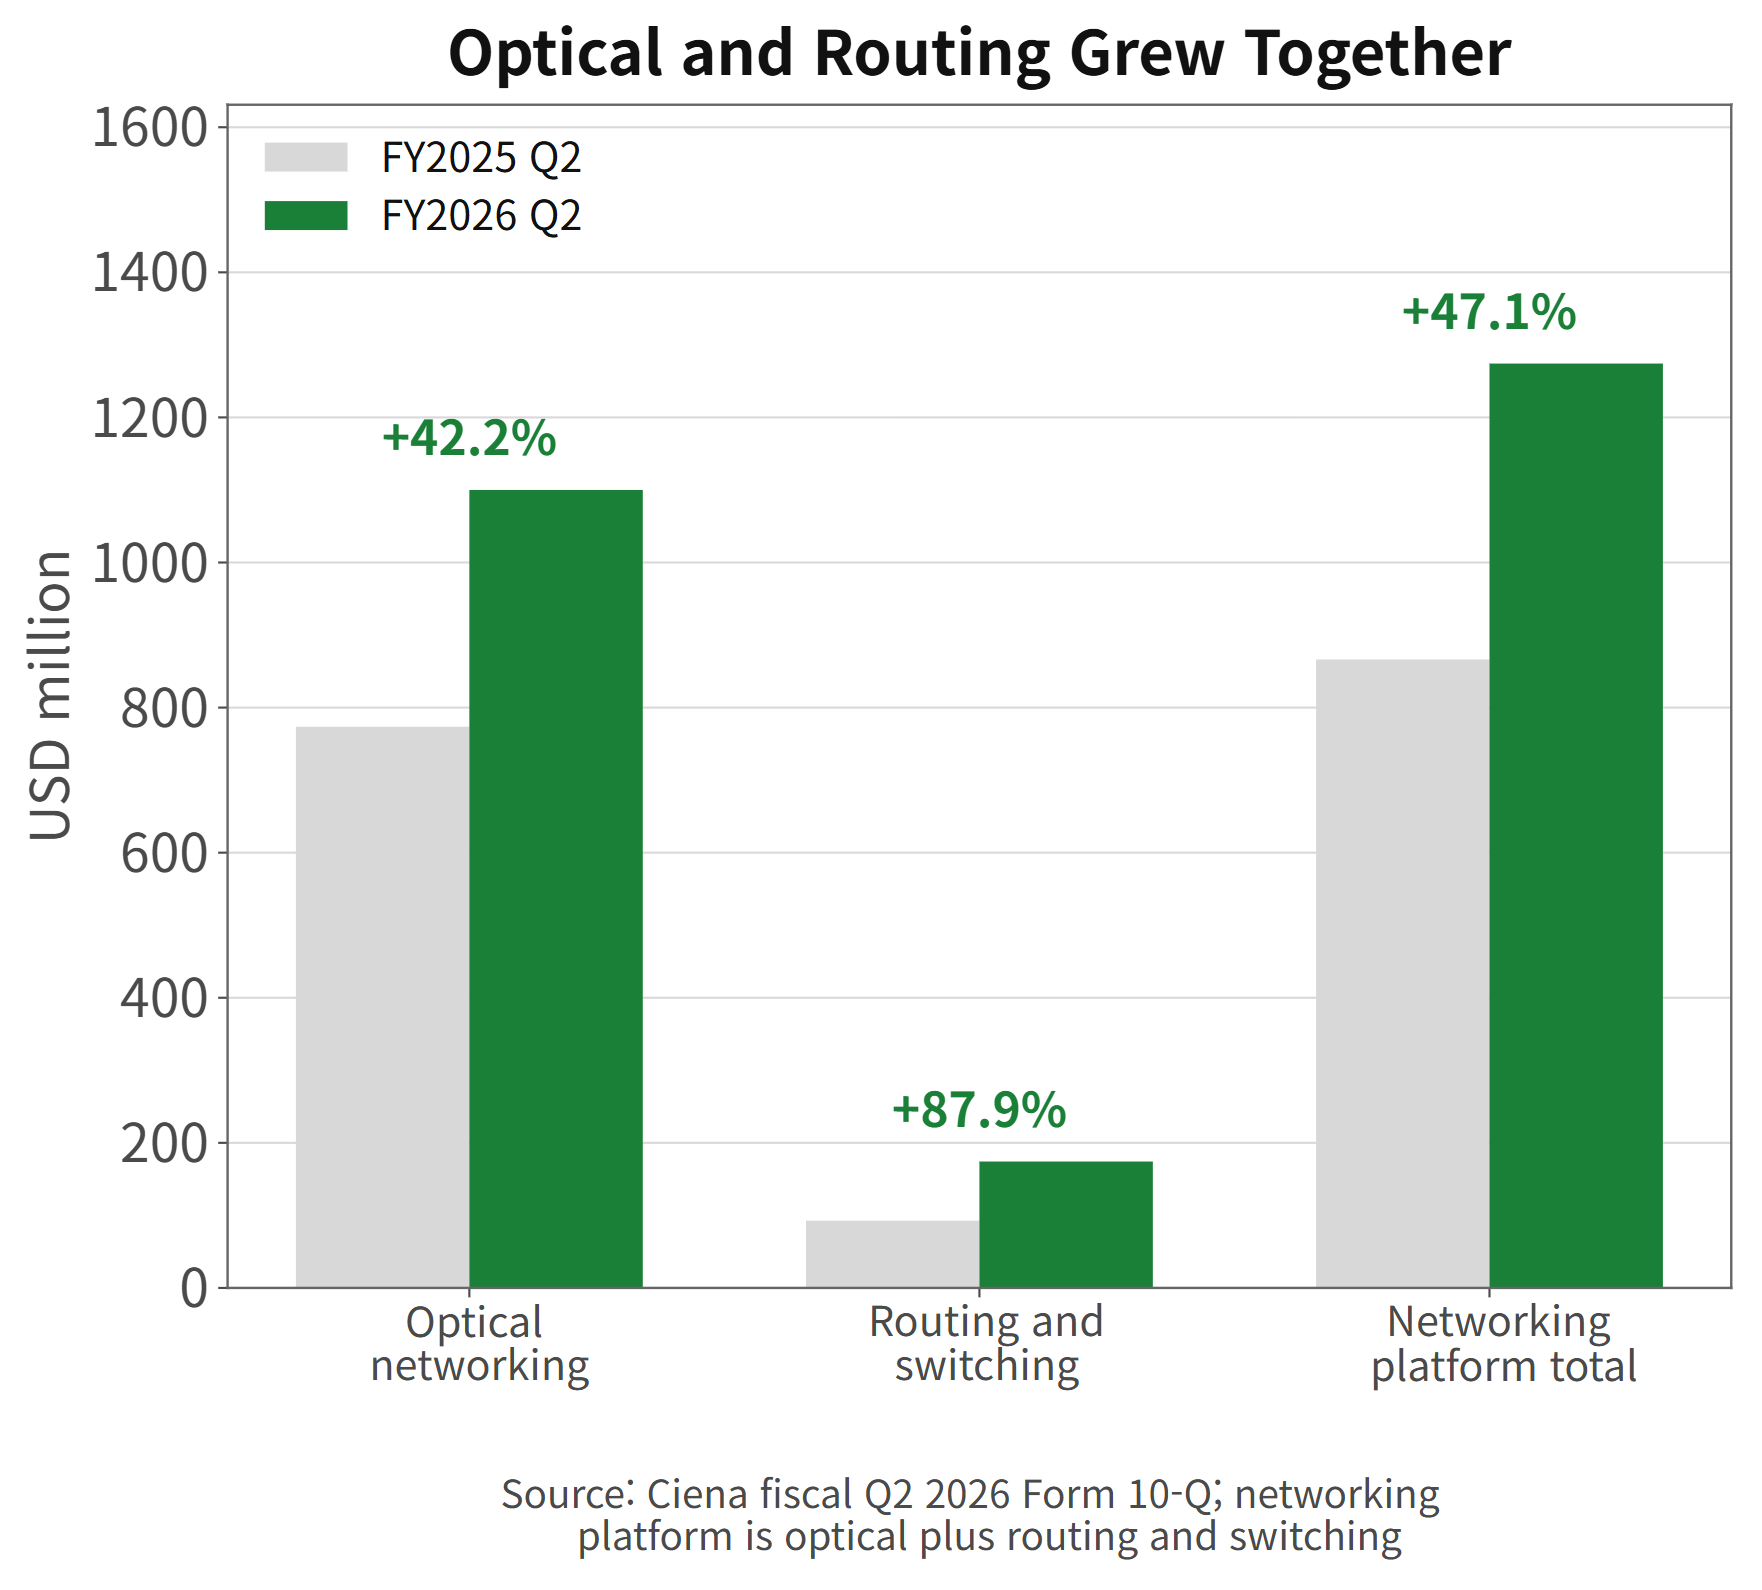
Optical networking still does most of the work. The segment generated $1.100 billion in the latest quarter, about 70% of company revenue and 42.2% more than a year earlier. Routing and switching grew even faster, rising 87.9% to $174.2 million. Combined, those two networking-platform categories produced $1.274 billion, up 47.1%.
Ciena revenue mix over the latest six quarters
Software and services are useful, but they do not turn Ciena into a software-style recurring-revenue company. Platform software and services contributed $93.9 million, Blue Planet automation software and services $23.4 million, maintenance and training $89.3 million, implementation $79.7 million, and advisory services $10.4 million. The economic engine remains hardware-led network capacity, with software helping customers operate that capacity more efficiently.
Optical and routing-platform revenue, fiscal Q2 2025 against fiscal Q2 2026
That distinction matters for valuation. Optical systems can enjoy long replacement cycles and powerful demand bursts, yet orders remain exposed to customer budgets, deployment timing, component availability, and inventory digestion. A dollar of cyclical equipment revenue should not automatically receive the same multiple as a dollar of contracted software revenue.
Ciena product-family revenue mix (source: company earnings presentation)
Management said direct cloud revenue grew about 70%, while service-provider revenue rose roughly 28%. Reconfigurable line systems and the Waveserver platform grew about 55%. The mix tells us that Ciena is benefiting from two related spending pools: the interconnection of large data centers and upgrades inside carrier networks that must carry the resulting traffic.
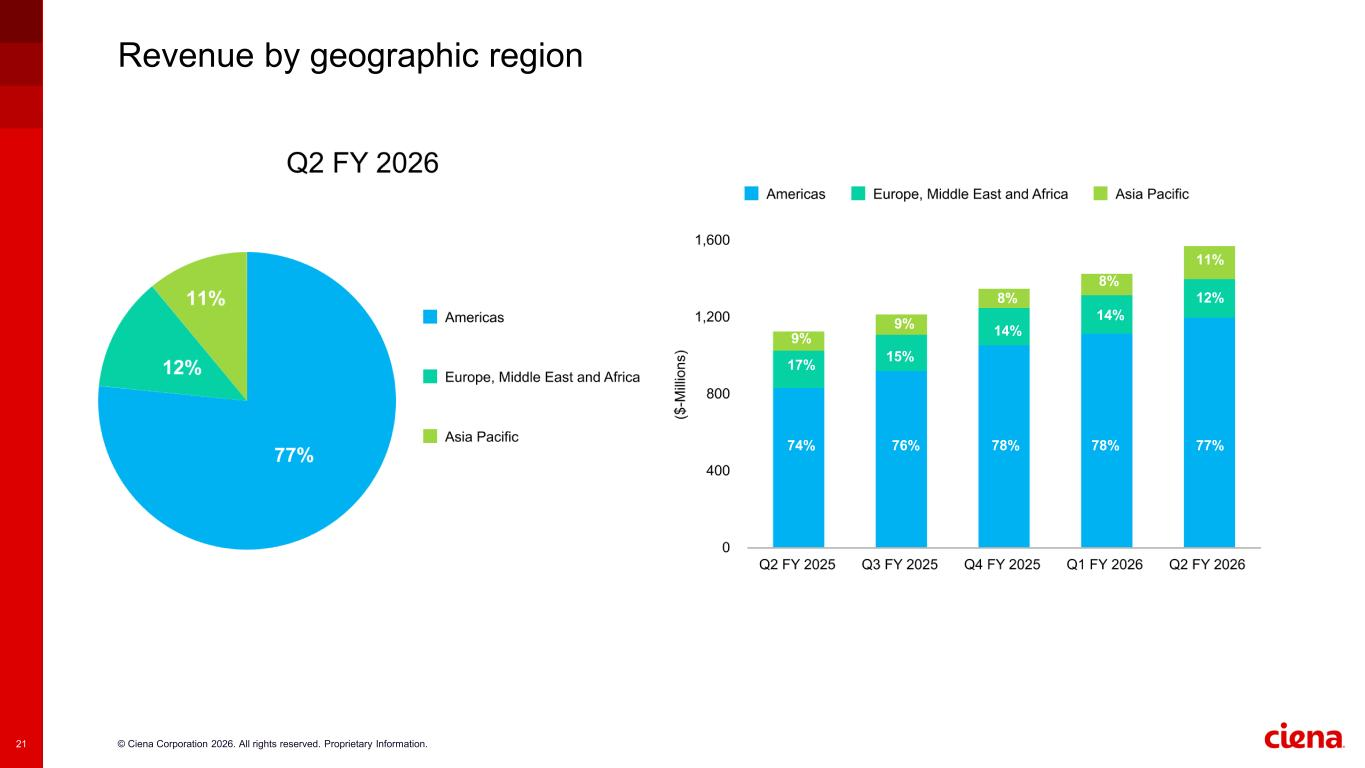
Ciena revenue by customer and geography (source: company earnings presentation)
Where the Orders Are Coming From
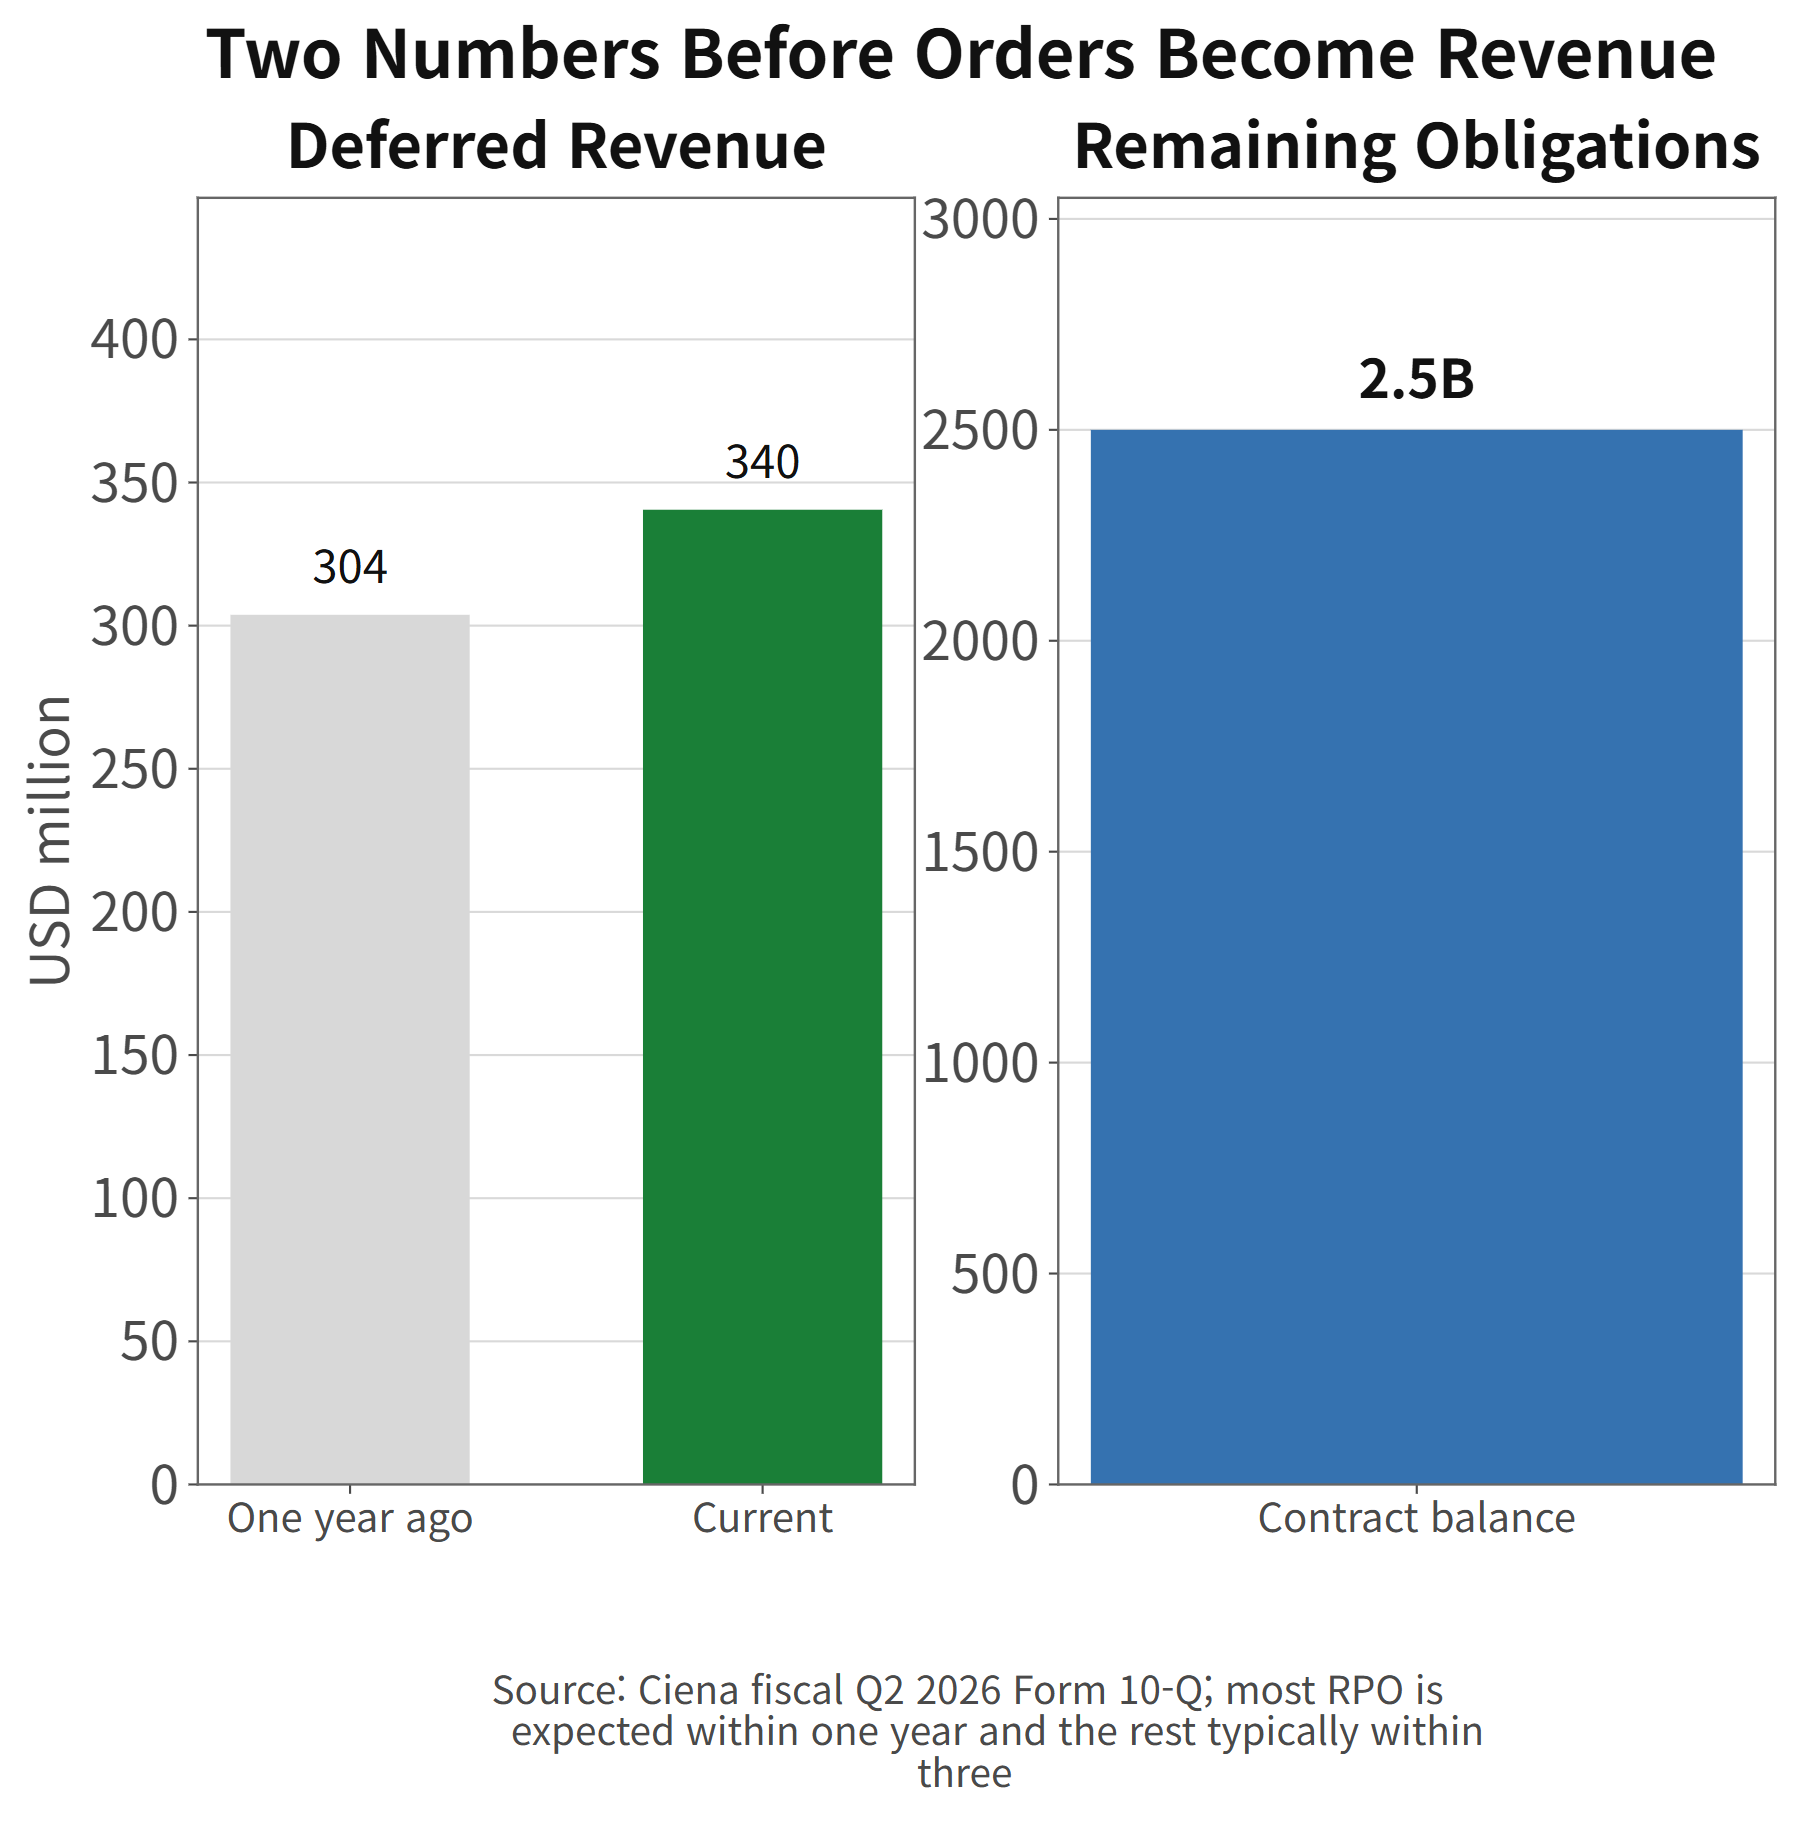
The demand evidence extends beyond reported revenue. Remaining performance obligations stood near $2.5 billion, and deferred revenue increased to $340.5 million from $303.8 million a year earlier. These figures are not interchangeable with a conventional backlog, but together they show that a meaningful amount of contracted work has yet to reach the income statement.
Deferred revenue and remaining performance obligations
Management expects most remaining performance obligations to be recognized within one year, with the balance generally recognized within three. That gives the company some visibility, though not immunity from shipment timing or customer rescheduling.
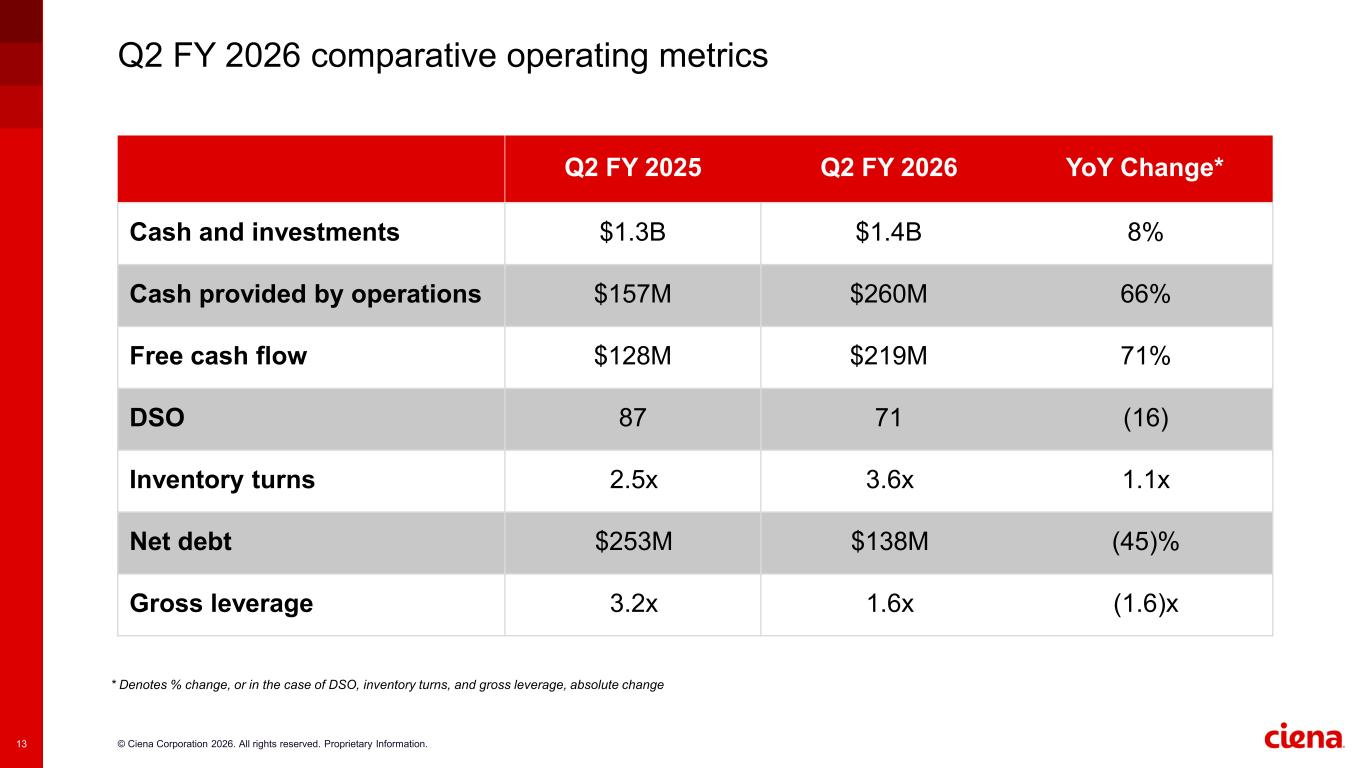
Ciena operating metrics and demand indicators (source: company earnings presentation)
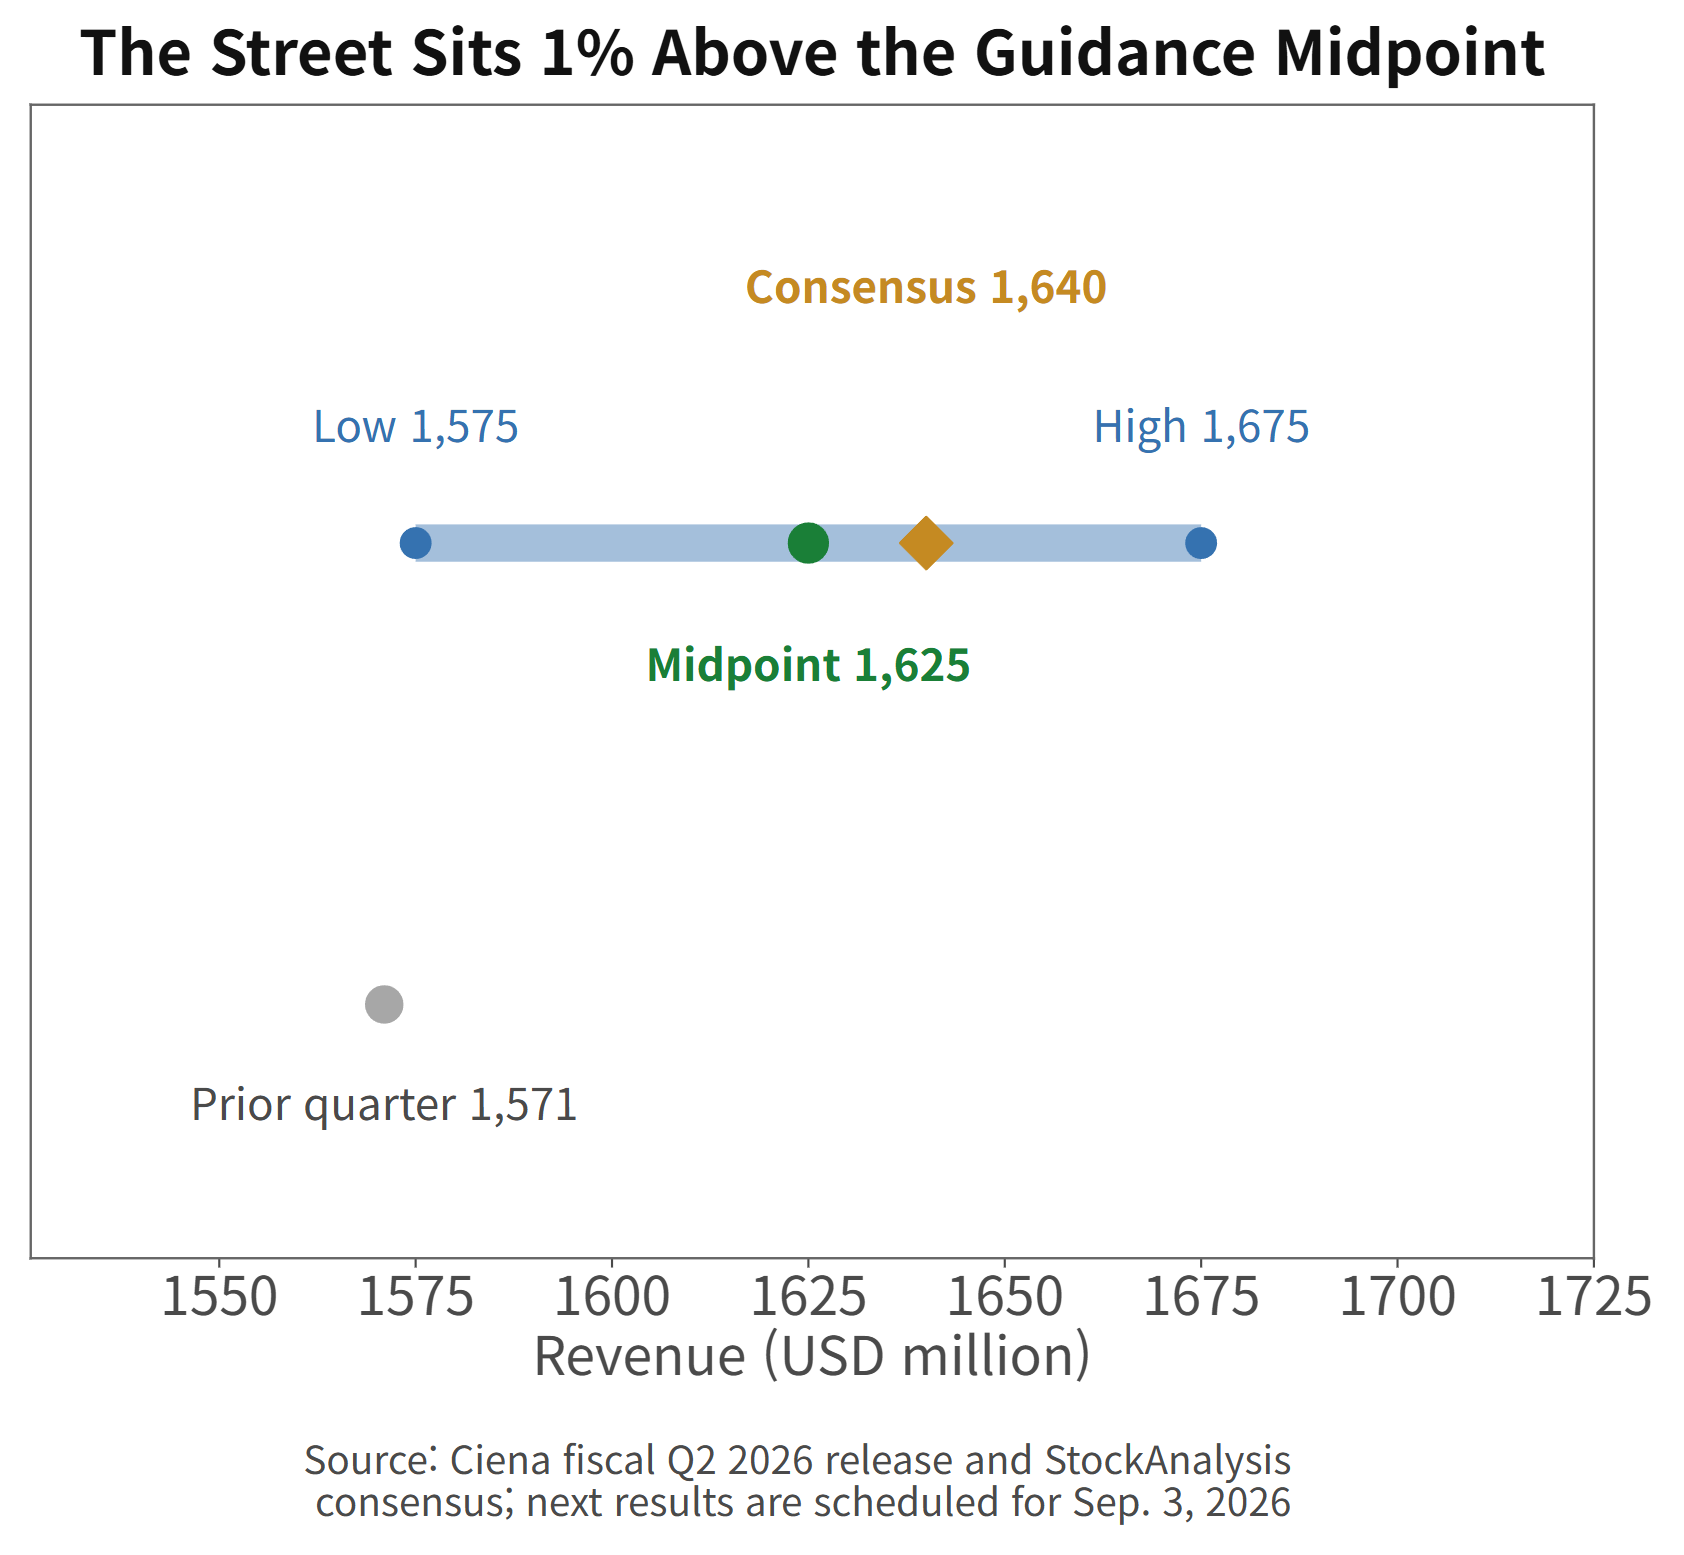
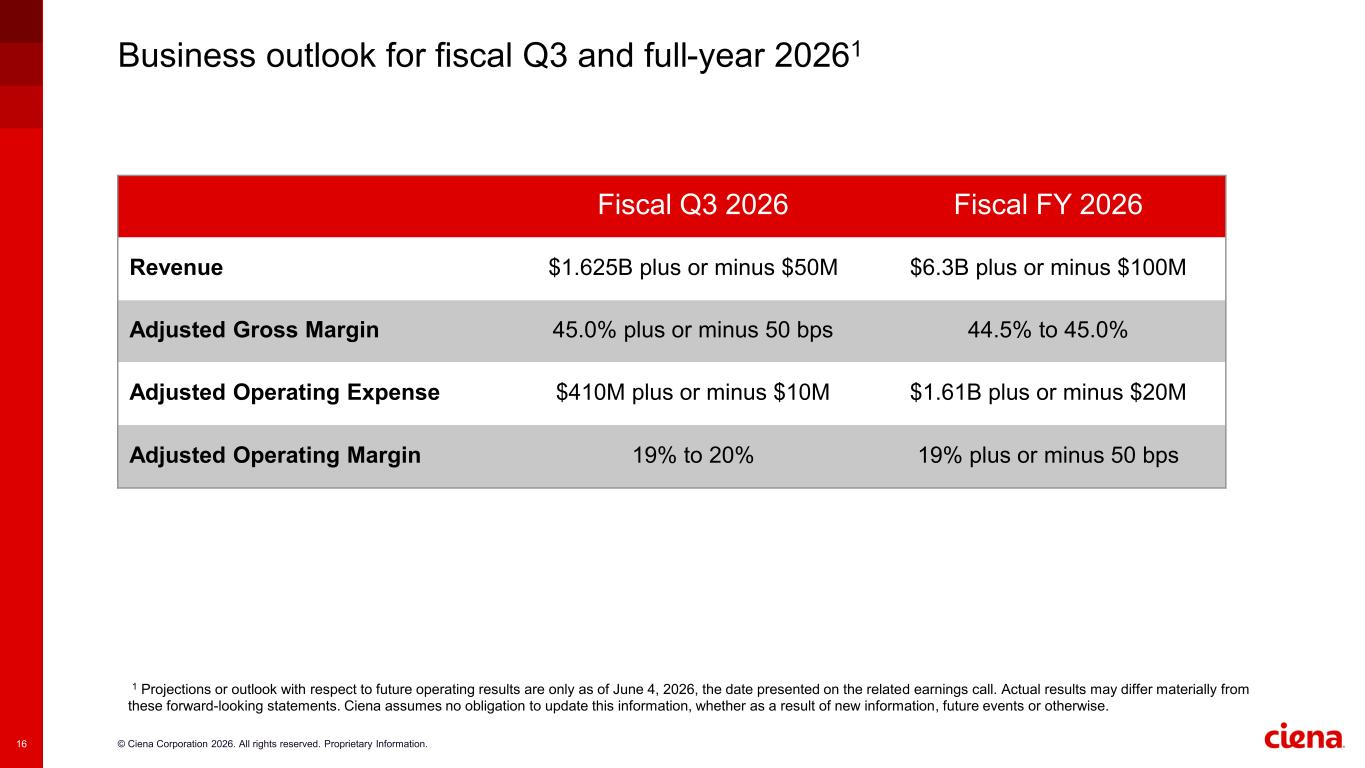
The next-quarter outlook is firm rather than spectacular relative to the market's expectations. Ciena guided to fiscal Q3 revenue of $1.575 billion to $1.675 billion. The $1.625 billion midpoint sits about 1% below the $1.640 billion consensus available on August 31. Full-year guidance is $6.2 billion to $6.4 billion, with a $6.3 billion midpoint.
Ciena fiscal Q3 revenue guidance against consensus
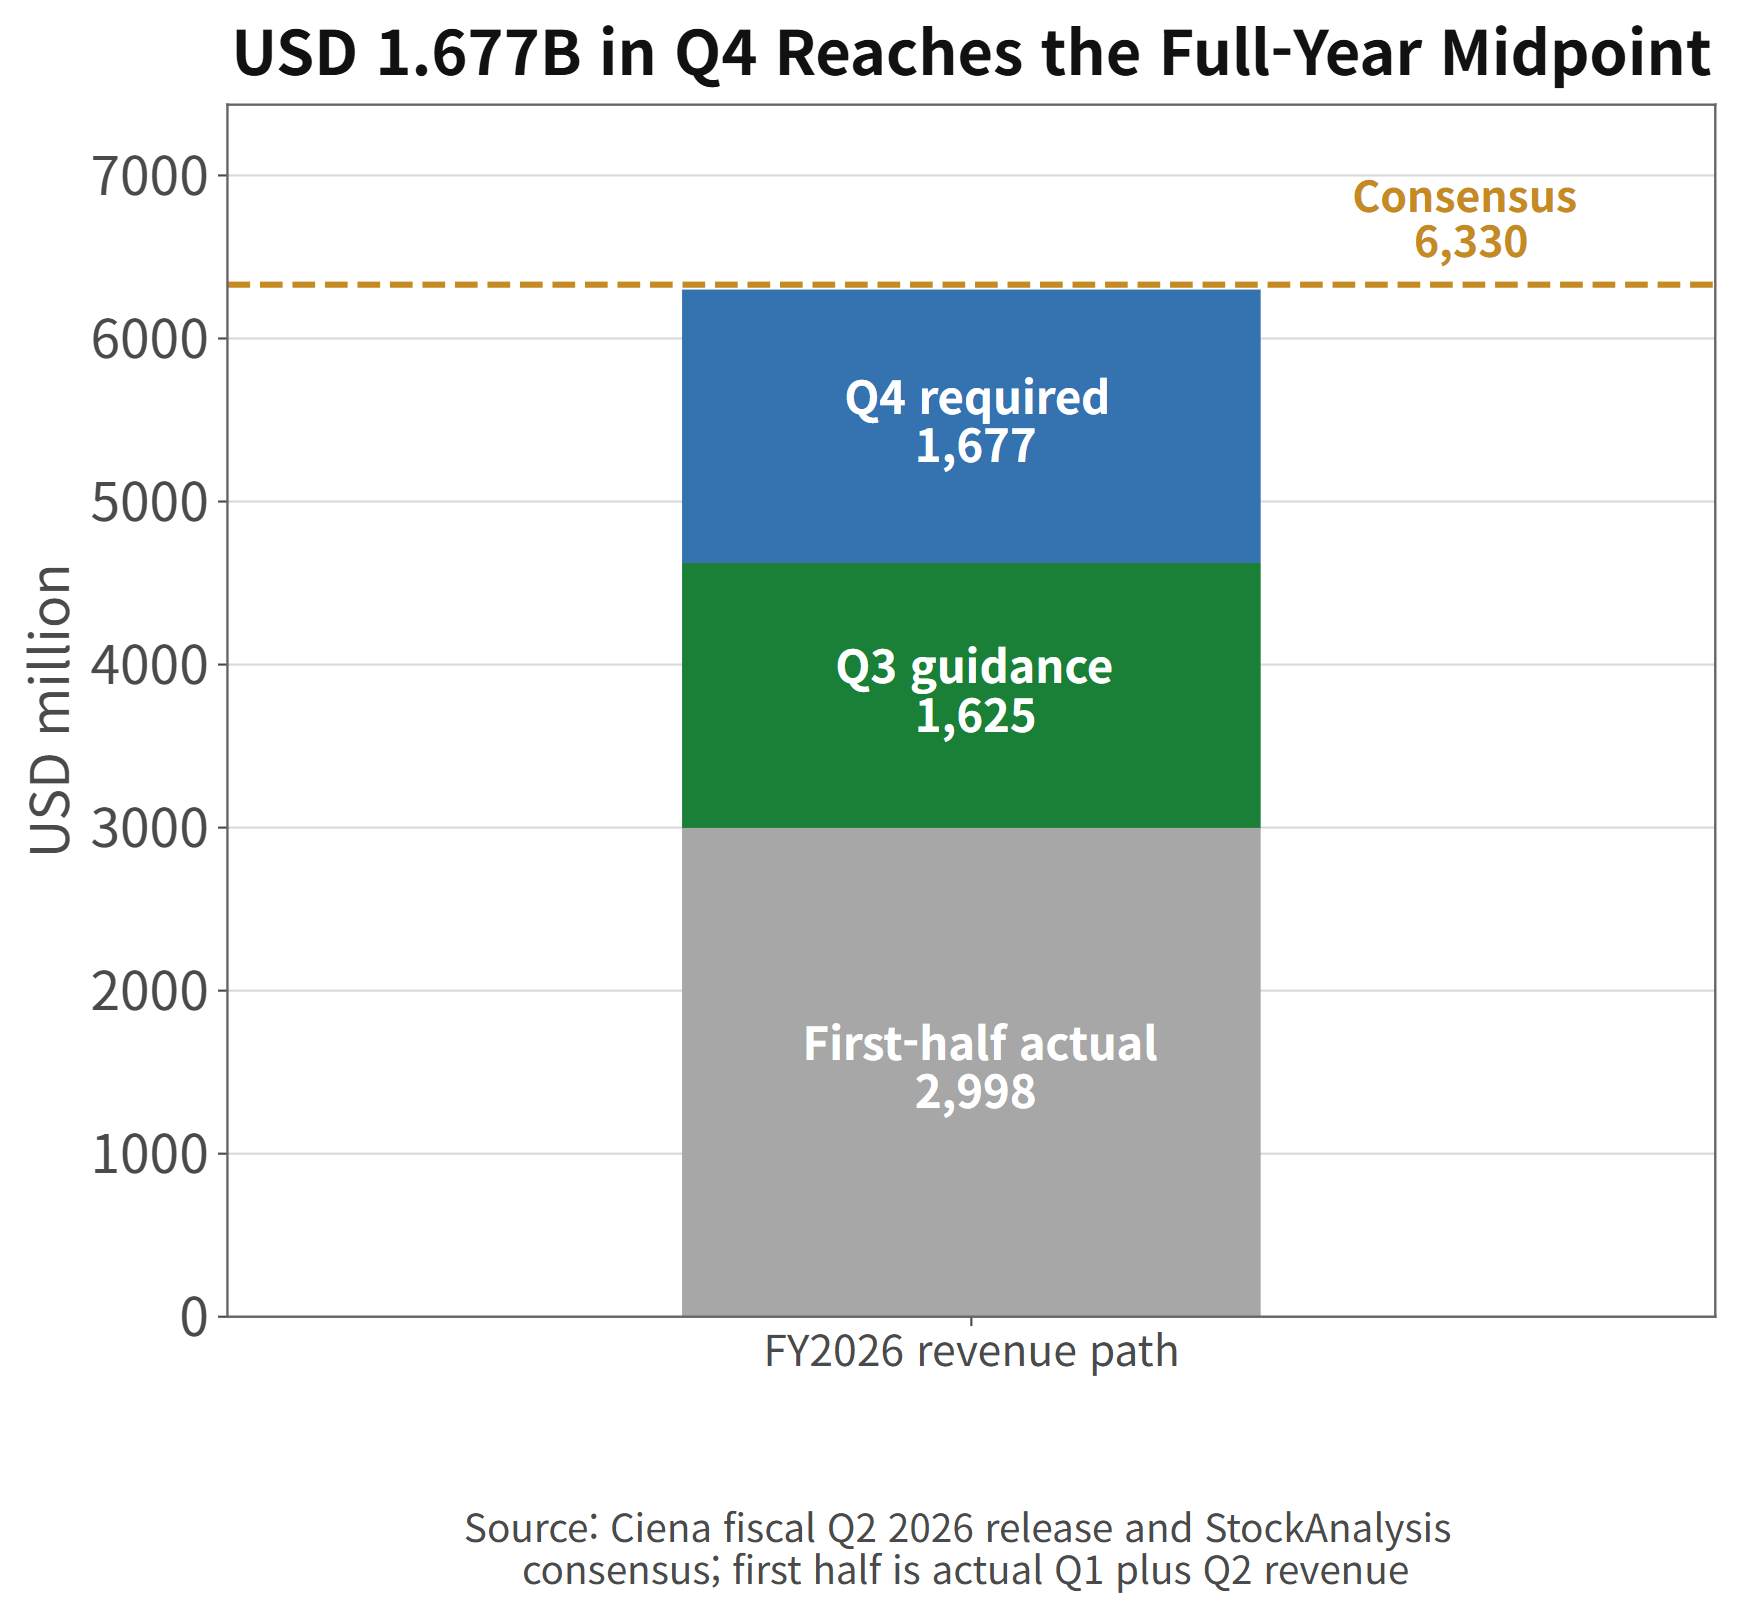
Here is the useful bridge. First-half revenue totaled $2.998 billion. Add the Q3 midpoint and Ciena would need roughly $1.677 billion in Q4 to reach the full-year midpoint. That is above the latest quarter, but only by 6.7%. It does not require a heroic finish. It does require Ciena to preserve the current run rate through the back half.
The quarterly revenue path to Ciena's fiscal 2026 guidance midpoint
Margins and Cash Have Caught Up
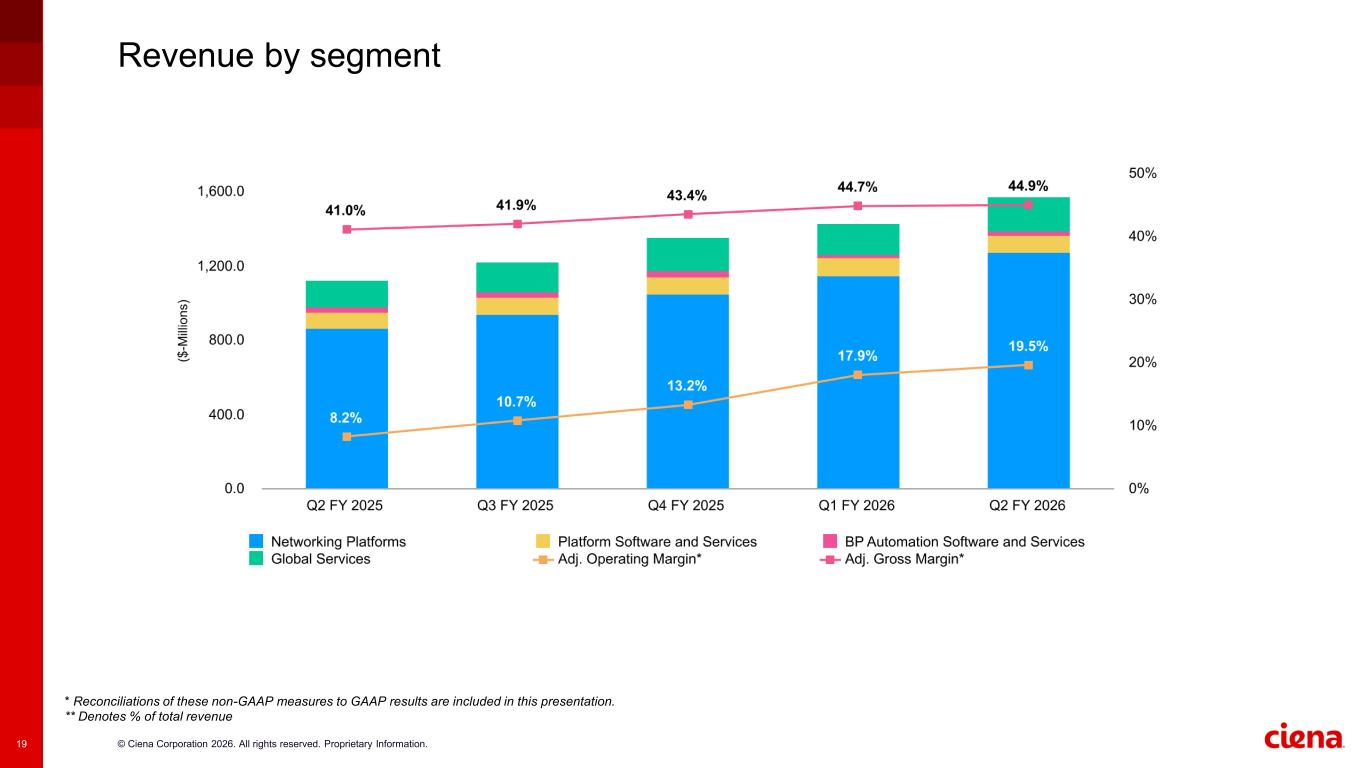
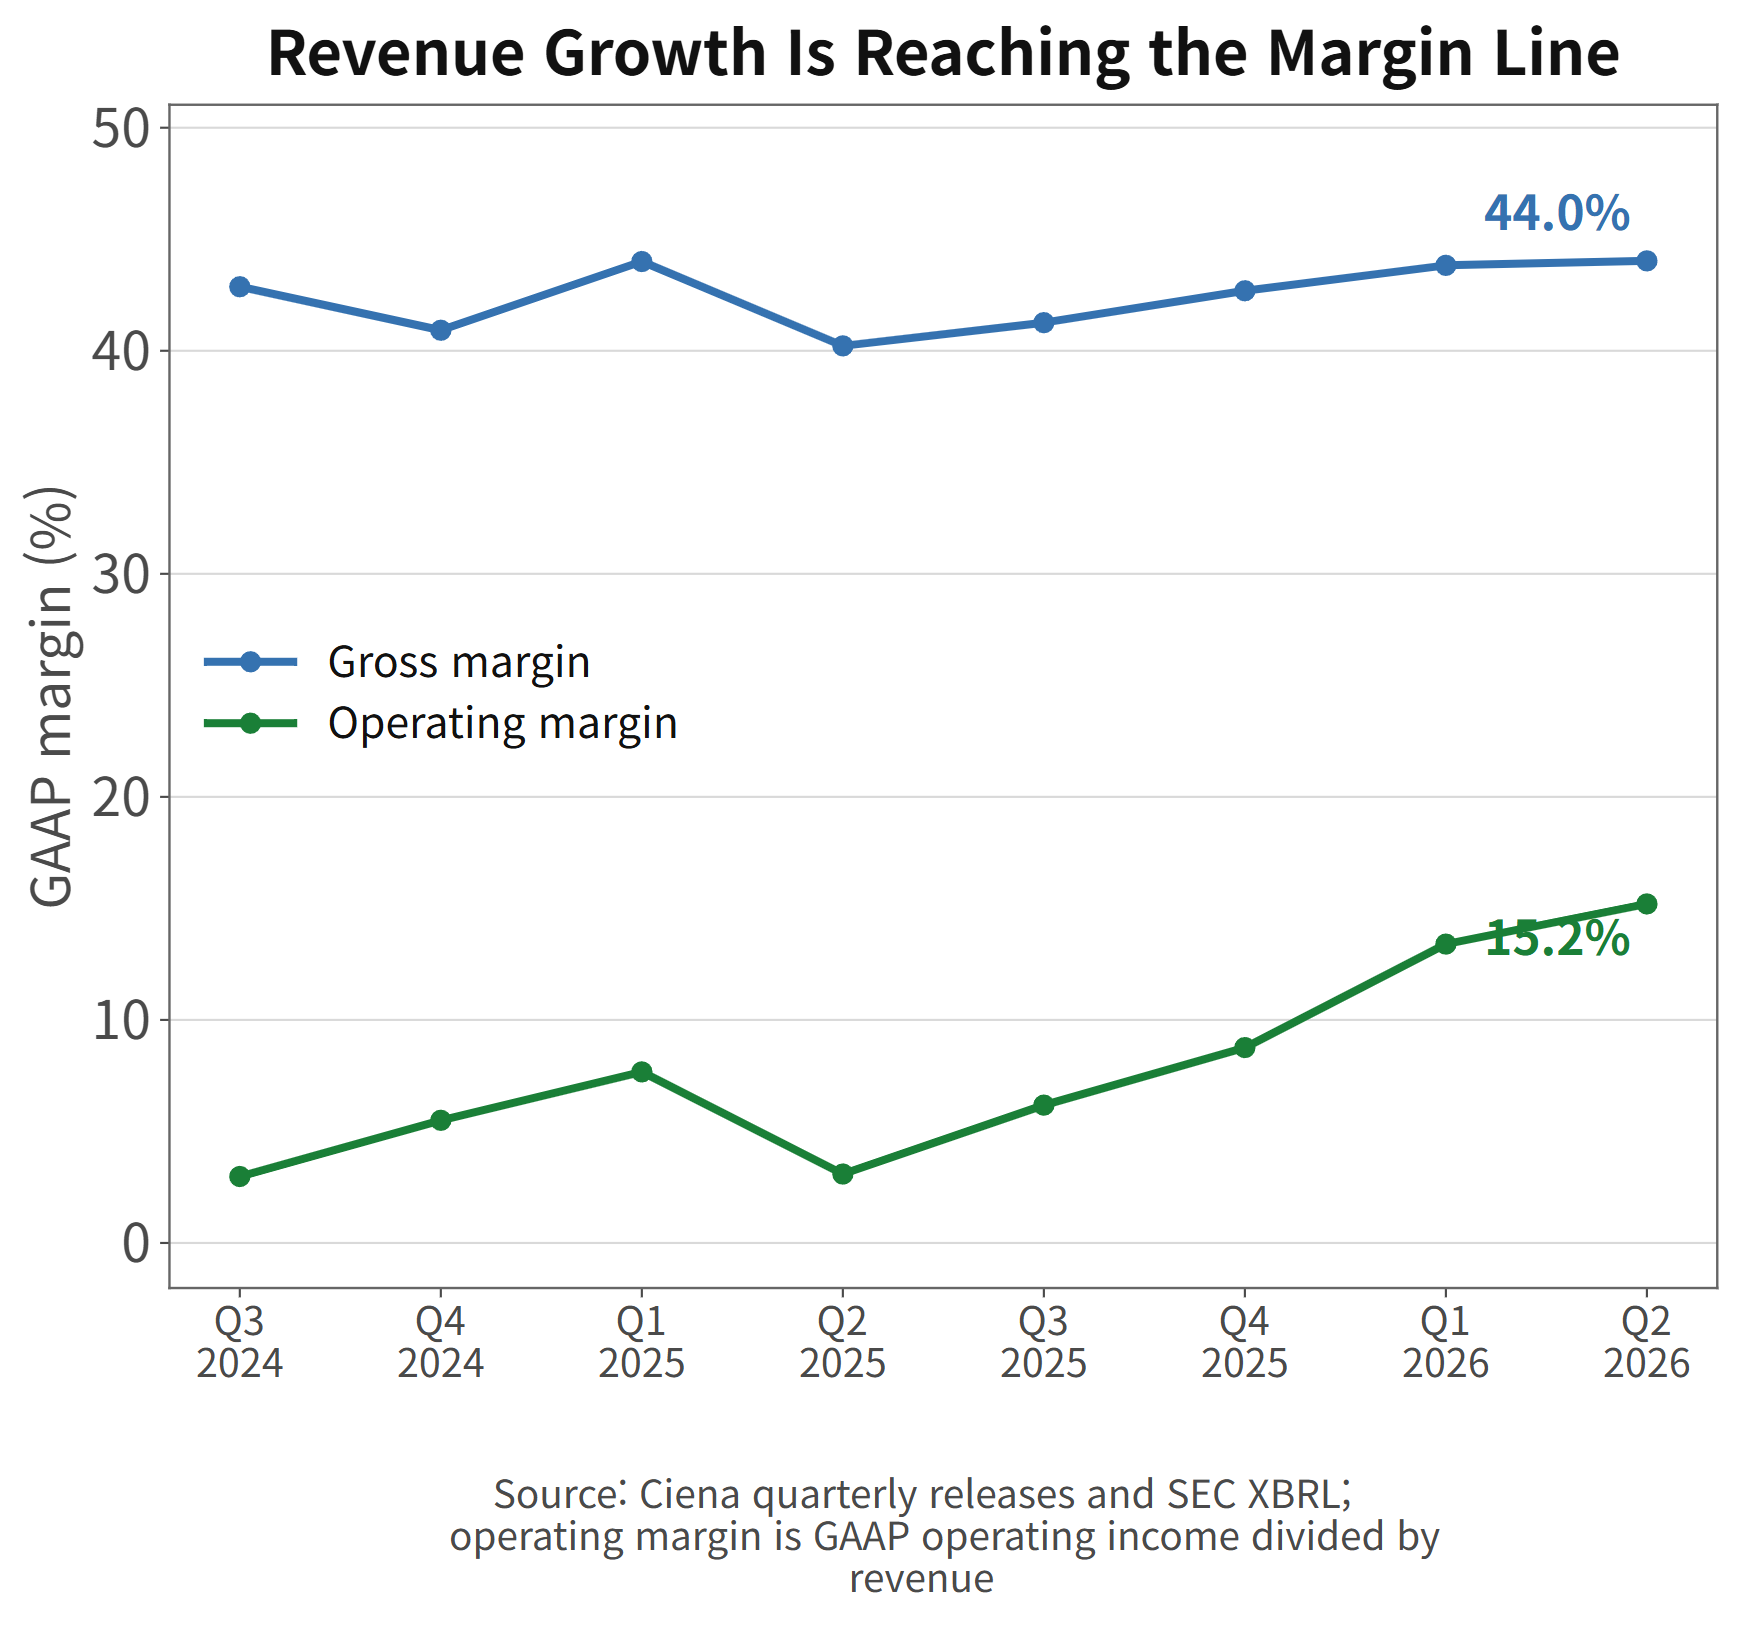
Revenue growth is only half the story. GAAP gross margin improved 381 basis points year over year to 44.0%, and GAAP operating margin expanded to 15.2% from 3.1%.
Ciena GAAP gross and operating margins
Free cash flow increased to $218.7 million, equal to 13.9% of revenue. That was the fourth positive quarter in a row and the third consecutive quarter above $150 million.
Ciena quarterly free cash flow and free-cash-flow margin
For fiscal Q3, management expects adjusted gross margin of 45%, plus or minus one percentage point, and adjusted operating margin of 19%, also plus or minus one point. The full-year adjusted operating-margin target is the same 19% midpoint. The guide implies that operating leverage has room to improve again, even after the sharp Q2 recovery.
Ciena fiscal Q2 2026 financial highlights (source: company earnings presentation)
There is a practical way to judge the quality of the next report. Revenue growth without stable gross margin could signal pricing pressure, an unfavorable product mix, or higher fulfillment costs. Margin expansion without order support could mark the peak of a shipment cycle. The strongest outcome would pair continued cloud and service-provider growth with gross margin near the guided range and another solid cash-flow quarter.
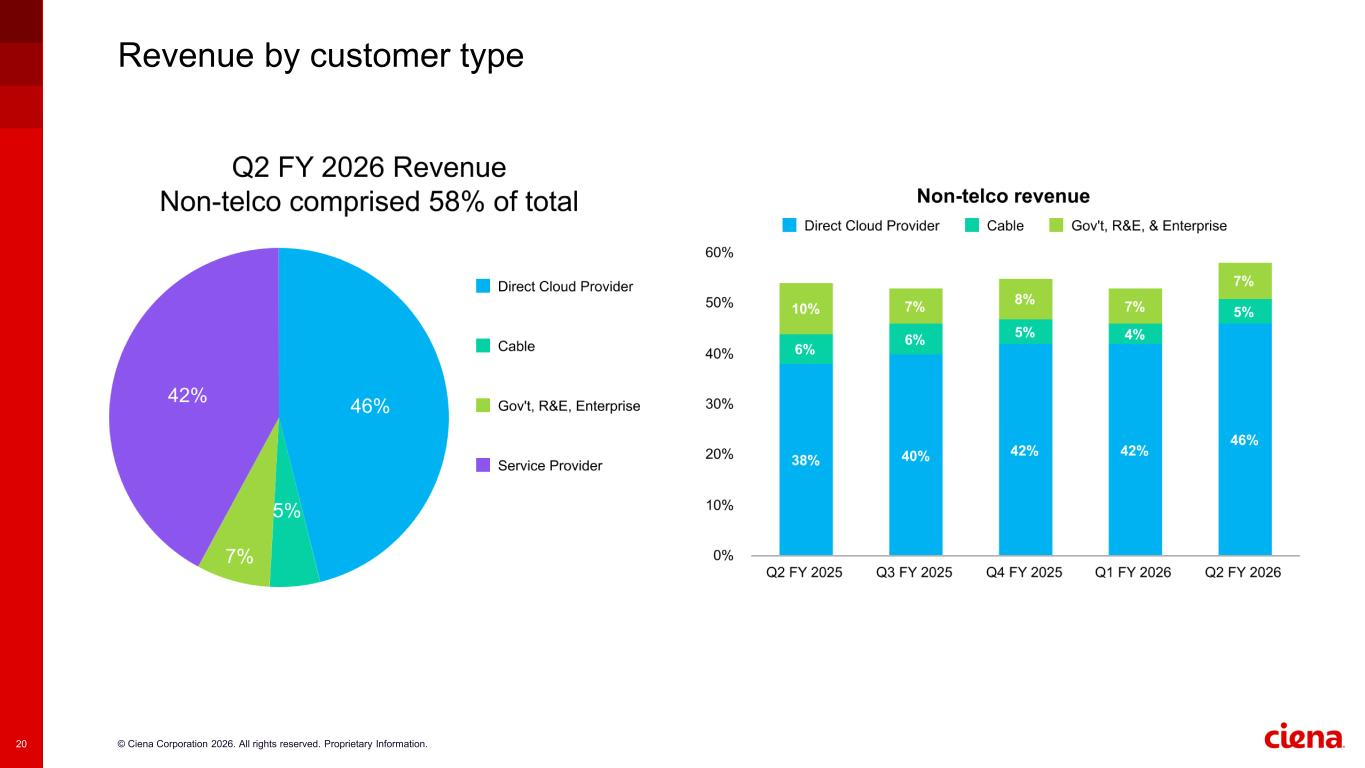
The 34% Customer Concentration
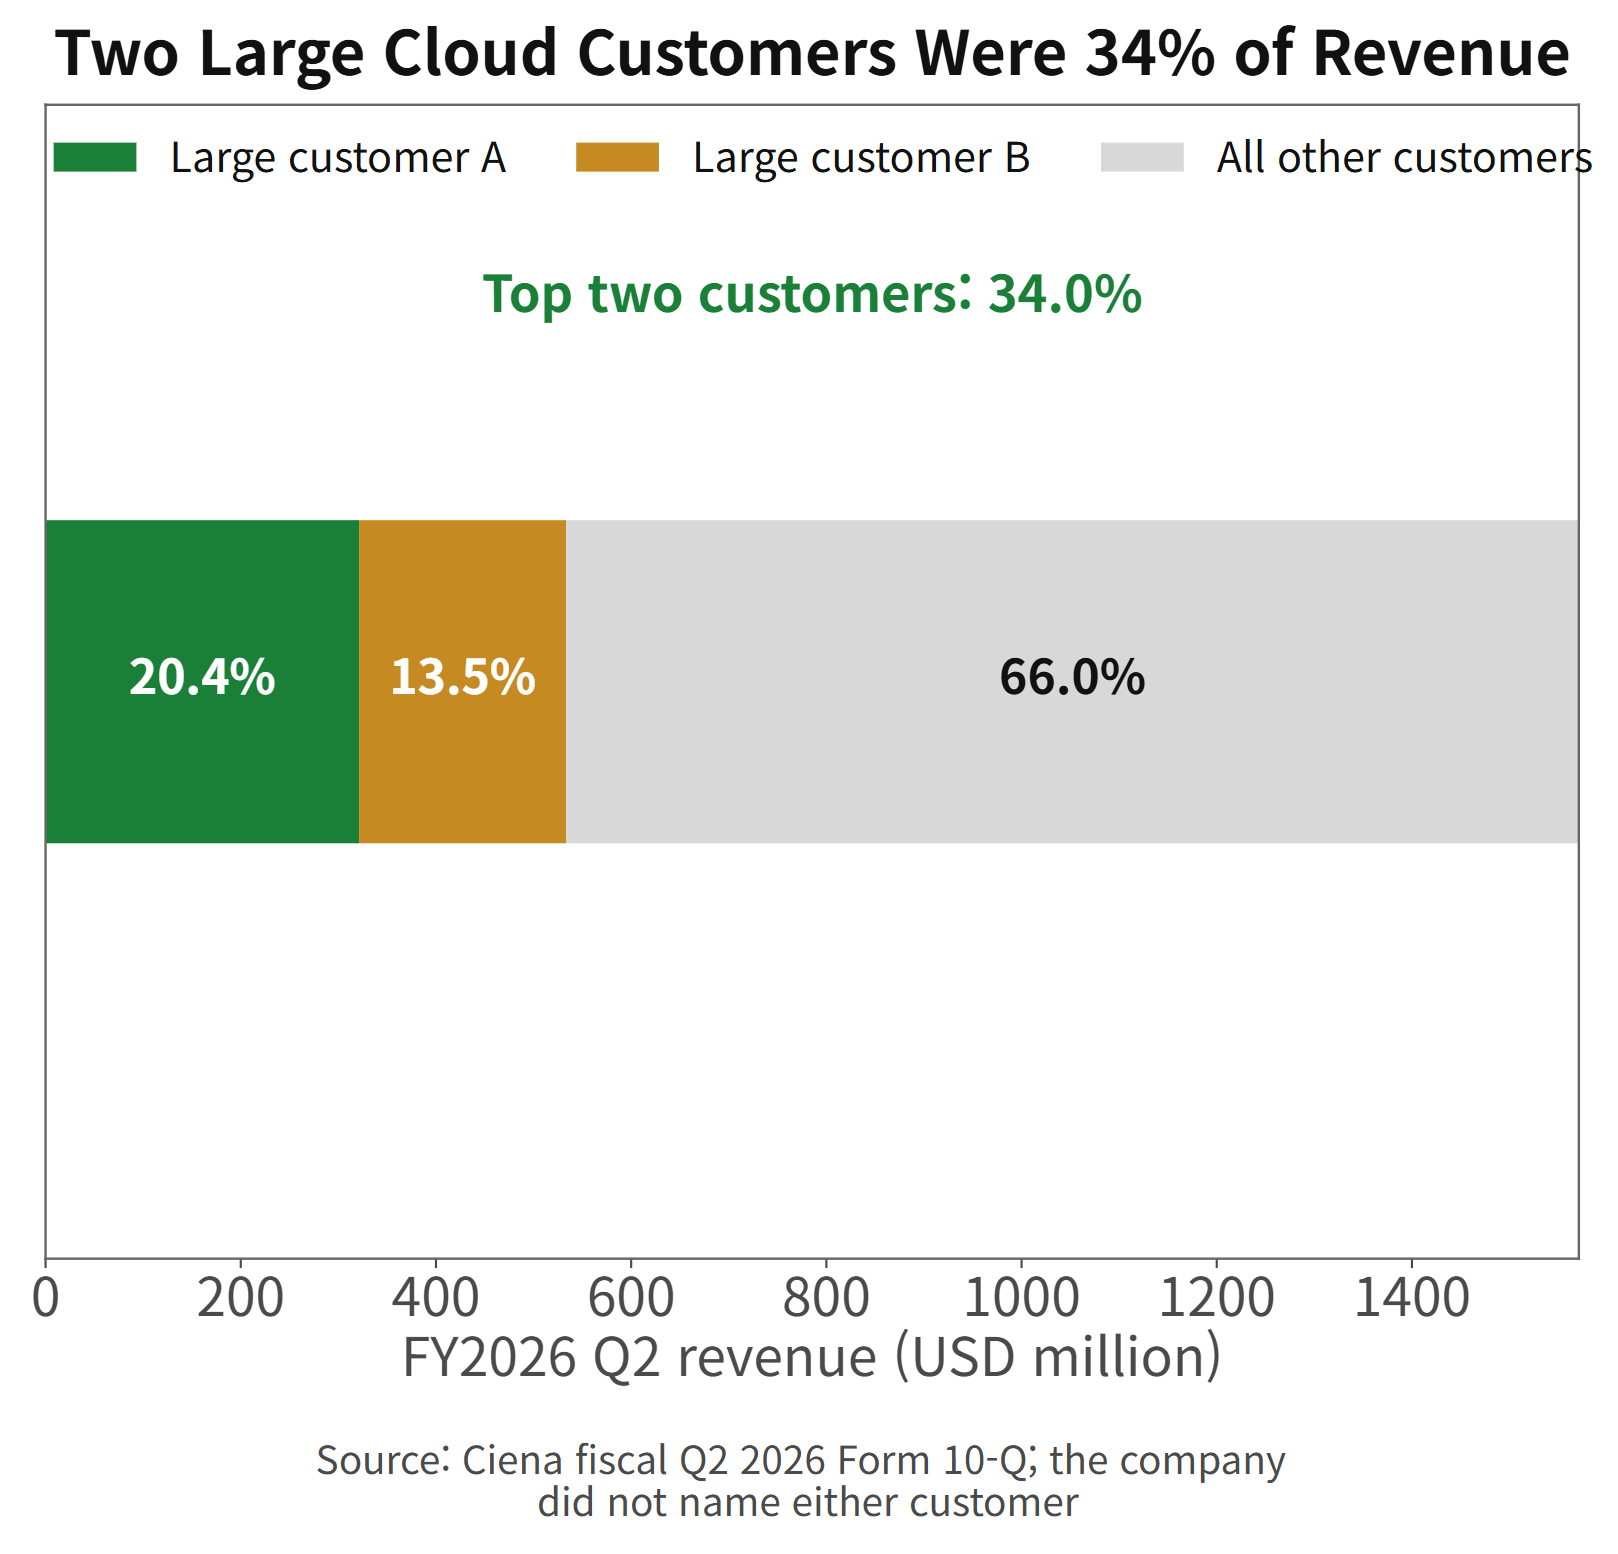
Ciena's growth comes with a visible concentration risk. Its two largest customers accounted for 34% of quarterly revenue, or about $533.5 million combined. The larger customer contributed $321.2 million and the second $212.3 million.
Ciena's two largest customers as a share of fiscal Q2 2026 revenue
Large cloud buyers can scale programs quickly, which helps explain the current acceleration. They can also change architecture, negotiate aggressively, qualify a second supplier, or delay a deployment. A third of quarterly revenue tied to two customers makes forecast errors more consequential than the headline growth rate suggests.
Concentration should therefore be read in two ways. It is evidence that Ciena has won important roles in large networks. It is also a reminder that this is not thousands of small subscriptions renewing independently. A small number of program decisions can move a large number of revenue dollars.
Ciena revenue by customer type (source: company earnings presentation)
A Clever Financing and Costly Buybacks
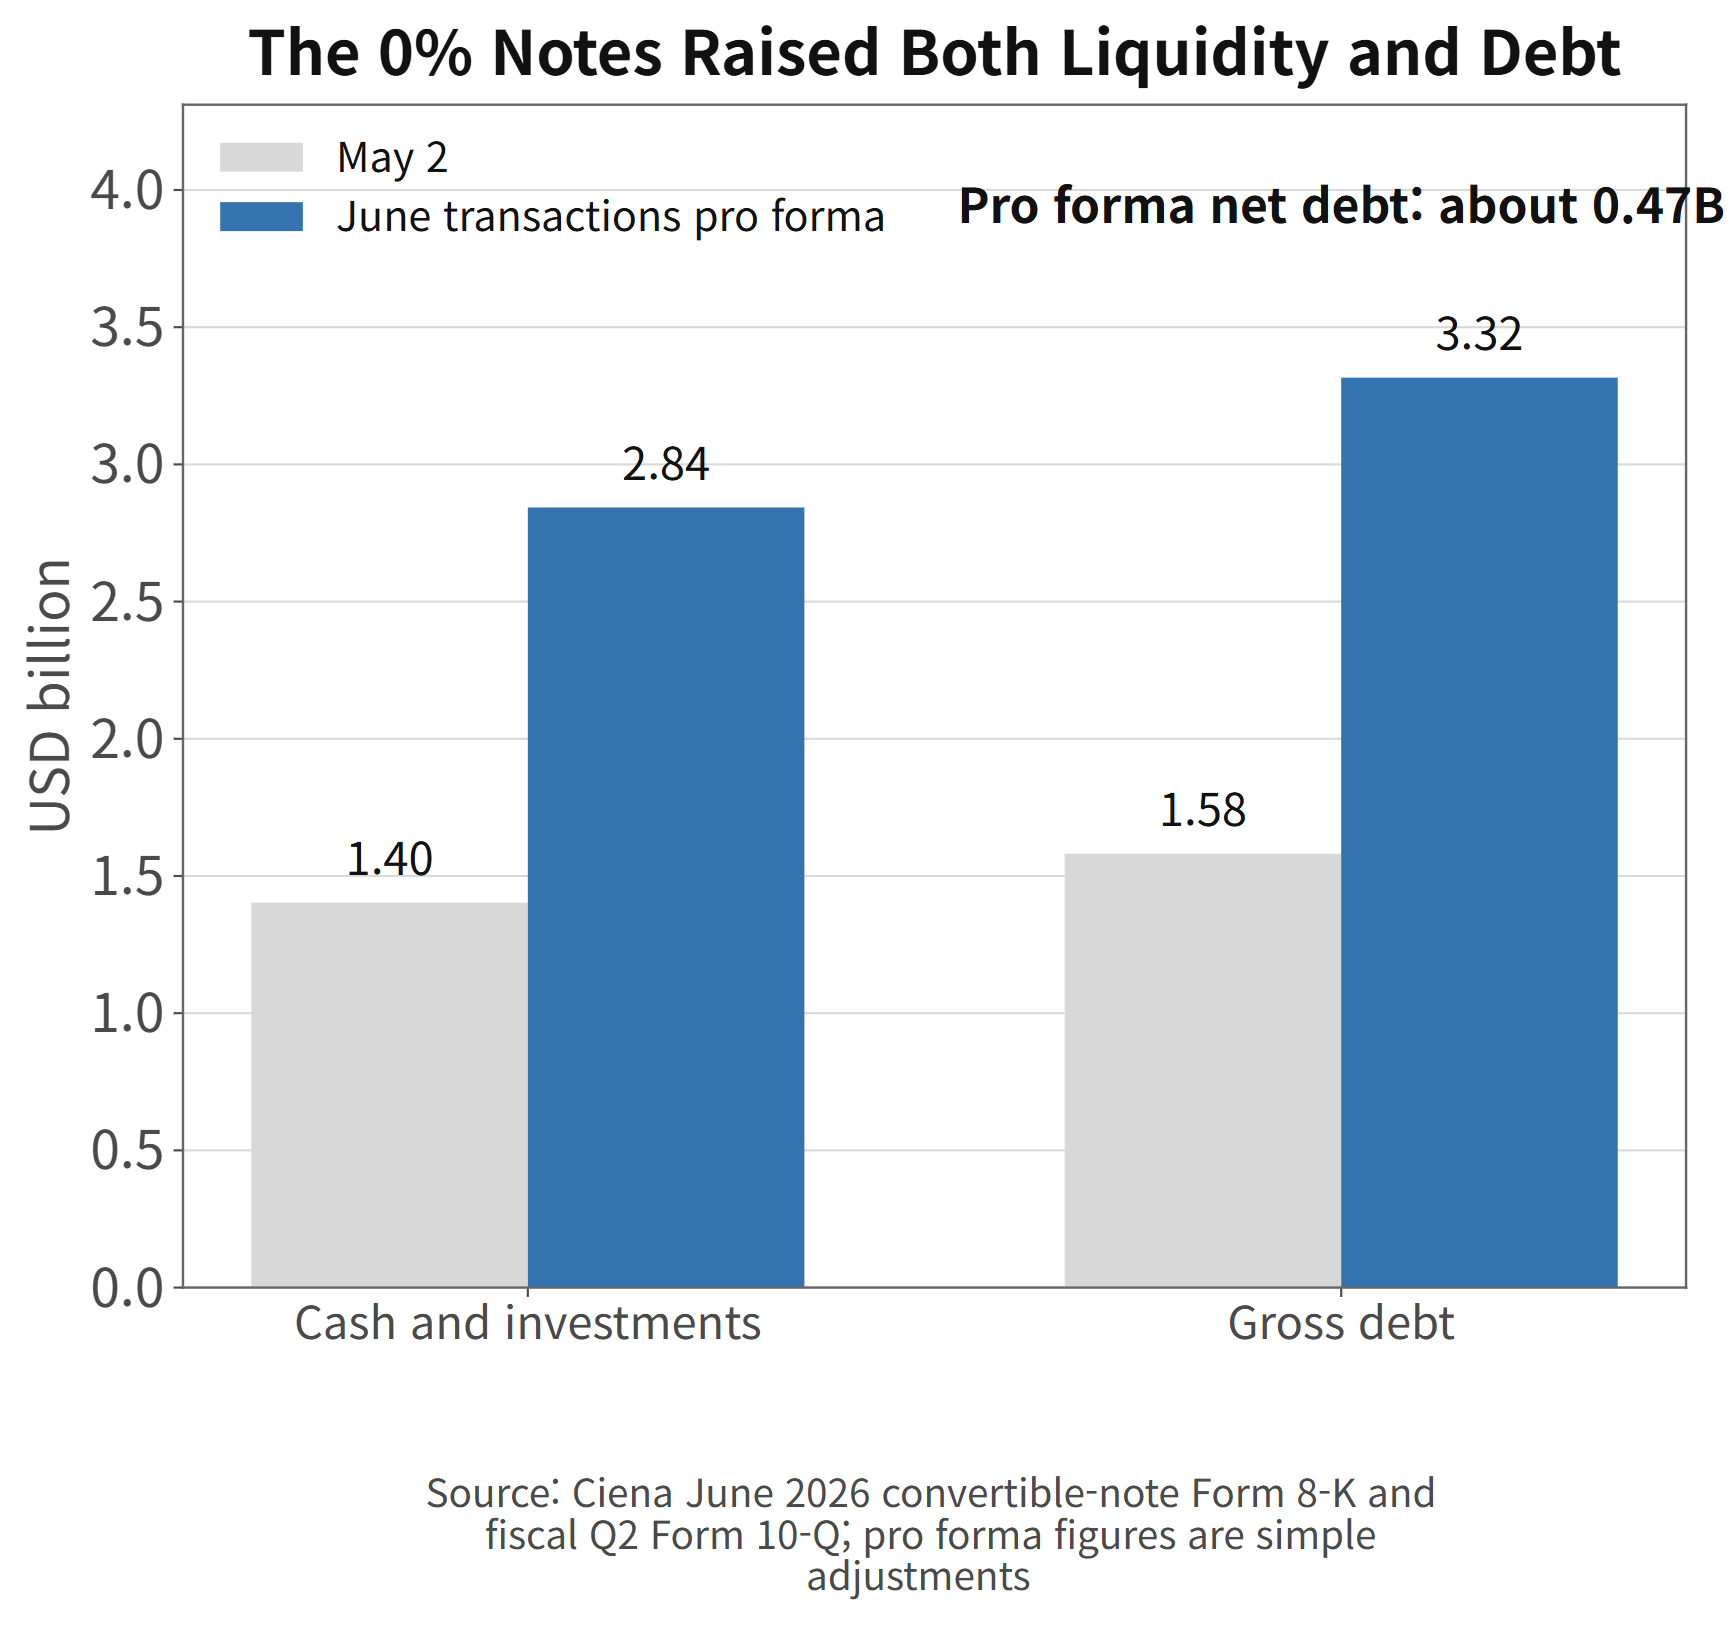
In June, Ciena sold $2.875 billion of 0% convertible senior notes and received about $2.72 billion after costs. It planned to use roughly $1.14 billion to repay existing debt. The initial conversion price was $746.66 per share. Related capped-call transactions were designed to offset dilution up to a $1,000 share price, subject to their terms.
The financing itself was attractive. A 0% coupon locks in a large pool of capital without recurring cash interest. On a simple pro forma basis, cash and investments rose to about $2.843 billion, gross debt to $3.316 billion, and net debt to about $473 million after the announced uses of proceeds.
Cash, investments, and gross debt before and after the June 2026 financing
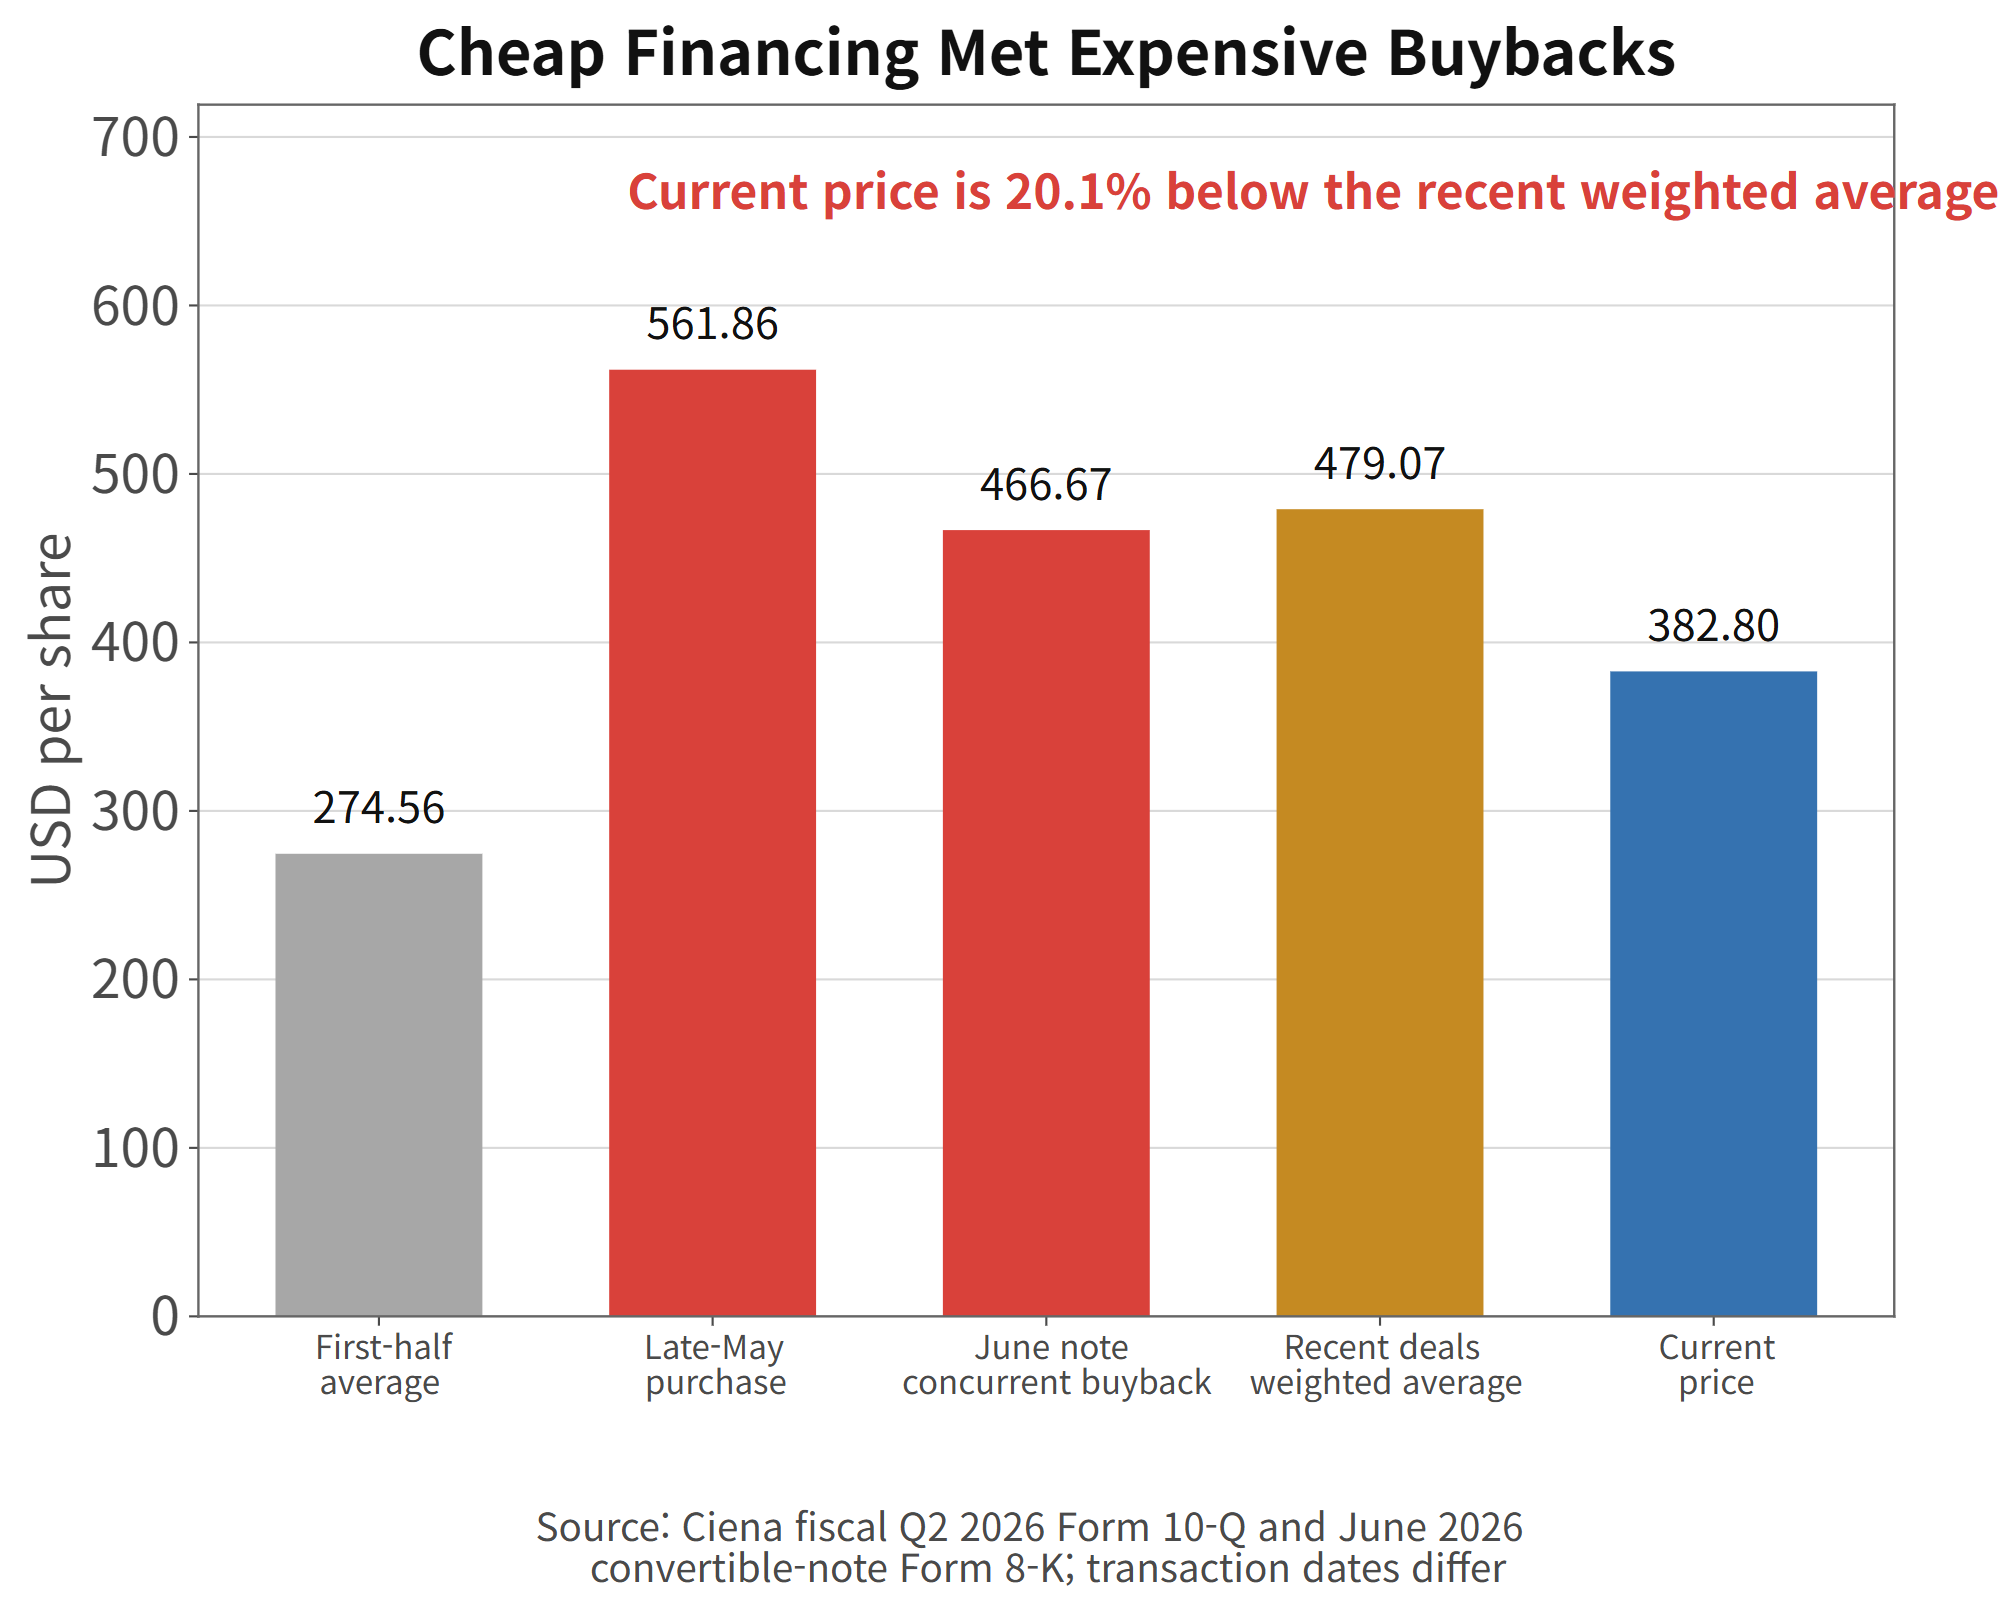
The capital-allocation picture is less tidy. Ciena repurchased 0.6 million shares for $163.7 million in the first half, an average of $274.56. On May 29 it bought 44,628 shares for $25.1 million, or $561.86 each. It then spent another $140 million on 0.3 million shares alongside the note offering, an average of $466.67.
The May and June purchases together average about $479.07 per share. The August 31 closing price was 20.1% below that recent weighted average. Buybacks can still add long-term value if the business compounds faster than the market expects, but the early mark is unfavorable. Investors should separate the low cost of the financing from the high price paid for the stock.
Ciena repurchase prices compared with the August 31 close
There is also potential dilution to monitor. The note conversion price is well above the current market price, while the capped call offers protection only within a defined range. Other warrant obligations disclosed with the transactions could cover as many as 7.7 million shares under their maximum terms. These instruments are conditional rather than immediate common shares, but they belong in any fully diluted analysis.
The Optical Upgrade Cycle
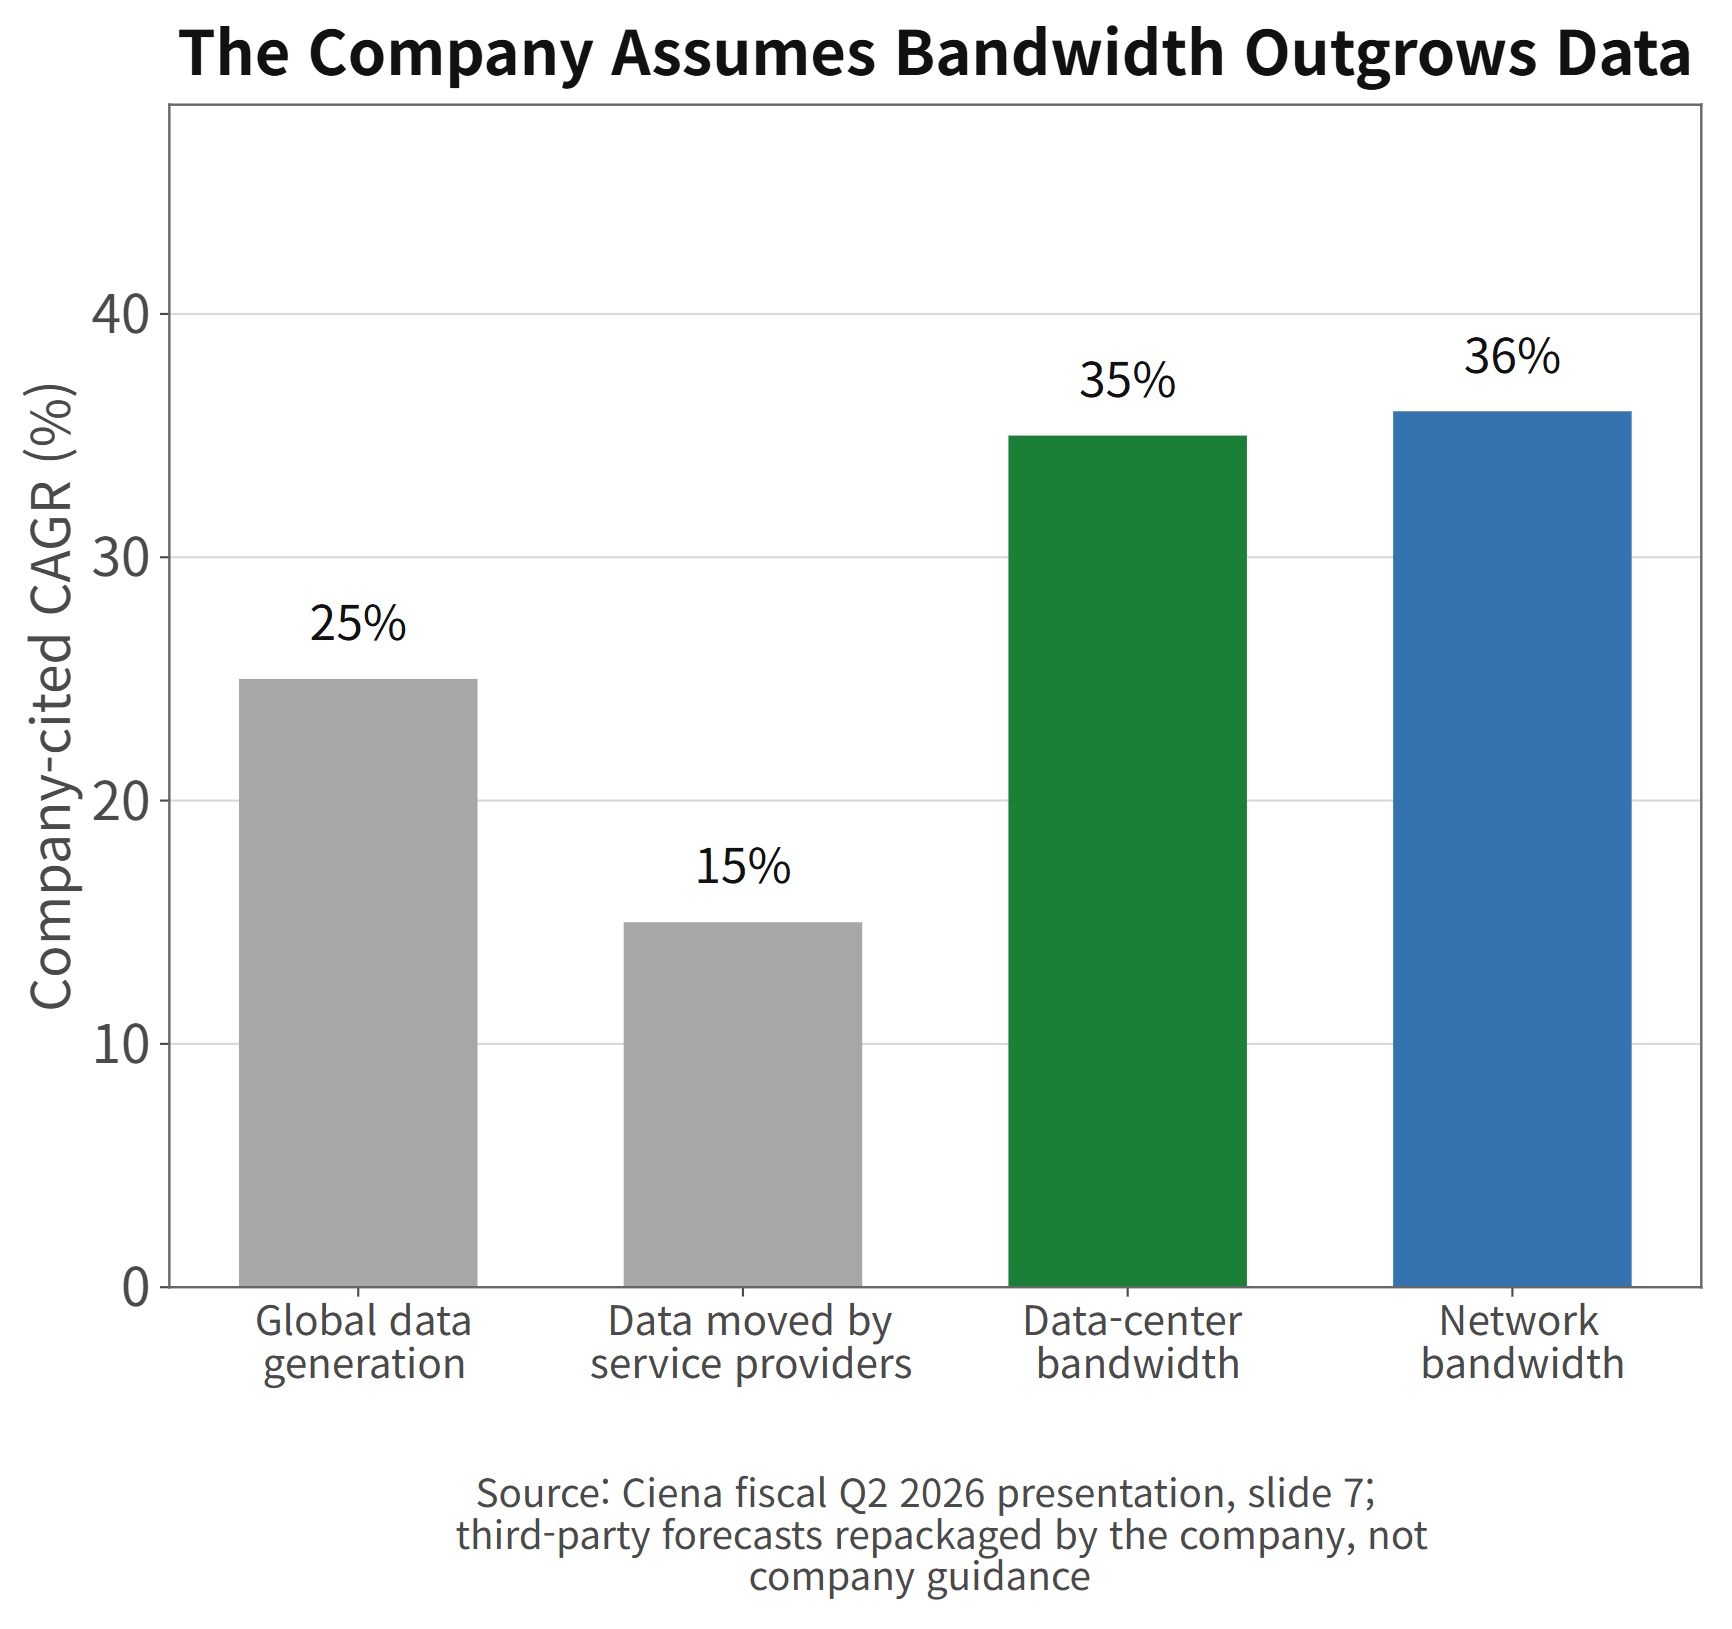
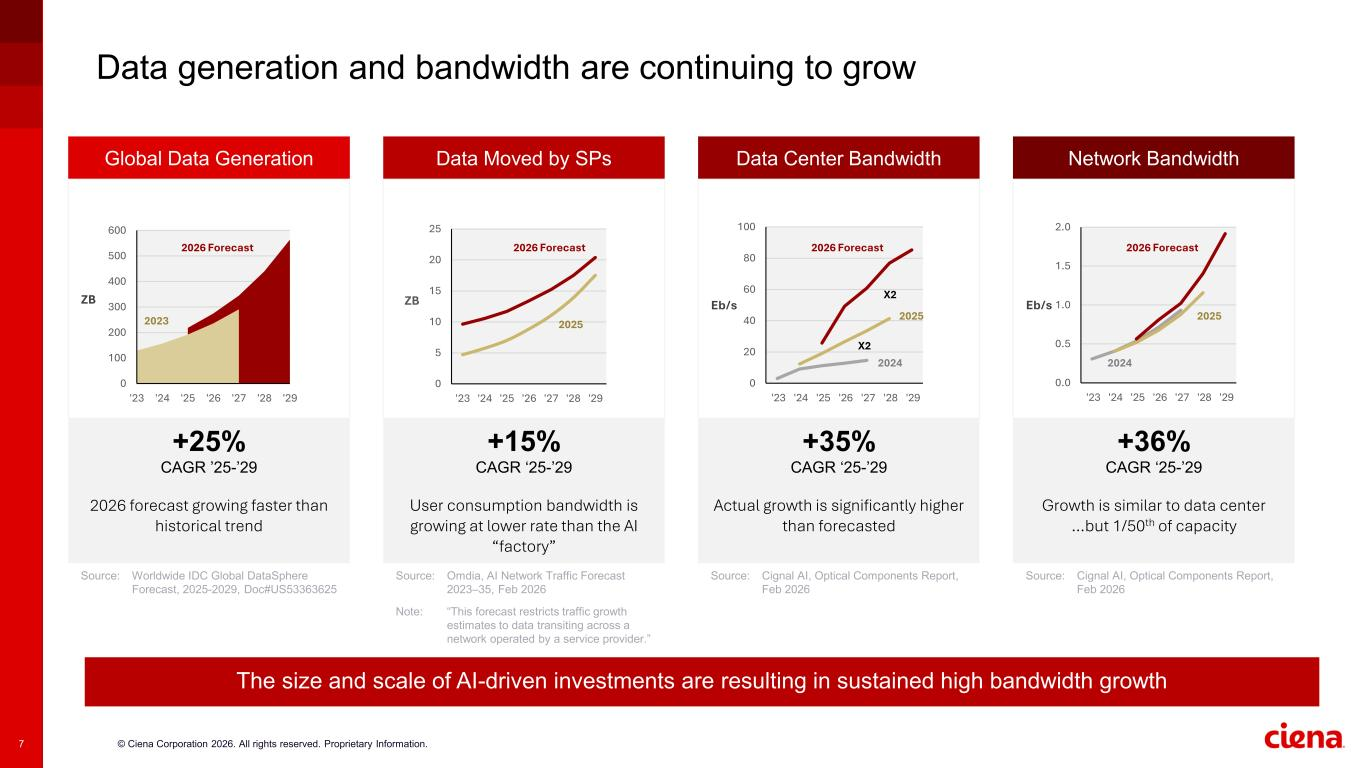
Ciena argues that bandwidth demand will grow faster than the amount of data being created. Its fiscal Q2 presentation cited third-party forecasts of 25% annual growth in global data generation, 35% in data-center bandwidth, and 36% in overall network bandwidth. The exact forecasts are uncertain, but the direction is intuitive: AI training, inference, cloud services, and data-center interconnection require traffic to move across more links at higher speeds.
Company-cited forecasts for data generation and bandwidth growth
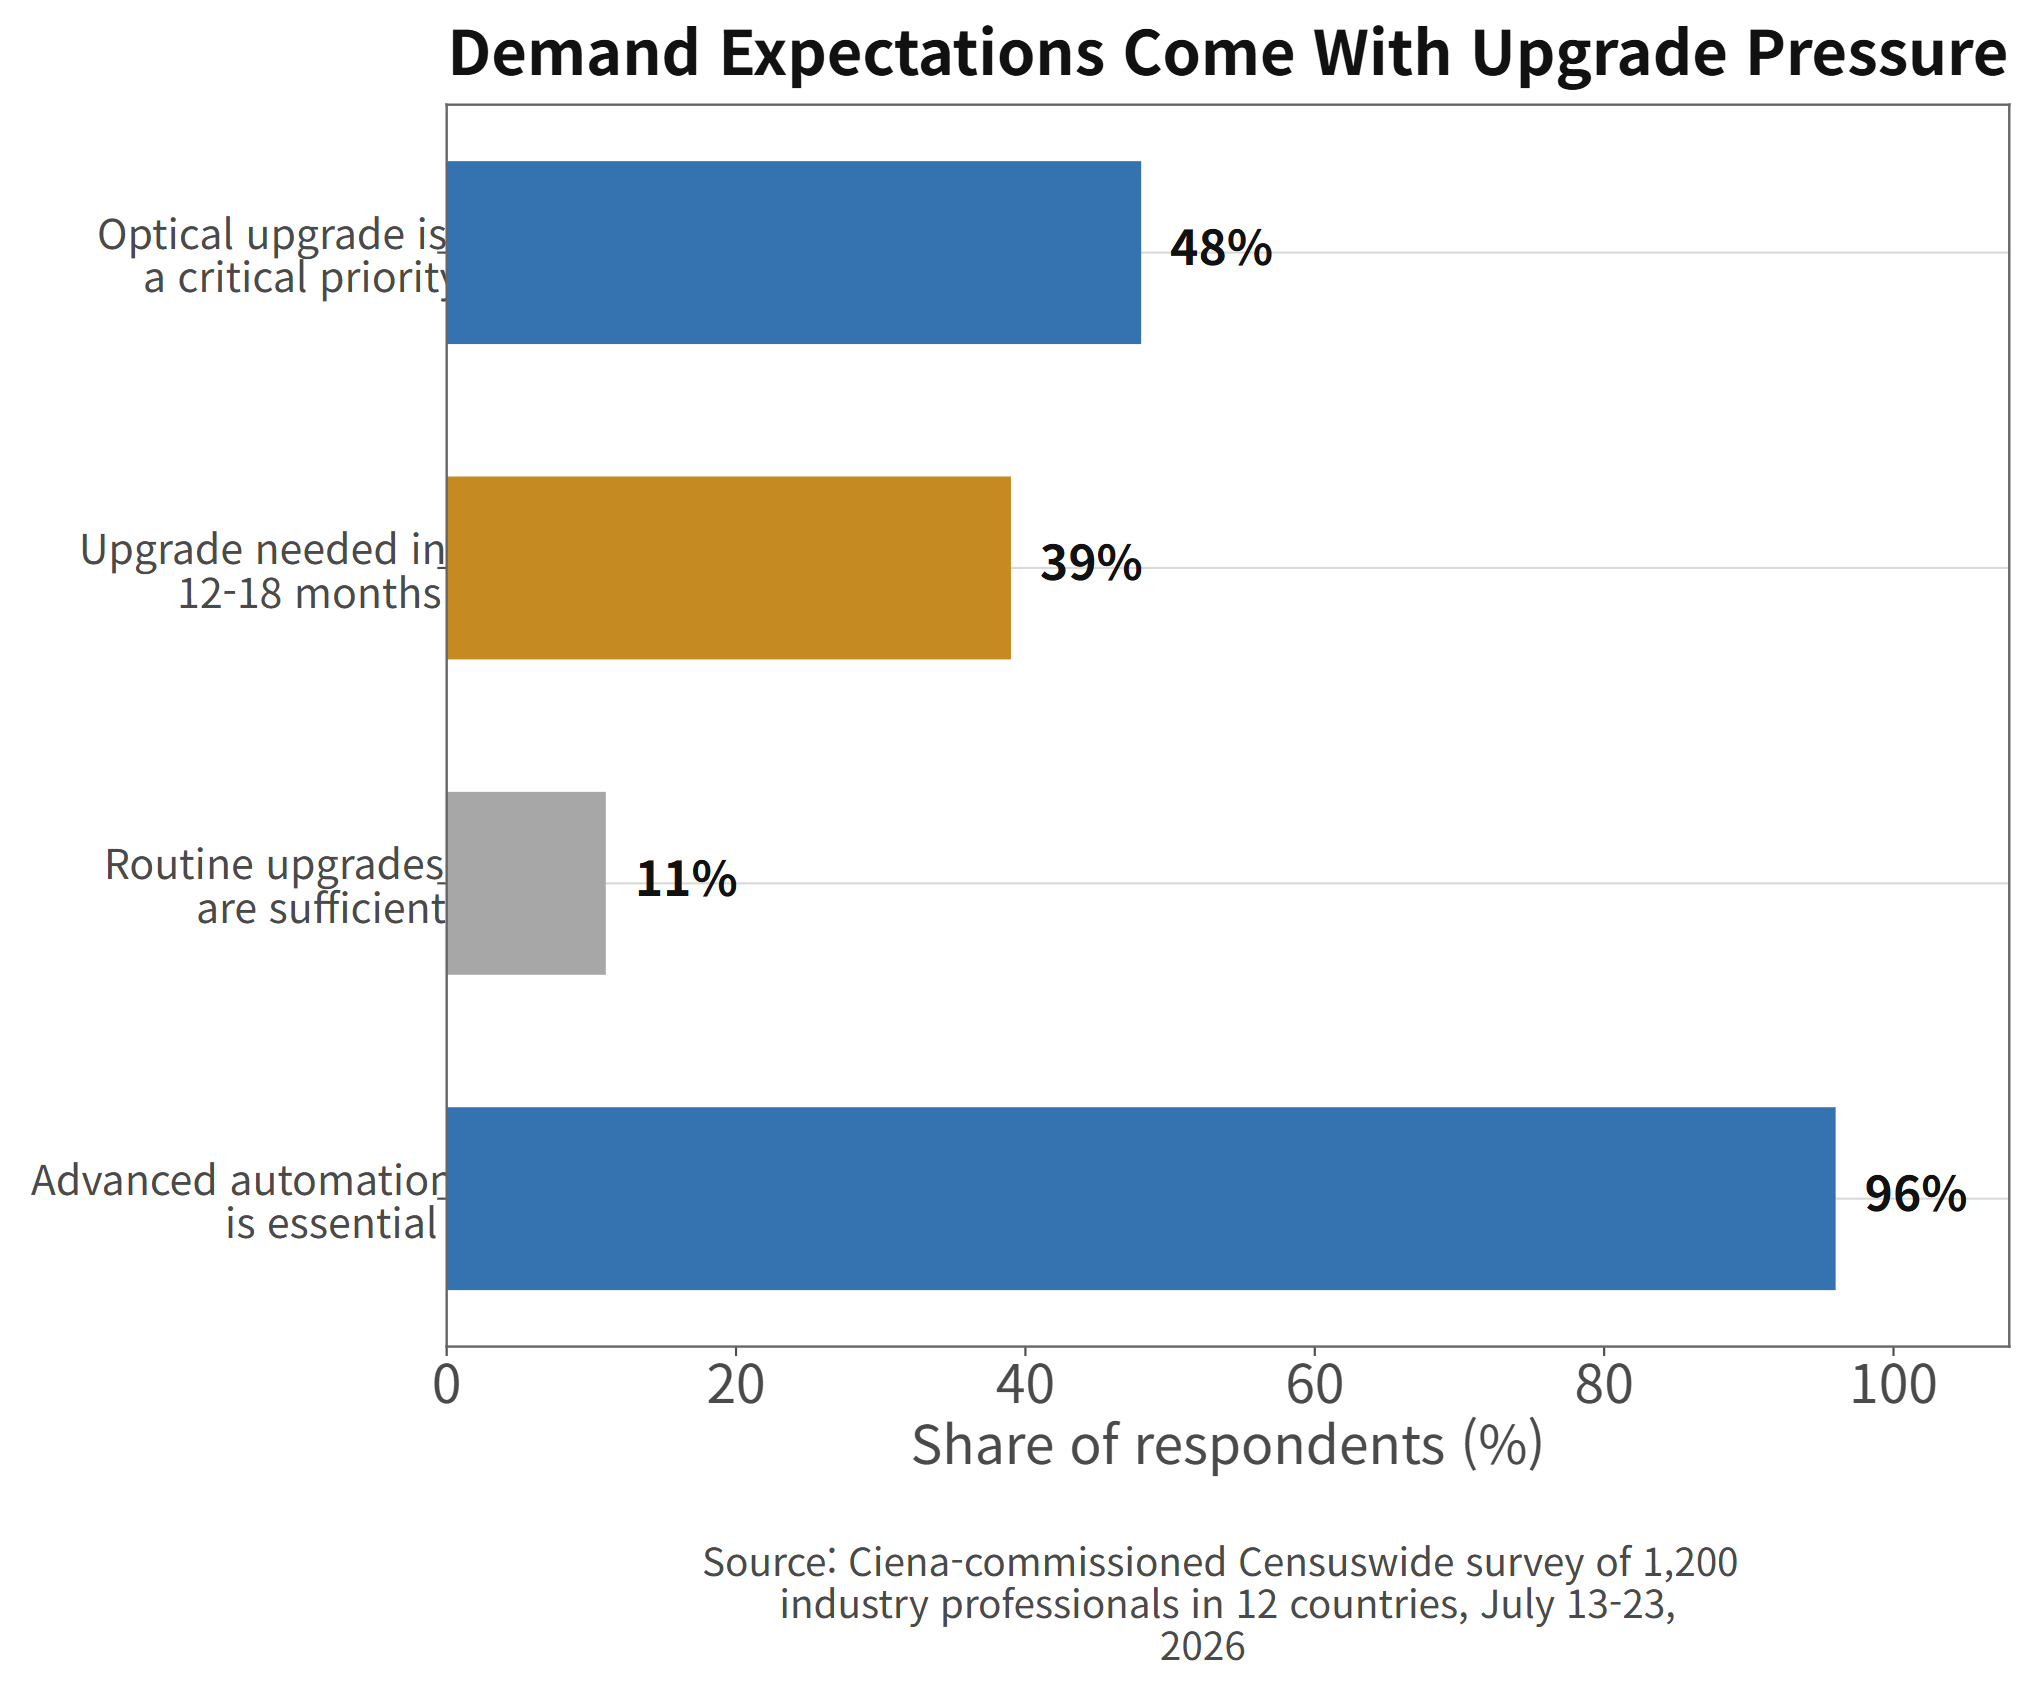
A Ciena-commissioned survey published in August offers a second view. Among 1,200 telecom, wholesale-fiber, and regional service-provider professionals in 12 countries, 90% expected high-capacity AI network services to create revenue opportunities. At the same time, 48% called an optical-network upgrade a critical priority, 39% expected an upgrade within 12 to 18 months, and only 11% believed routine upgrades would be sufficient. Some 96% considered advanced automation essential.
Service-provider views on optical upgrades and network automation
The survey is company-sponsored, so it should be treated as evidence of industry sentiment rather than an independent demand forecast. Even with that caveat, it captures Ciena's opportunity clearly: customers see new services ahead, while their existing networks may not be ready to deliver them.
The demand drivers Ciena associates with bandwidth growth (source: company earnings presentation)
The harder question is timing. Network operators can agree that upgrades are necessary and still defer purchase orders because of budgets, permitting, deployment capacity, or uncertainty about which architecture will win. Secular demand does not remove quarterly cyclicality.
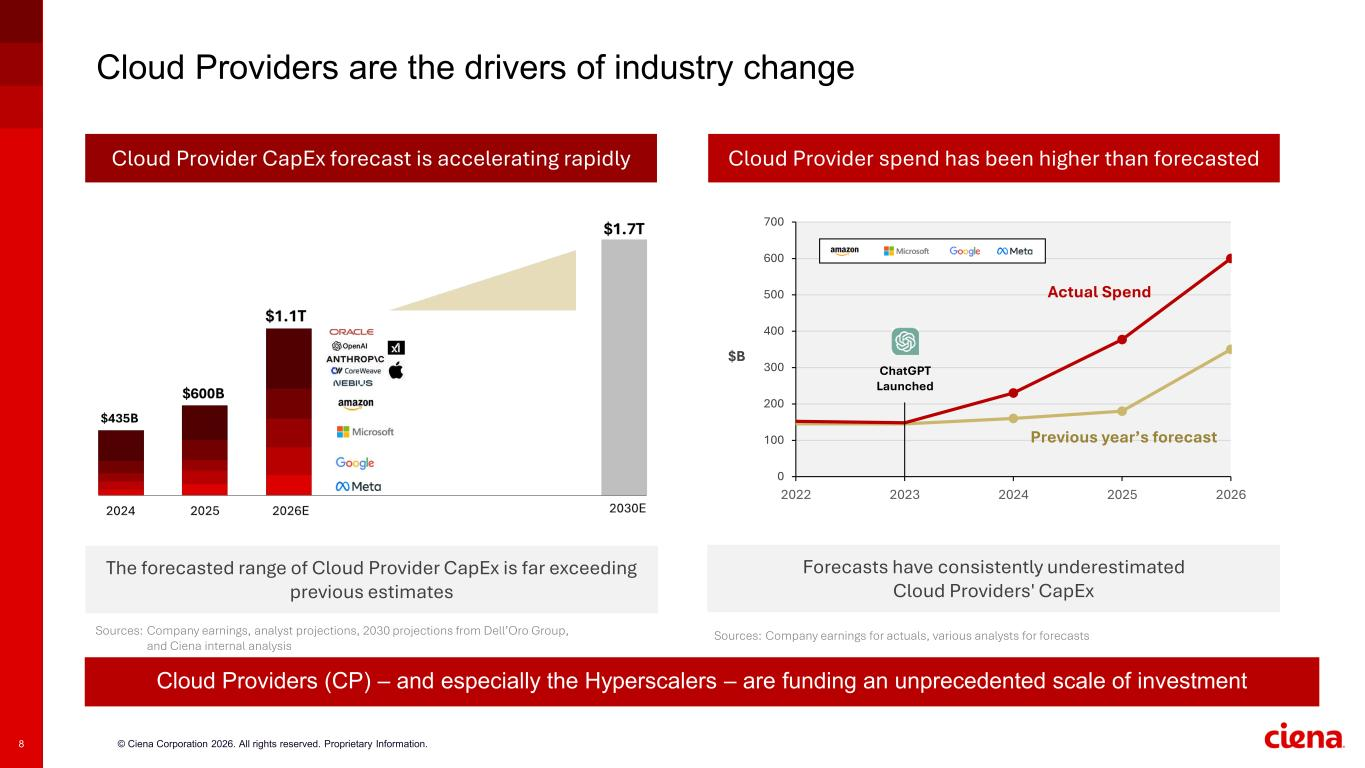
Cloud capital spending and network demand context (source: company earnings presentation)
Ciena Against Arista, Cisco, Nokia, and Adtran
Peer comparisons need care because these companies sell different mixes of products. Arista is more exposed to high-performance data-center switching and carries software-like economics in parts of its model. Cisco combines networking with subscriptions and security. Nokia is a much broader telecom-equipment vendor. Adtran is smaller and more exposed to access and optical markets.
Company
Latest revenue growth
Gross margin
Trailing P/S
Ciena
39.5%
44.0%
9.73x
Arista Networks
37.7%
62.9%
23.41x
Cisco
17.6%
64.1%
6.88x
Nokia
8.4%
46.0%
2.44x
Adtran
6.1%
37.0%
0.55x
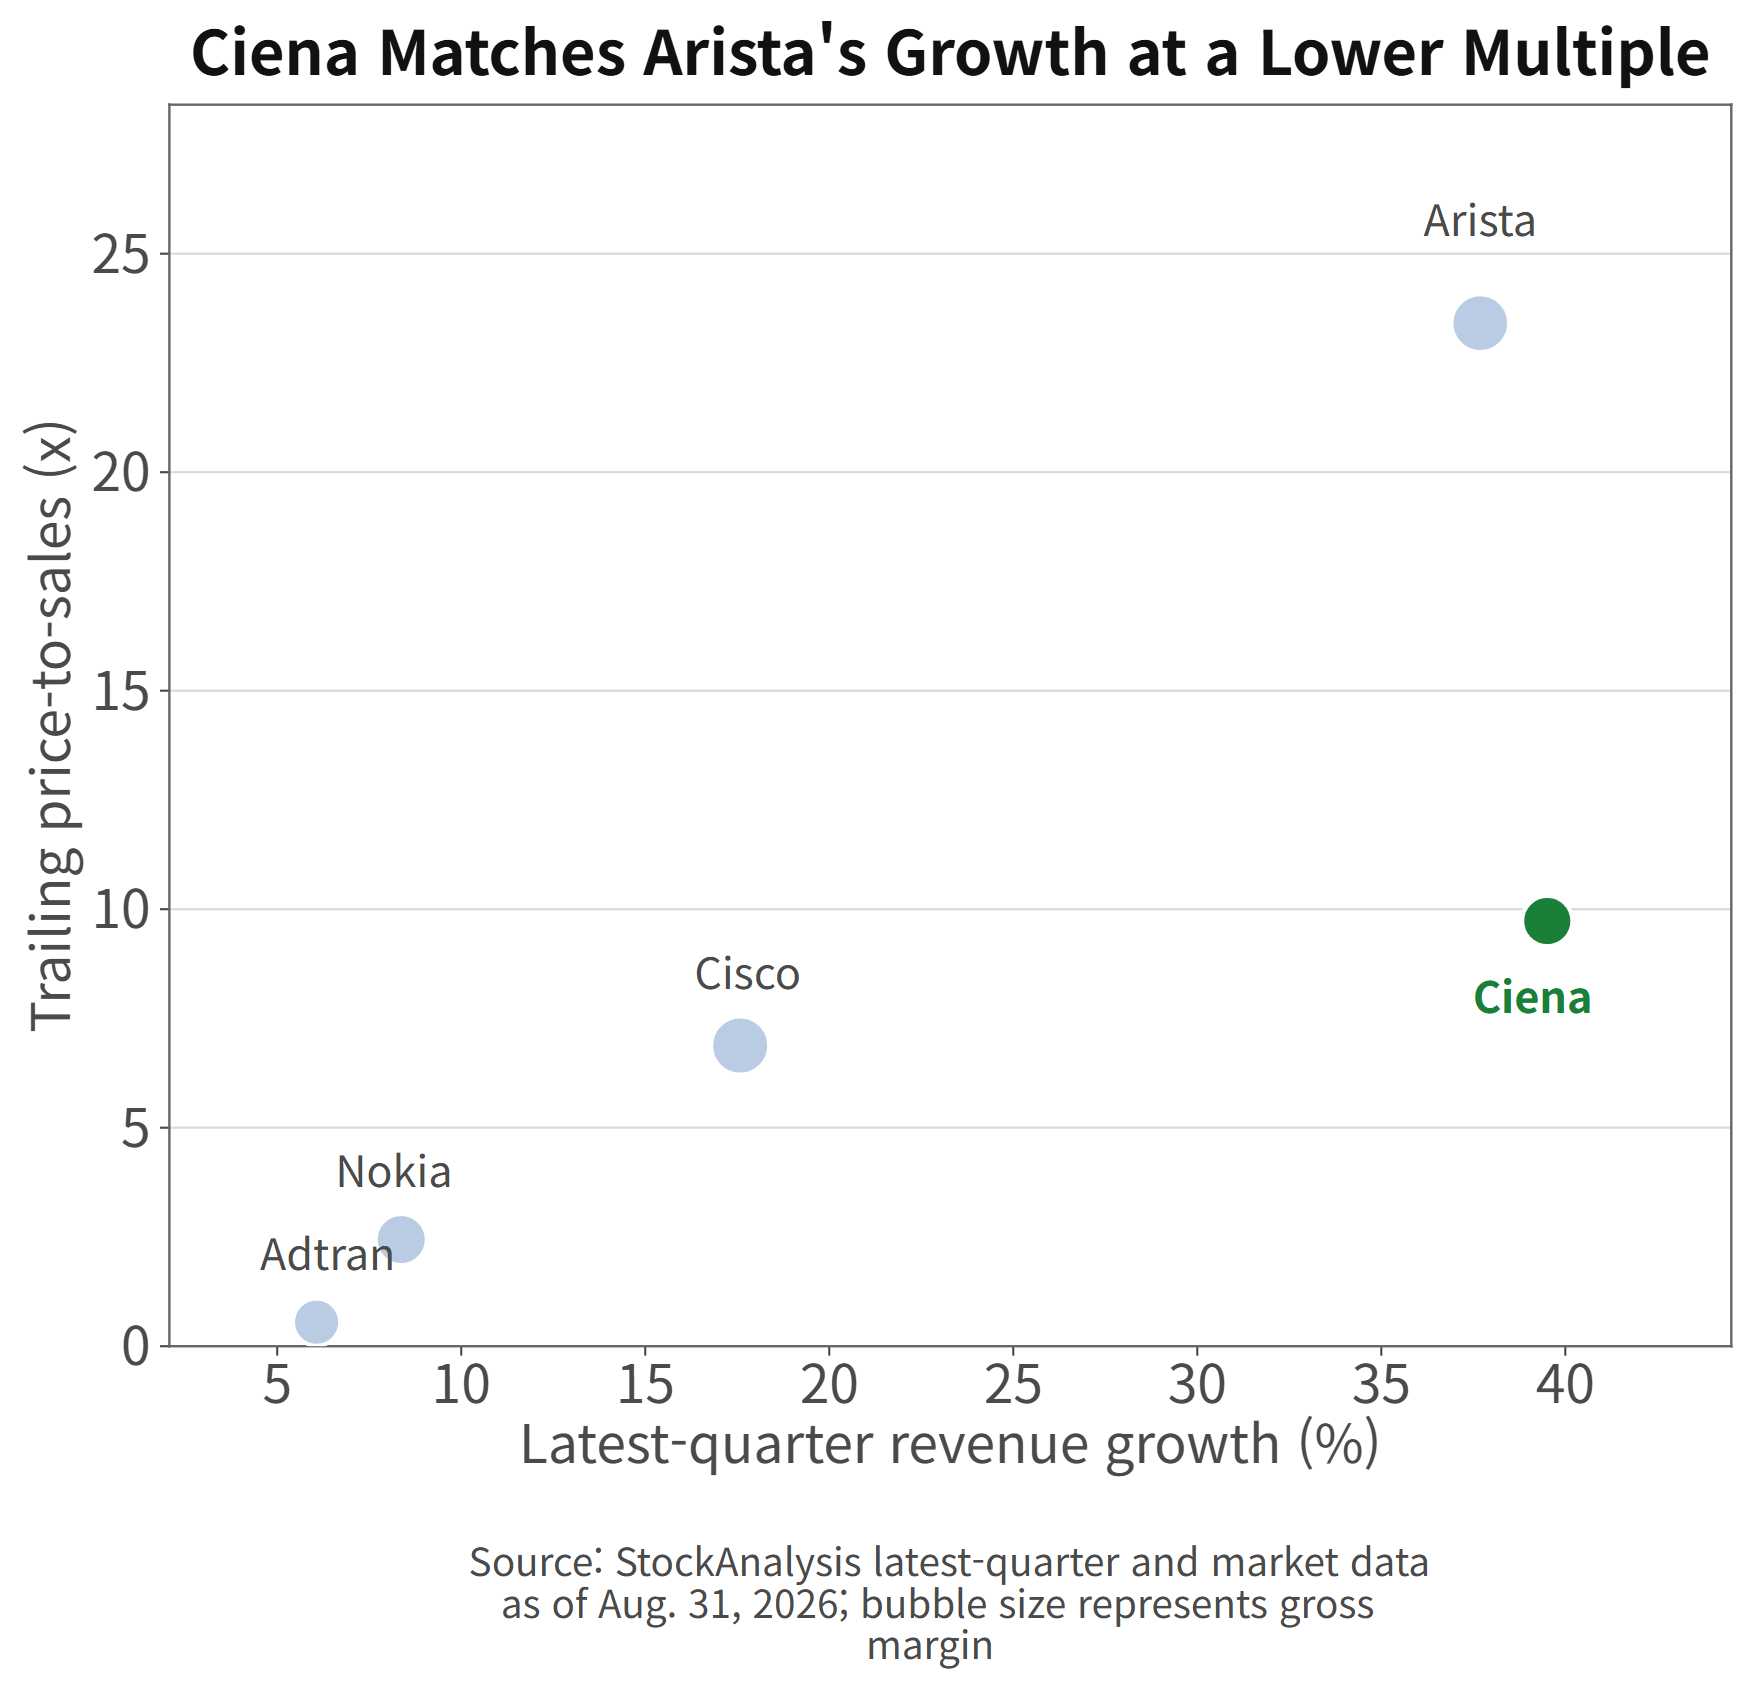
Ciena currently combines growth close to Arista's with a much lower gross margin. Its sales multiple sits above Cisco, Nokia, and Adtran, but far below Arista. The valuation says the market sees Ciena as more than a traditional telecom-equipment supplier, yet has not granted it Arista's profitability premium.
Revenue growth, sales multiples, and gross margins across network-equipment peers
That middle position is reasonable only if margins keep climbing. If Ciena settles near the gross-margin profile of a conventional optical vendor, a high sales multiple becomes difficult to defend. If cloud exposure, product mix, and operating leverage lift profitability for several years, the current peer gap could persist.
Ciena Valuation: The Multiple Moved First
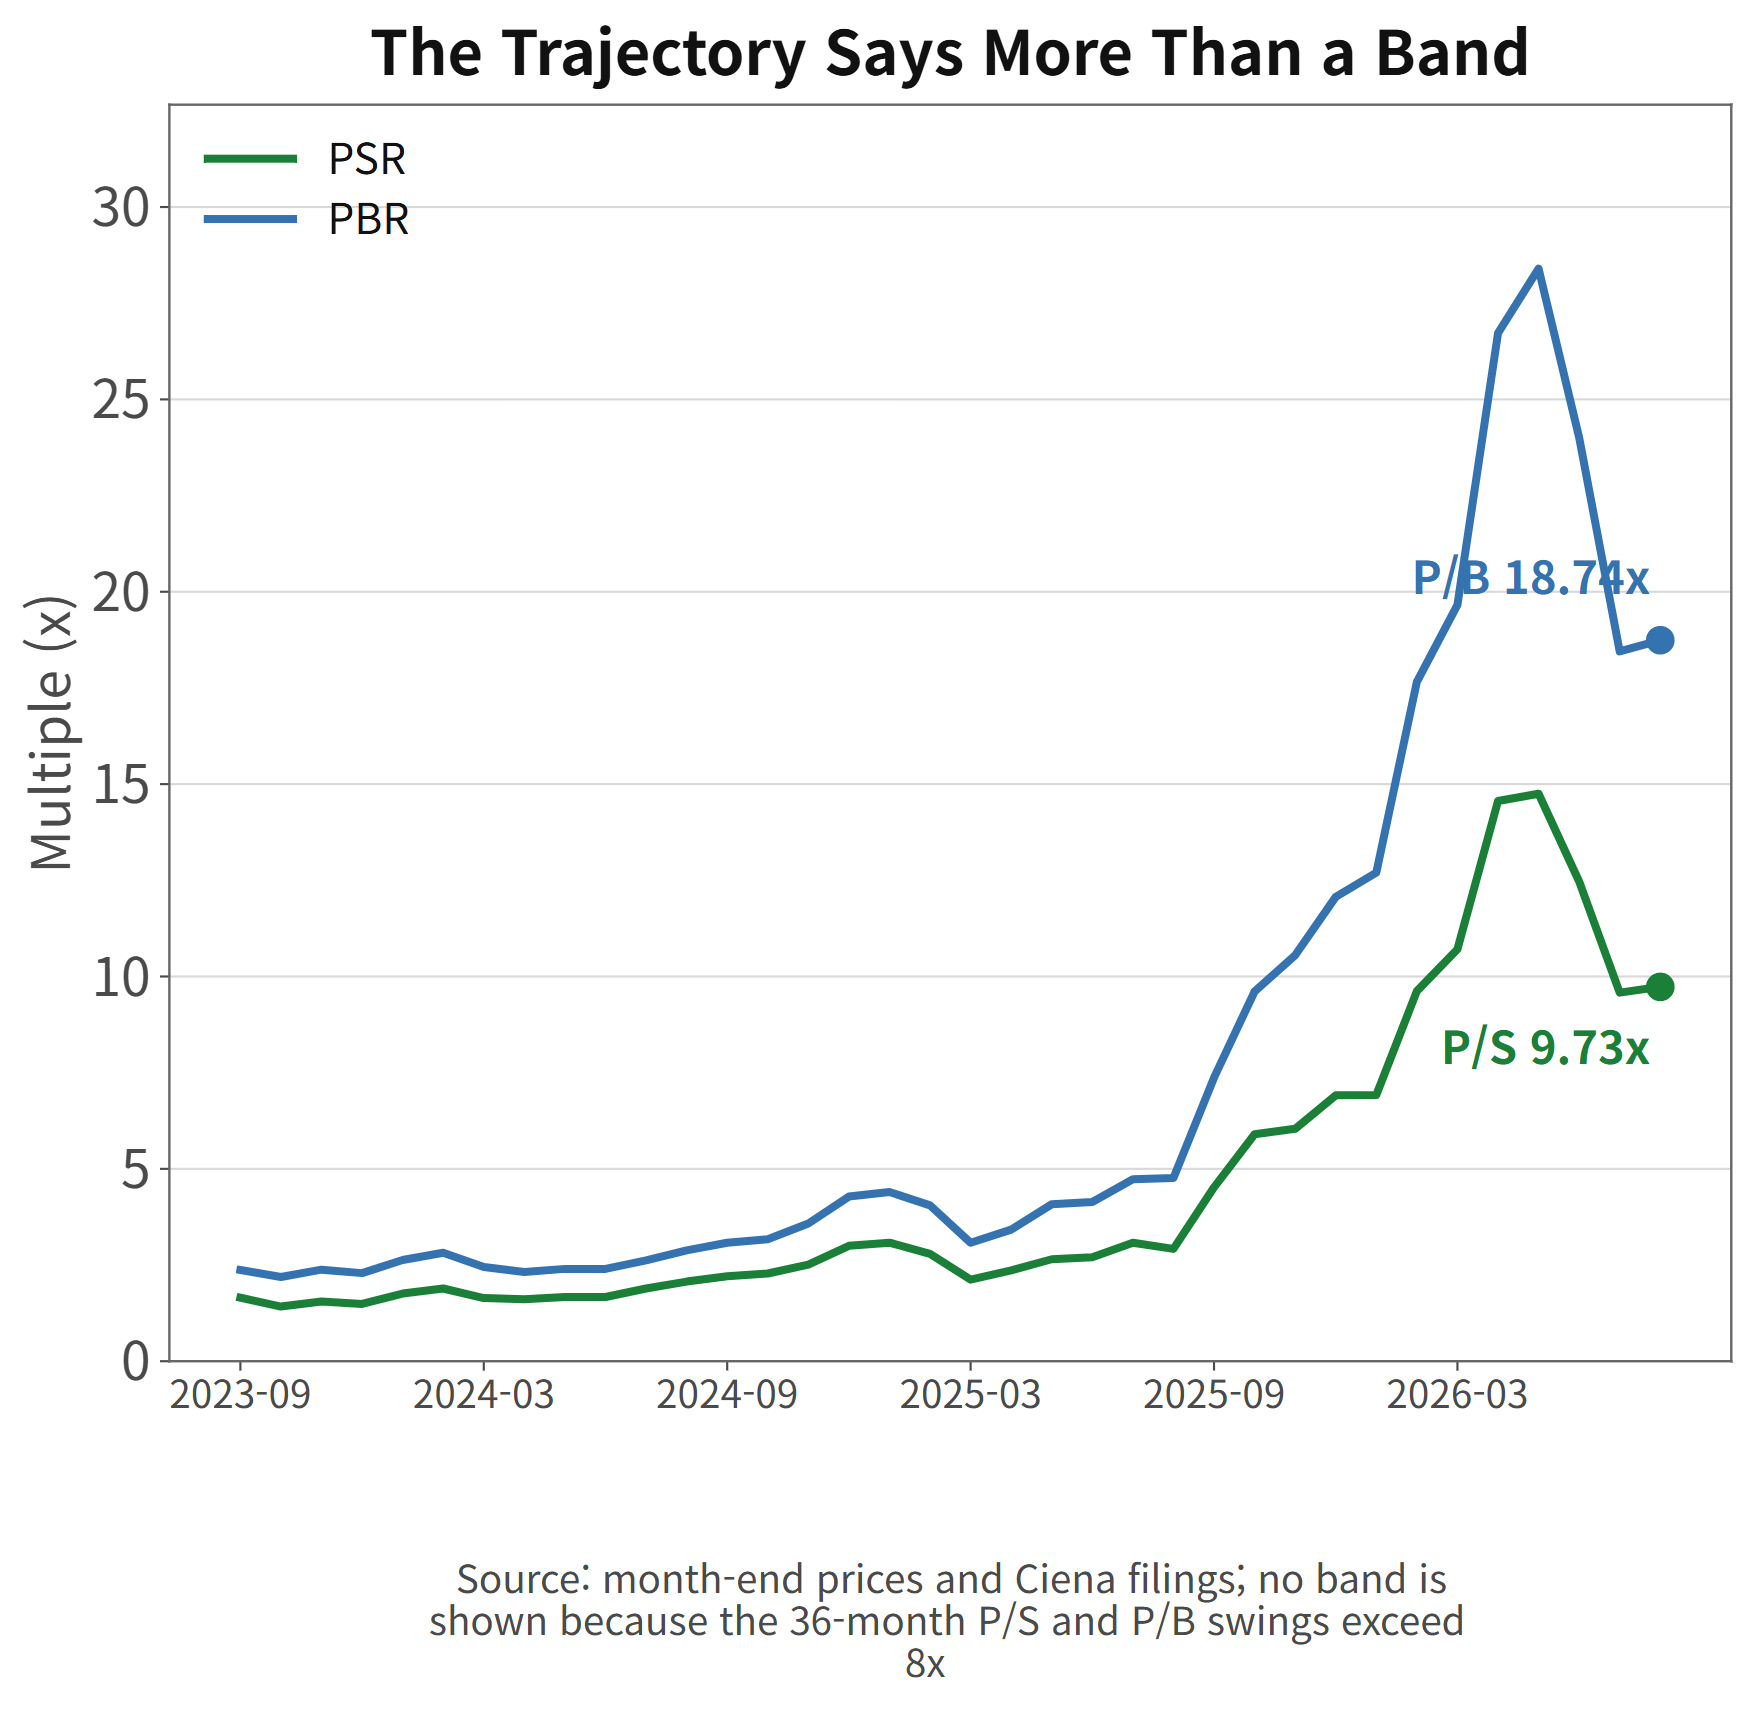
At $382.80, Ciena's $54.19 billion market value equals 9.73 times trailing revenue and 18.74 times book value. Trailing GAAP earnings are recovering too quickly for the 127.6 times trailing P/E ratio to be especially useful. Forward estimates offer a cleaner, though still uncertain, frame.
Ciena trailing price-to-sales and price-to-book trajectories
The August 31 consensus called for fiscal 2027 revenue of $8.01 billion and adjusted EPS of $9.67. On those figures, the stock trades at about 6.77 times forward sales and 39.6 times forward adjusted earnings. Those are demanding multiples for an equipment company, even one growing rapidly.
The market-cap decomposition shows how much of the rerating came from expectations. Relative to fiscal 2024, Ciena's market value rose 5.86 times while revenue increased 1.39 times. The remaining 4.23 times came from sales-multiple expansion. Relative to fiscal 2025, market value rose 2.02 times, revenue 1.17 times, and the multiple 1.73 times.
Ciena market-cap growth split into revenue growth and sales-multiple expansion
This is a multiplicative relationship, not an additive one: market value equals revenue multiplied by the sales multiple. The point is straightforward. Most of the shareholder-value increase since fiscal 2024 came from investors paying more for each dollar of revenue, not from revenue growth already reported.
Historical valuation bands are not very informative here. The 36-month swings in trailing P/S and P/B both exceed eight turns, making a simple average look precise when the underlying regime has changed. The trajectory is more honest: Ciena moved from roughly 1.5 to 3 times sales through much of 2022 to mid-2025, then briefly approached 15 times before settling near 9.7 times.
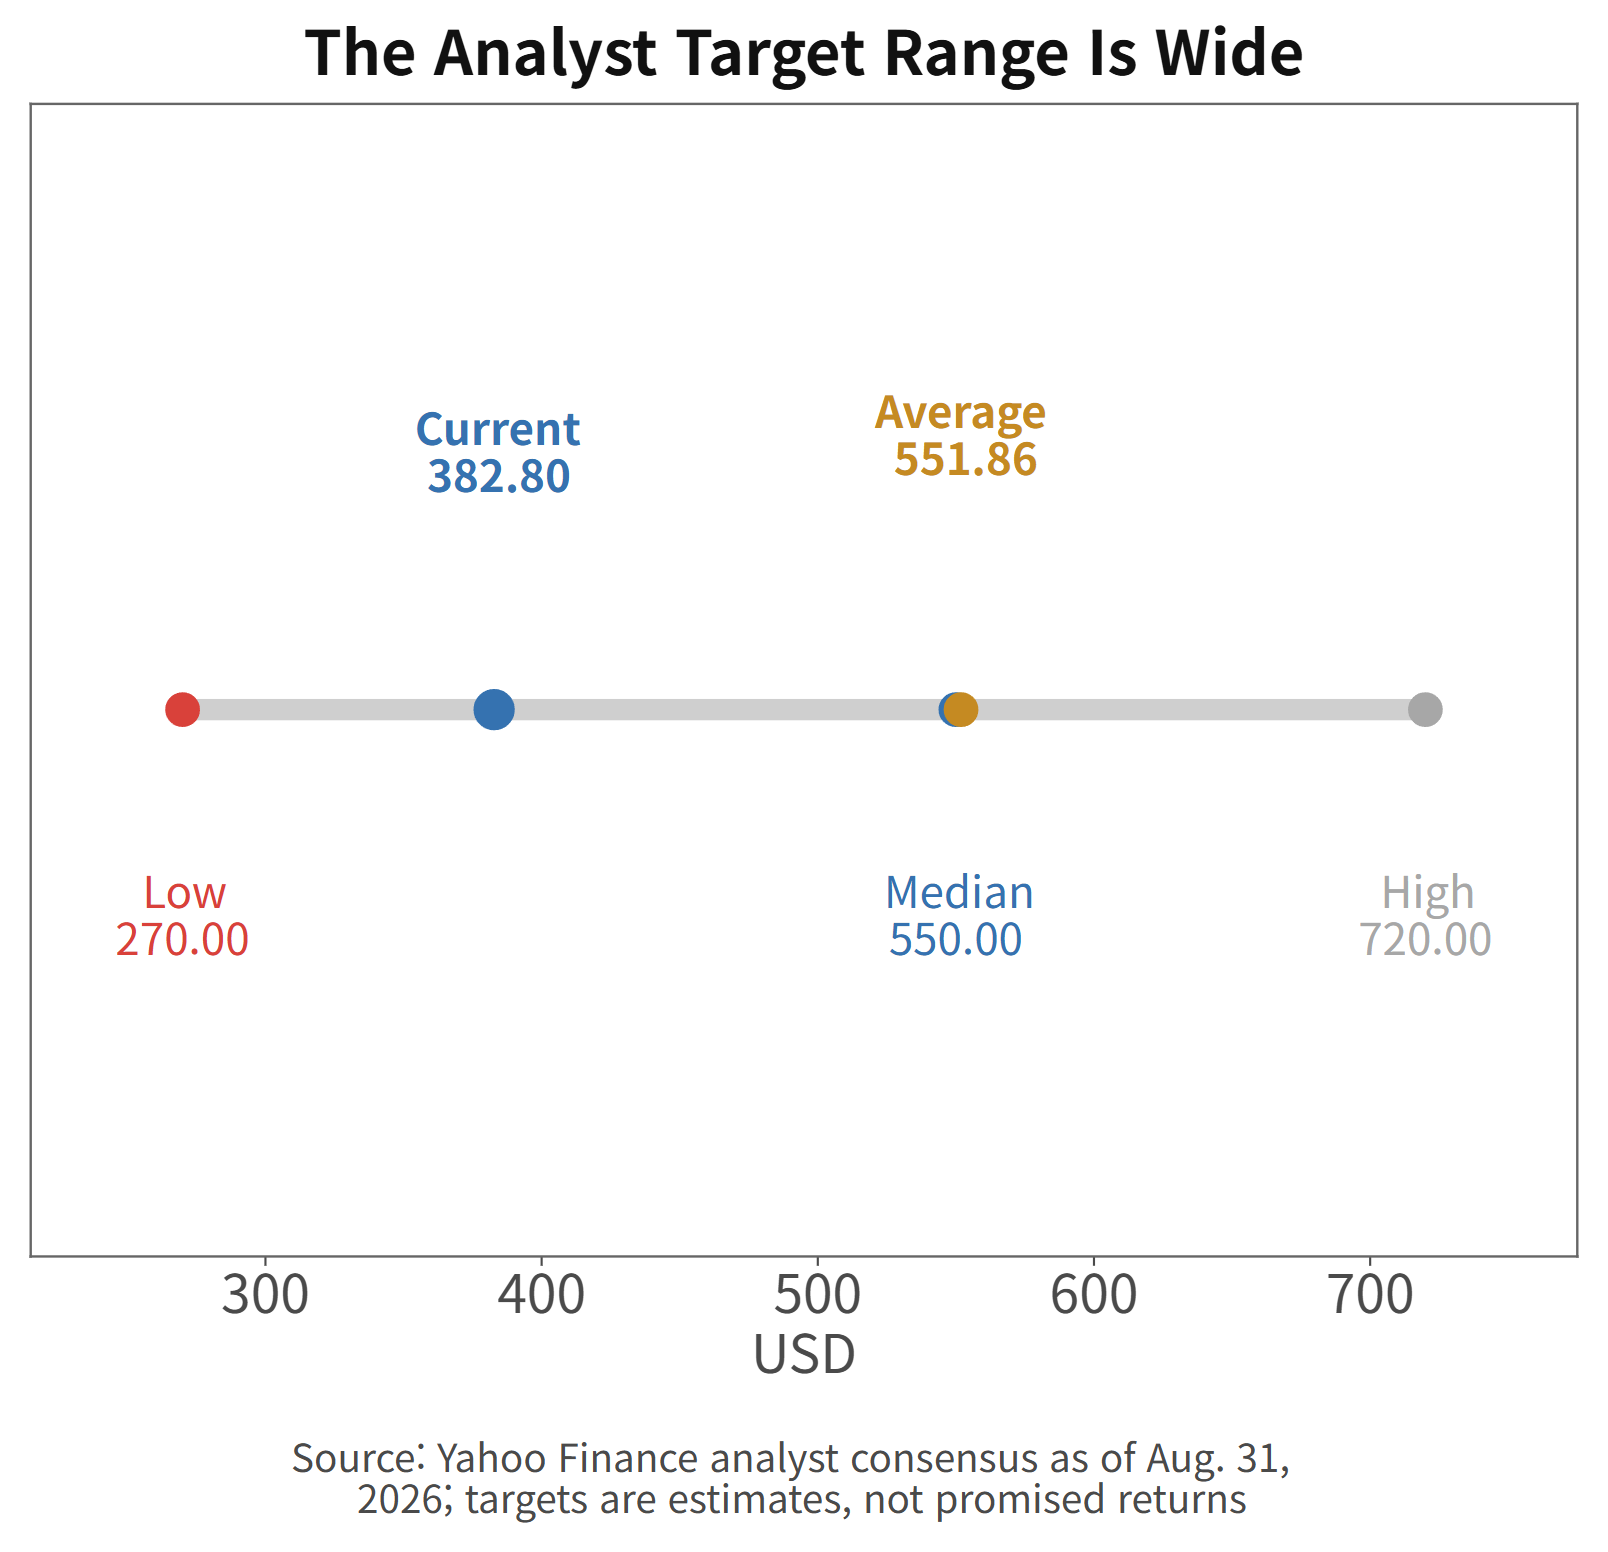
Twenty analysts had price targets ranging from $270 to $720, with a $550 median and a $551.86 average. The range is so wide that it is better read as a map of uncertainty than as a valuation anchor. The low target sits below the current price, while the high target assumes a substantially richer outcome.
Ciena's current price against the analyst target range
What Matters on September 3?
Ciena is scheduled to report fiscal Q3 results on September 3. The headline comparison is simple: company guidance centers on $1.625 billion of revenue, while consensus stands at $1.640 billion. The more useful checklist goes deeper.
Ciena fiscal Q3 and full-year fiscal 2026 outlook (source: company earnings presentation)
First, watch the split between direct cloud and service-provider demand. Continued strength in both would make the growth cycle more durable than a single-customer buildout. Second, compare adjusted gross margin with the 45% midpoint. Third, look for evidence that the $2.5 billion of remaining performance obligations is converting without unusual delays. Fourth, check whether full-year revenue and operating-margin guidance remain intact.
One result deserves special attention: the implied fiscal Q4 requirement. If Q3 lands near the midpoint, the company needs about $1.677 billion in Q4 to reach its $6.3 billion annual midpoint. A guide around or above that level would support the current earnings path. A guide materially below it would force the market to reconsider either the annual target or the timing of demand.
The capital-allocation update matters too. After the expensive May and June repurchases, investors should ask whether management has become more price-sensitive. A pause would preserve optionality. Continued buying at a rich multiple would raise the burden on future operating performance.
Risks and a Decision Framework
The bull case begins with execution. Cloud revenue continues to grow rapidly, service providers enter a broader optical-upgrade cycle, gross margin stays near 45%, and operating leverage pushes adjusted earnings toward the fiscal 2027 consensus. In that case, today's valuation could compress through growth rather than a falling share price.
The base case is less dramatic. Revenue grows, but customer deployment schedules keep quarters uneven. Margins improve gradually, and the stock's return depends on earnings catching up while the sales multiple drifts lower. The business can perform well without the stock producing the same result if valuation normalizes at the same time.
The bear case does not require the AI bandwidth thesis to fail. It only requires orders to arrive later than expected, one large customer to slow spending, or gross margin to stall. At a high starting multiple, a modest operational disappointment can cause a large valuation reset.
For that reason, the cleanest way to follow Ciena is through four linked tests:
1. Is growth still broad across cloud and service-provider customers?
2. Is gross margin holding near the guided range as volume rises?
3. Are remaining obligations and deferred revenue converting into cash-generating sales?
4. Is per-share value improving after financing, buybacks, and possible dilution?
Ciena has already answered the first-stage question. Demand is real, and recent execution is strong. The unresolved part is price. At 6.77 times fiscal 2027 consensus revenue, investors are paying today for a large portion of tomorrow's network-upgrade cycle.
Methodology and Sources
This analysis uses Ciena's fiscal Q2 2026 Form 10-Q, earnings release, and earnings presentation for reported results, product mix, guidance, customer concentration, and industry forecasts. Financing terms come from Ciena's June 2026 Form 8-K. The service-provider figures come from Ciena's August 2026 survey release; the survey was conducted by Censuswide for Ciena from July 13 through July 23, 2026.
Market price, market capitalization, consensus estimates, analyst targets, and peer multiples are snapshots as of August 31, 2026, collected from public market-data aggregators and cross-checked against company filings where applicable. Forward multiples use the August 31 close of $382.80, a $54.19 billion market capitalization, fiscal 2027 consensus revenue of $8.01 billion, and fiscal 2027 adjusted EPS of $9.67. The market-cap decomposition is an original calculation: change in market value equals change in revenue multiplied by change in the sales multiple. All consensus figures are estimates, not company guidance, and may change after the next earnings release.