- There are two kinds of chip companies: the ones that design chips and outsource the manufacturing, and the ones that build other people's designs for a fee. The second kind — the foundry — is contract manufacturing, and contract manufacturing is supposed to run on thin margins.
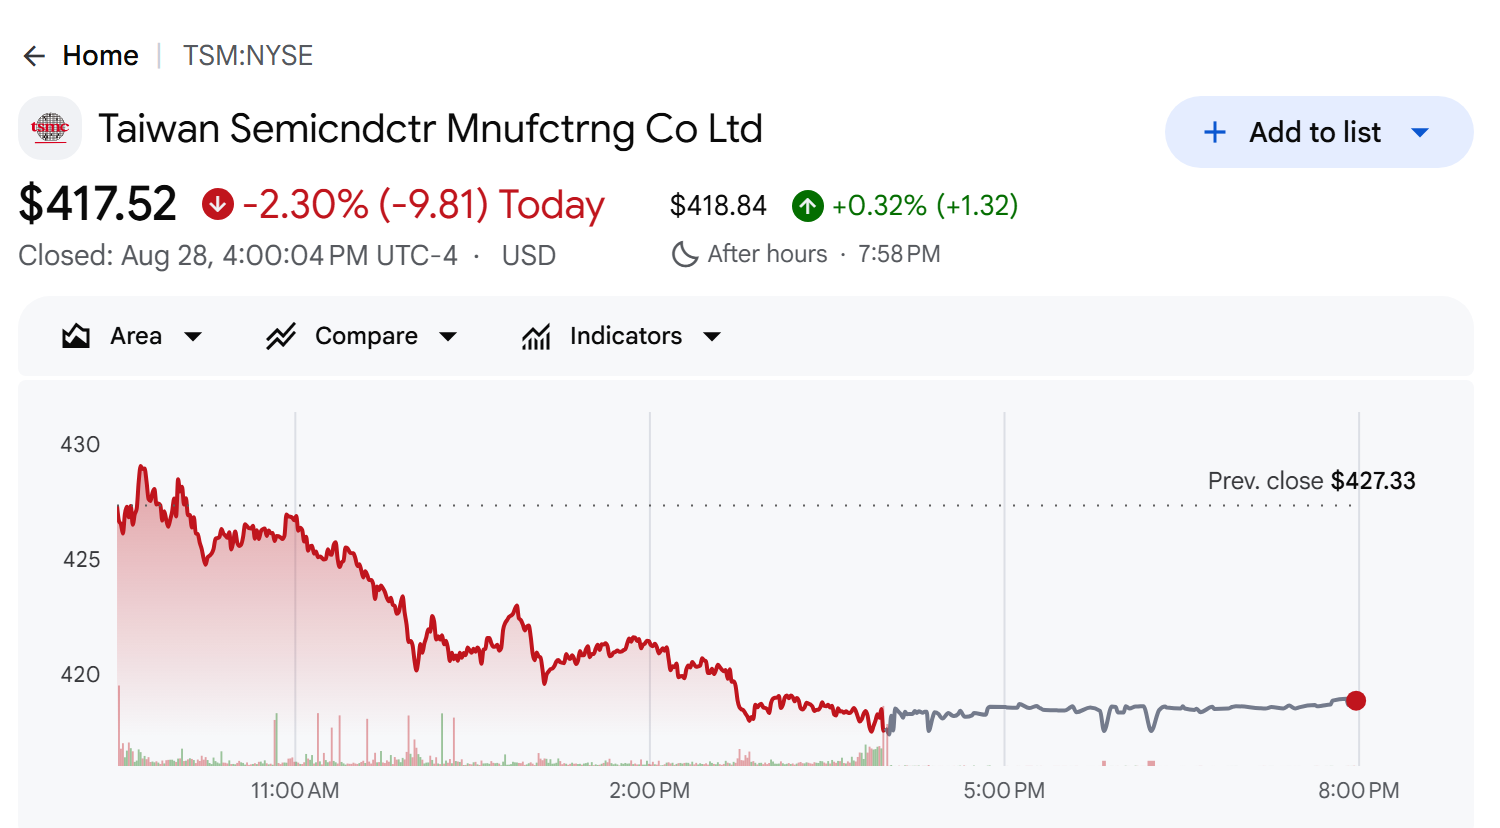
- TSMC posted a 60.3% operating margin for the second quarter of 2026. The company that builds the chips kept a fatter margin than most of the companies that design them. Revenue came to $40.20 billion, the ADR closed at $417.52 on August 28, and the market cap works out to $2.17 trillion.
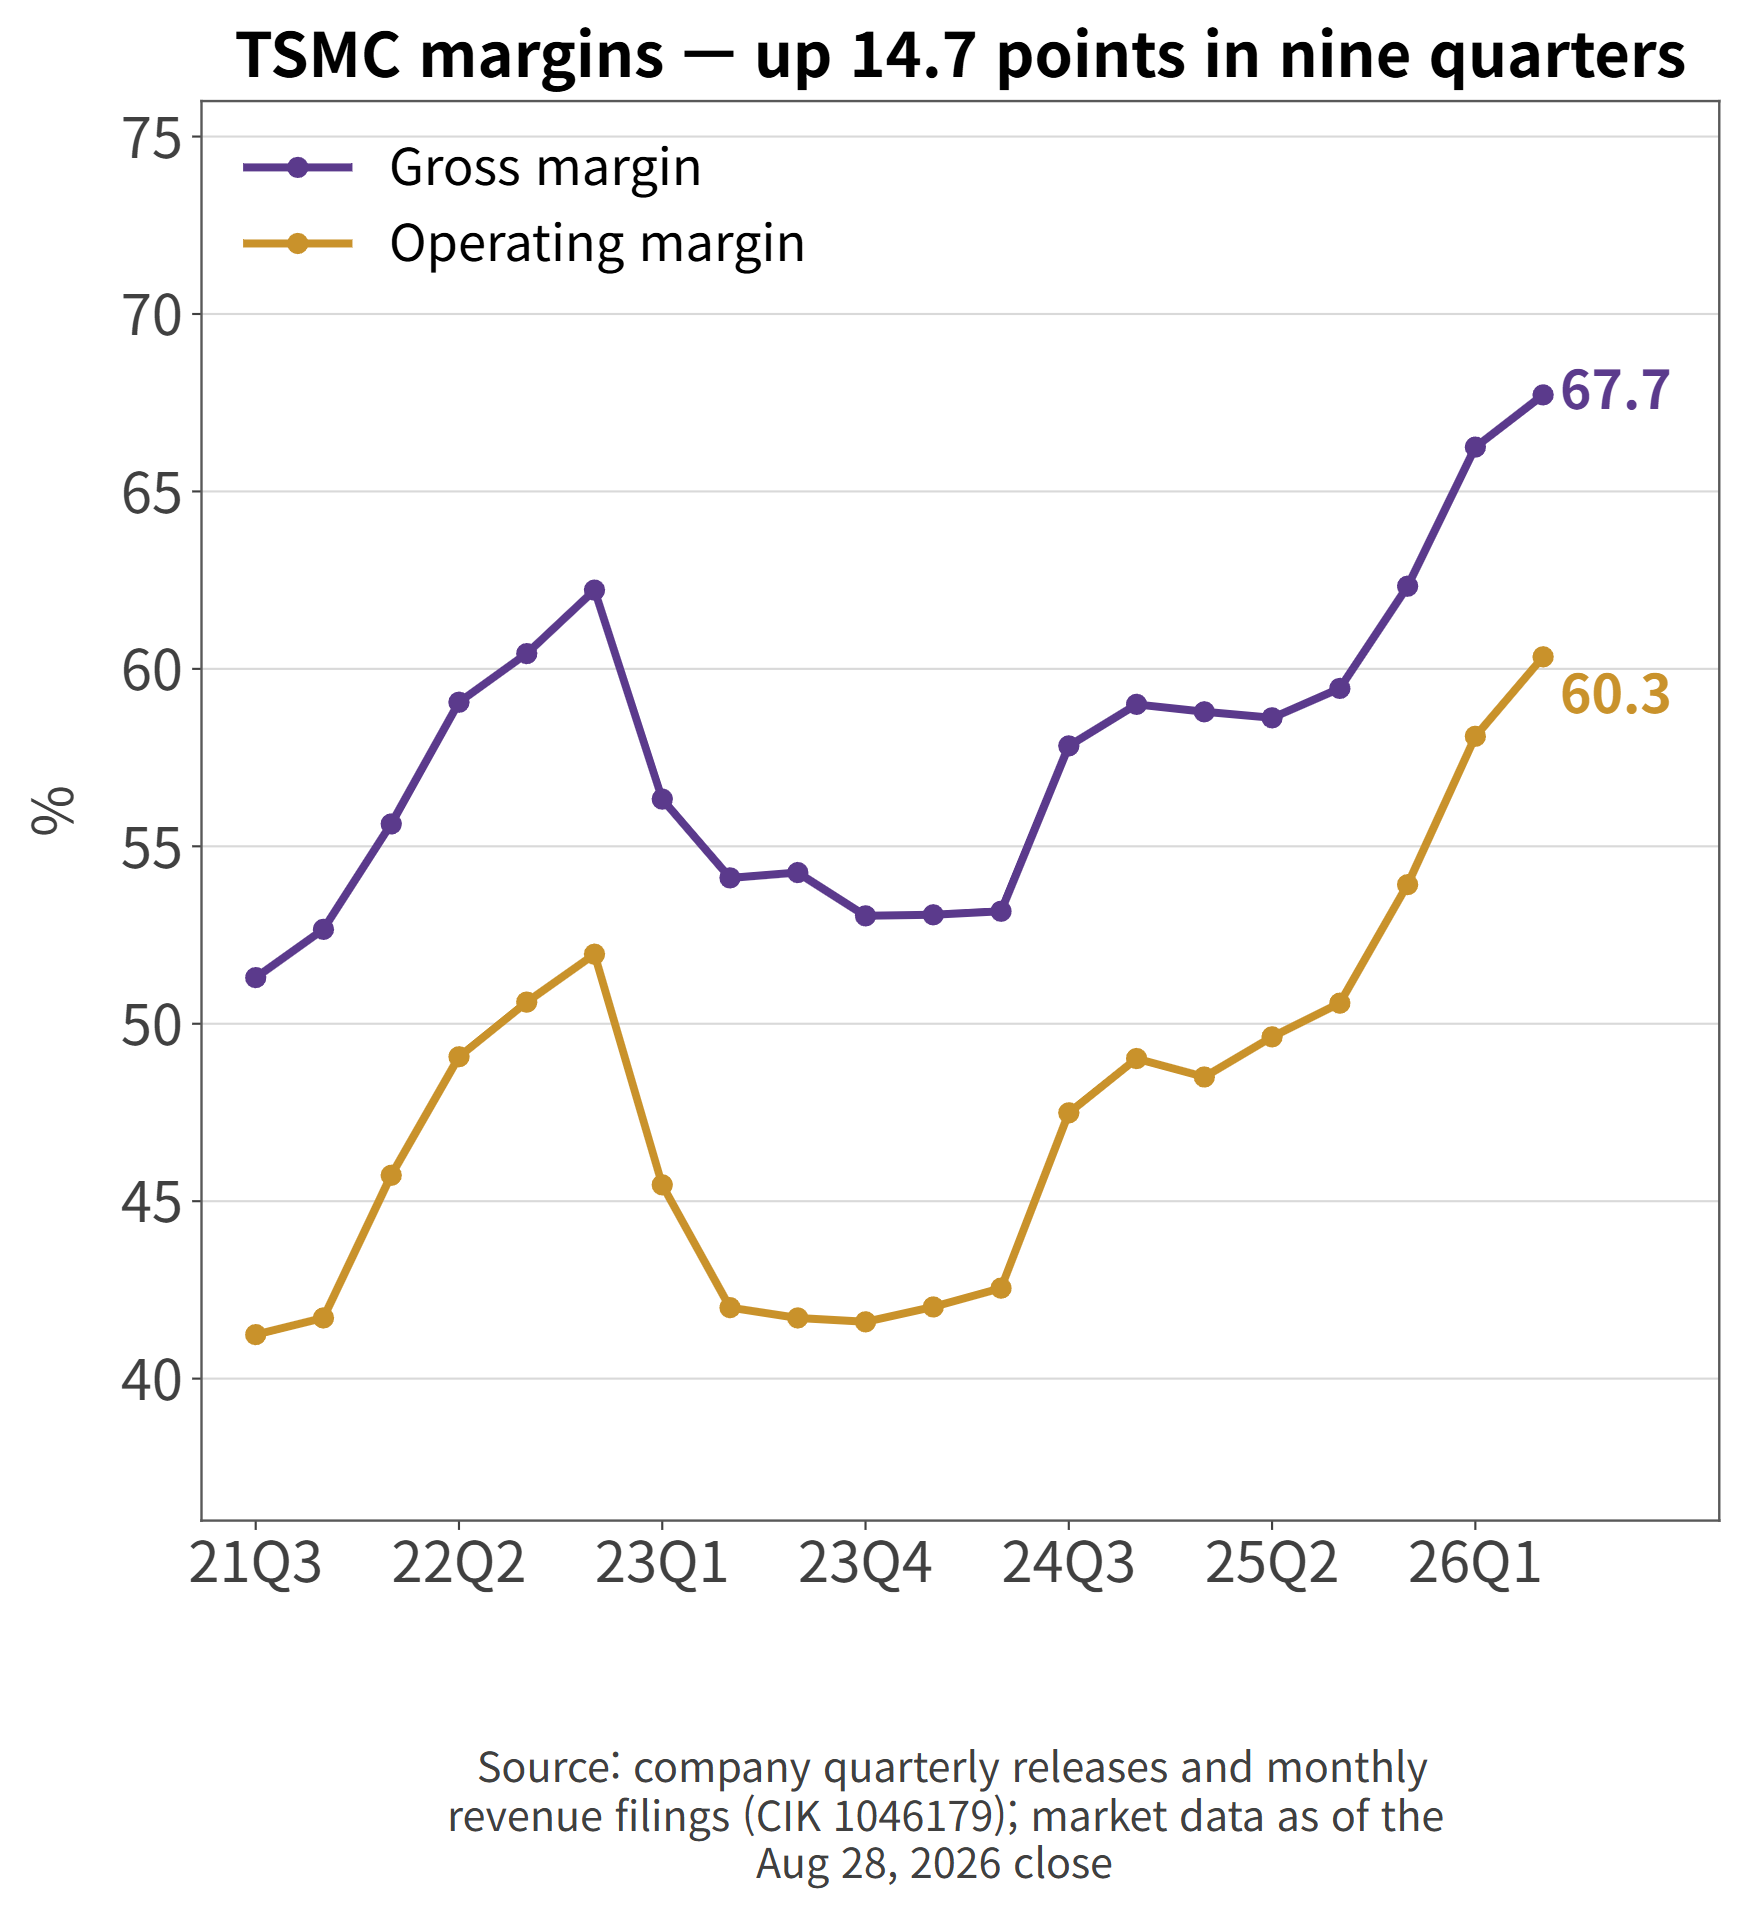
- This article asks one question: what pushed a contract manufacturer's margin to 60%, and how long can it stay there? The company left a clue in its own filings. TSMC publishes a margin forecast every quarter, complete with an exchange-rate assumption — and its actual results have now beaten the top of that forecast four quarters in a row.
How Does a Contract Manufacturer Earn a 60% Margin?
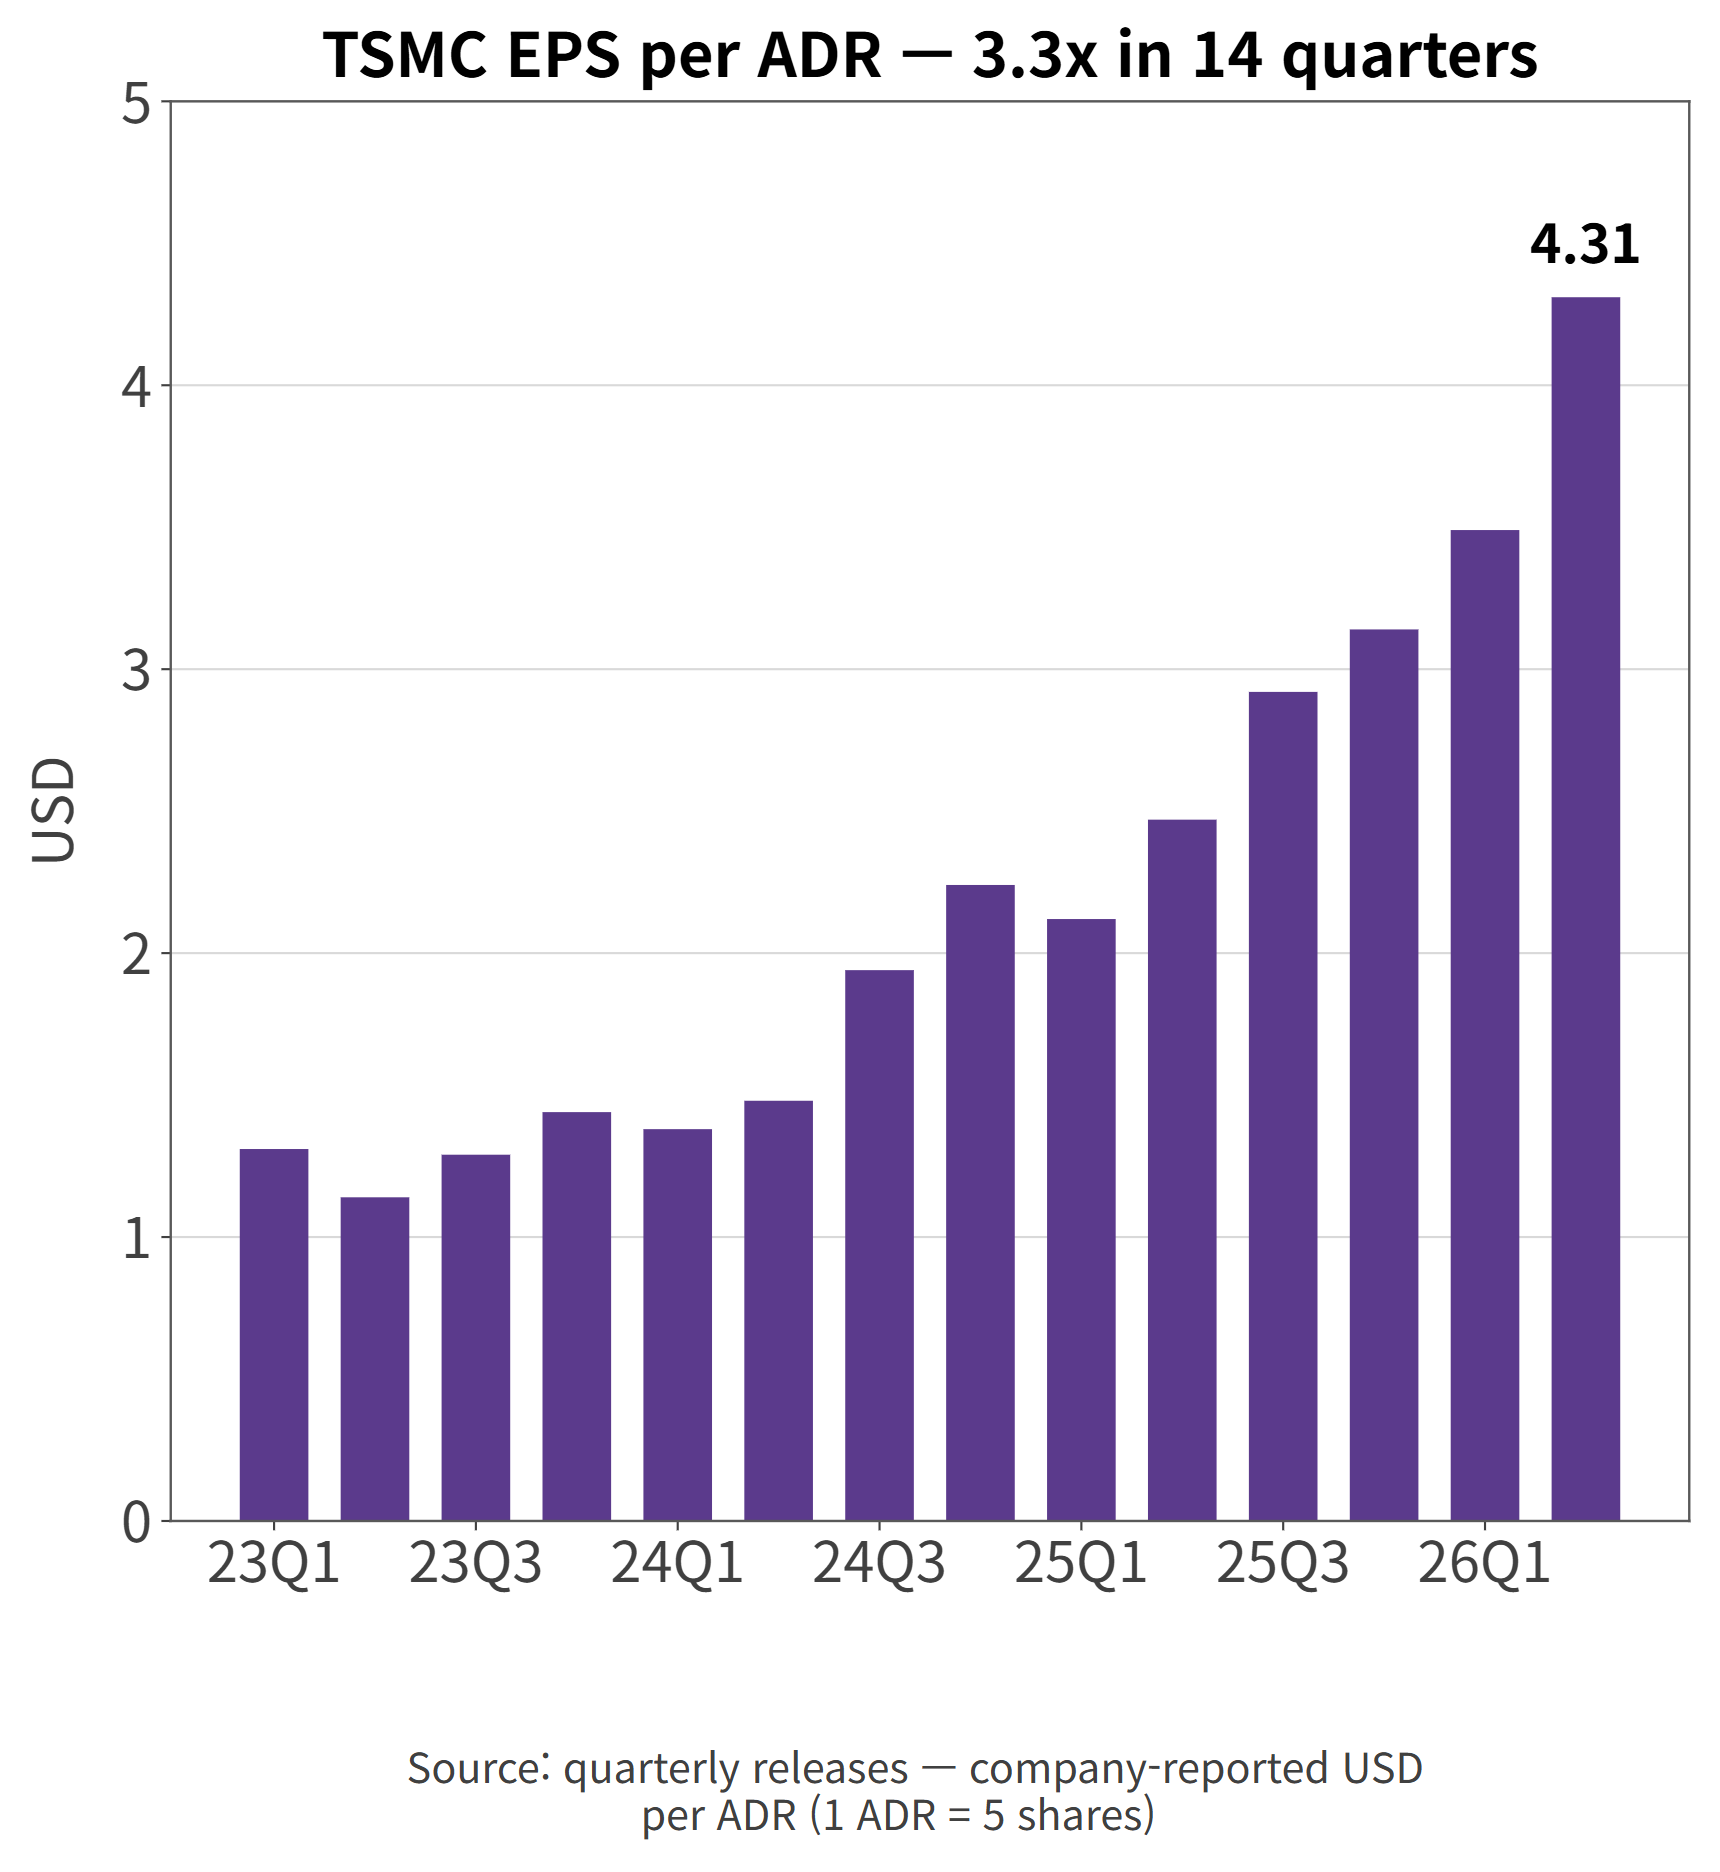
- Second-quarter revenue reached NT$1,270.4 billion, up +36.0% from a year earlier. Net income grew +77.4% — profit moving twice as fast as sales. Earnings per ADR came to $4.31.

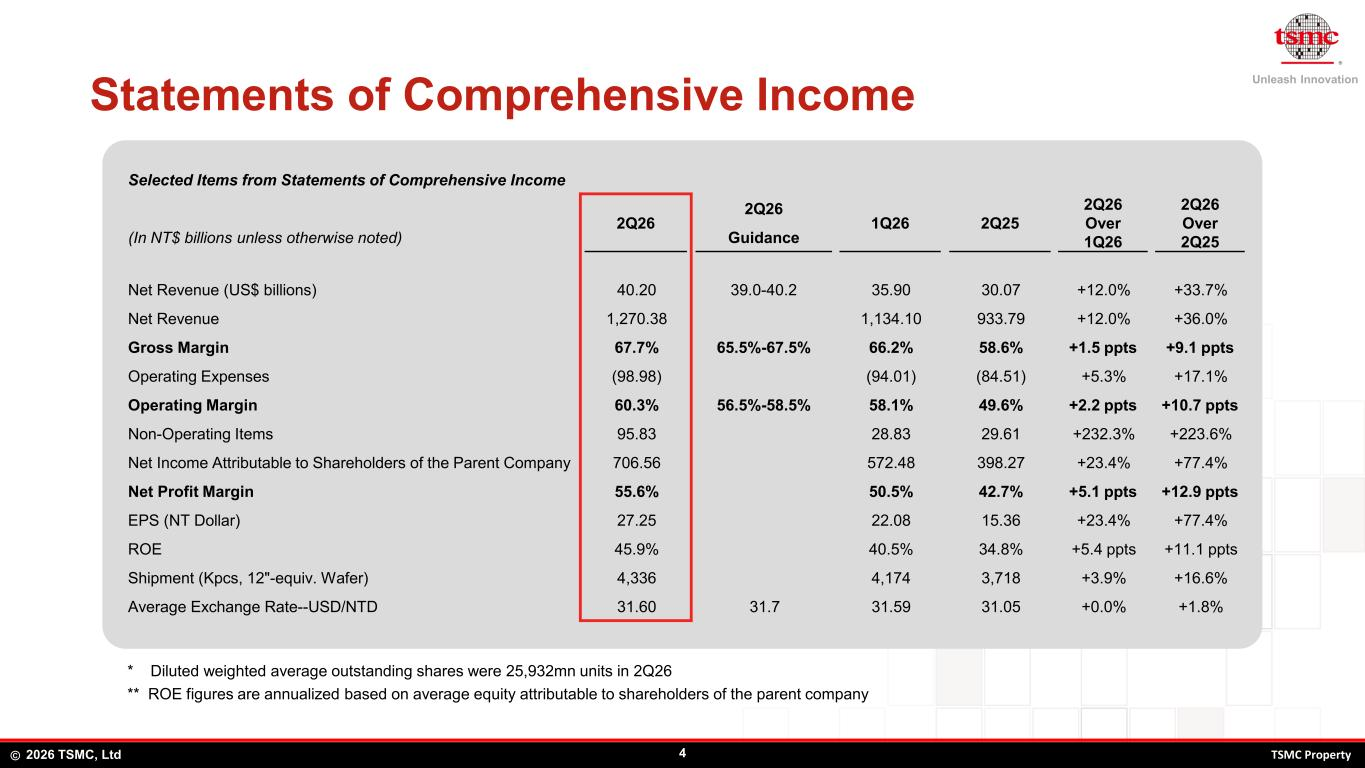
| Metric | 2Q26 | Company guidance | 1Q26 | 2Q25 |
| Revenue (US$ billions) | 40.20 | 39.0~40.2 | 35.90 | 30.07 |
| Gross margin | 67.7% | 65.5~67.5% | 66.2% | 58.6% |
| Operating margin | 60.3% | 56.5~58.5% | 58.1% | 49.6% |
| Net profit margin | 55.6% | — | 50.5% | 42.7% |
| Return on equity | 45.9% | — | 40.5% | 34.8% |
- Source: page 4 of the company's 2Q26 earnings presentation
- Look at where the actuals landed relative to guidance. Revenue touched the very top of the range the company had given, and both margin lines finished above their ranges. TSMC beat its own forecast — and, as we'll see, not for the first time.
- The time series makes the climb explicit: gross margin went from 53.1% in the first quarter of 2024 to 67.7% in nine quarters, a gain of +14.7 points. That did not happen because the whole chip industry is booming. The industry statistics, which we'll get to, point the other way.
TSMC Revenue Breakdown: Wafers, Platforms, Nodes
- What TSMC sells is wafer processing. Fabless companies like Apple and Nvidia bring their designs; TSMC manufactures the chips and charges by the wafer. In the second quarter, 84.5% of revenue came from wafers and the rest from adjacent services such as packaging and testing.
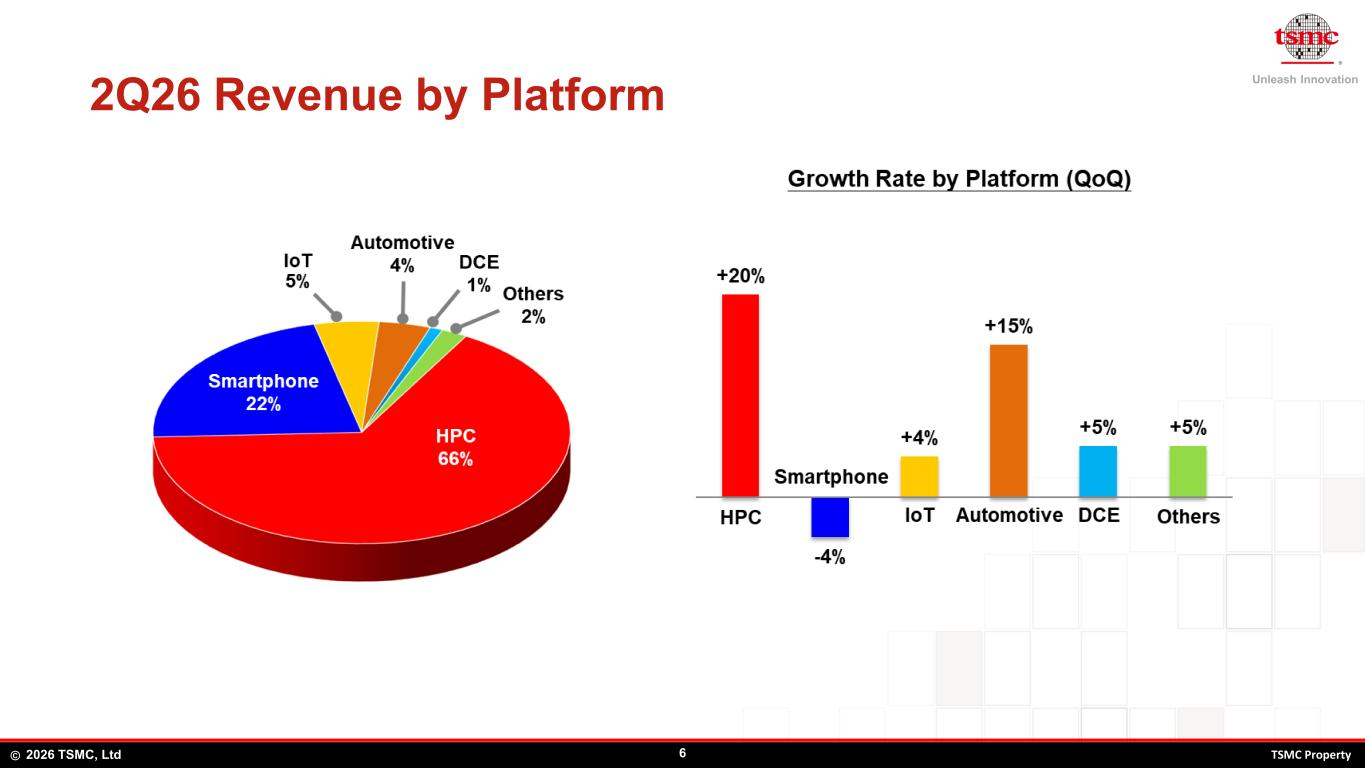
- The customer mix is disclosed by what the company calls platforms. High-performance computing — the AI-server bucket — took 66% of revenue, smartphones 22%, IoT 5%, automotive 4%. The growth split tells the story: HPC rose +20% quarter over quarter while smartphone revenue fell -4%. AI silicon is pulling the company; phones now account for barely a fifth of sales.
- That other 15.5% deserves a look too. Revenue from beyond-the-wafer services reached NT$196.7 billion in the quarter, up +42.1% year over year — growing faster than the core business. AI chips need advanced packaging, the back-end step that stacks and stitches multiple dies into one part, so the foundry increasingly sells the back end along with the front.
- The first half also showed some portfolio housekeeping. In May, TSMC sold an 8.1% stake in Vanguard, its mature-node affiliate, and in the same month signed a preliminary agreement with Sony Semiconductor for a next-generation image-sensor partnership. Trimming exposure to old nodes, locking in customers who need the new ones.
- The 2Q26 earnings release and its slide deck lay out each of these splits page by page.
2nm Just Hit the Revenue Table
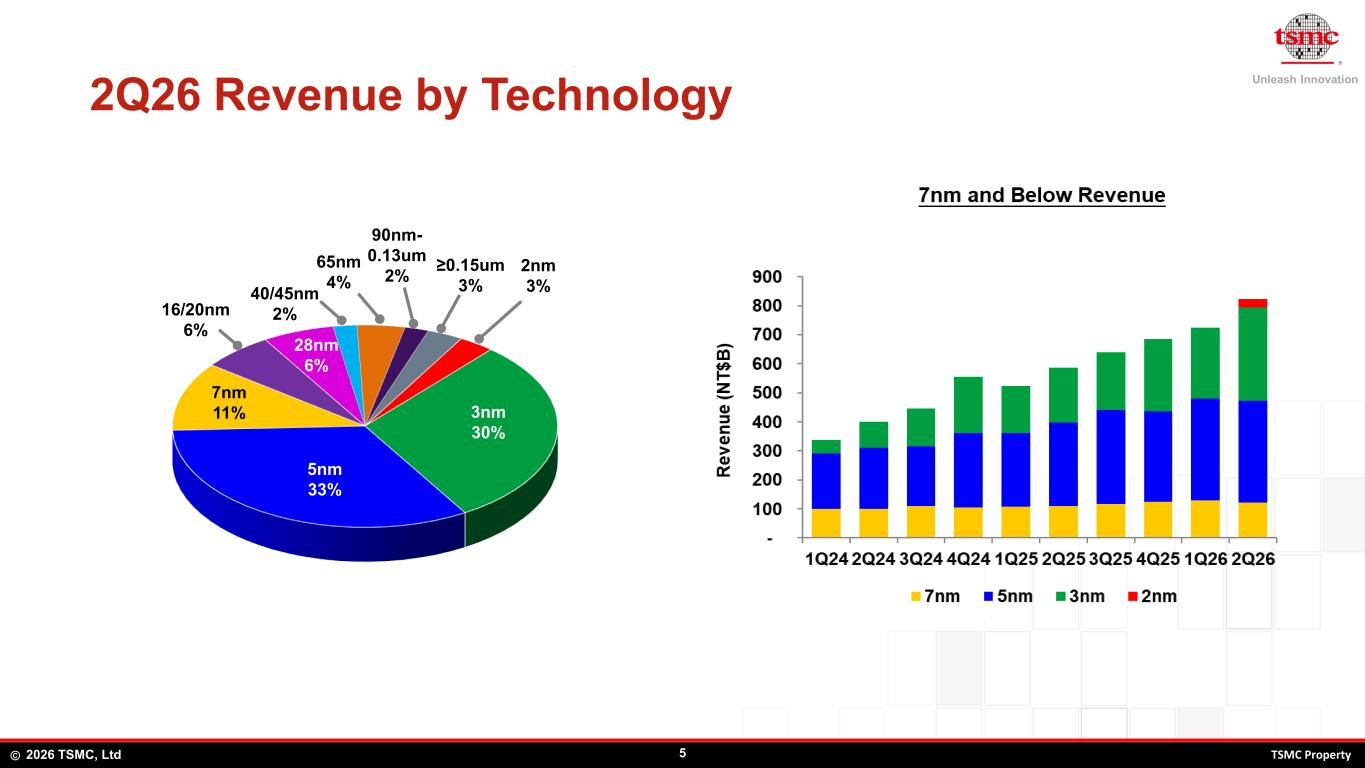
- The same wafer commands a very different price depending on the process node. Here is the company's own breakdown for the quarter.
| Node | Share of wafer revenue | Note |
| 2nm | 3% | First quarter on the table |
| 3nm | 30% | Largest single node |
| 5nm | 33% | Apple and Nvidia workhorse |
| 7nm | 11% | — |
| 7nm and below | 77% | Company's definition of "advanced" |
- Source: page 5 of the company's 2Q26 earnings presentation
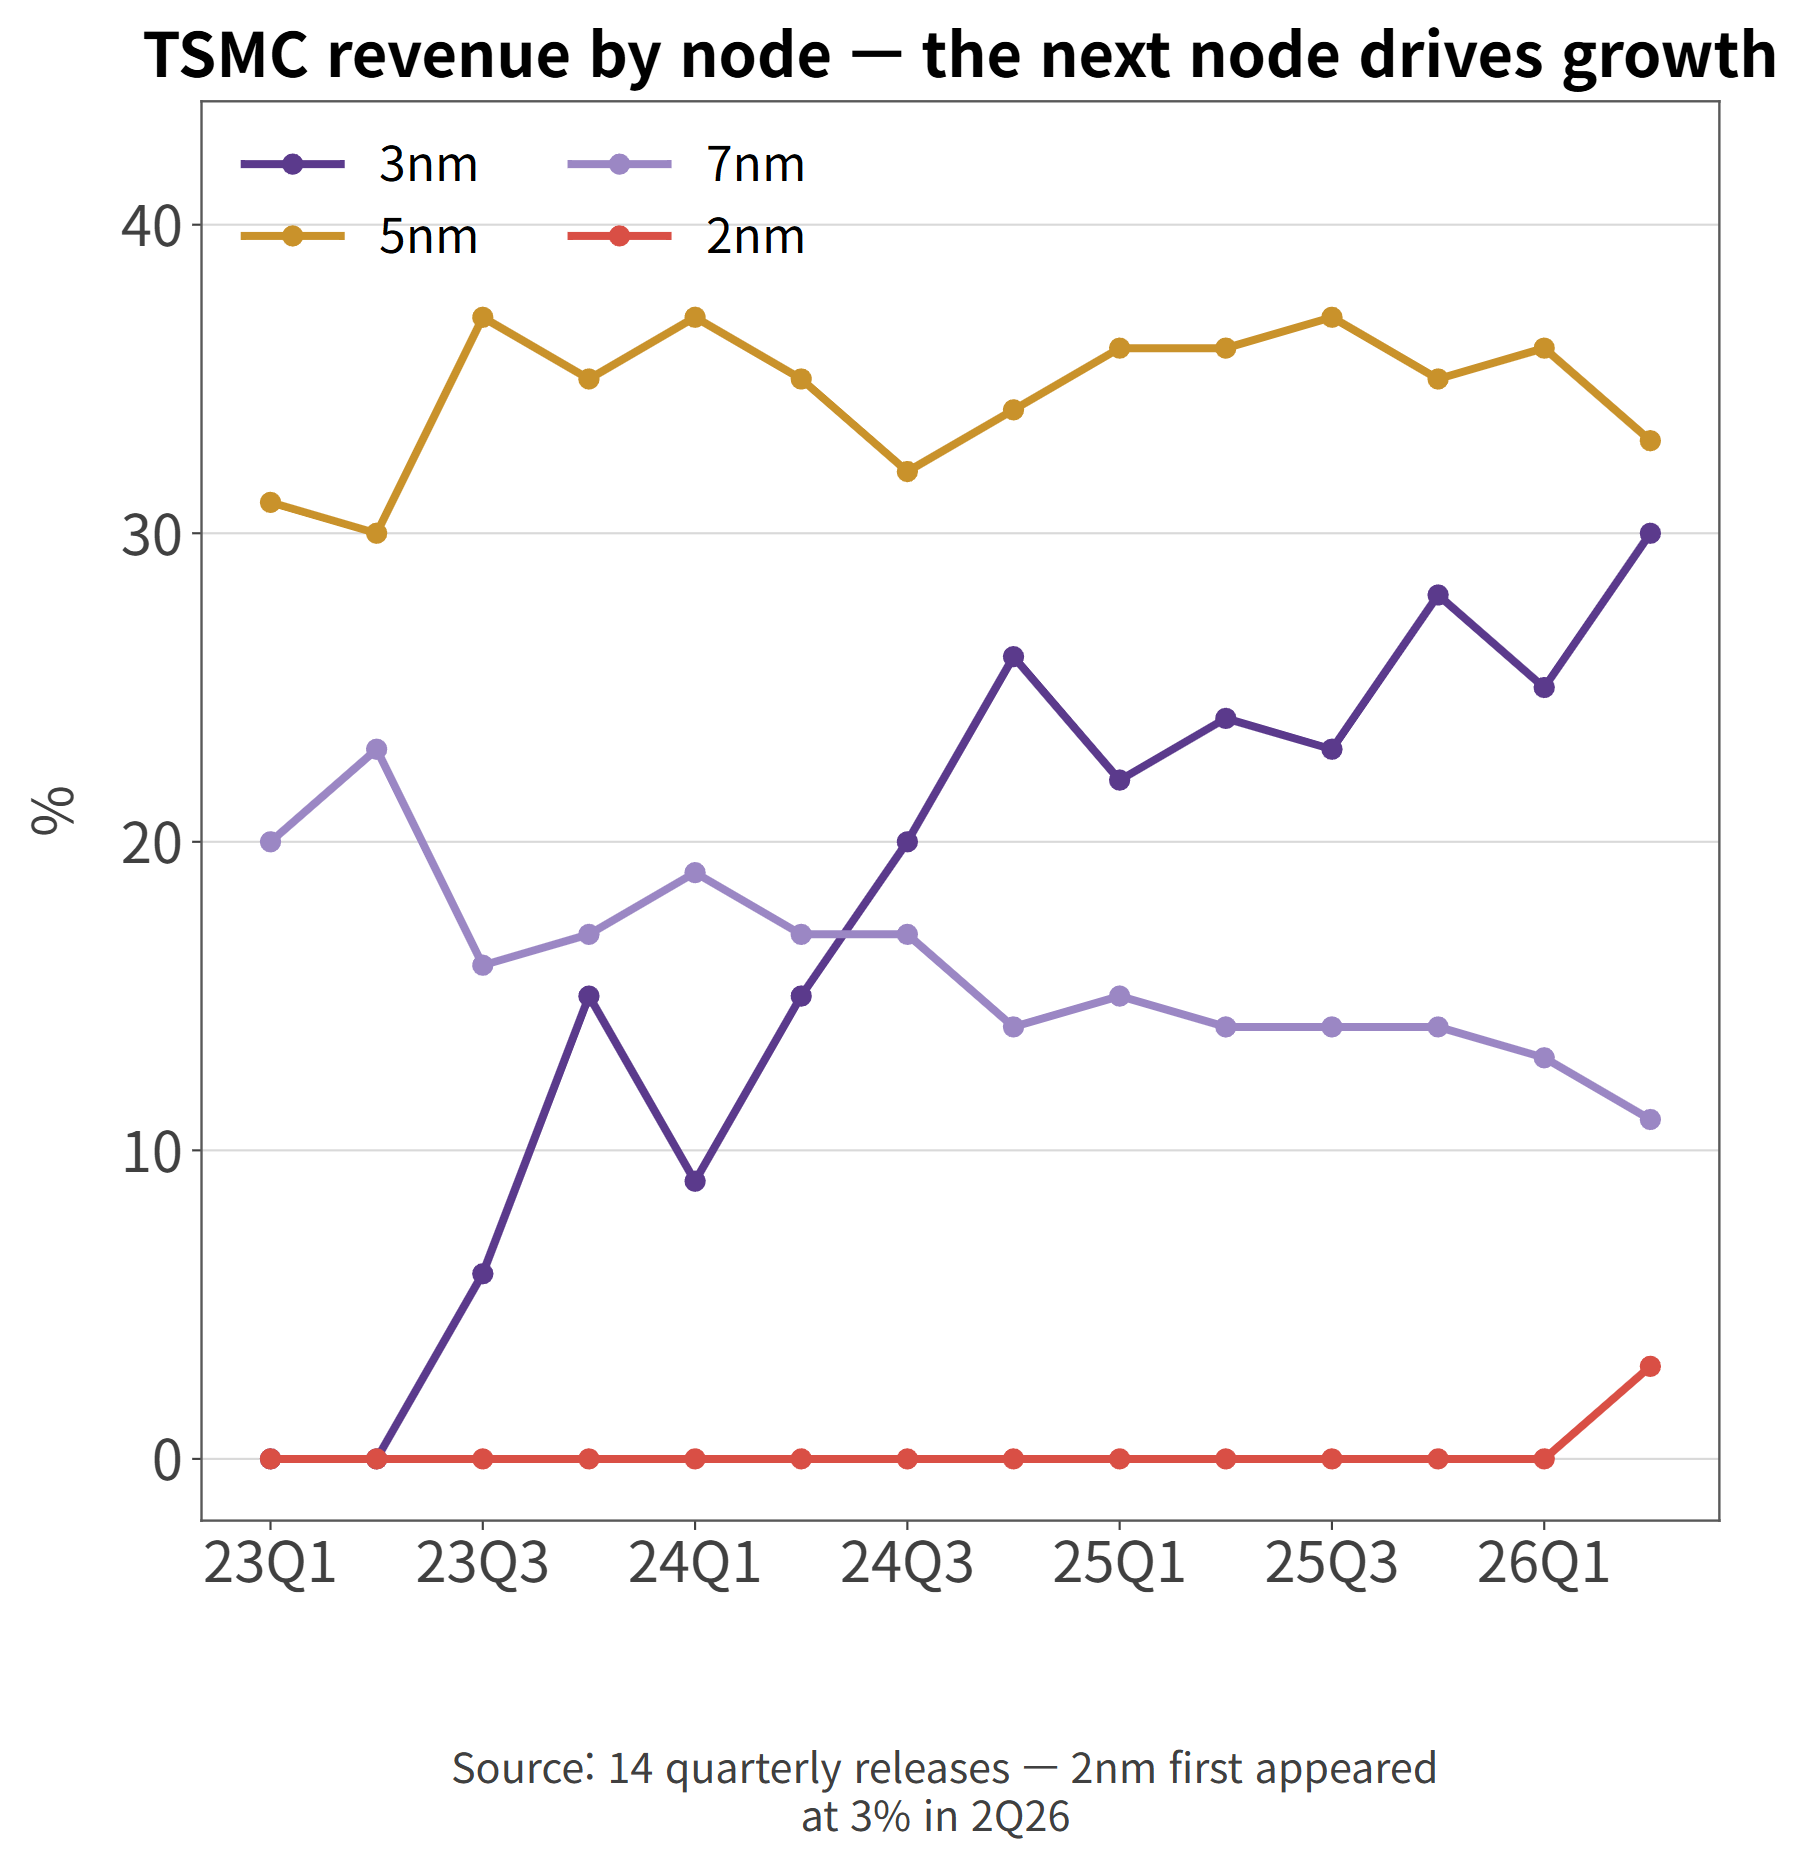
- Three percent looks small. But 3nm entered the table at 6% in late 2023 and reached 30% within eleven quarters. CFO Wendell Huang, explaining the third-quarter outlook, pointed first to the "steep ramp-up of our 2-nanometer technology." TSMC's growth has always come from the next node — and the next node just started earning.
Volume and Price Split the Growth Evenly
- Decompose the +36.0% revenue growth and the margin's origin shows up. Wafer shipments ran 4,336 thousand 12-inch-equivalent wafers in the quarter, up +16.6% from a year earlier — less than half the revenue growth rate. Strip out the volume effect and the price-and-mix contribution comes to +16.6% as well. Half volume, half price, almost to the decimal.
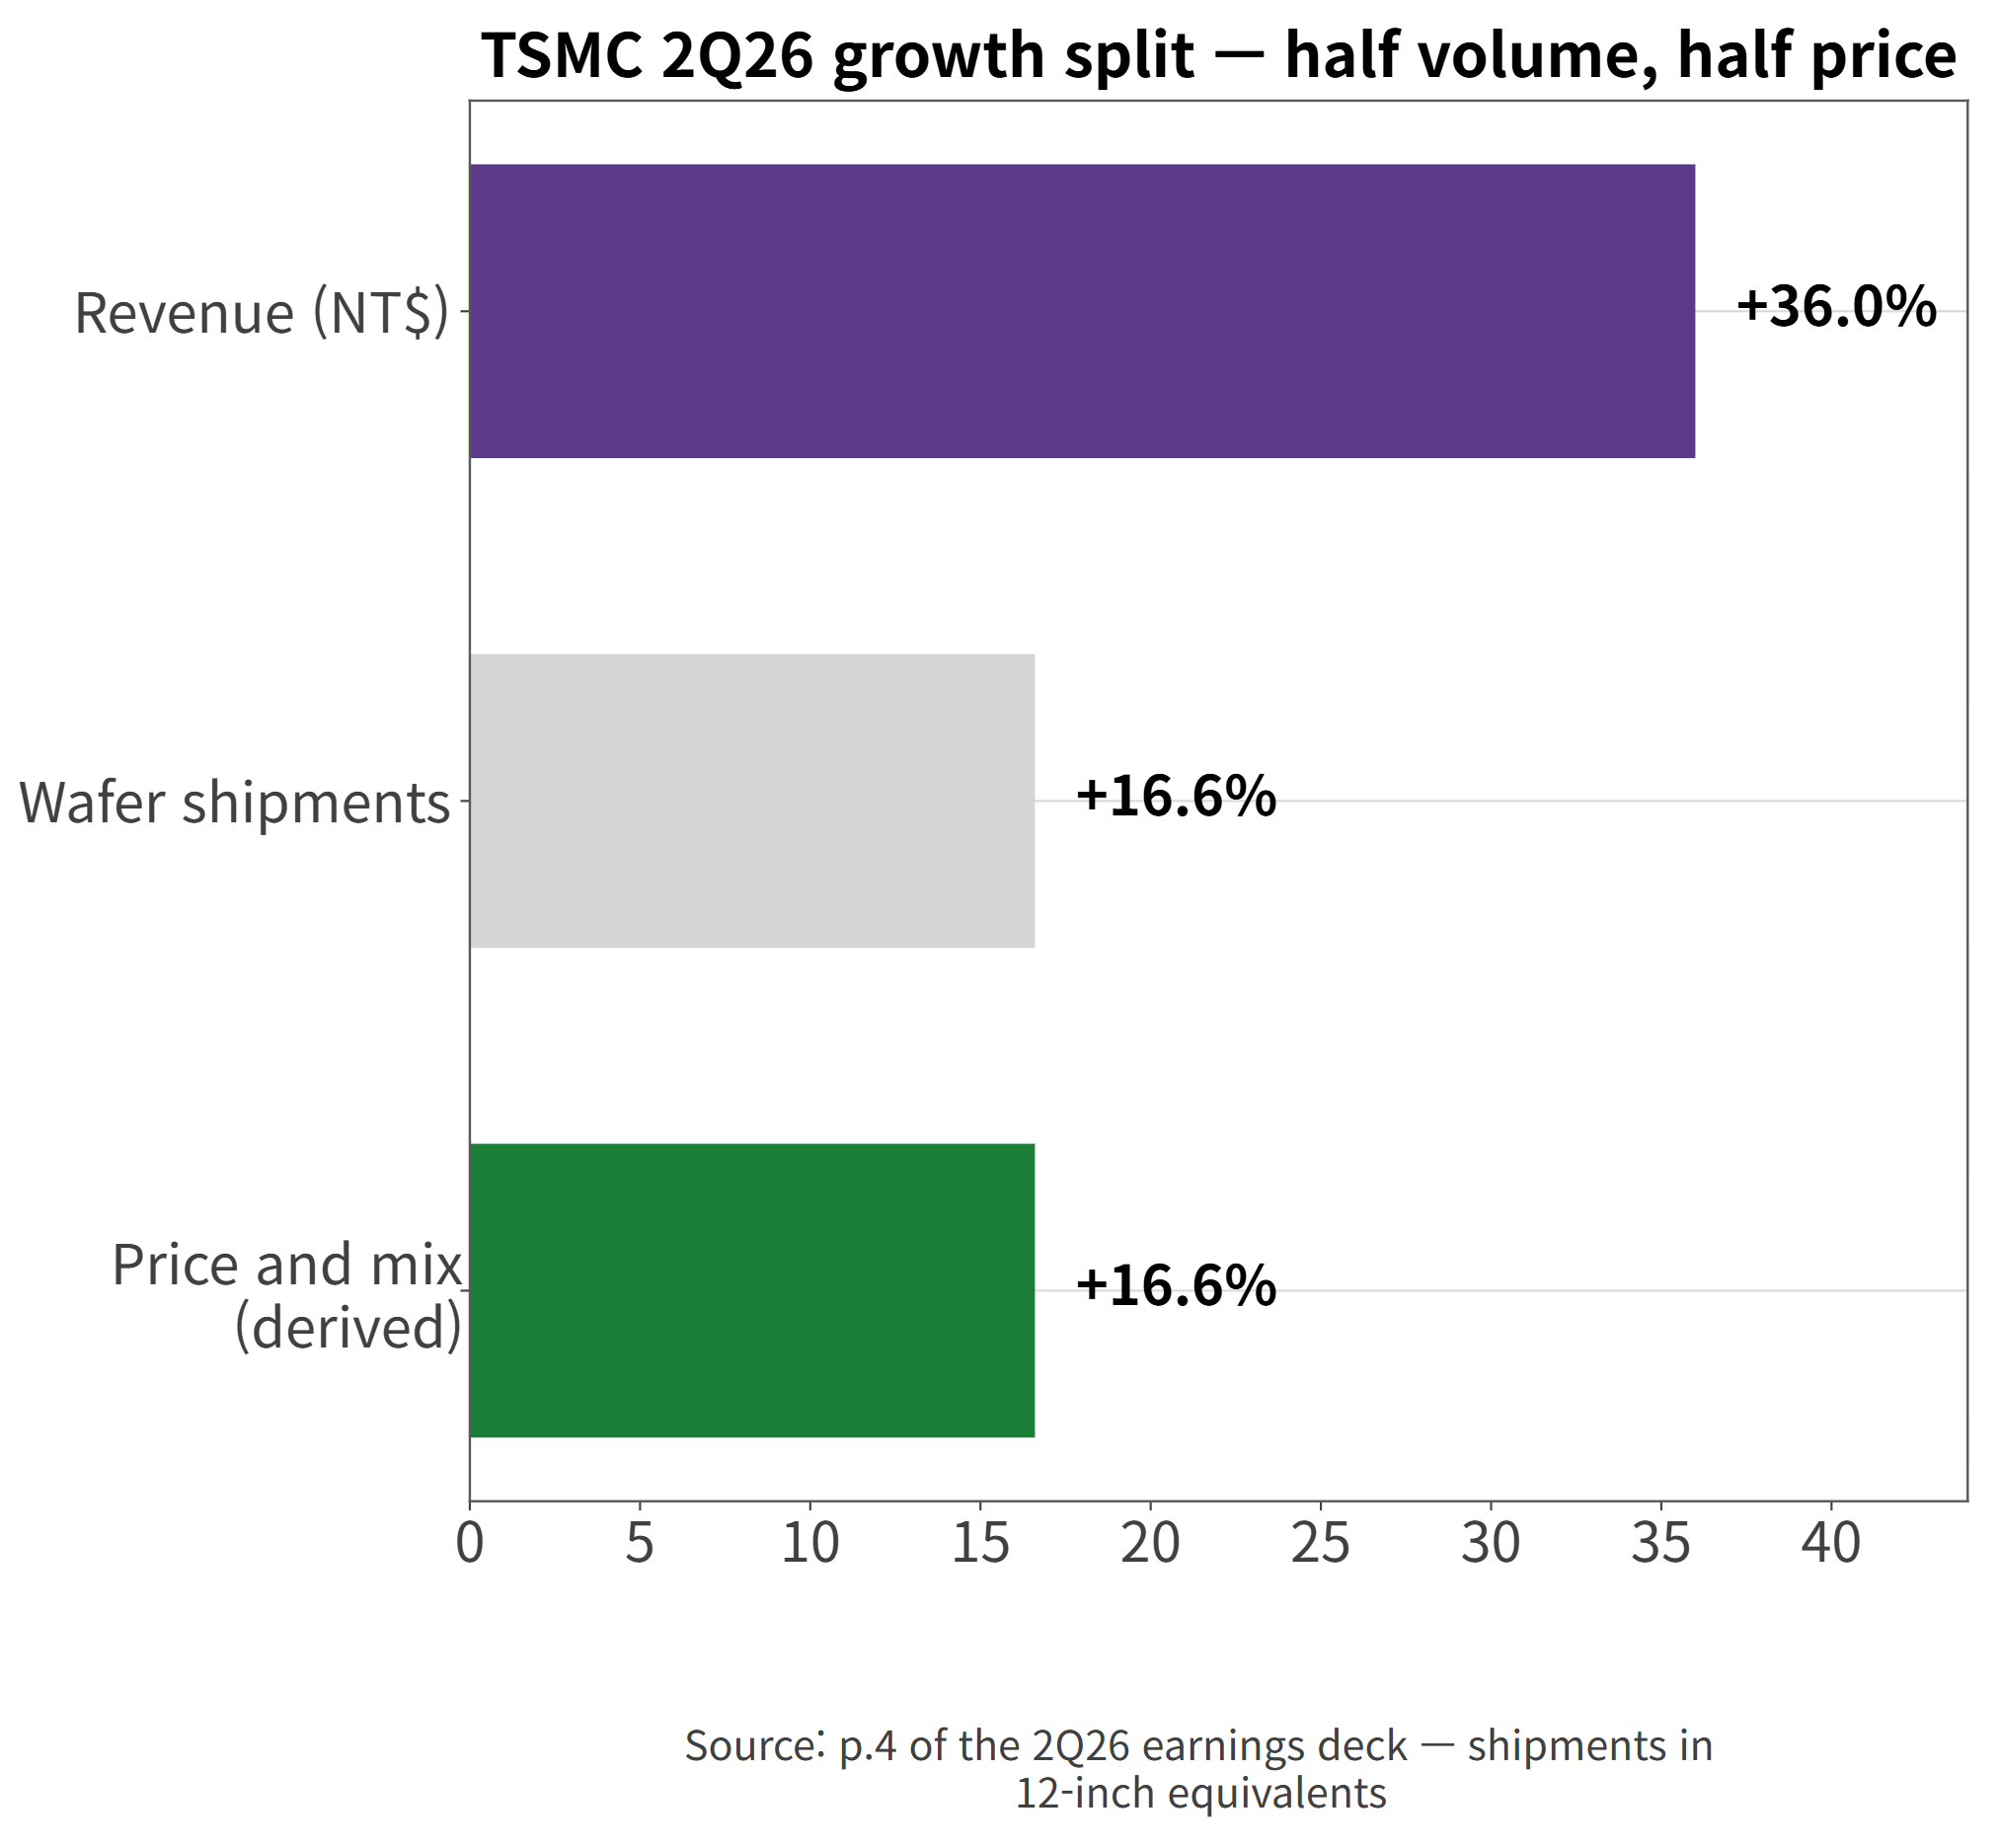
- The price half is the node table above. The most expensive node, 3nm, went from 24% of revenue to 30% in a year, and 2nm started layering on top. The same fabs are simply building more expensive product.
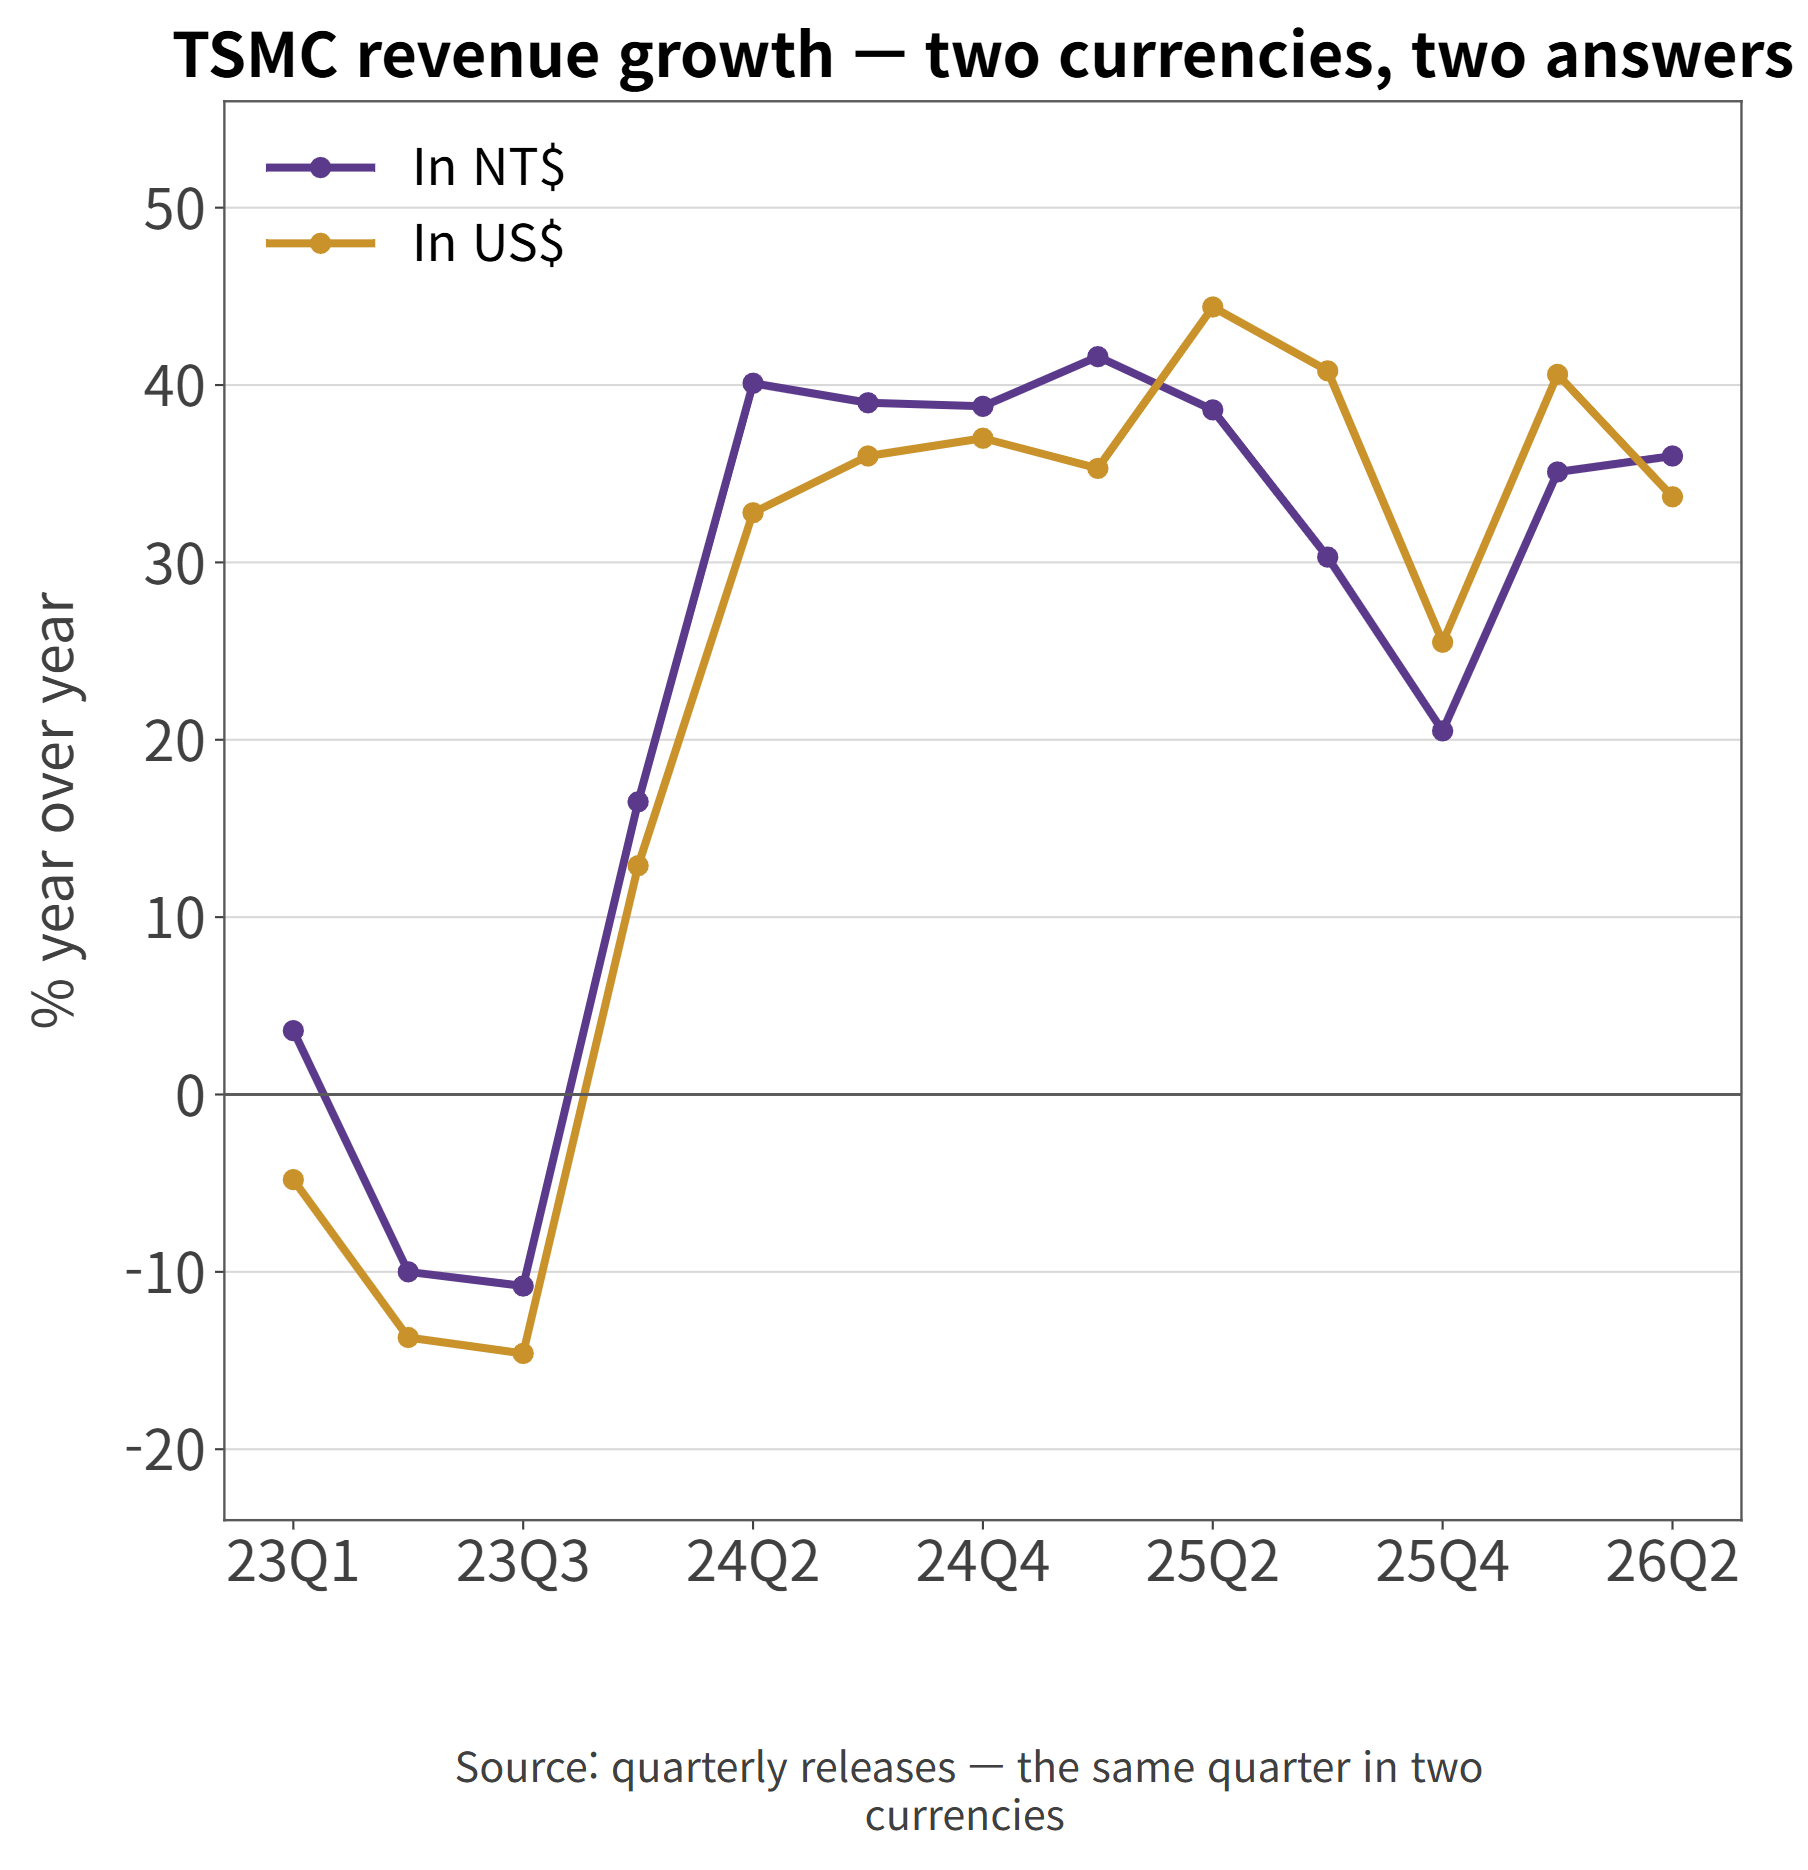
- Currency helped too. The average exchange rate was NT$31.60 per dollar versus 31.05 a year earlier — the Taiwan dollar weakened -1.8%. TSMC bills mostly in dollars and reports in Taiwan dollars, so a weaker home currency inflates reported revenue. That is why NT$ revenue grew +36.0% while dollar revenue grew +33.7%.
What the NT$32 Assumption Is Doing in the Guidance
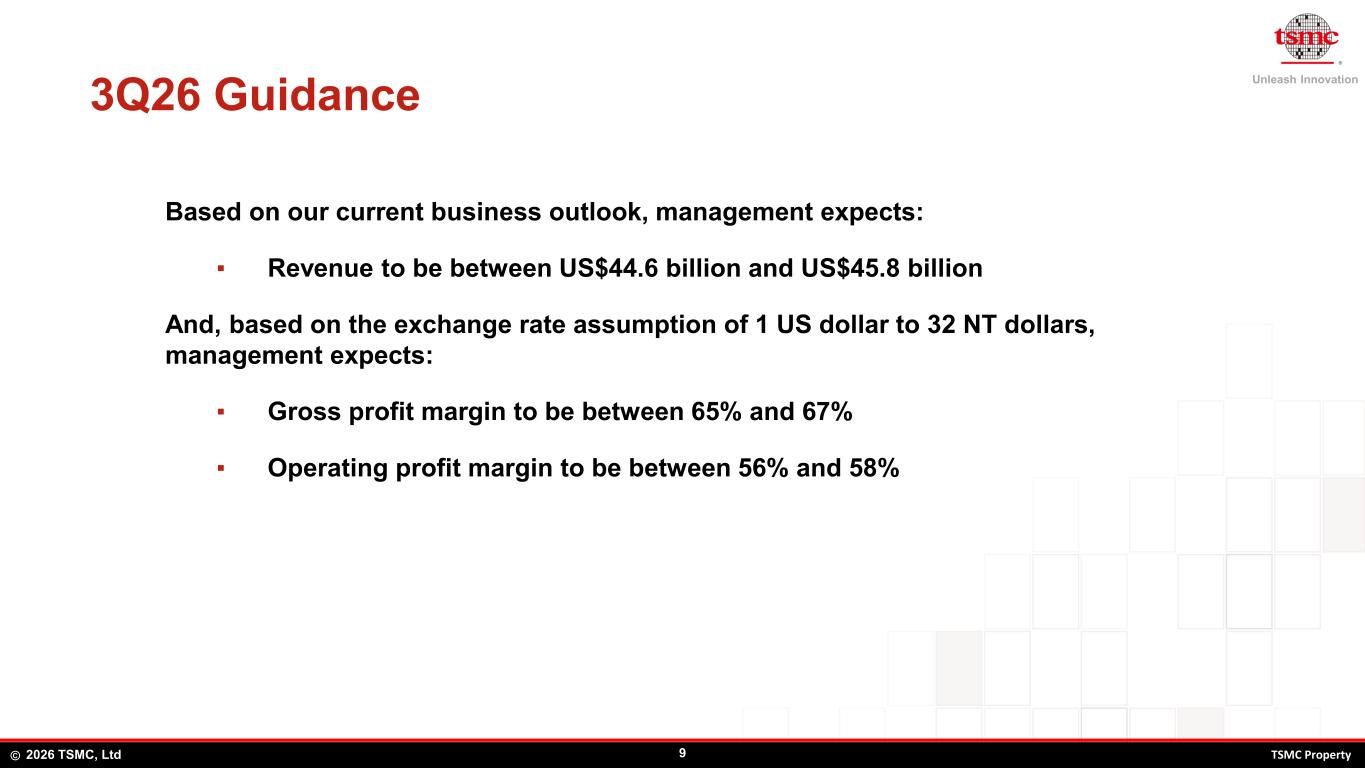
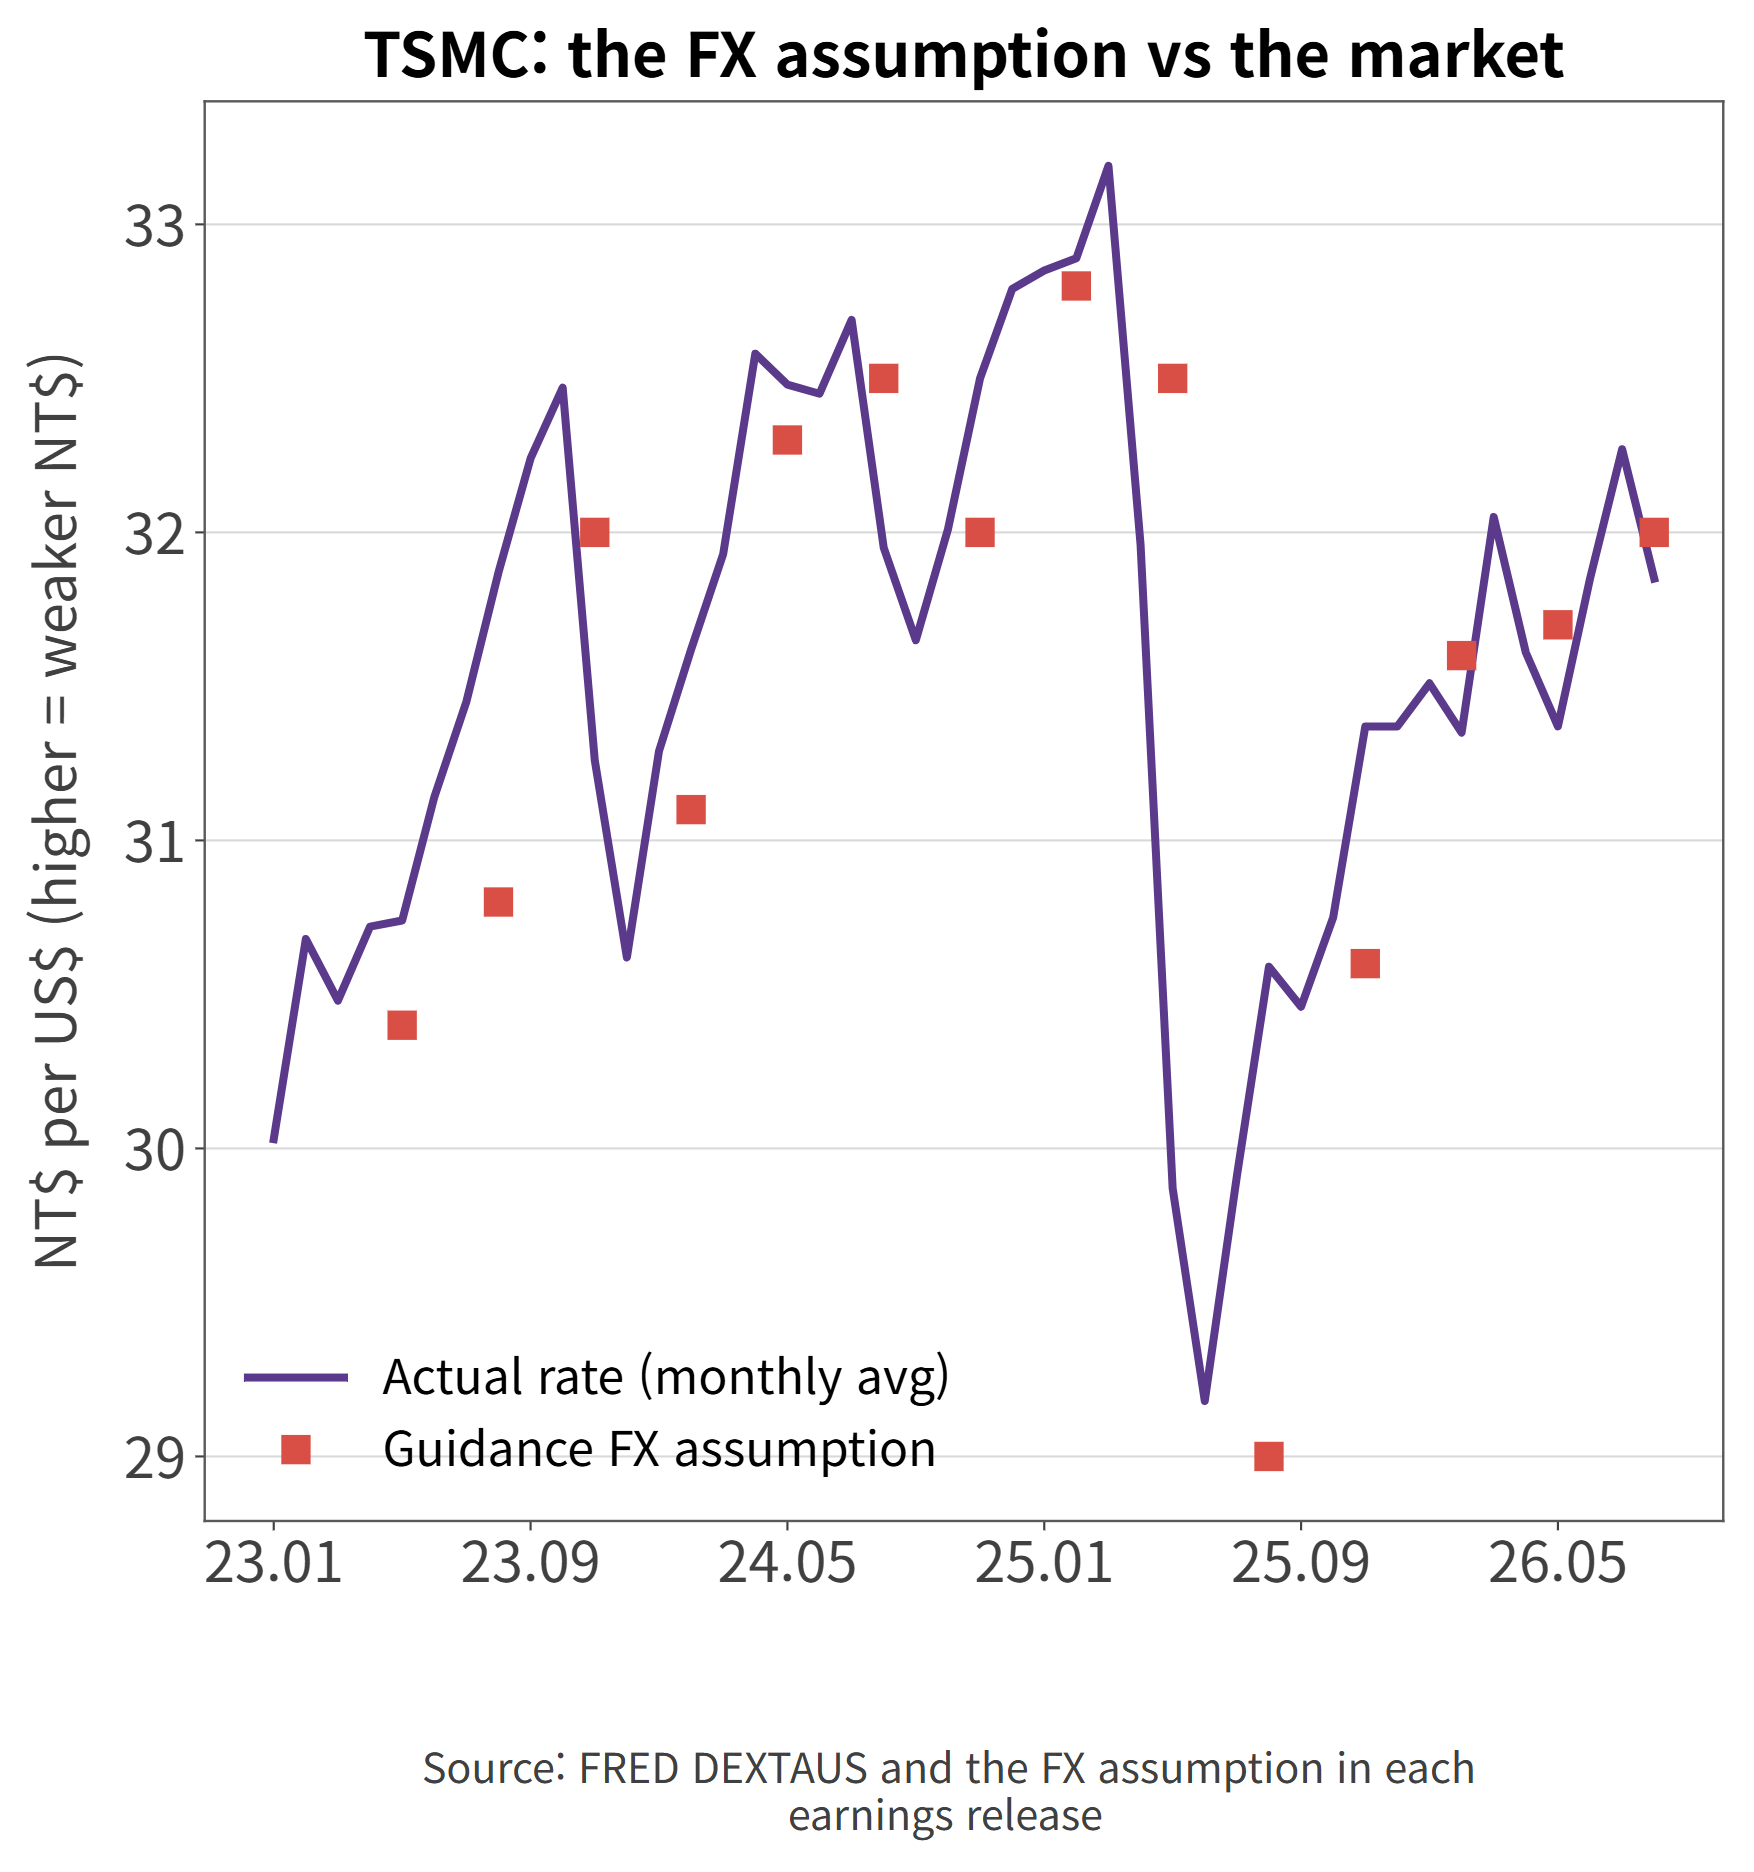
- TSMC's guidance carries a sentence you will not find at most companies: "based on the exchange rate assumption of 1 US dollar to 32 NT dollars." The company is not promising a margin. It is saying: if the currency sits here, the margin lands in this range.
| Quarter | Gross-margin guidance | FX assumption | Actual | Verdict |
| 3Q25 | 55.5~57.5% | 29.0 | 59.5% | Beat the top |
| 4Q25 | 59.0~61.0% | 30.6 | 62.3% | Beat the top |
| 1Q26 | 63.0~65.0% | 31.6 | 66.3% | Beat the top |
| 2Q26 | 65.5~67.5% | 31.7 | 67.7% | Beat the top |
| 3Q26 | 65.0~67.0% | 32.0 | ? | Due in October |
- Source: 13 quarterly earnings releases, pairing each quarter's guidance with the next quarter's actual
- Across 13 quarters since 2023, actual gross margin beat the top of guidance 8 times and never fell below the bottom. The last four quarters were all above the top. When a forecast gets beaten four times running, the forecast is conservative — that is the point.
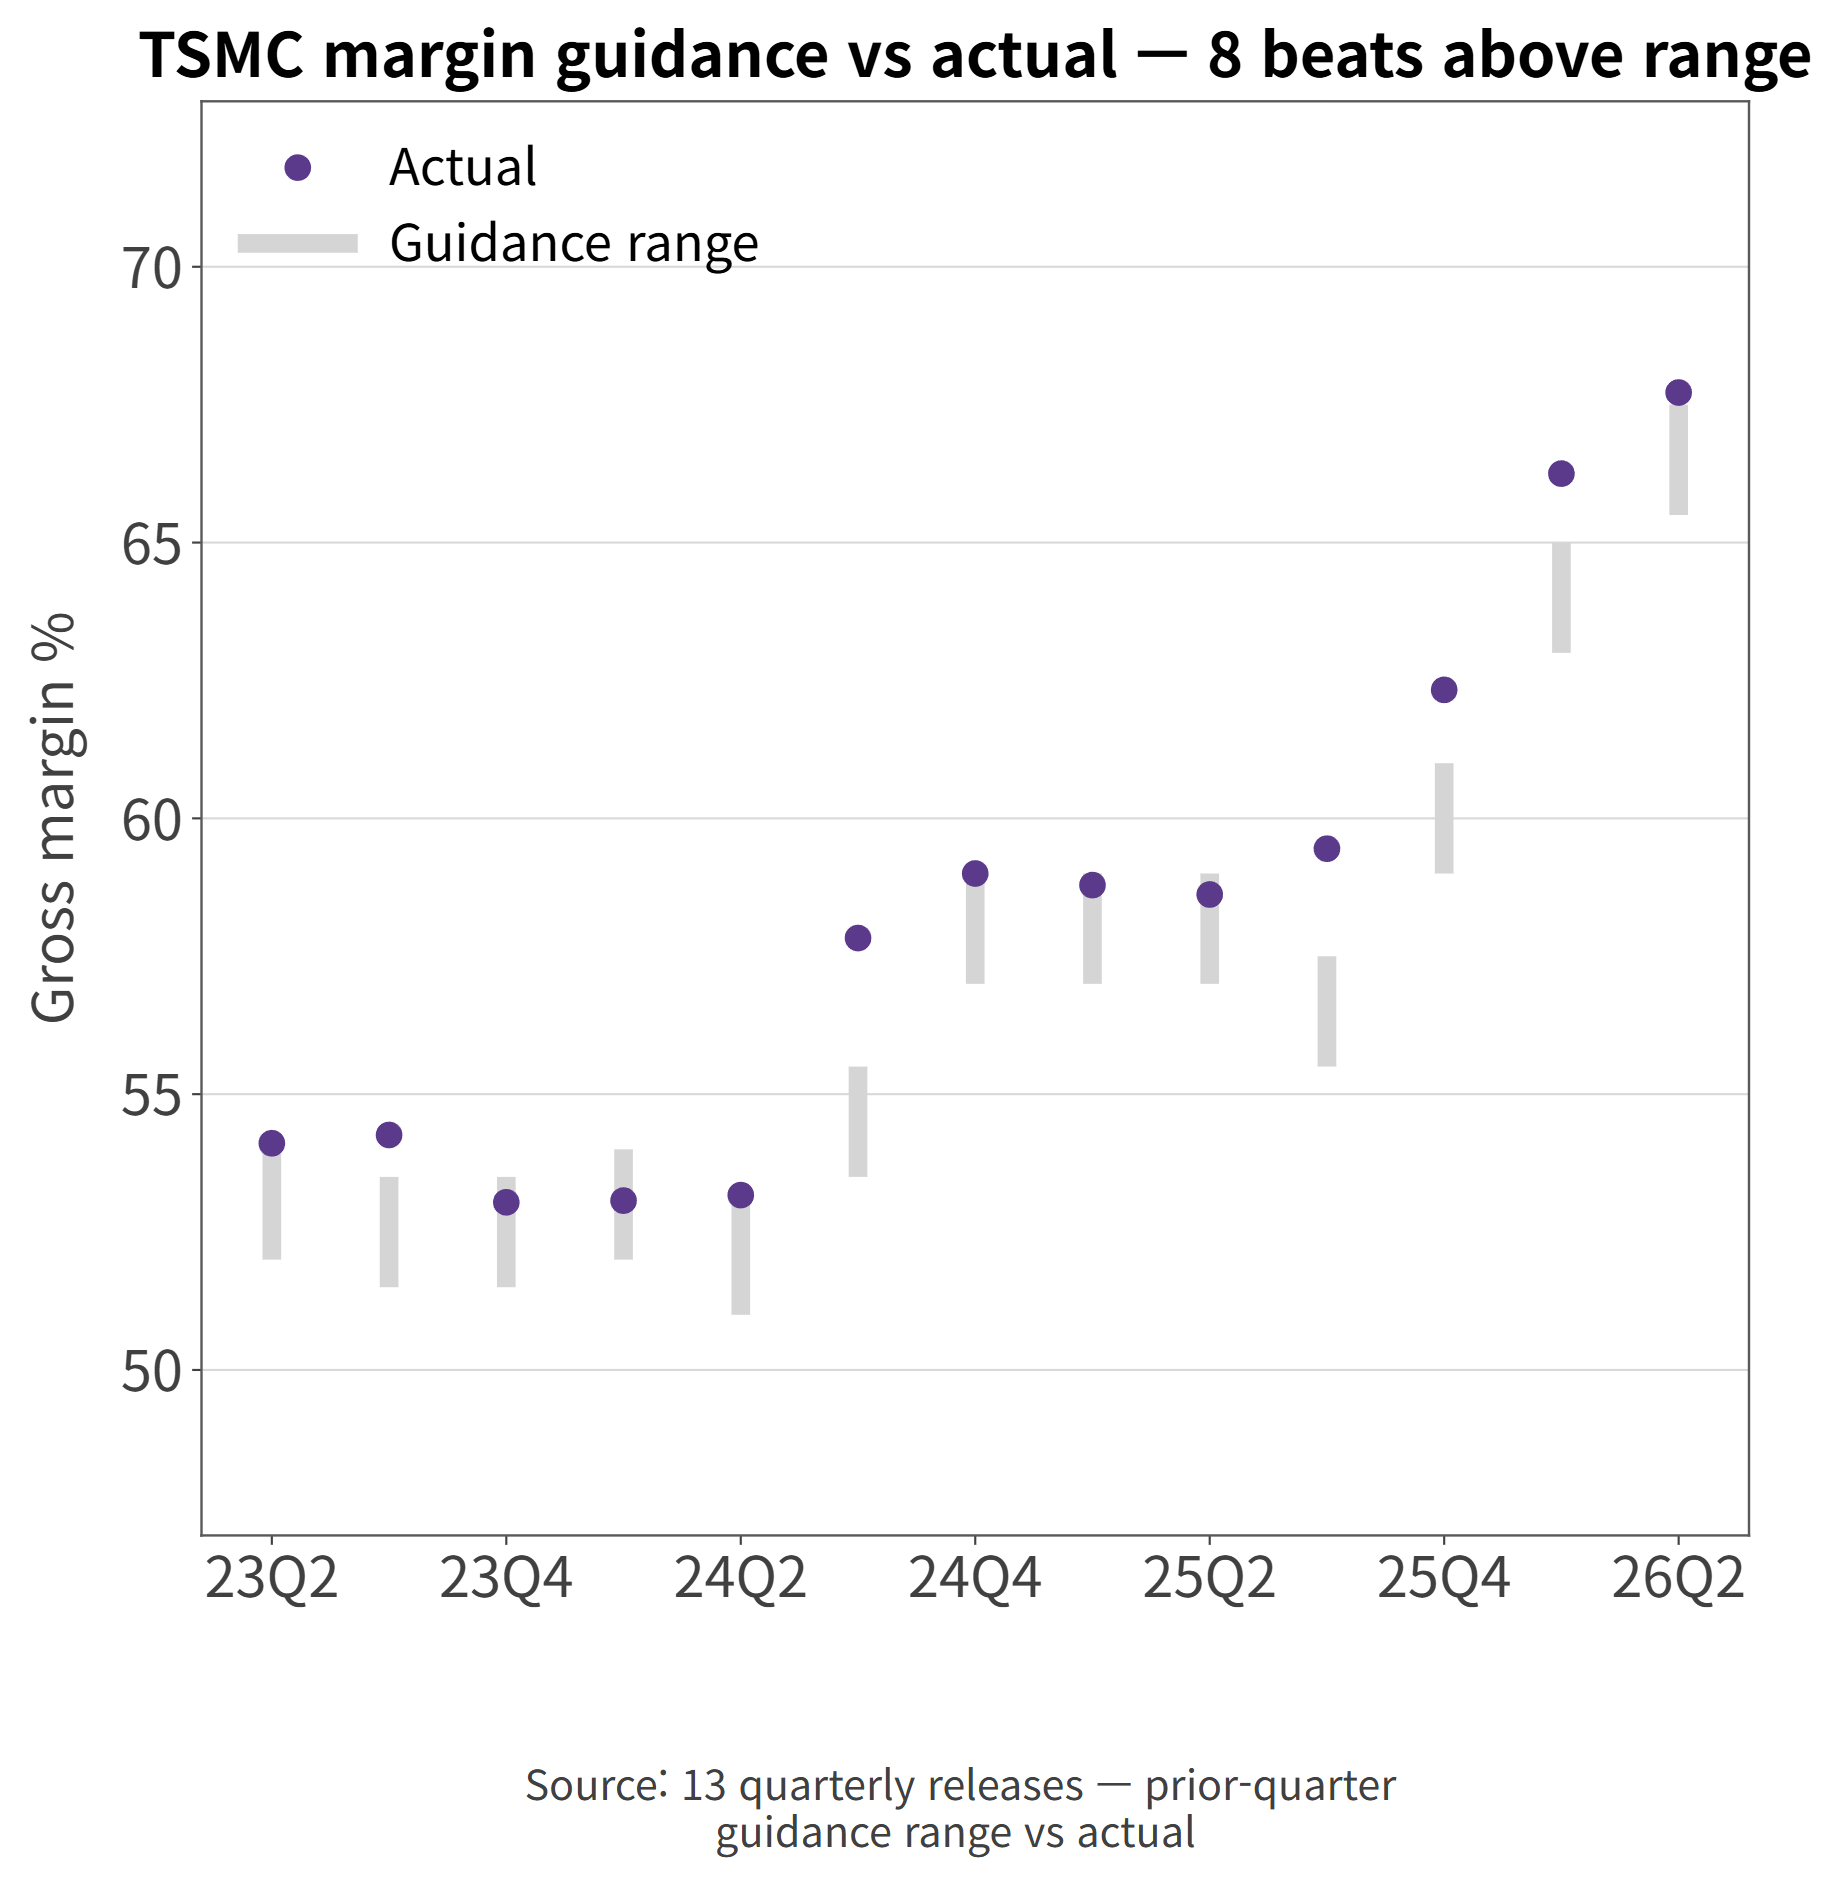
- Part of that conservatism is the currency assumption. In mid-2025, with the Taiwan dollar rallying hard, the company set its assumption at 29.0 — the harshest in the series. The currency then drifted weaker than assumed, and margins sailed over the range. The new assumption for 3Q26 is 32.0, close to the current market rate near 31.9. If the Taiwan dollar strengthens from here, the assumption cuts against the company for the first time in a year. The tailwind is not a birthright.
TSMC Reports Its Revenue Every Month
- Taiwan-listed companies disclose monthly revenue. TSMC files the number around the 10th of each month — the July figure is already public — so you can take the company's pulse twelve times a year instead of four.
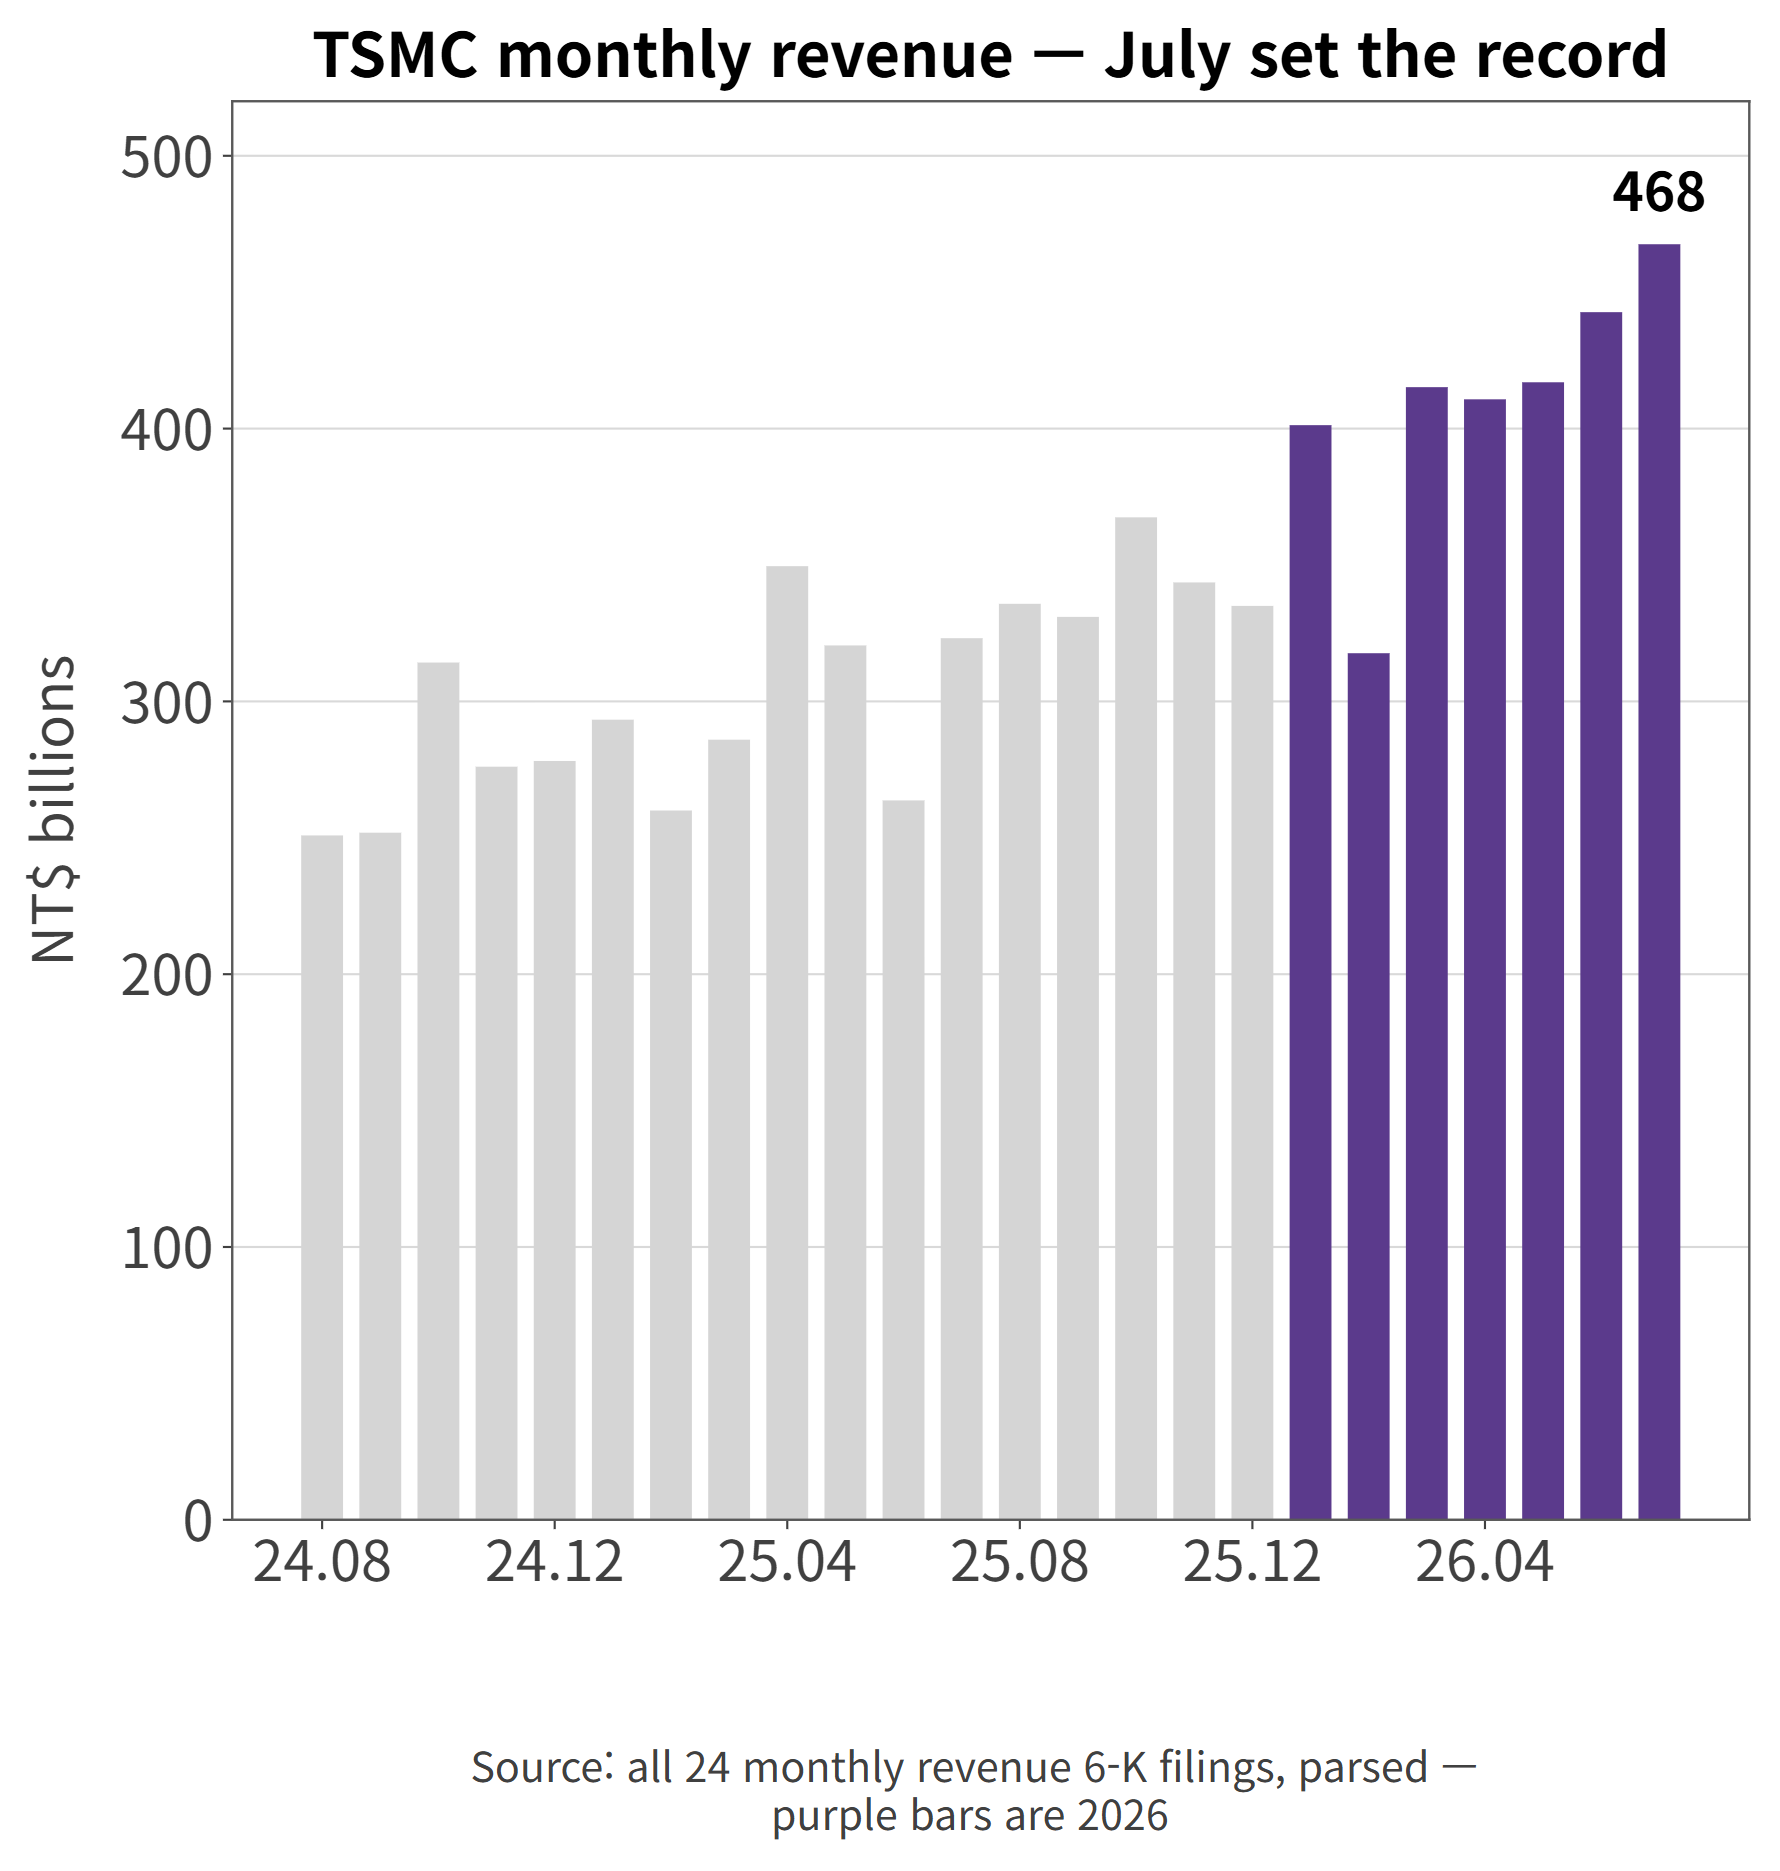
- July revenue was NT$467.6 billion: an all-time monthly record, up +44.7% from July 2025. The January-through-July total stands at NT$2,872.1 billion, up +37.0% year over year.
Checking the 40% Full-Year Promise
- In the July earnings release, management put its full-year expectation in writing: "2026 revenue to increase by slightly above 40% in US dollar terms."

- That promise can be audited with numbers the company has already published. Full-year 2025 dollar revenue, summing the quarterly releases, was $122.4 billion; +40% requires $171.4 billion. First-half actuals of $76.1 billion plus the $45.2 billion midpoint of third-quarter guidance gets to $121.3 billion — leaving $50.1 billion for the fourth quarter. That is +48.5% over the year-ago quarter.
- Quarterly growth has been running at +33~36%, so the bar is high. But the direction favors the company: the 2nm ramp lands in the second half, and monthly growth was +67.9% in June (against an unusually weak June 2025) and +44.7% in July, both above the recent quarterly pace. Rather than betting on whether 40% prints, the honest way to follow this company is to pull this arithmetic out again at the January release.
Where the Semiconductor Industry Stands
- The foundry business is a market TSMC itself created. At its founding in 1987 the company drew a line — manufacturing only, no designs of its own — and that line made the fabless ecosystem possible: Nvidia, Apple, and AMD can design without owning a single fab. Today that entire ecosystem sits on top of one company's production capacity.
- The concentration cuts both ways, and the filings say so. With most production capacity in Taiwan, geopolitics is a business risk, which is why fabs are going up in Arizona, Kumamoto, and Dresden. Overseas fabs carry higher costs, and the company has said they will weigh on margins in the early years.
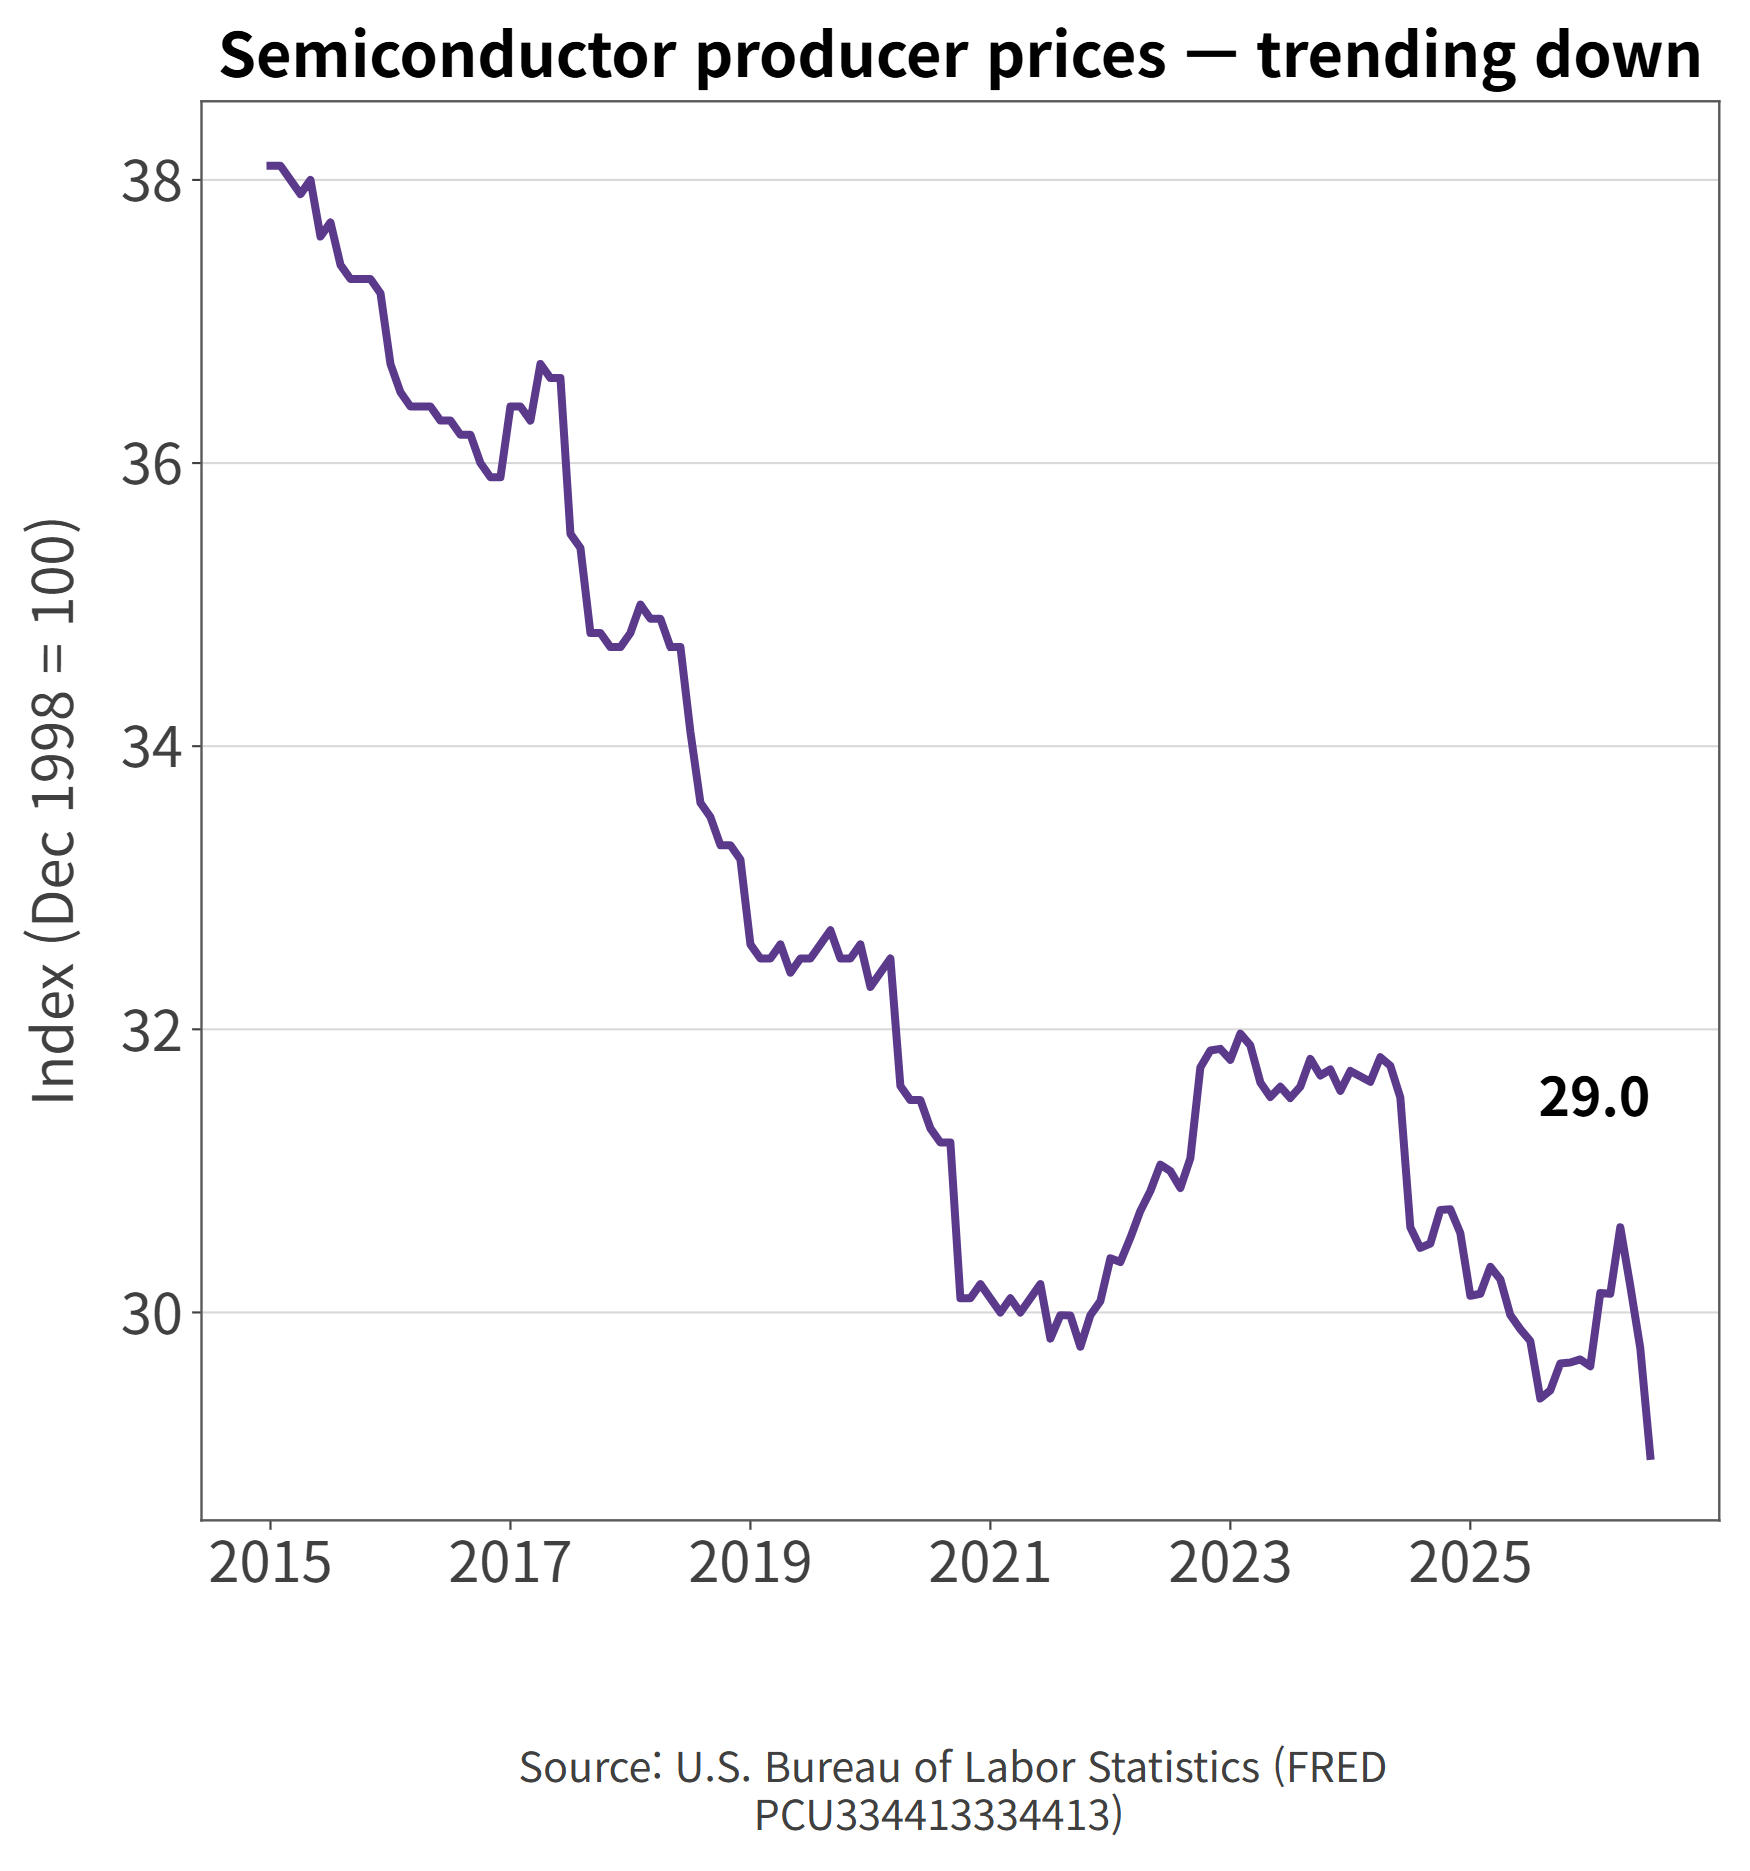
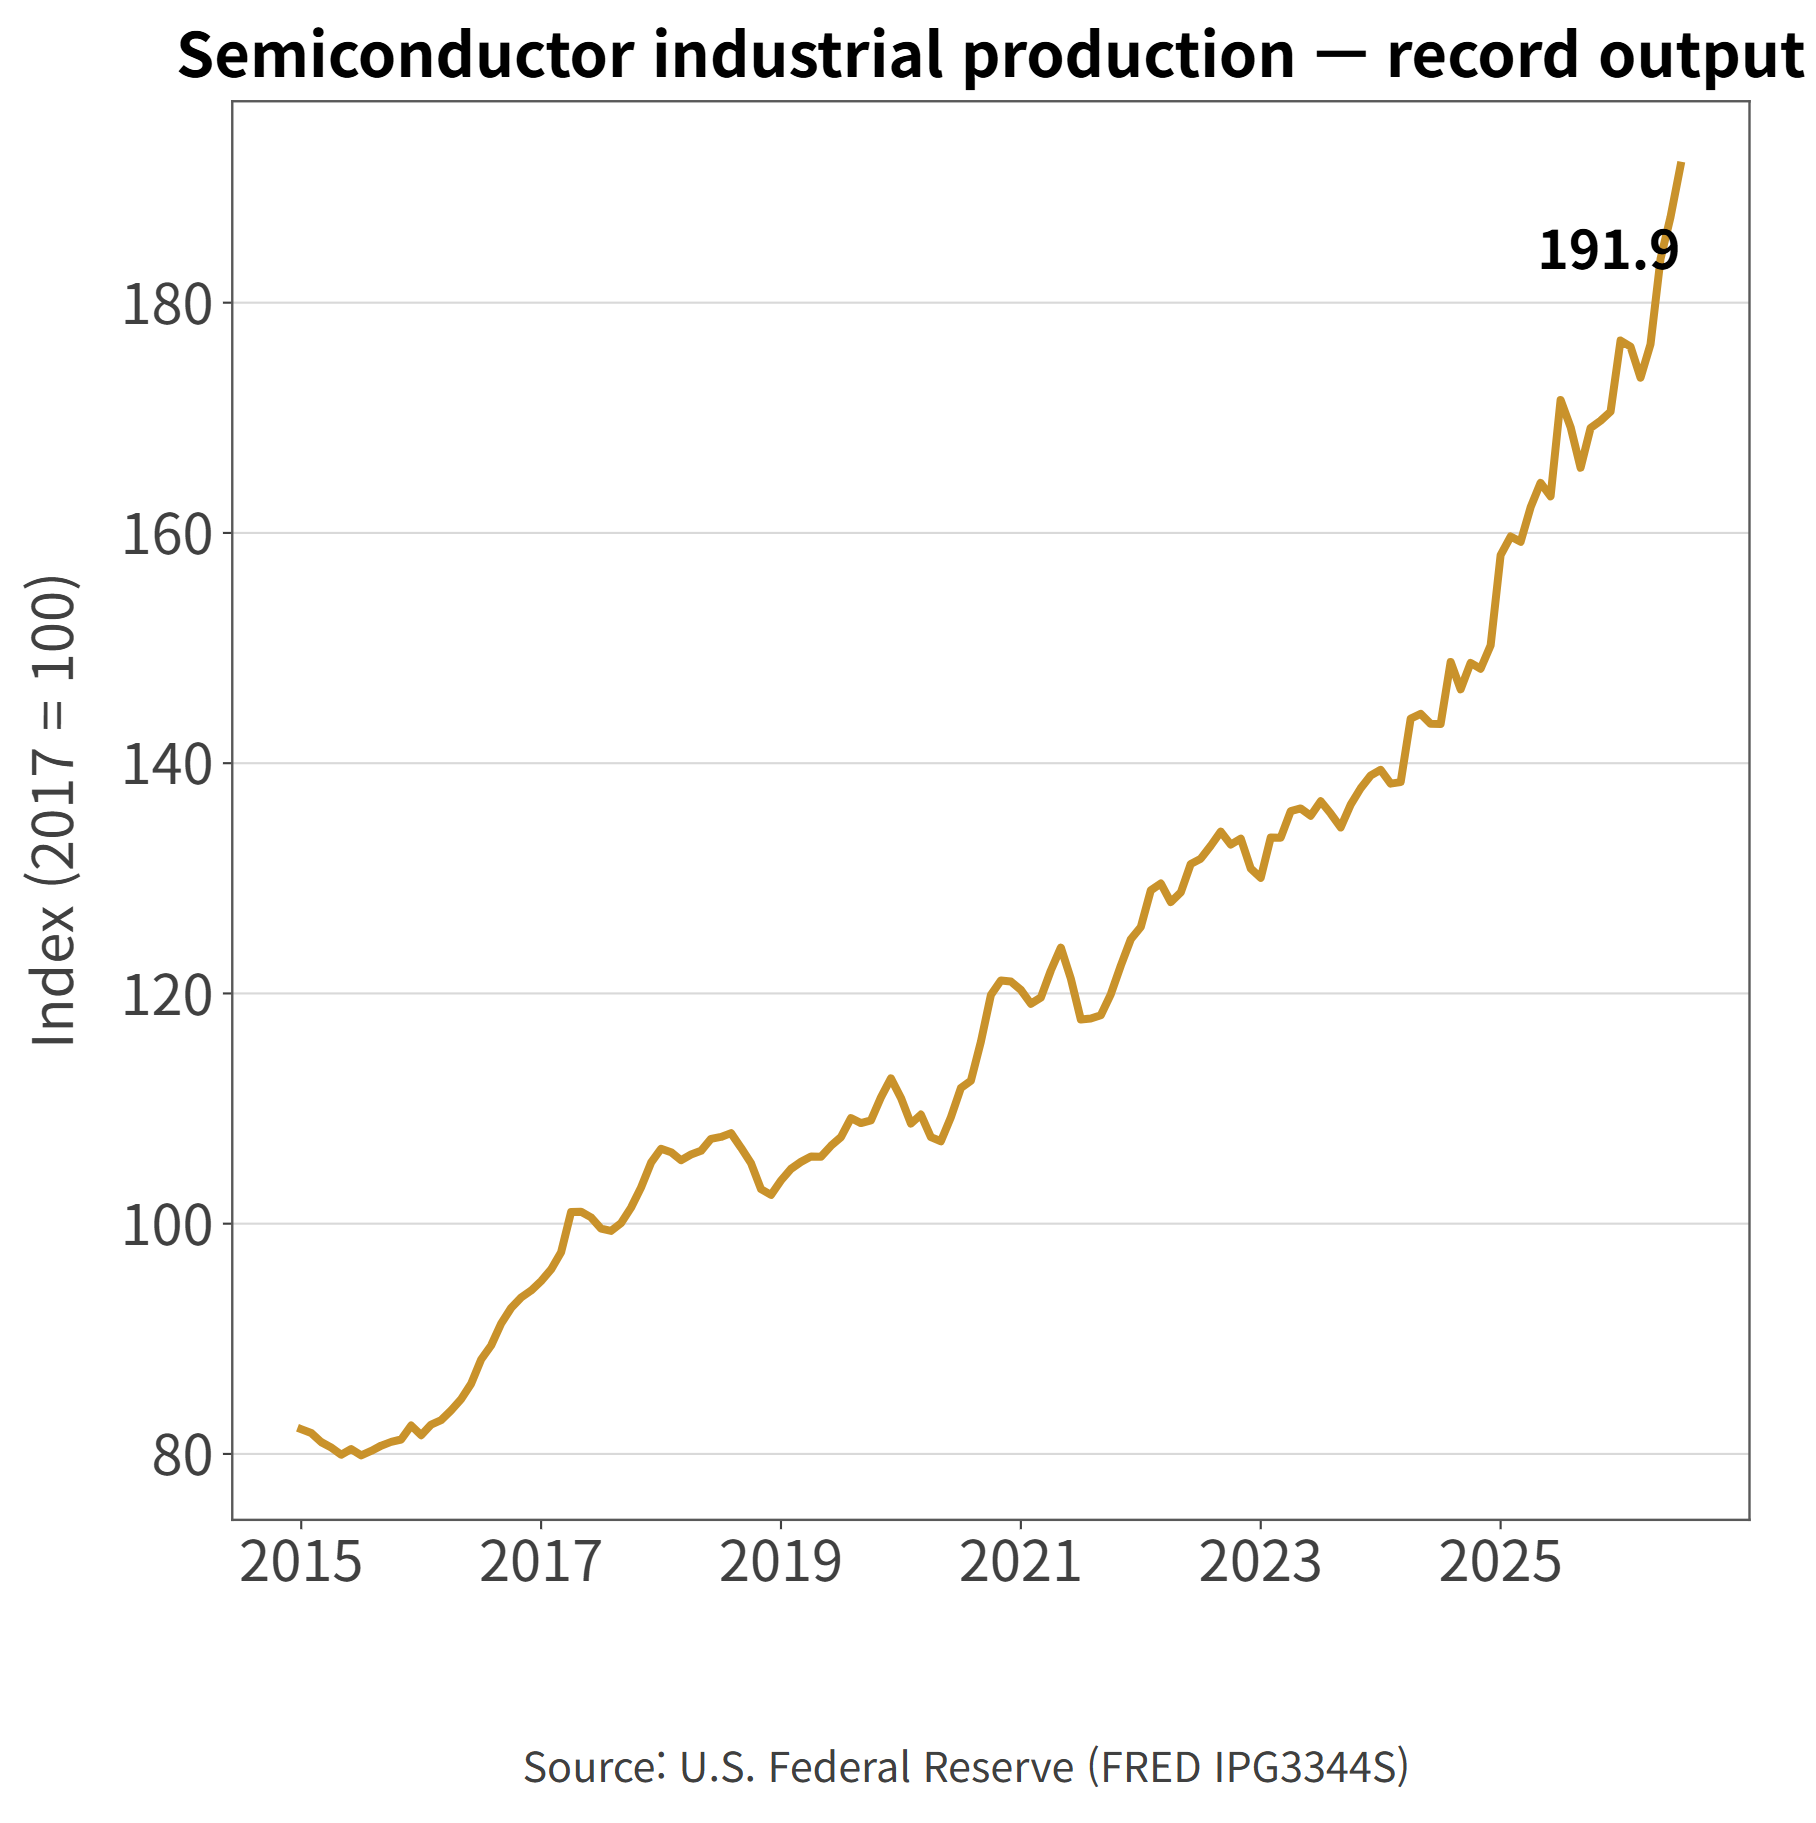
- Two official statistics frame TSMC's position. The U.S. producer price index for semiconductor manufacturing sat at 28.99 in July 2026 and has fallen for over a decade — chips get cheaper every year; that is the industry's default physics. Meanwhile the Federal Reserve's industrial production index for semiconductors reads 191.9, an all-time high. The industry as a whole makes more and charges less. TSMC charges more per wafer. The two lines point in opposite directions.
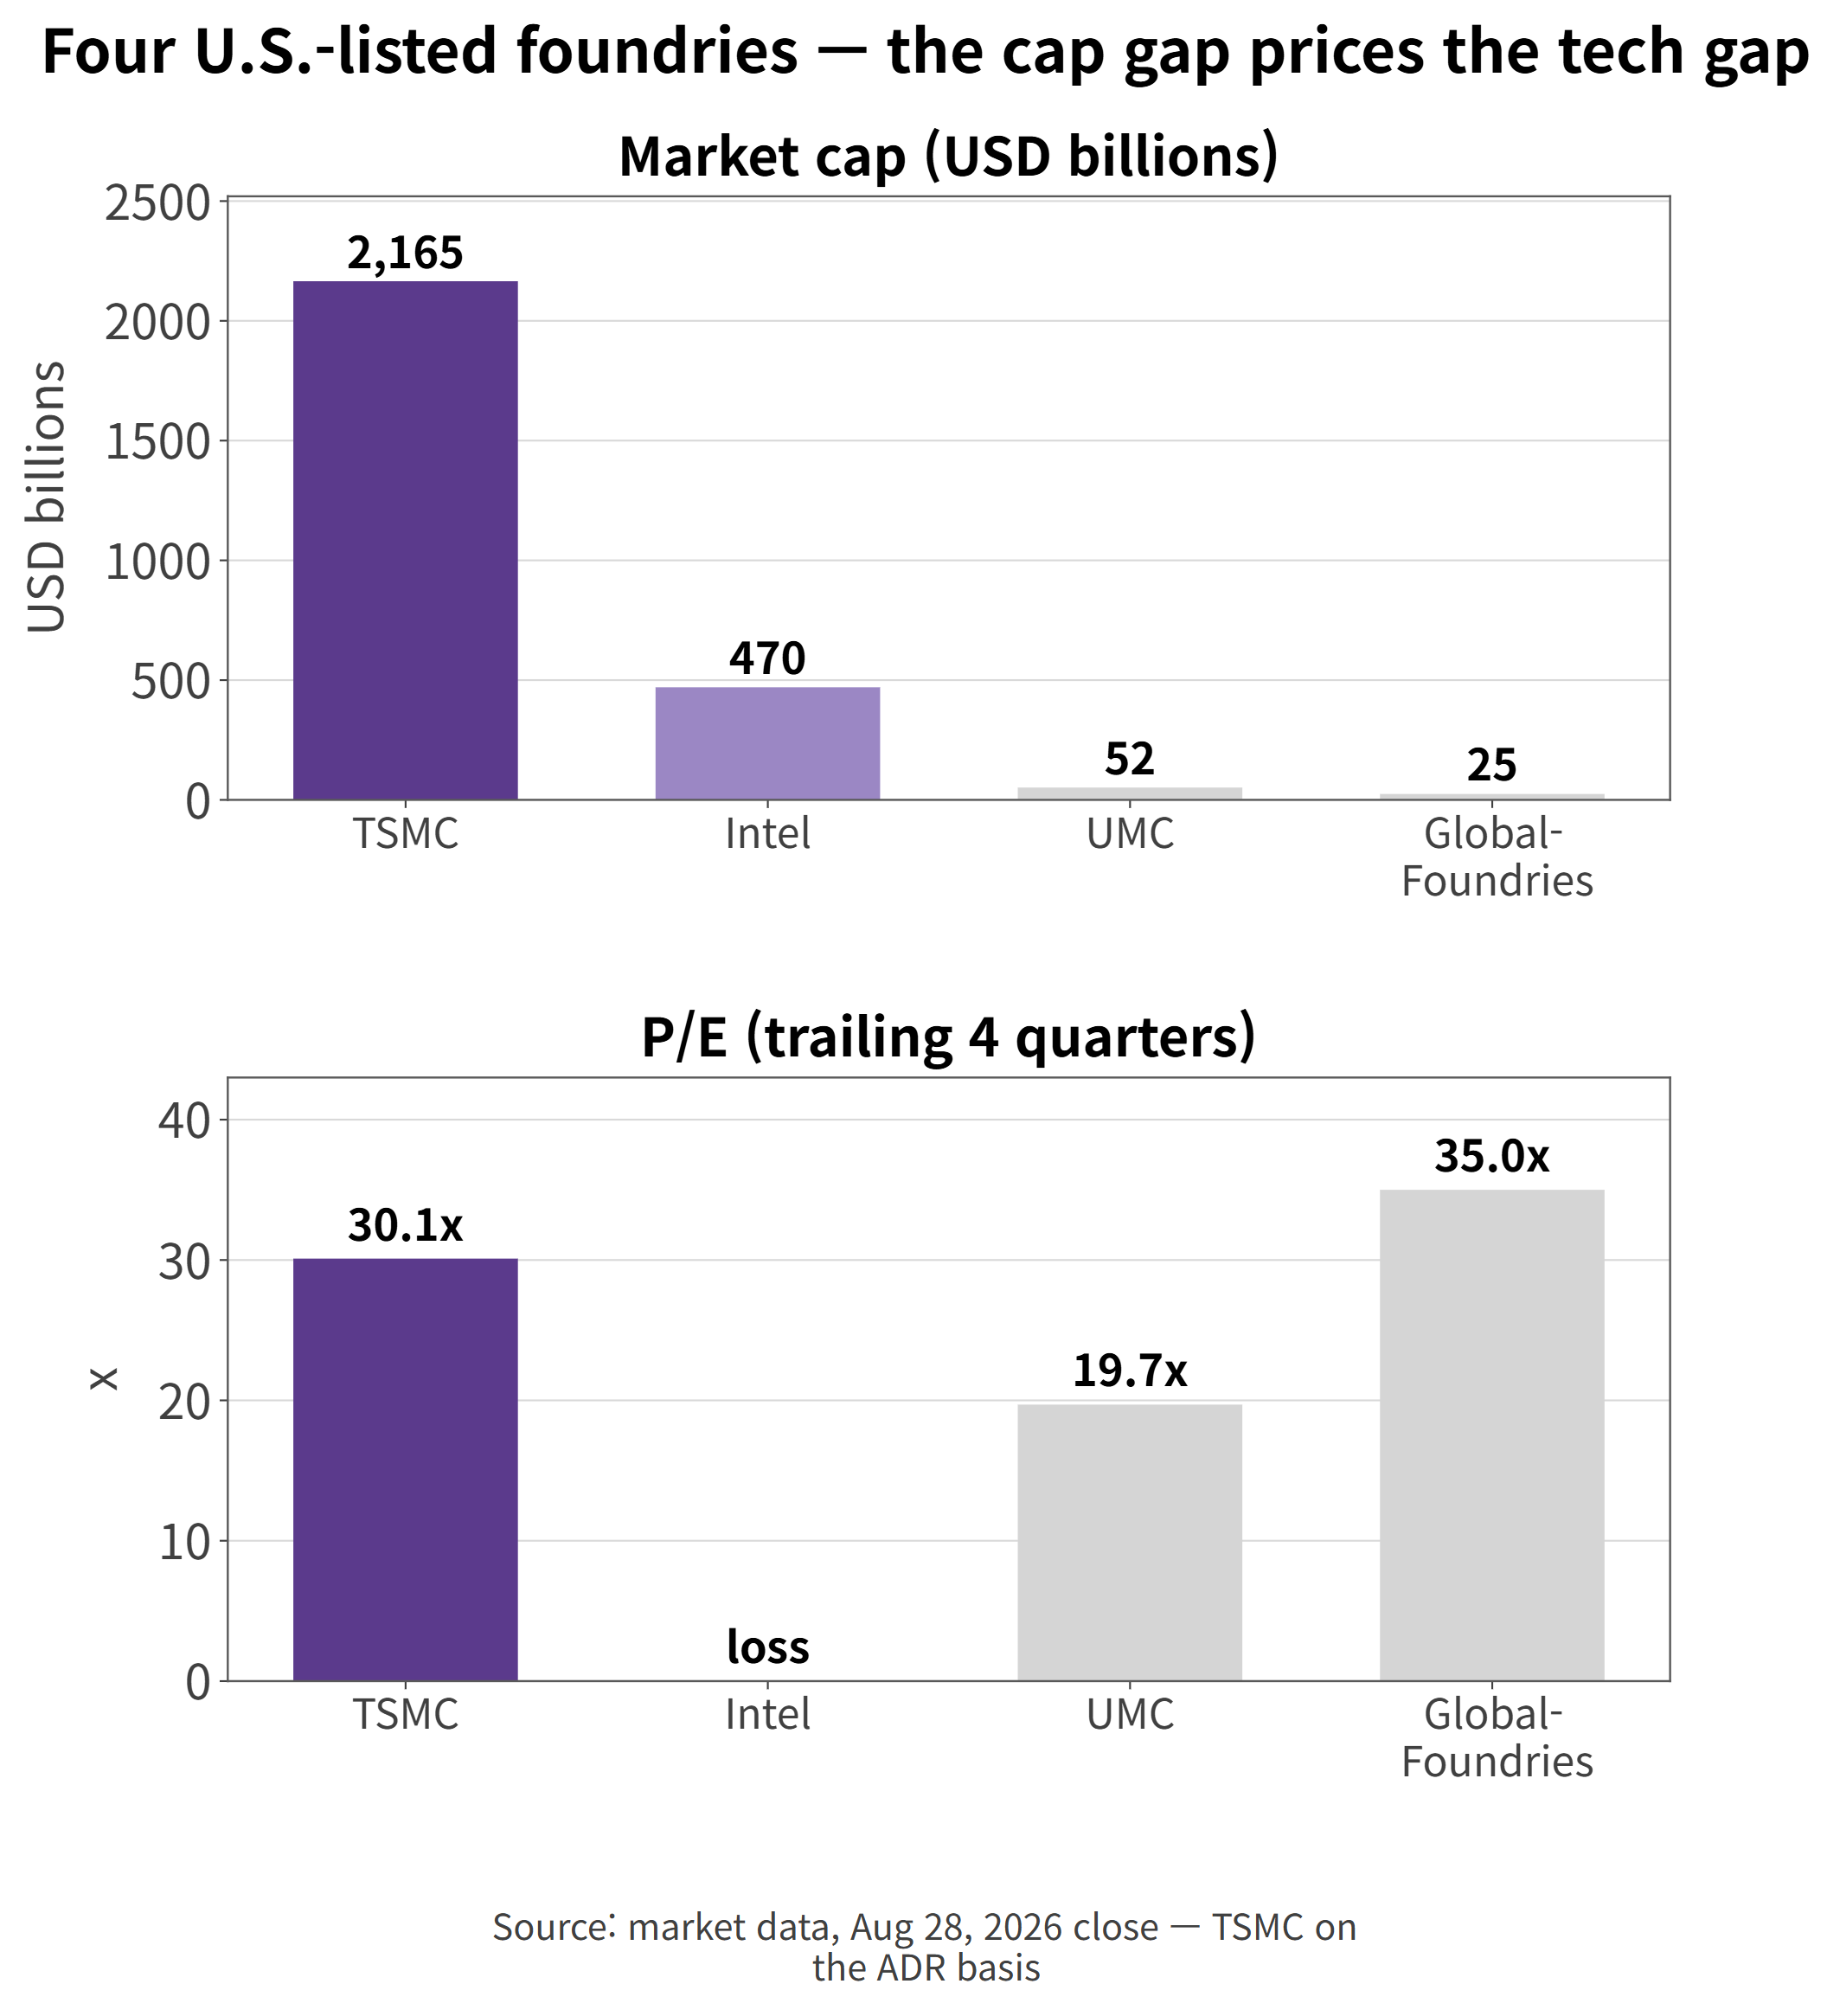
- The supply side explains the split. Among U.S.-listed competitors, no one earns anything close to TSMC's margins at the leading edge — see the table below. Pricing power pools where the orders pool. The demand side is already in the numbers: HPC at 66% of revenue.
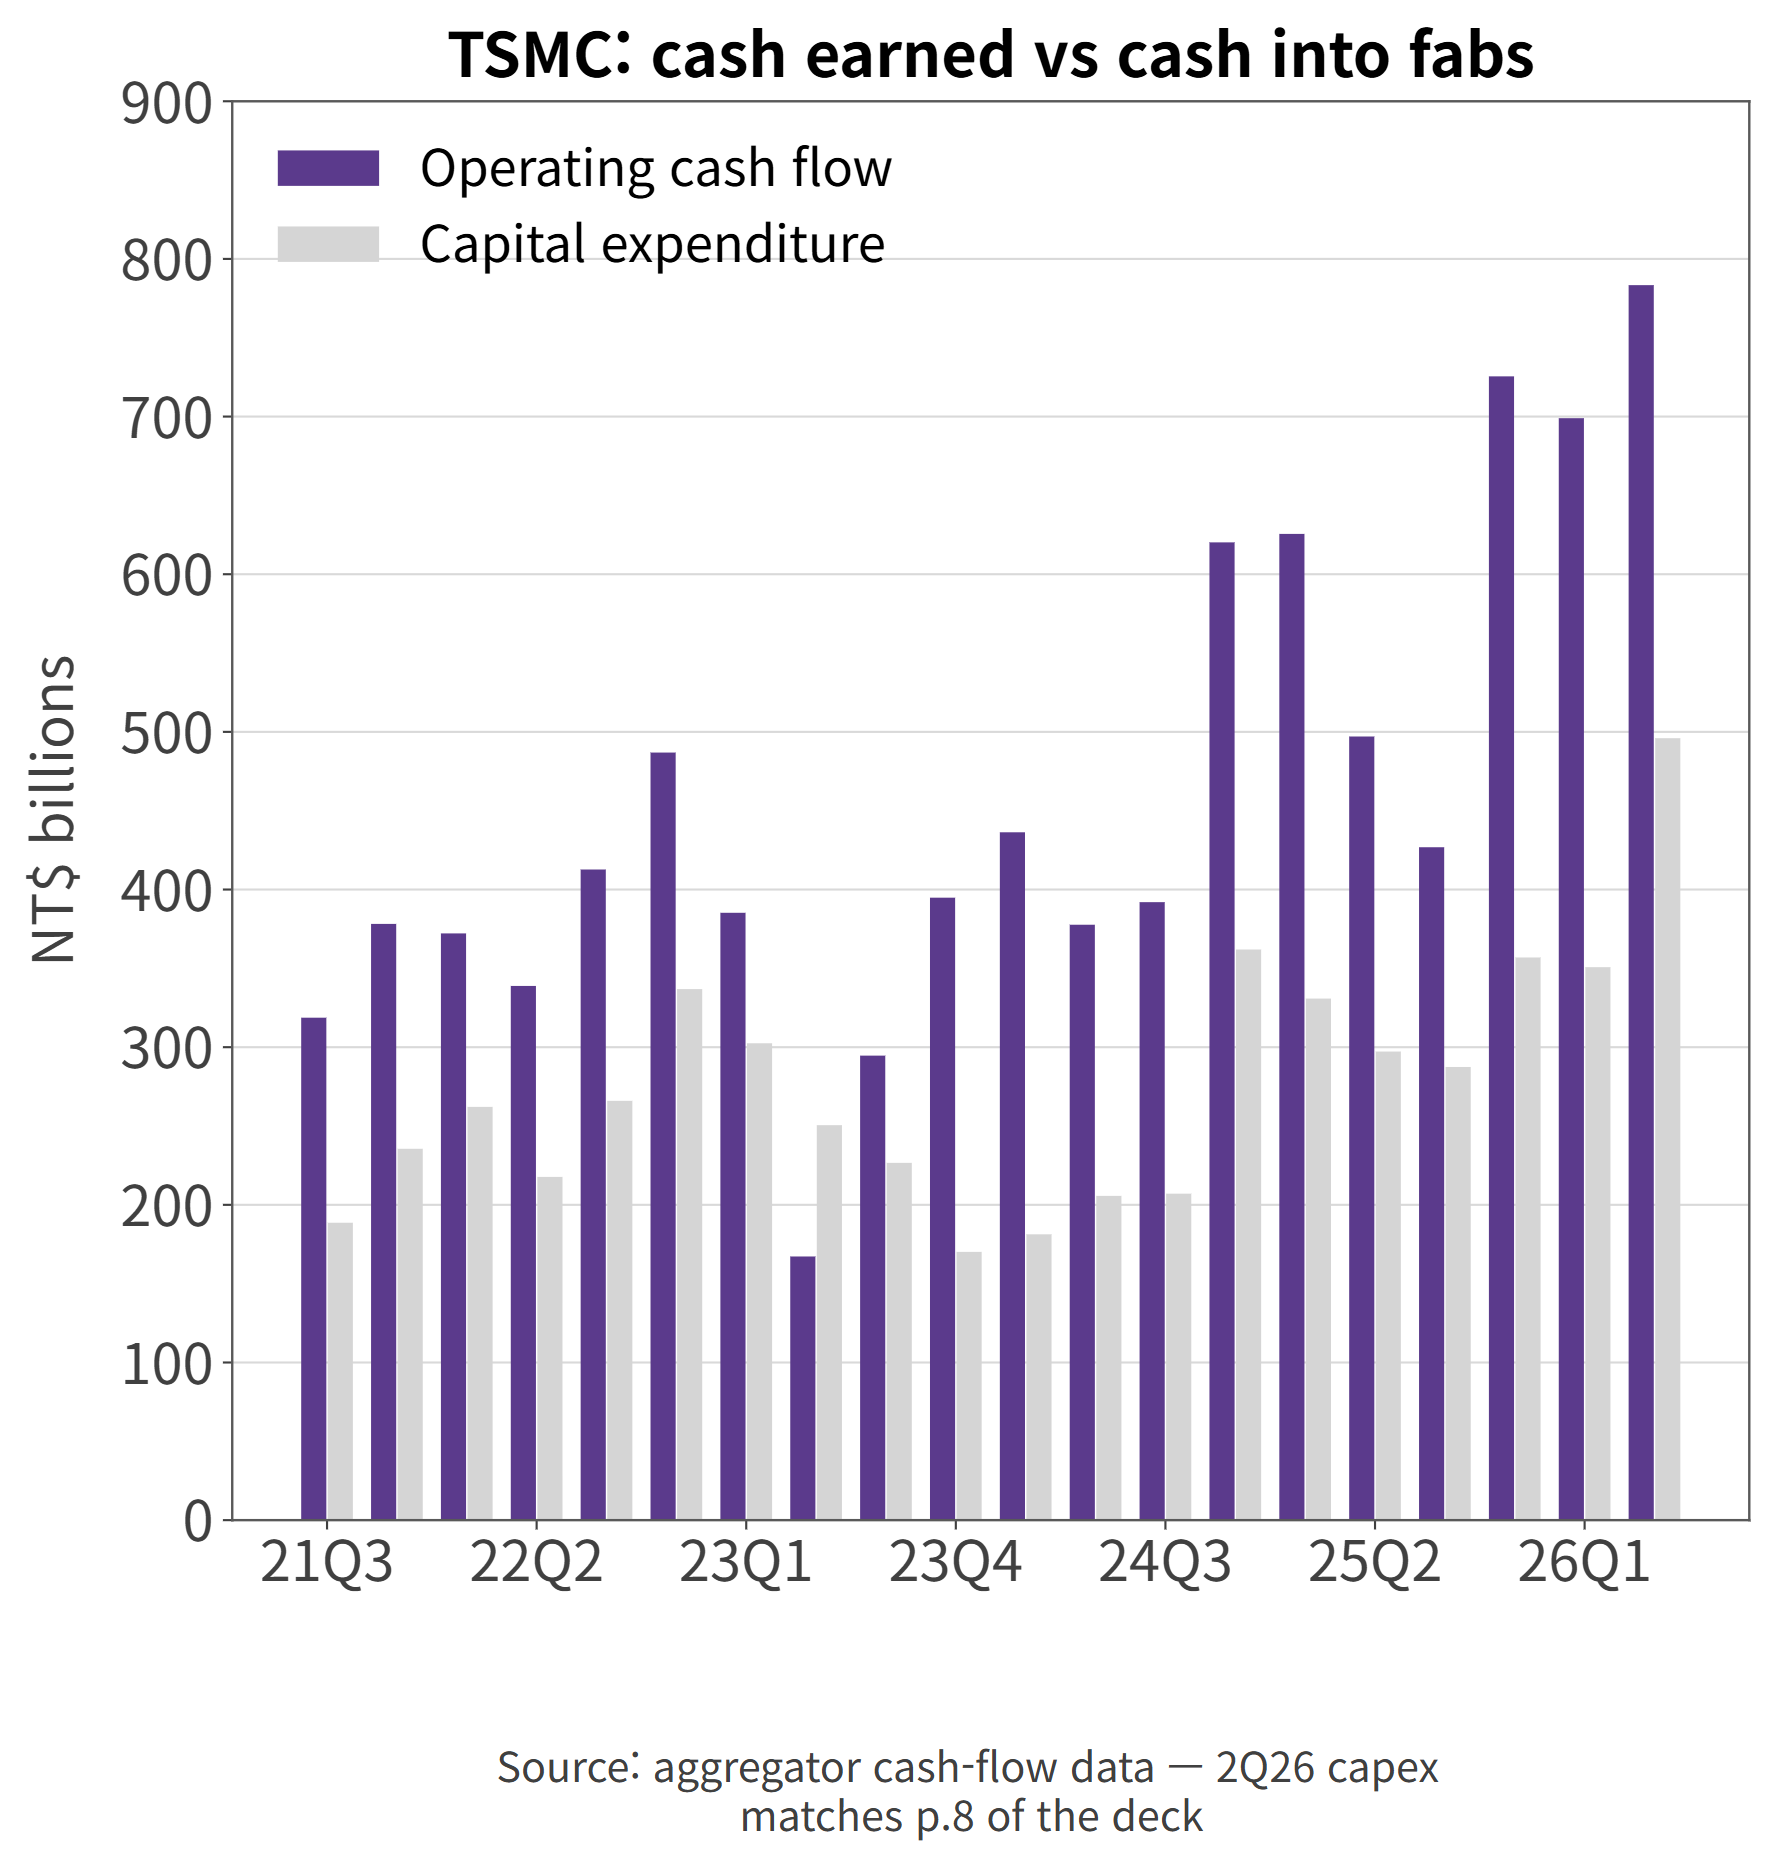
- The entry ticket is the money itself. TSMC put NT$846.8 billion — about $26.6 billion — into capital expenditure in the first half alone. Six months of capex exceeds half of UMC's entire market value. And at its April technology symposium the company unveiled A13, two generations beyond the current node, moving the finish line before anyone reaches the last one.
| Company | Market cap | P/E | Note |
| TSMC | $2,165 billion | 30.1x | ADR basis, own calculation |
| Intel | $470 billion | Loss-making | Rebuilding its foundry arm |
| UMC | $52 billion | 19.7x | Mature nodes |
| GlobalFoundries | $25 billion | 35.0x | U.S. and European fabs |
| Samsung Electronics | Not U.S.-listed | — | Not comparable here |
- Source: market data as of the Aug 28, 2026 close
- The one competitor that should be fighting at the leading edge is losing money; the rest live on mature nodes. The market-cap column is the price tag on the technology gap.
Is TSMC Stock Expensive? Three Yardsticks
- First, a measurement note. TSMC's home listing is Taipei; New York trades an ADR representing five common shares. The market cap that aggregators display — $1.98 trillion — is based on the Taipei share price. Multiply the ADR price by the full share count and you get $2.17 trillion. The gap, roughly 9.4%, is the premium New York pays over Taipei. Every multiple in this article uses the ADR side consistently.
| Yardstick | Value | Basis |
| P/E | 30.1x | Trailing 4-quarter ADR EPS of $13.86 |
| P/S | 15.2x | Trailing 4-quarter revenue of $142.9 billion |
| P/B | 10.7x | 2Q26 equity at NT$31.85 per dollar |
| Return on equity | 45.9% | Company-reported, annualized |
- Source: own calculations from company releases and market data, Aug 28, 2026 close
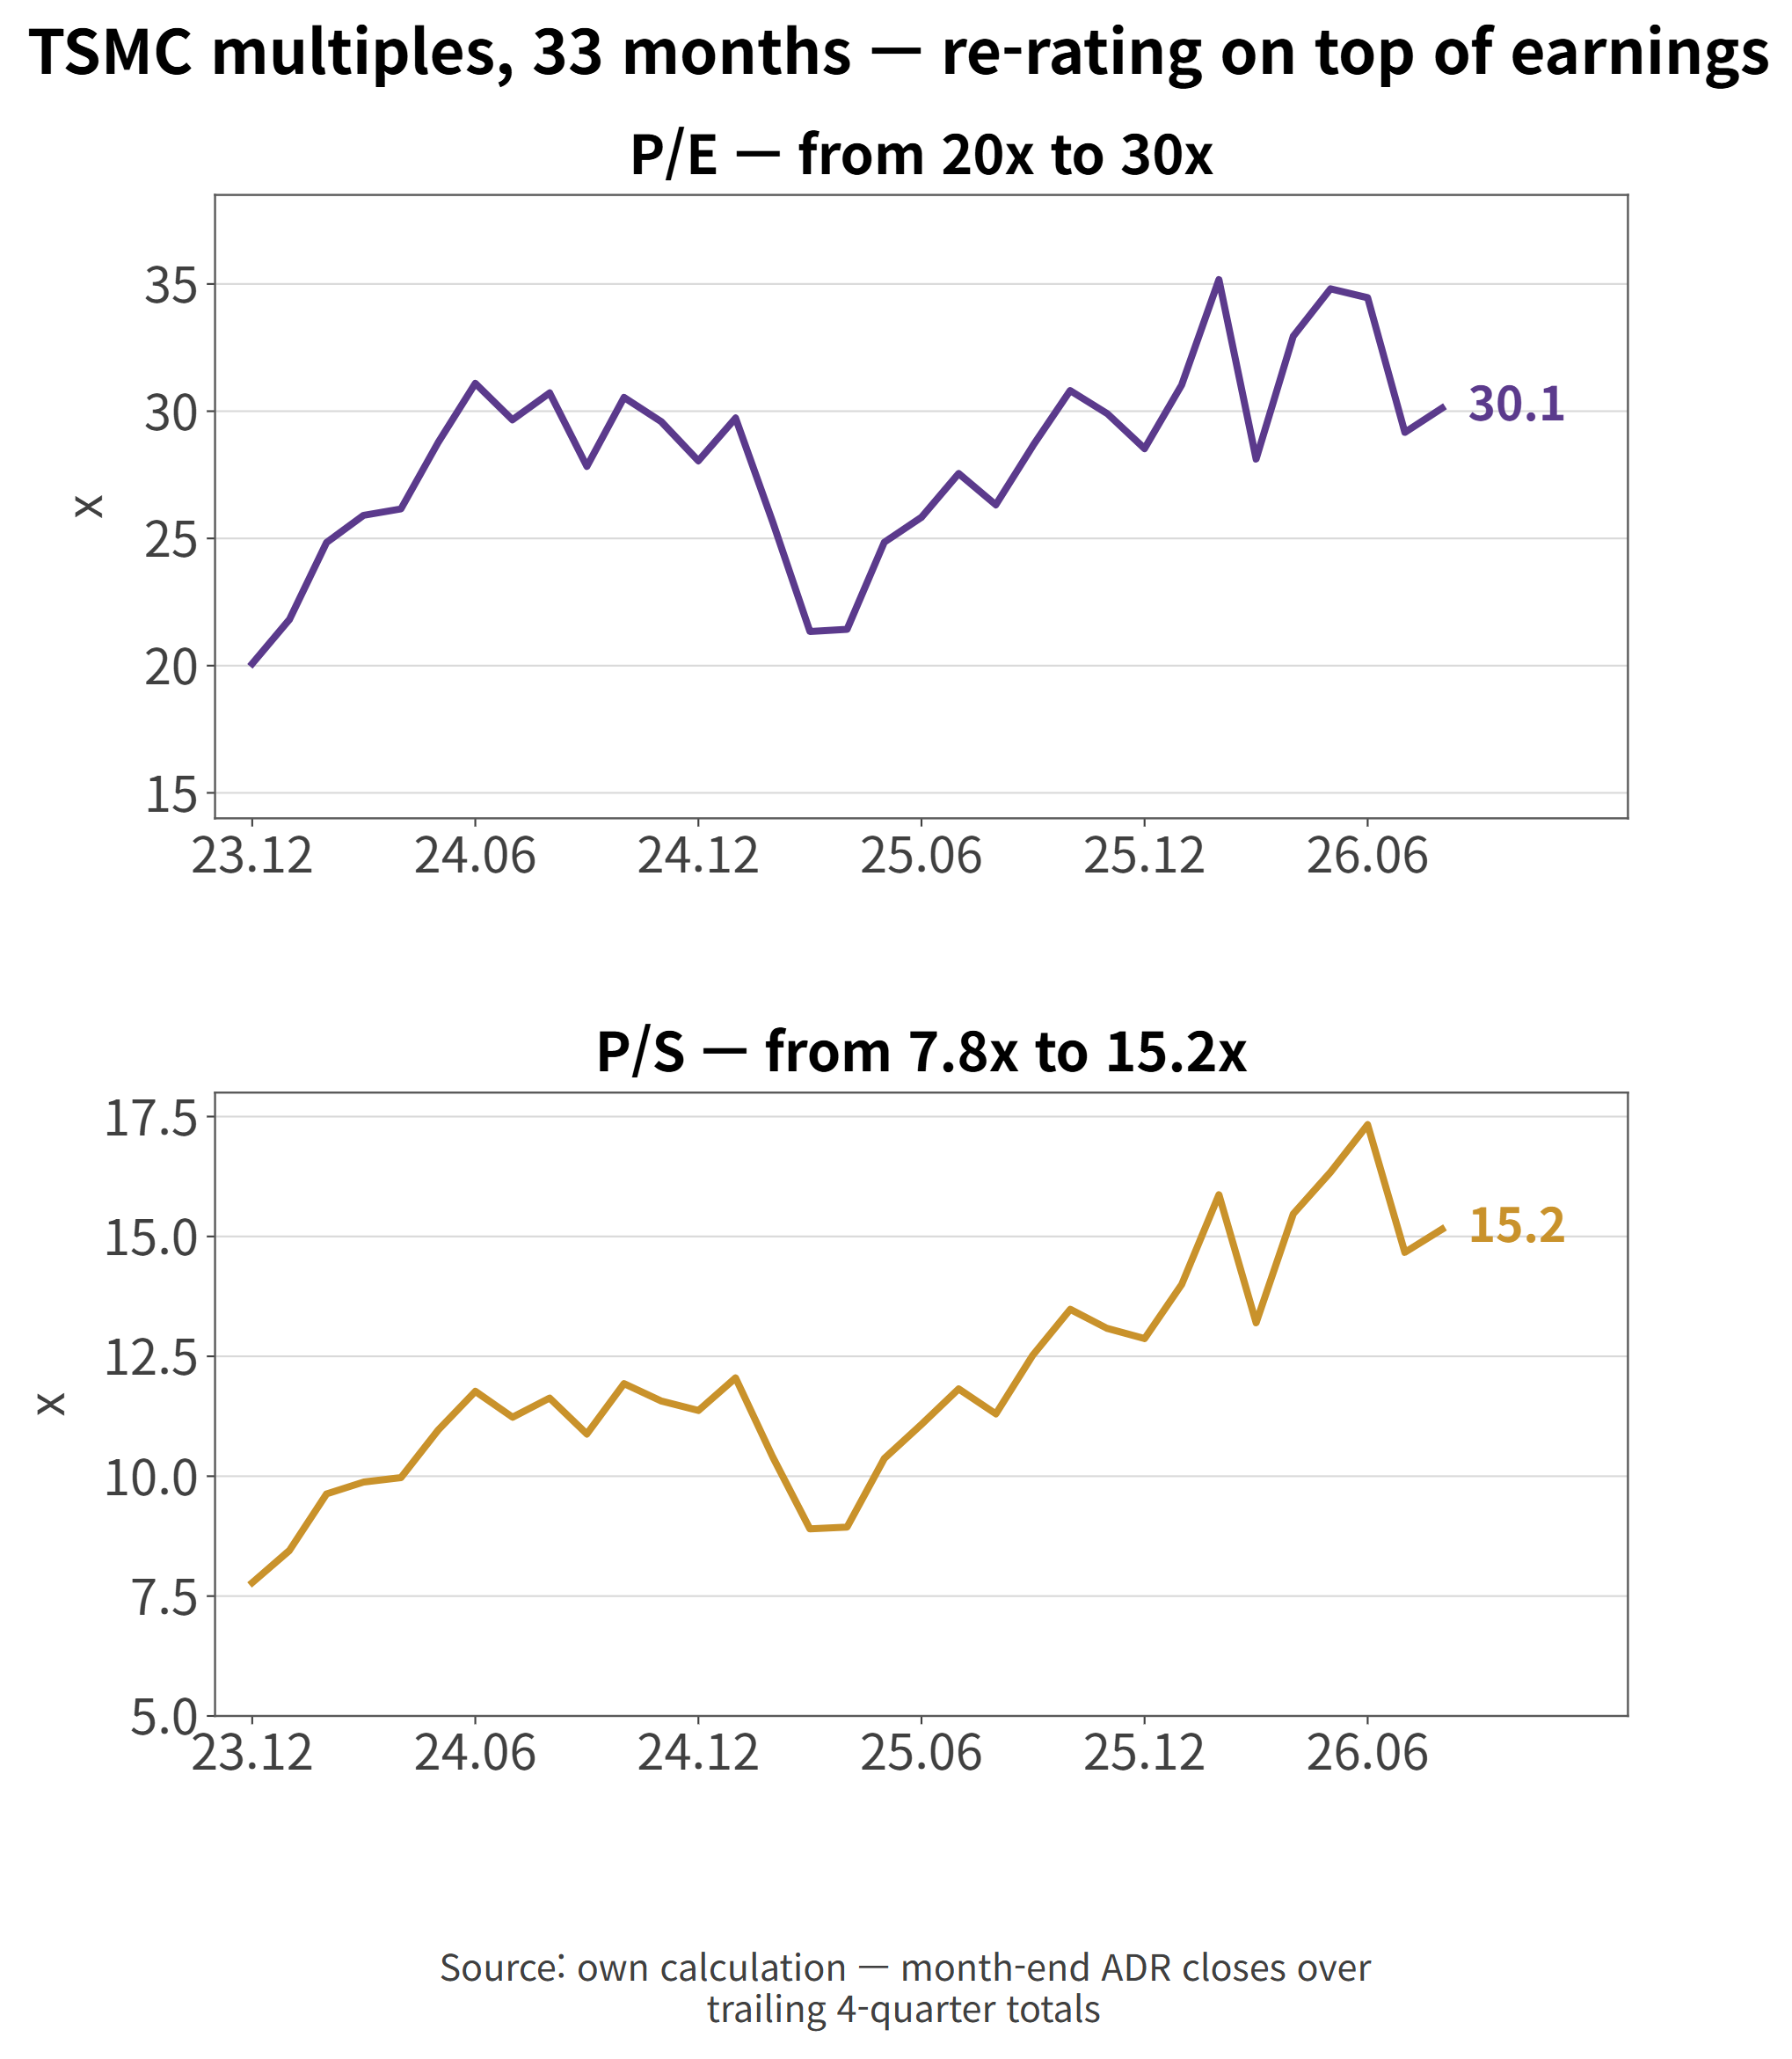
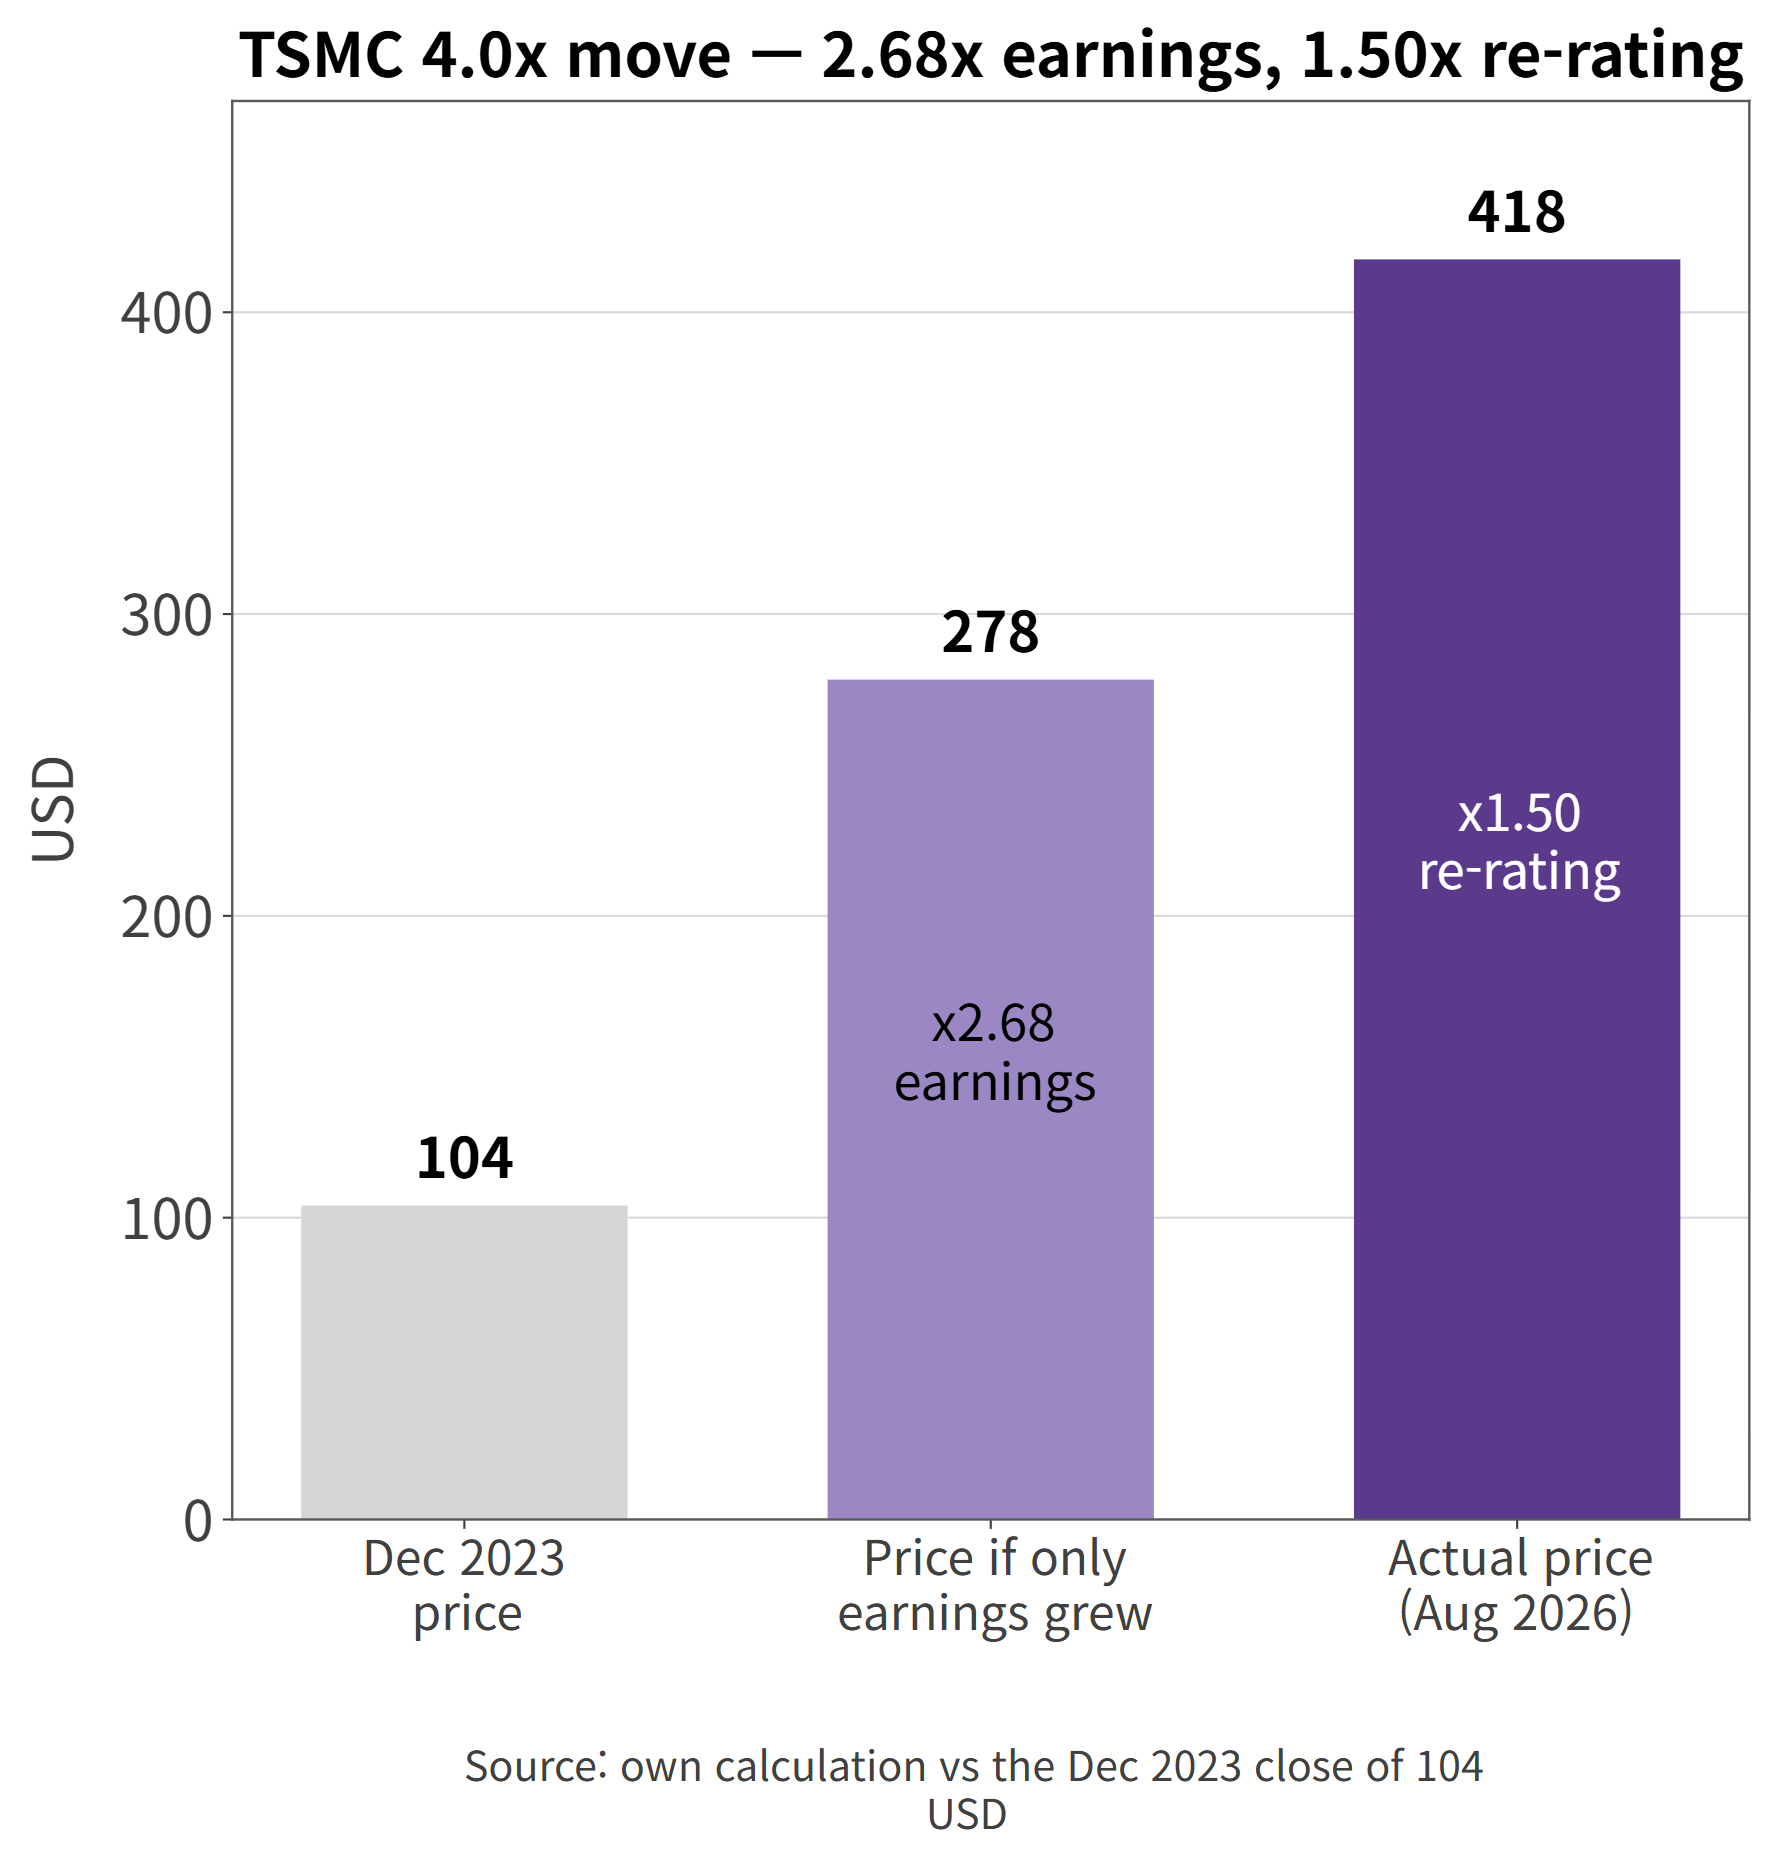
- The stock went from $104 at the end of 2023 to $417.52 — 4.0x in 33 months. Split that move and earnings growth accounts for 2.68x while multiple expansion accounts for 1.50x. Two-thirds earned, one-third re-rated. At 30.1x the stock sits below its three-year peak of 35.2x, set this February, but the price was cheaper than today in three-quarters of the past 33 months.
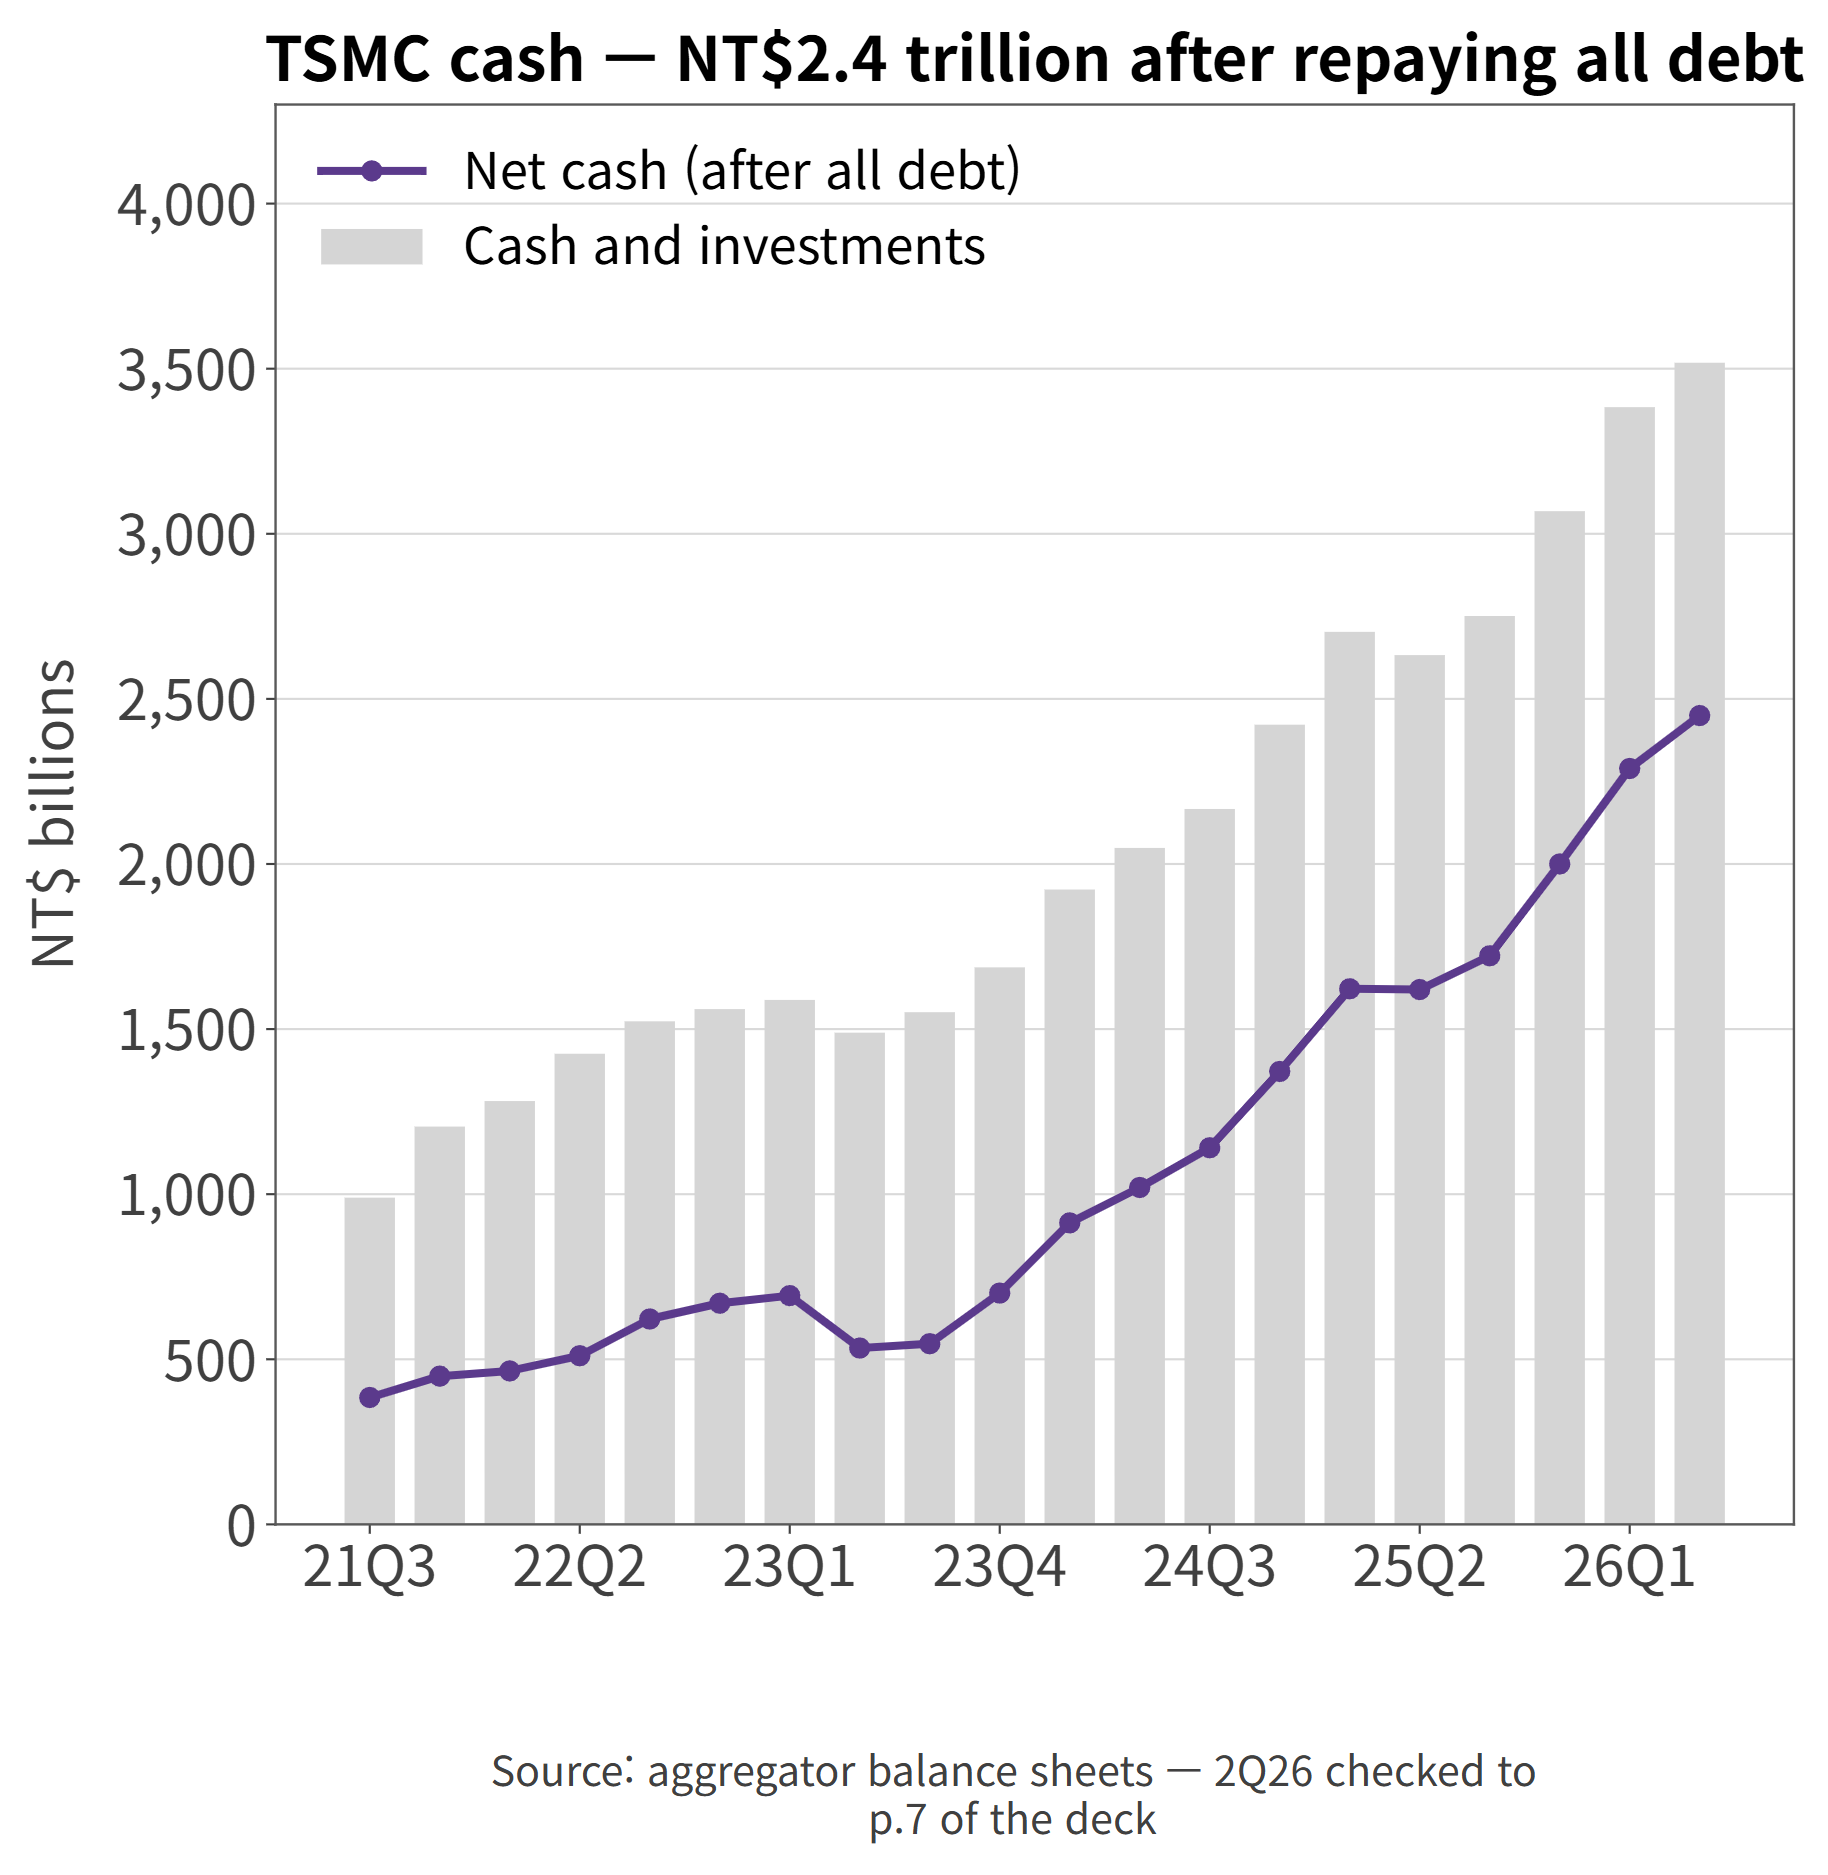
- The bull case has real feet under it. Net cash stands at NT$2,449.5 billion — the company could retire every borrowing and still hold a mountain of cash — and the quarterly dividend has climbed from NT$2.75 to NT$7.00 in two and a half years. Sell-side consensus runs 12 strong buys, 6 buys, 1 hold and no sells among 19 analysts, with an average target of $554.45. The targets stretch from $440 to $700, though — a $260 spread is less a consensus than an open argument.
Key Takeaways for TSM Stock
- Second-quarter revenue of $40.20 billion with a 60.3% operating margin. Gross margin of 67.7% beat the company's own guidance ceiling — the fourth straight quarter above the range.
- Growth split evenly: wafer shipments +16.6%, price and mix +16.6%. The price half comes from the node mix — 3nm at 30%, 2nm entering at 3%.
- This is the company that writes its FX assumption (NT$32 per dollar) into guidance. If the Taiwan dollar strengthens past the assumption, the currency works against the margin for the first time in a year.
- The "slightly above +40%" full-year promise requires a $50.1 billion fourth quarter, up +48.5% year over year. The October and January releases are the test.
- At 30.1x trailing ADR earnings, the stock has been cheaper in 24 of the past 33 months. Of the 4.0x move since late 2023, 1.5x is re-rating — the part that unwinds first if earnings stall.
#TSMC #TSM #TSMCStock #Foundry #Semiconductors #2nm #AIChips #TaiwanSemiconductor #USStocks #StockAnalysis


