Dell Technologies (NYSE: DELL) reported fiscal Q2 2027 results after the close on September 1, 2026, with revenue of $46.97 billion, up +58% year over year, and raised its full-year revenue outlook by $25 billion in a single quarter. This DELL stock analysis works through the quarter's reported numbers, the composition of the infrastructure revenue increase, the incremental operating margin that came with it, the gap between net income and operating cash flow, the server market backdrop, and where the shares trade against their own three-year multiple range.
Dell Technologies (DELL) — closed Sept 1, 2026; pre-market quote as of the Sept 2 capture
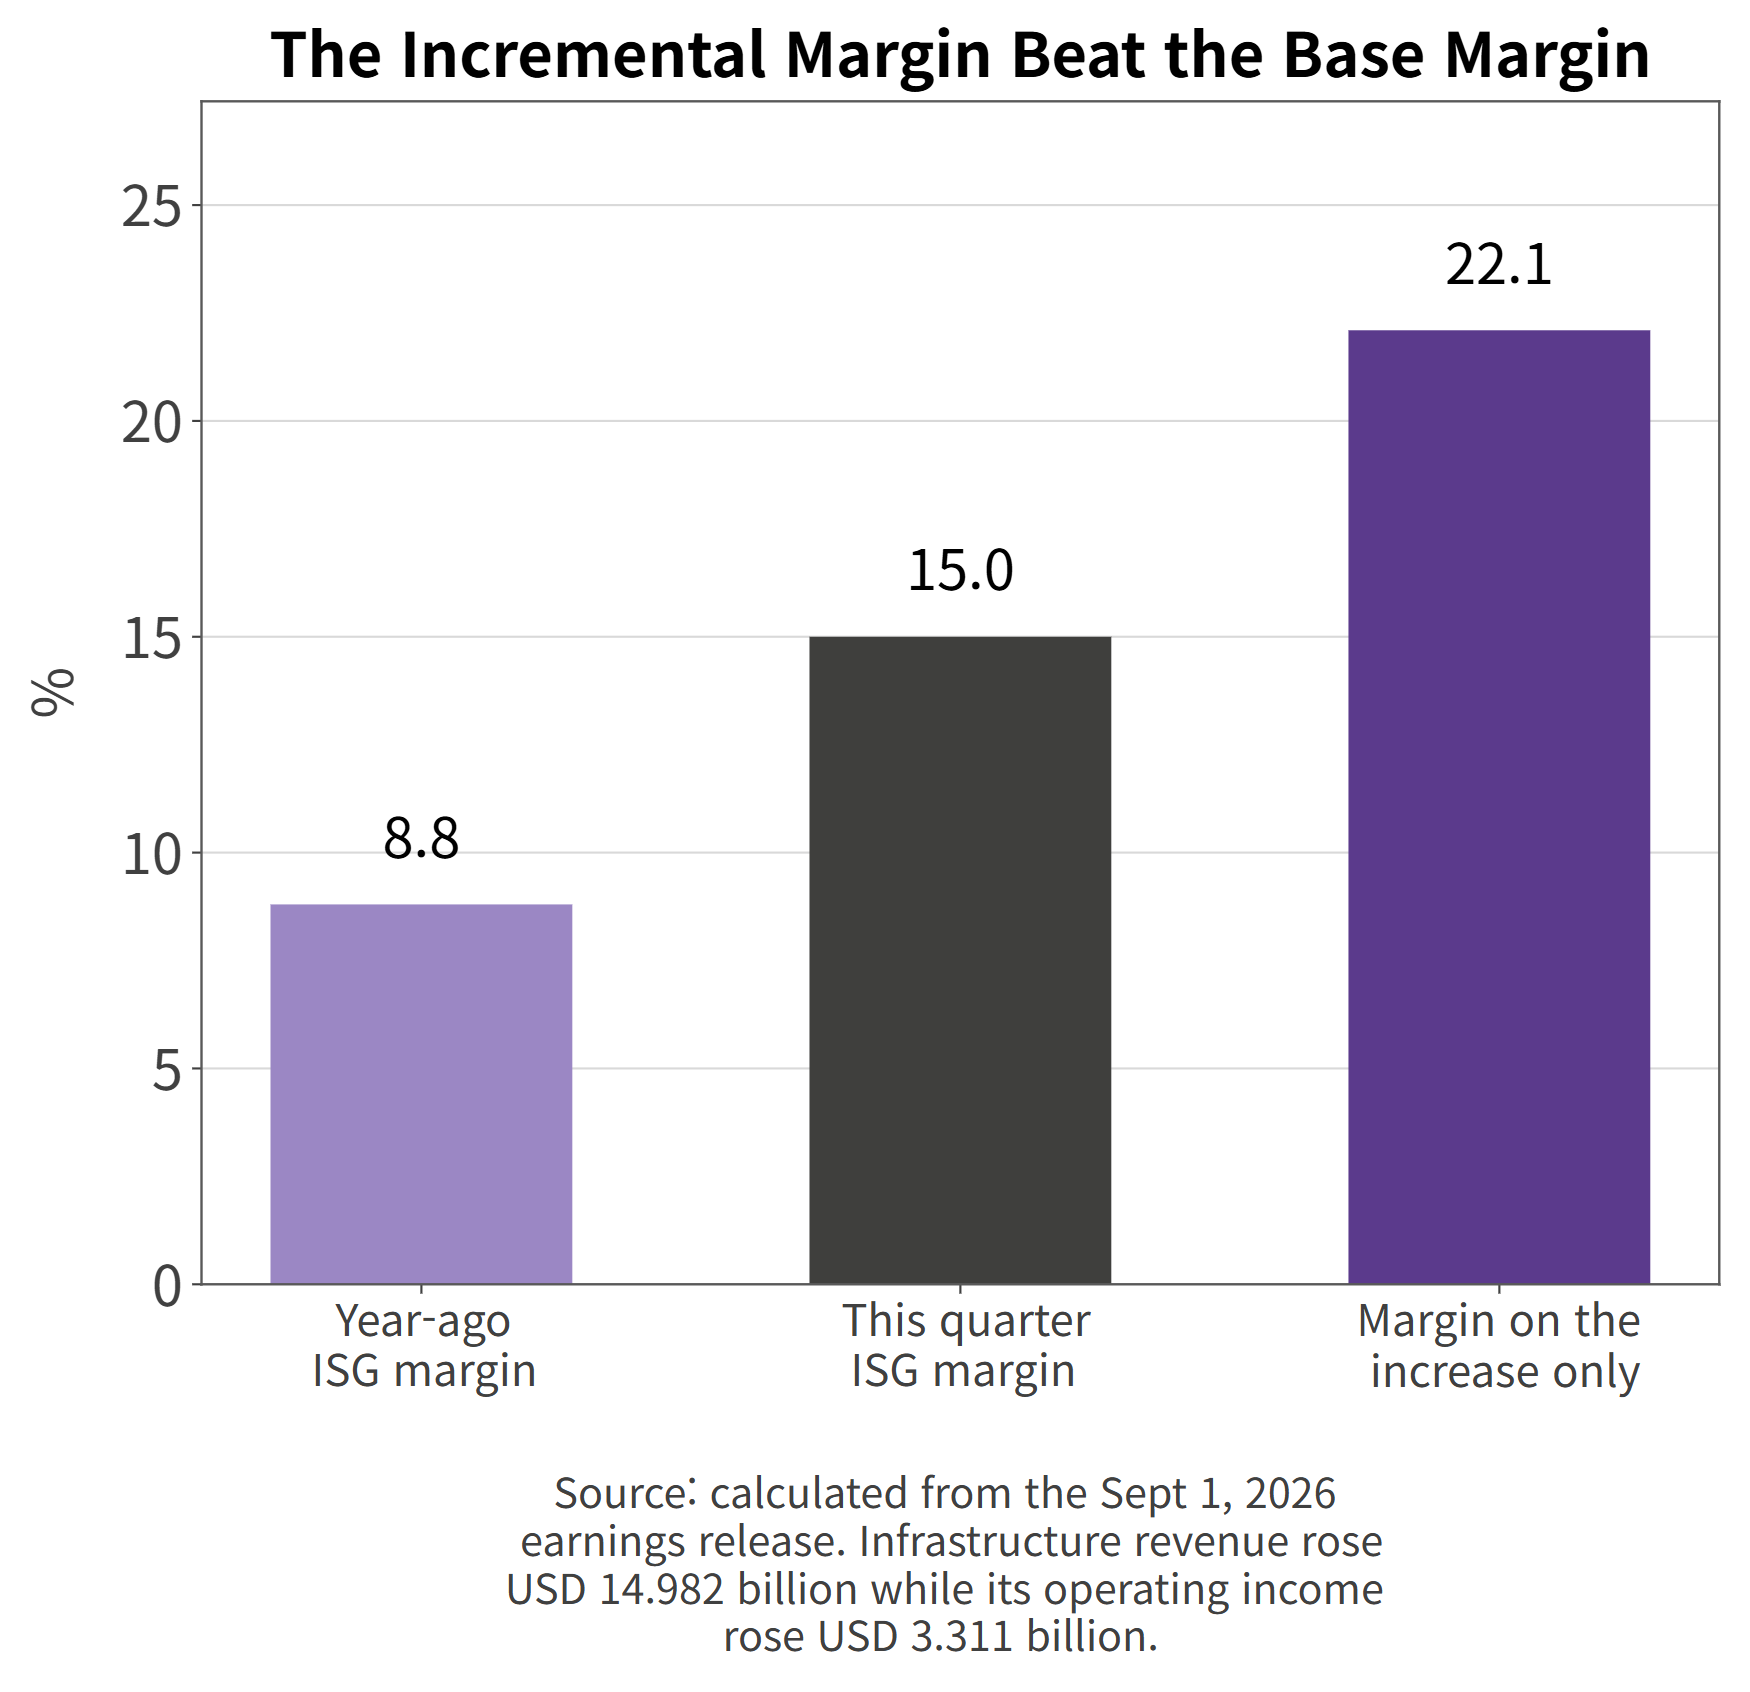
Here is the part that does not fit the standard AI-server story. Infrastructure revenue rose $14.982 billion and infrastructure operating income rose $3.311 billion with it. That is a 22.1% margin on the increase alone, against a base margin of 8.8% a year earlier. AI servers are supposed to be the low-margin part of this business.
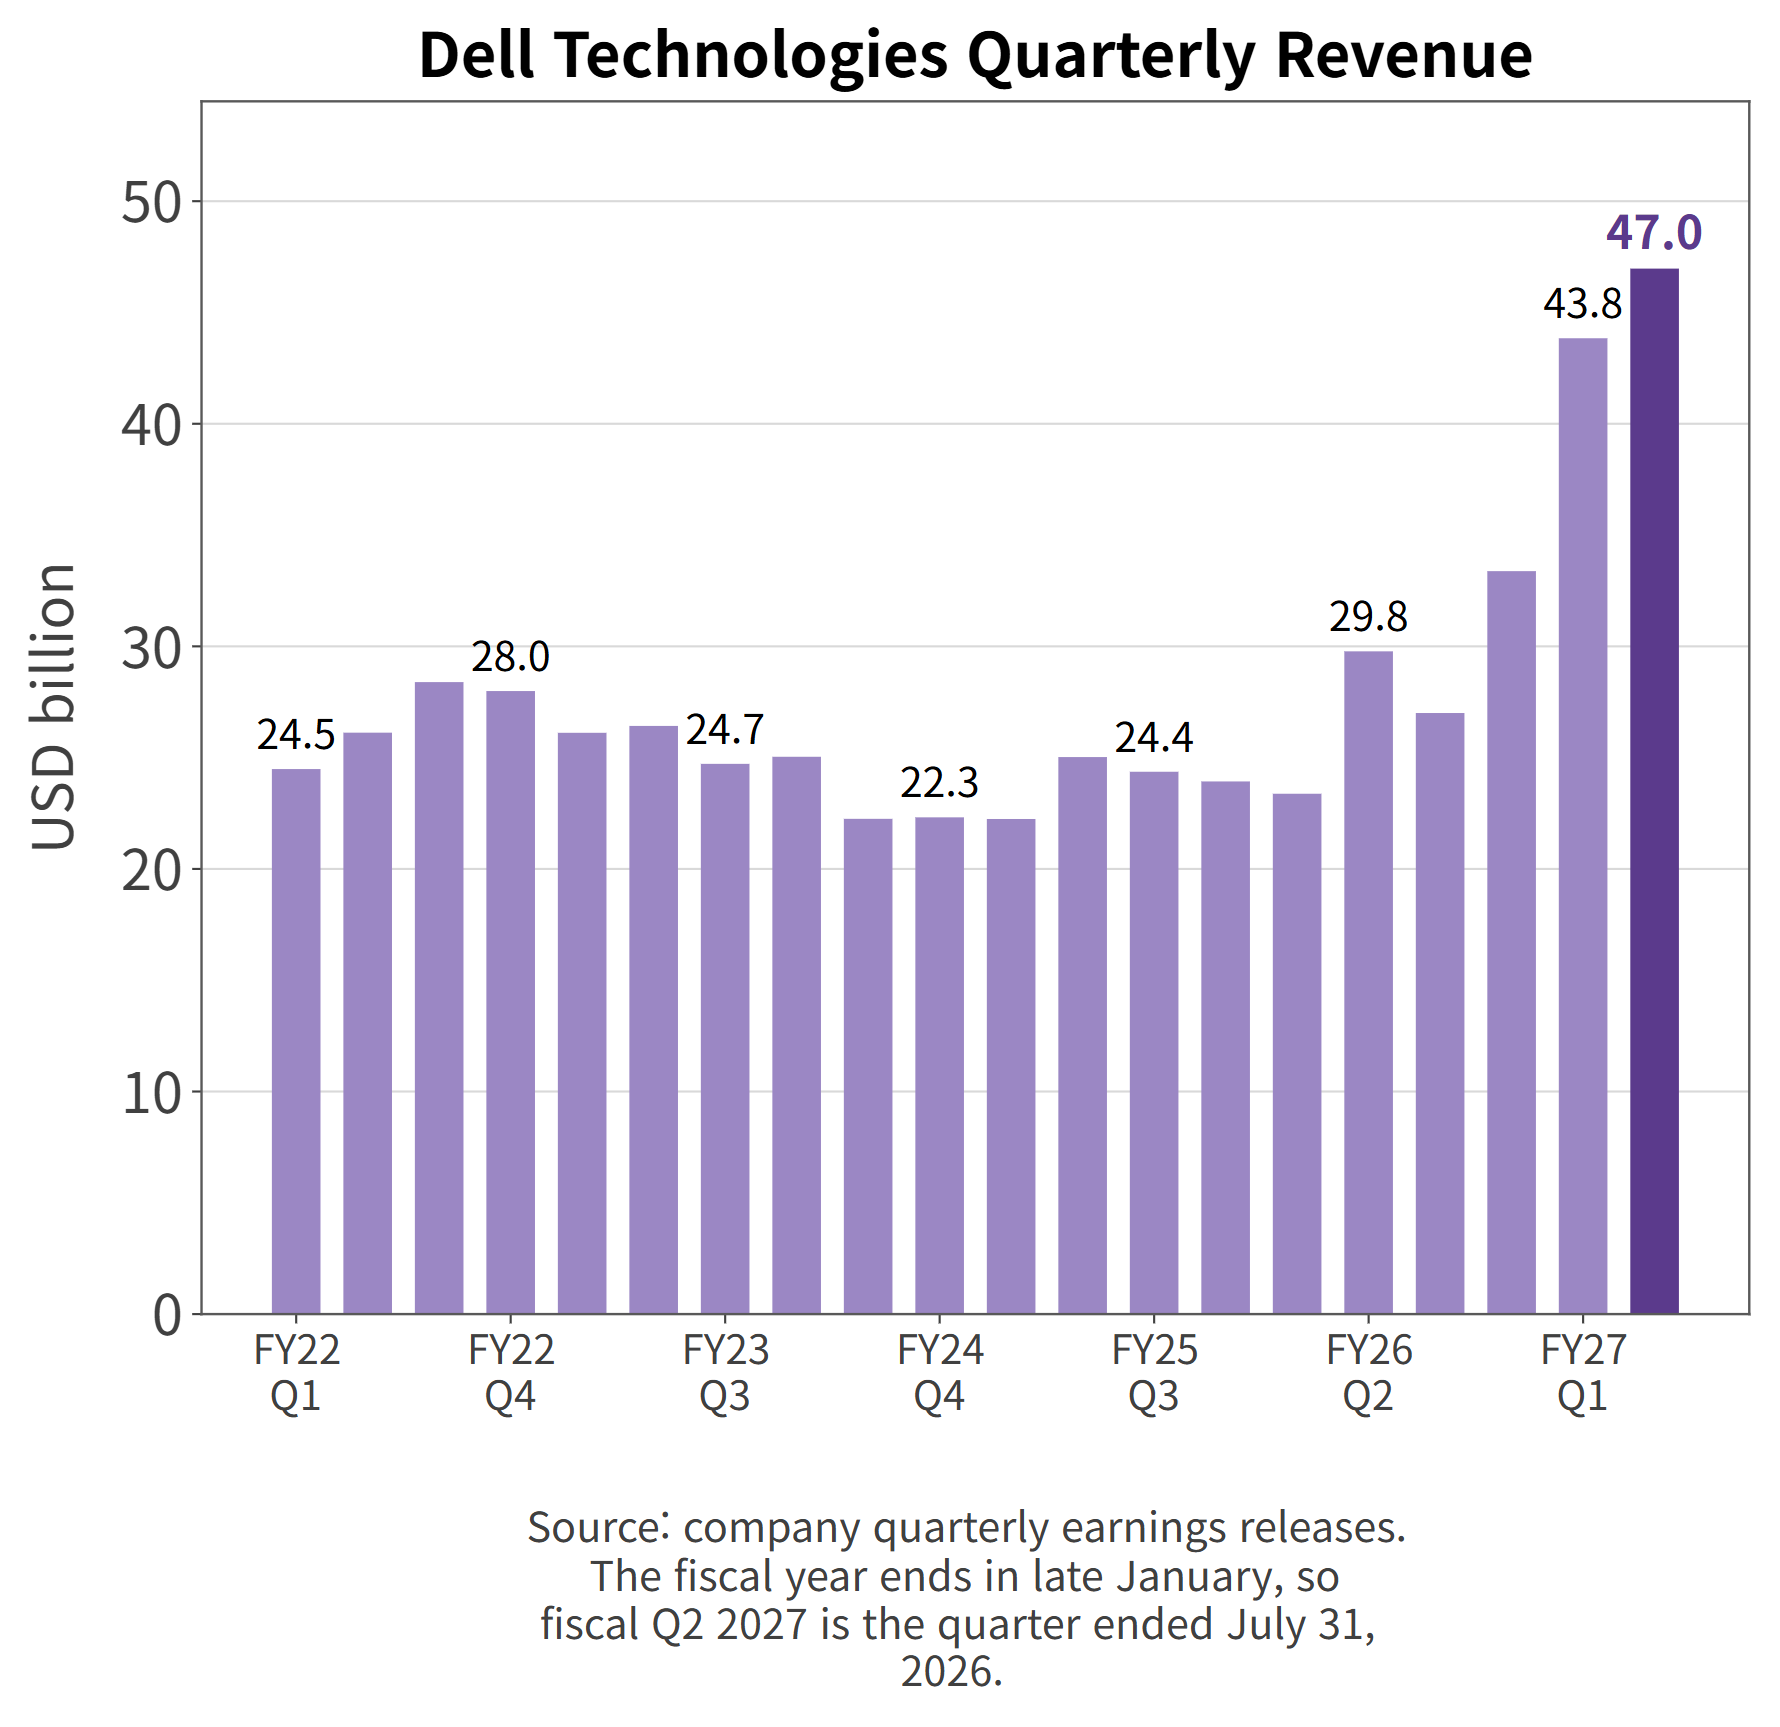
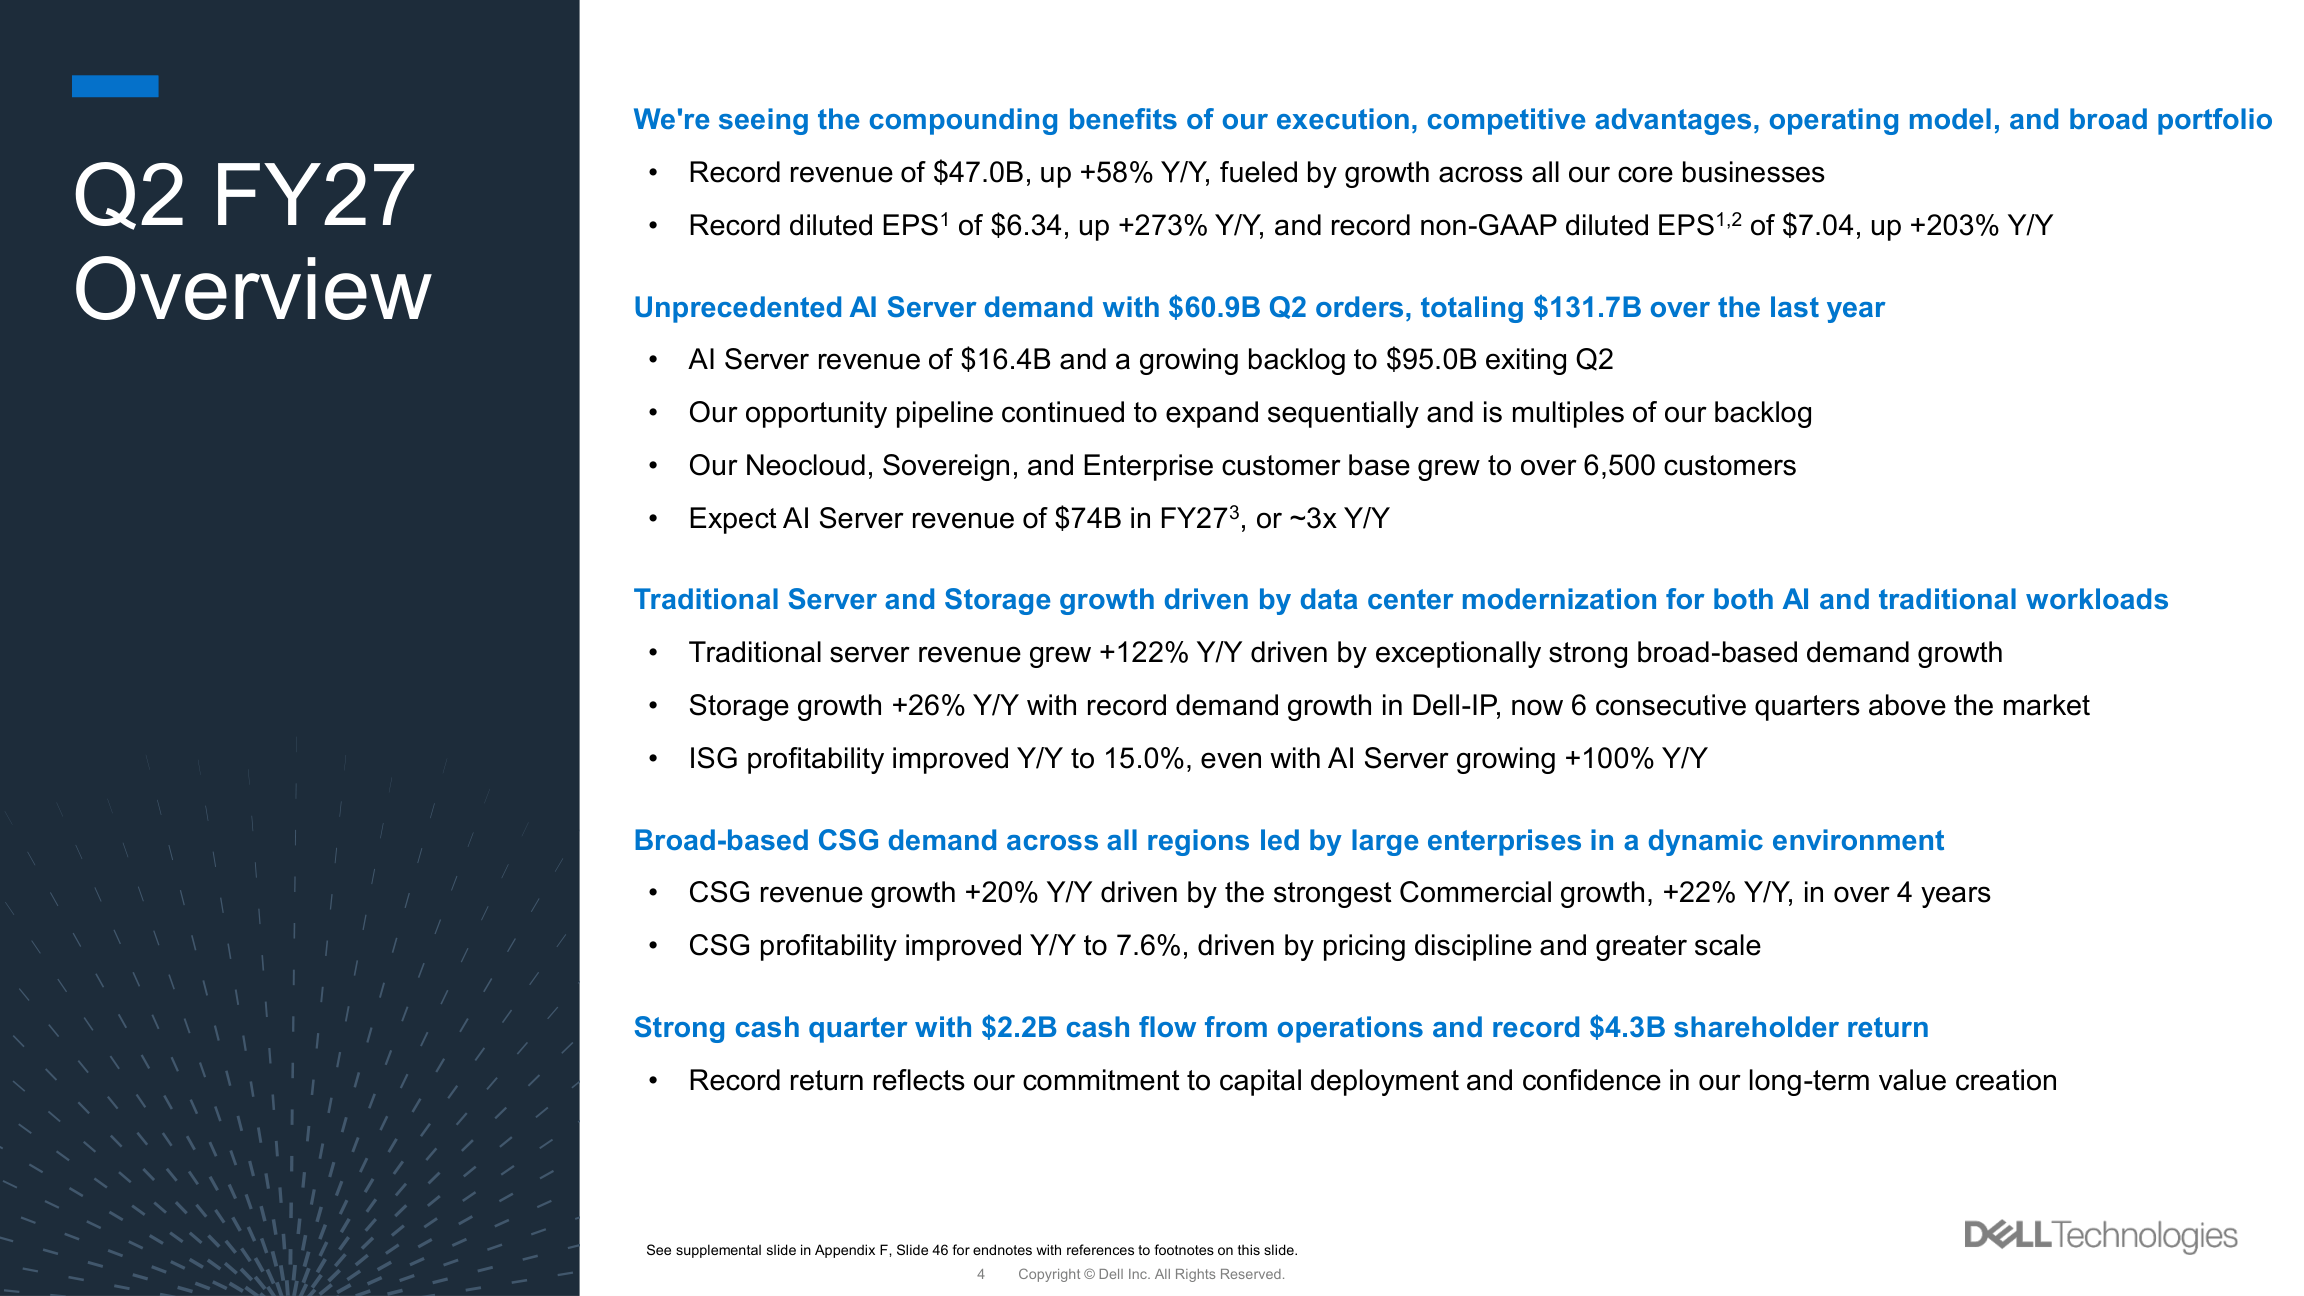
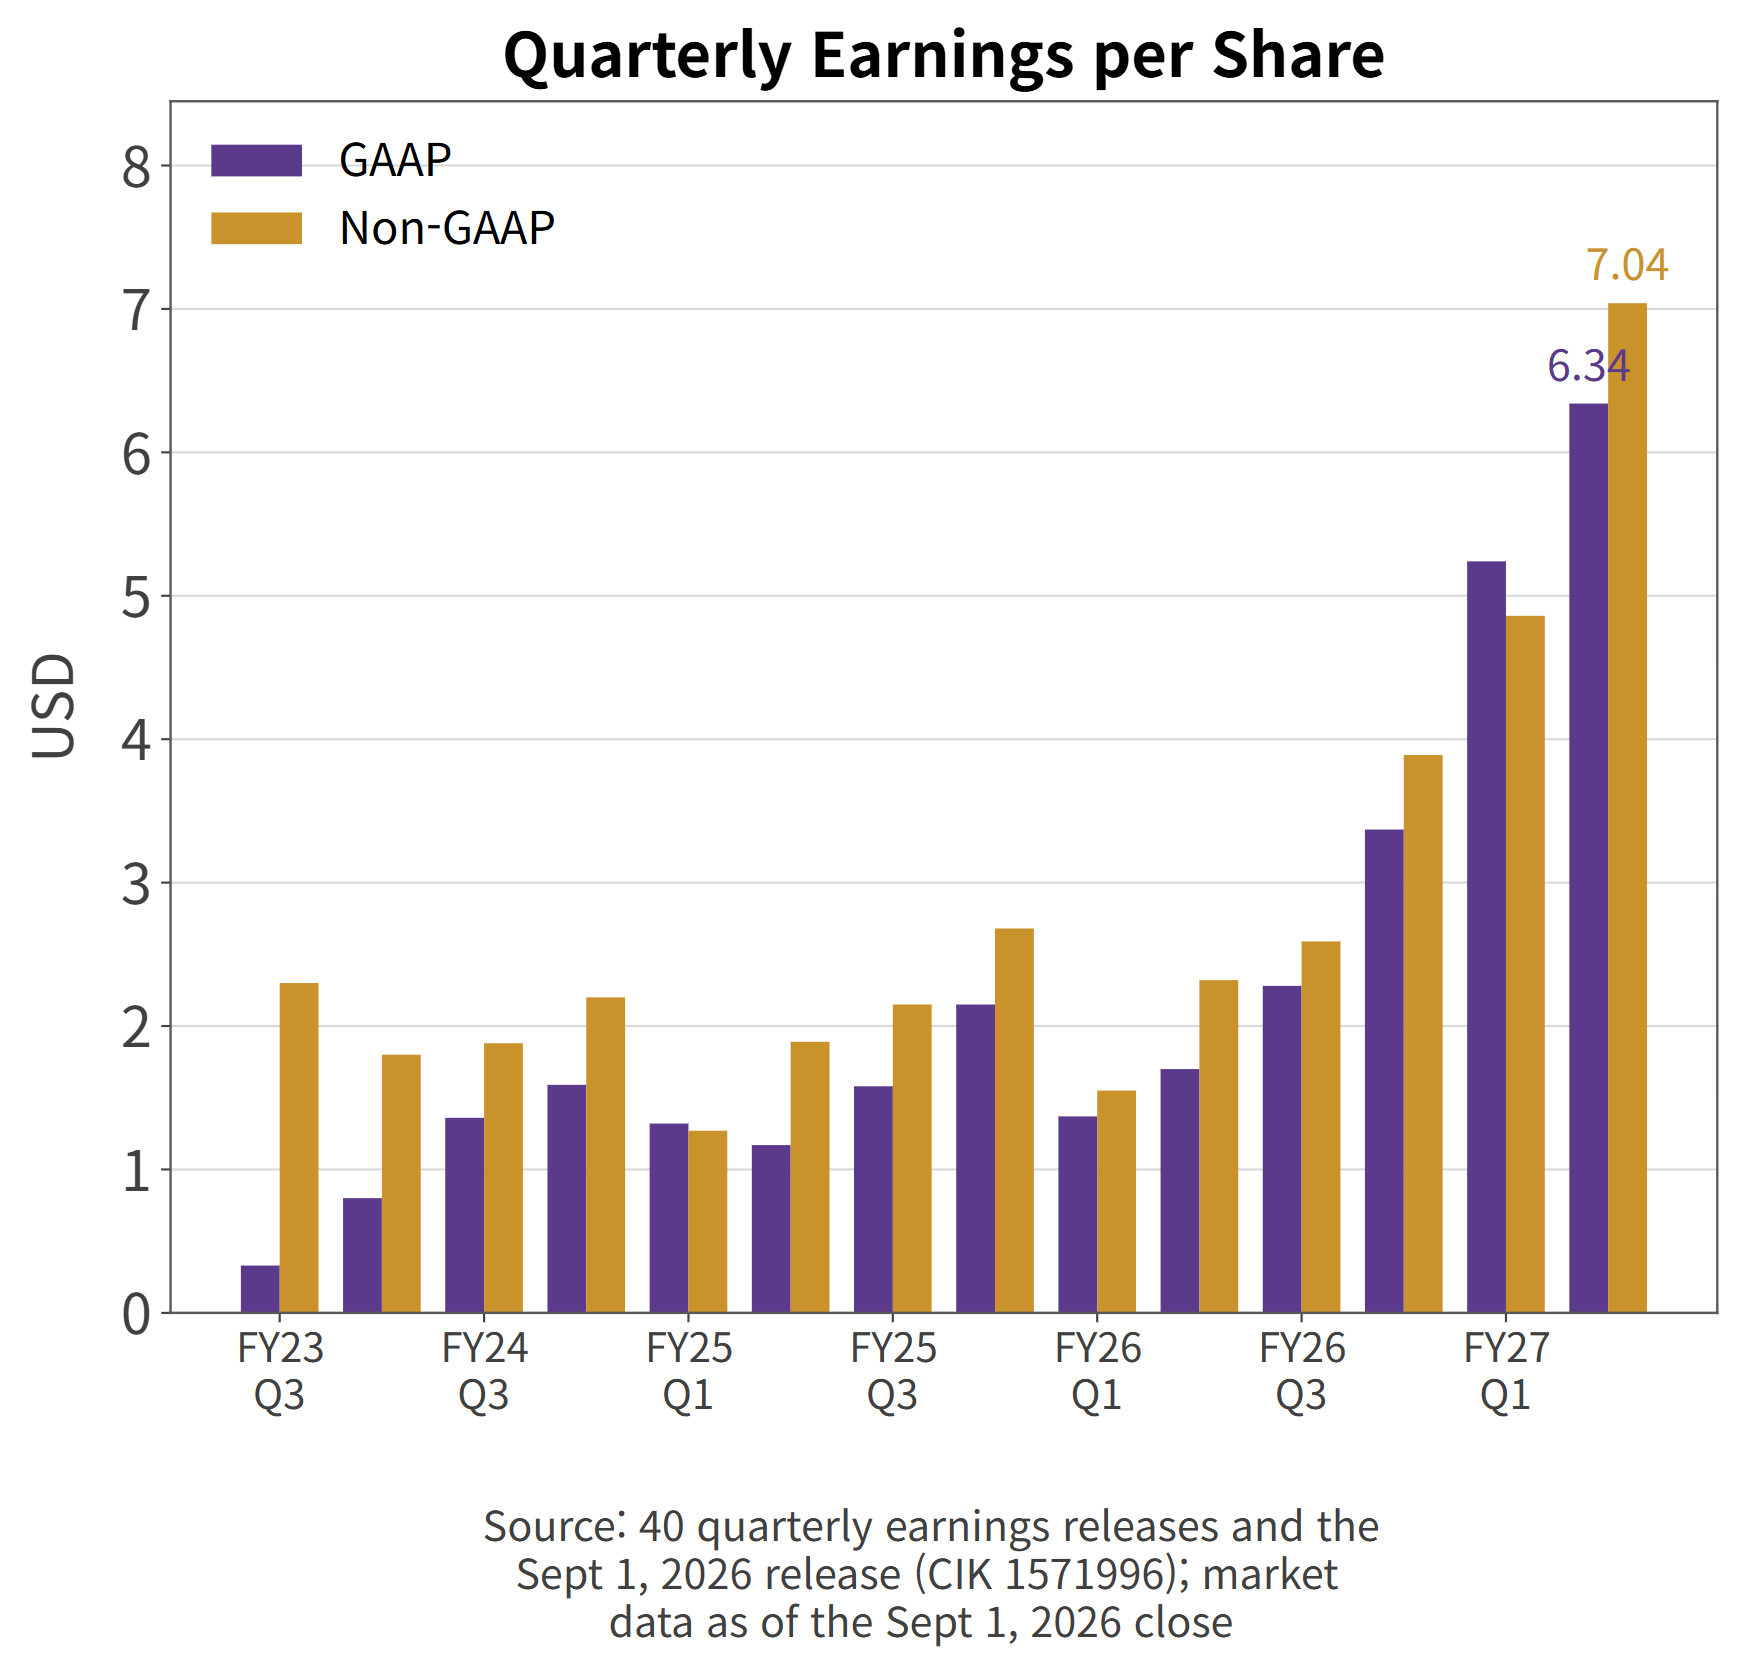
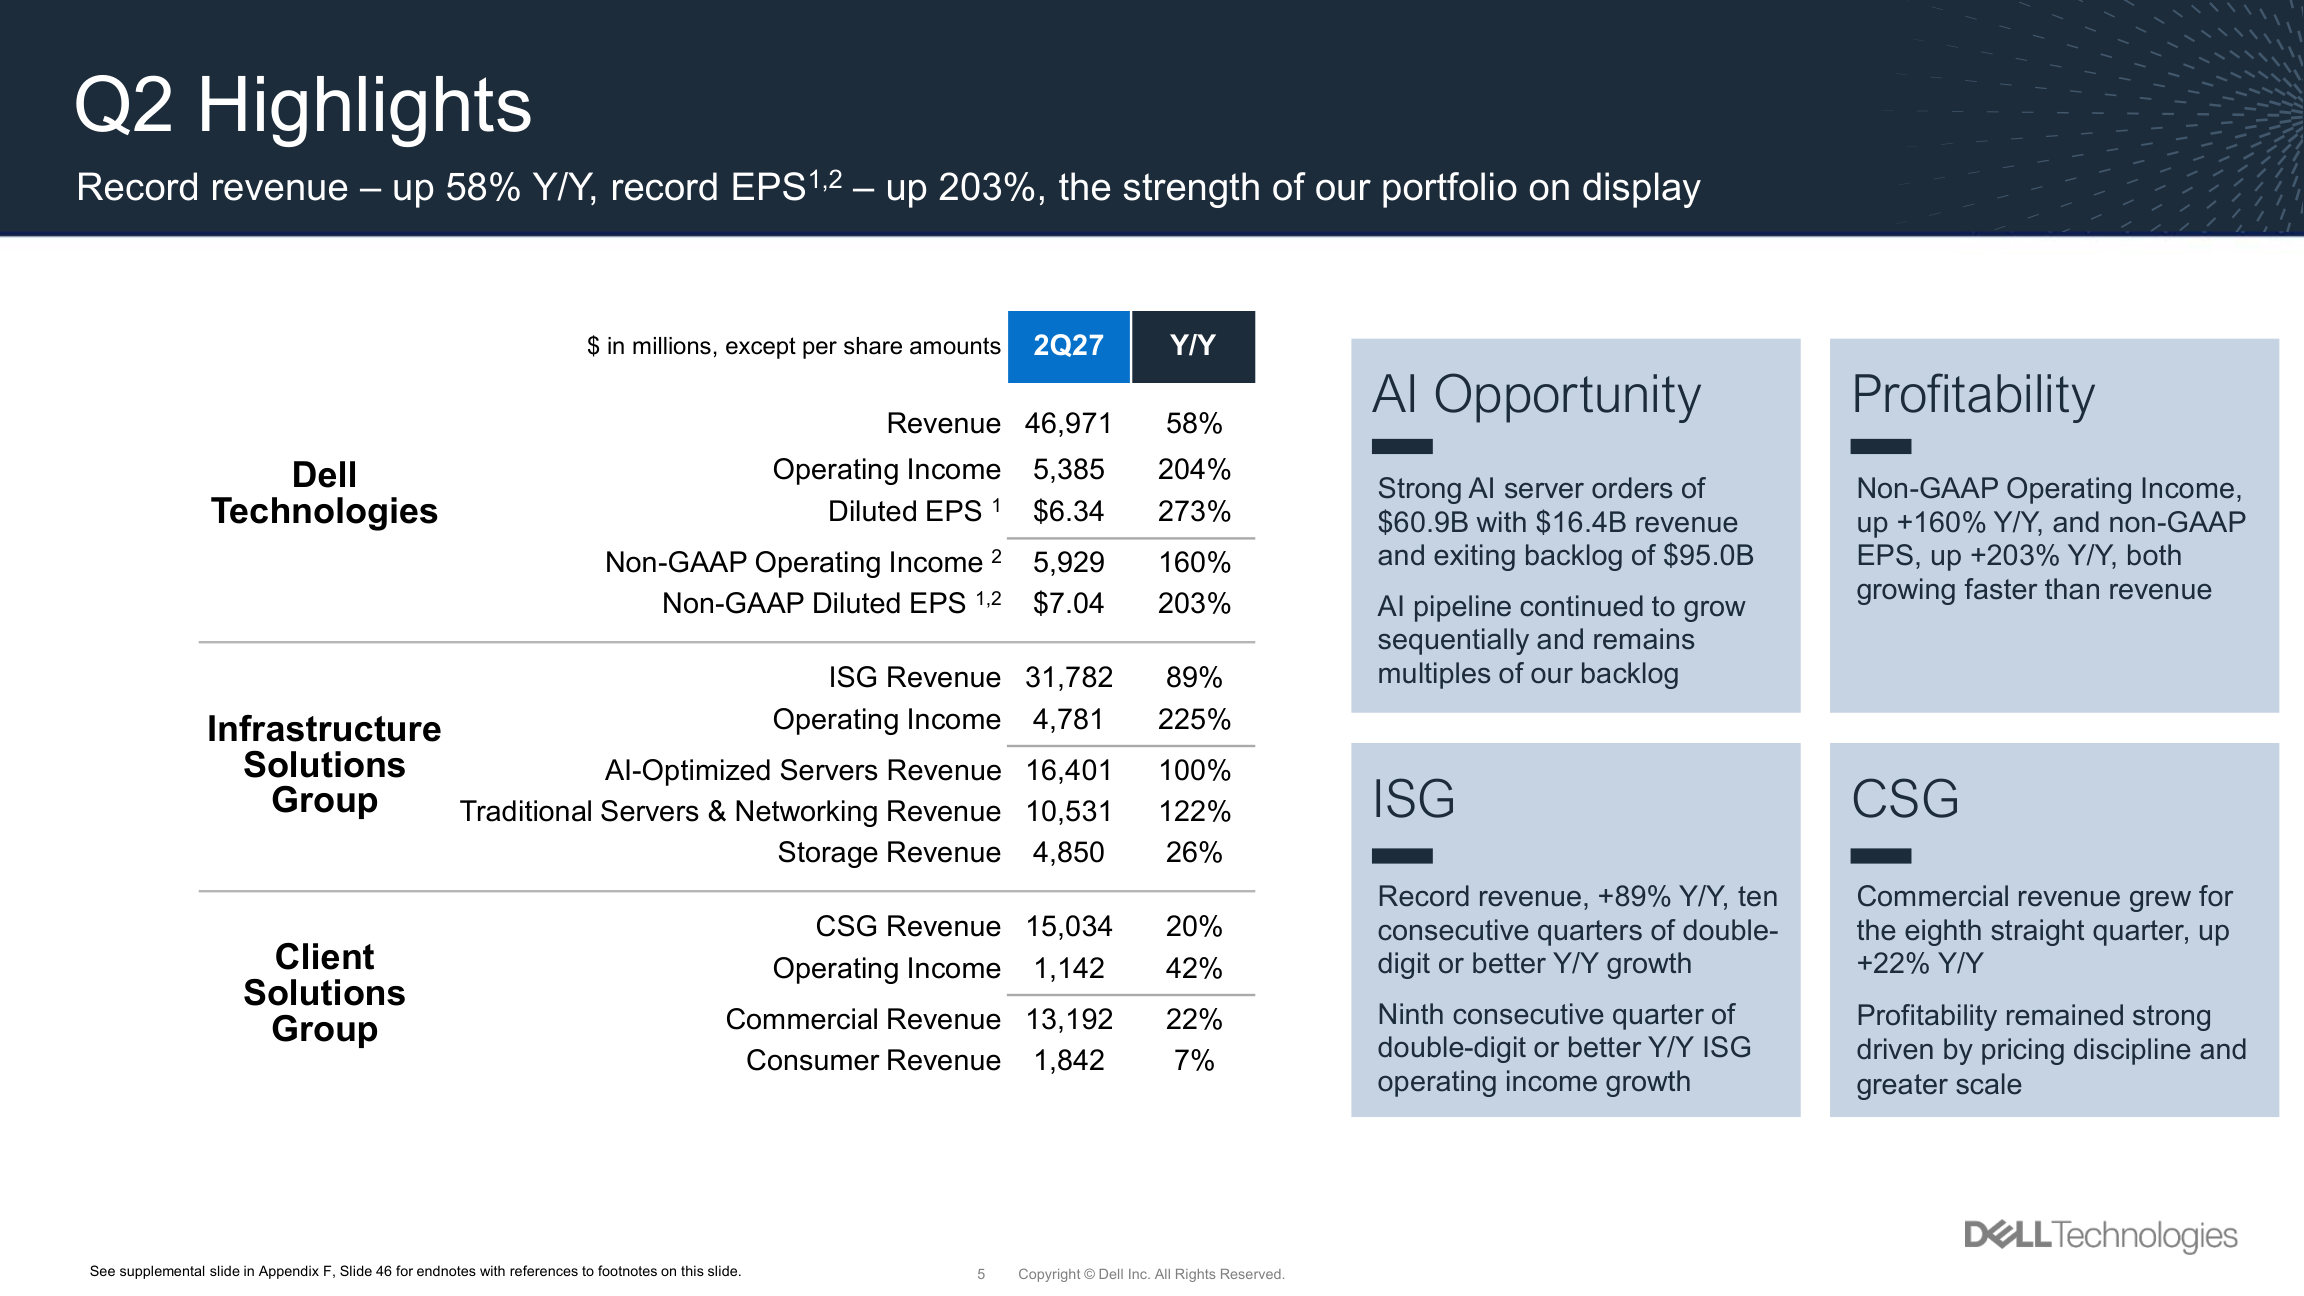
Start with the income statement. Revenue $46.97 billion (+58%), operating income $5.385 billion (+204%), net income $4.133 billion (+255%). GAAP diluted EPS came in at $6.34 and non-GAAP diluted EPS at $7.04, up +273% and +203%.
Dell quarterly revenue by segment
The growth rate climbs as you move down the statement. Revenue 58, operating income 204, net income 255, earnings per share 273. That is what an expanding margin plus a shrinking share count looks like.
Dell company operating margin, parsed from 40 earnings releases
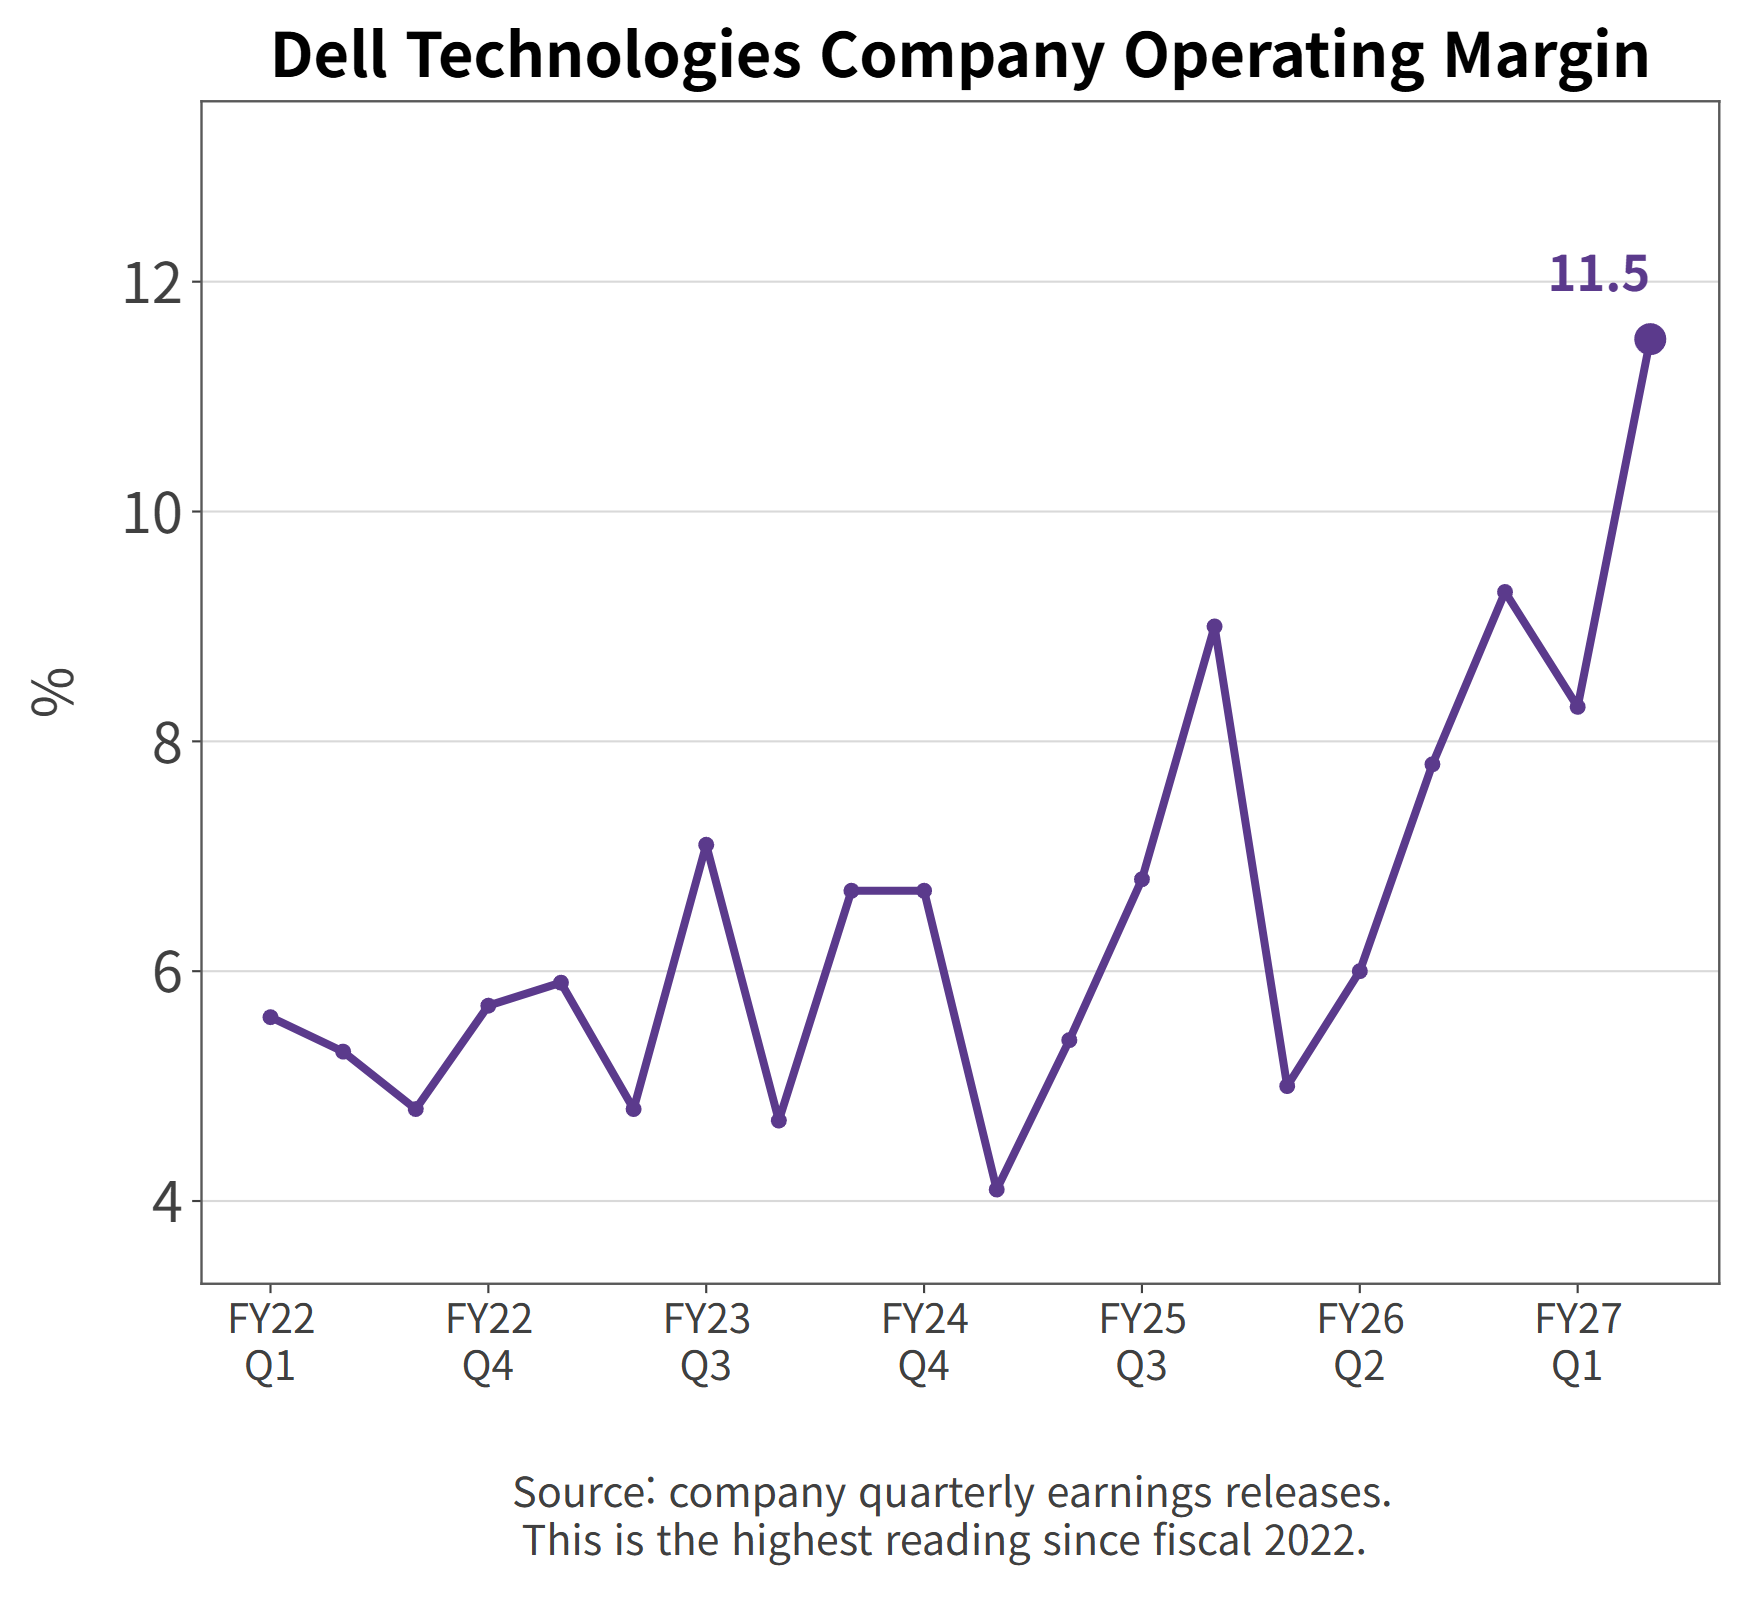
Company operating margin was 11.5%, the highest reading in the period since fiscal 2022. Dell called the quarter "Record revenue of $47.0 billion, up 58% year over year" in its own release.
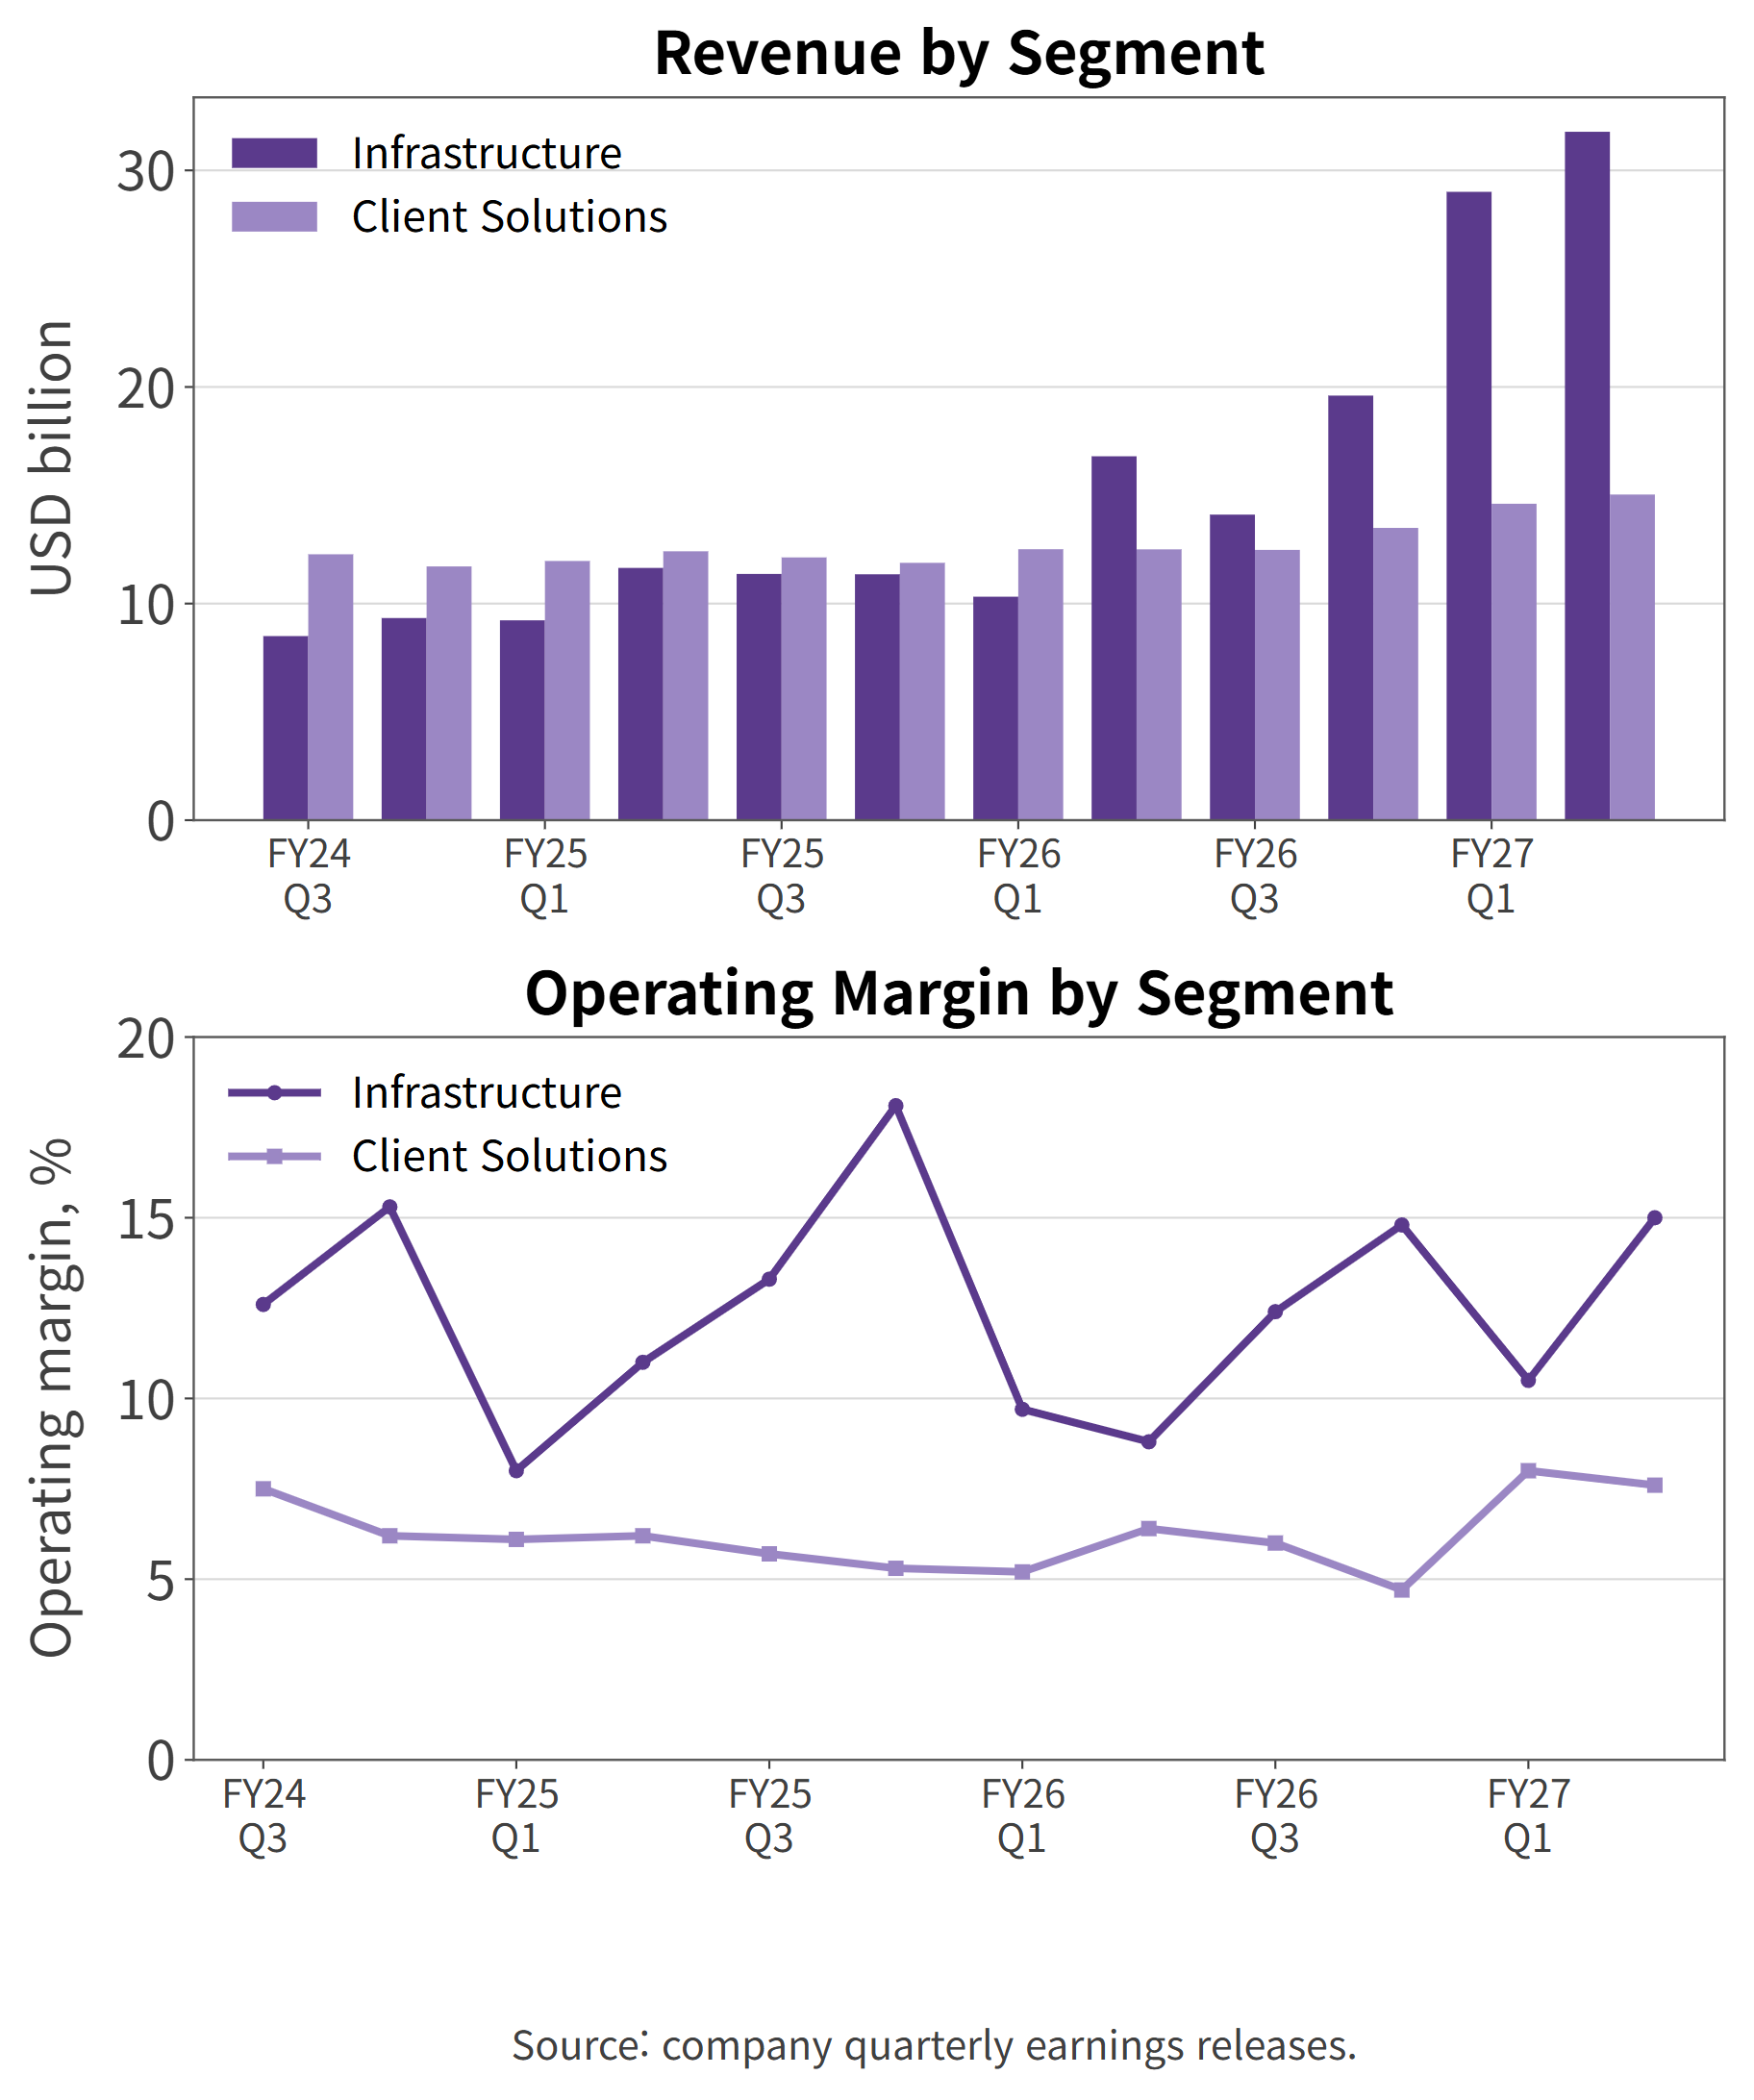
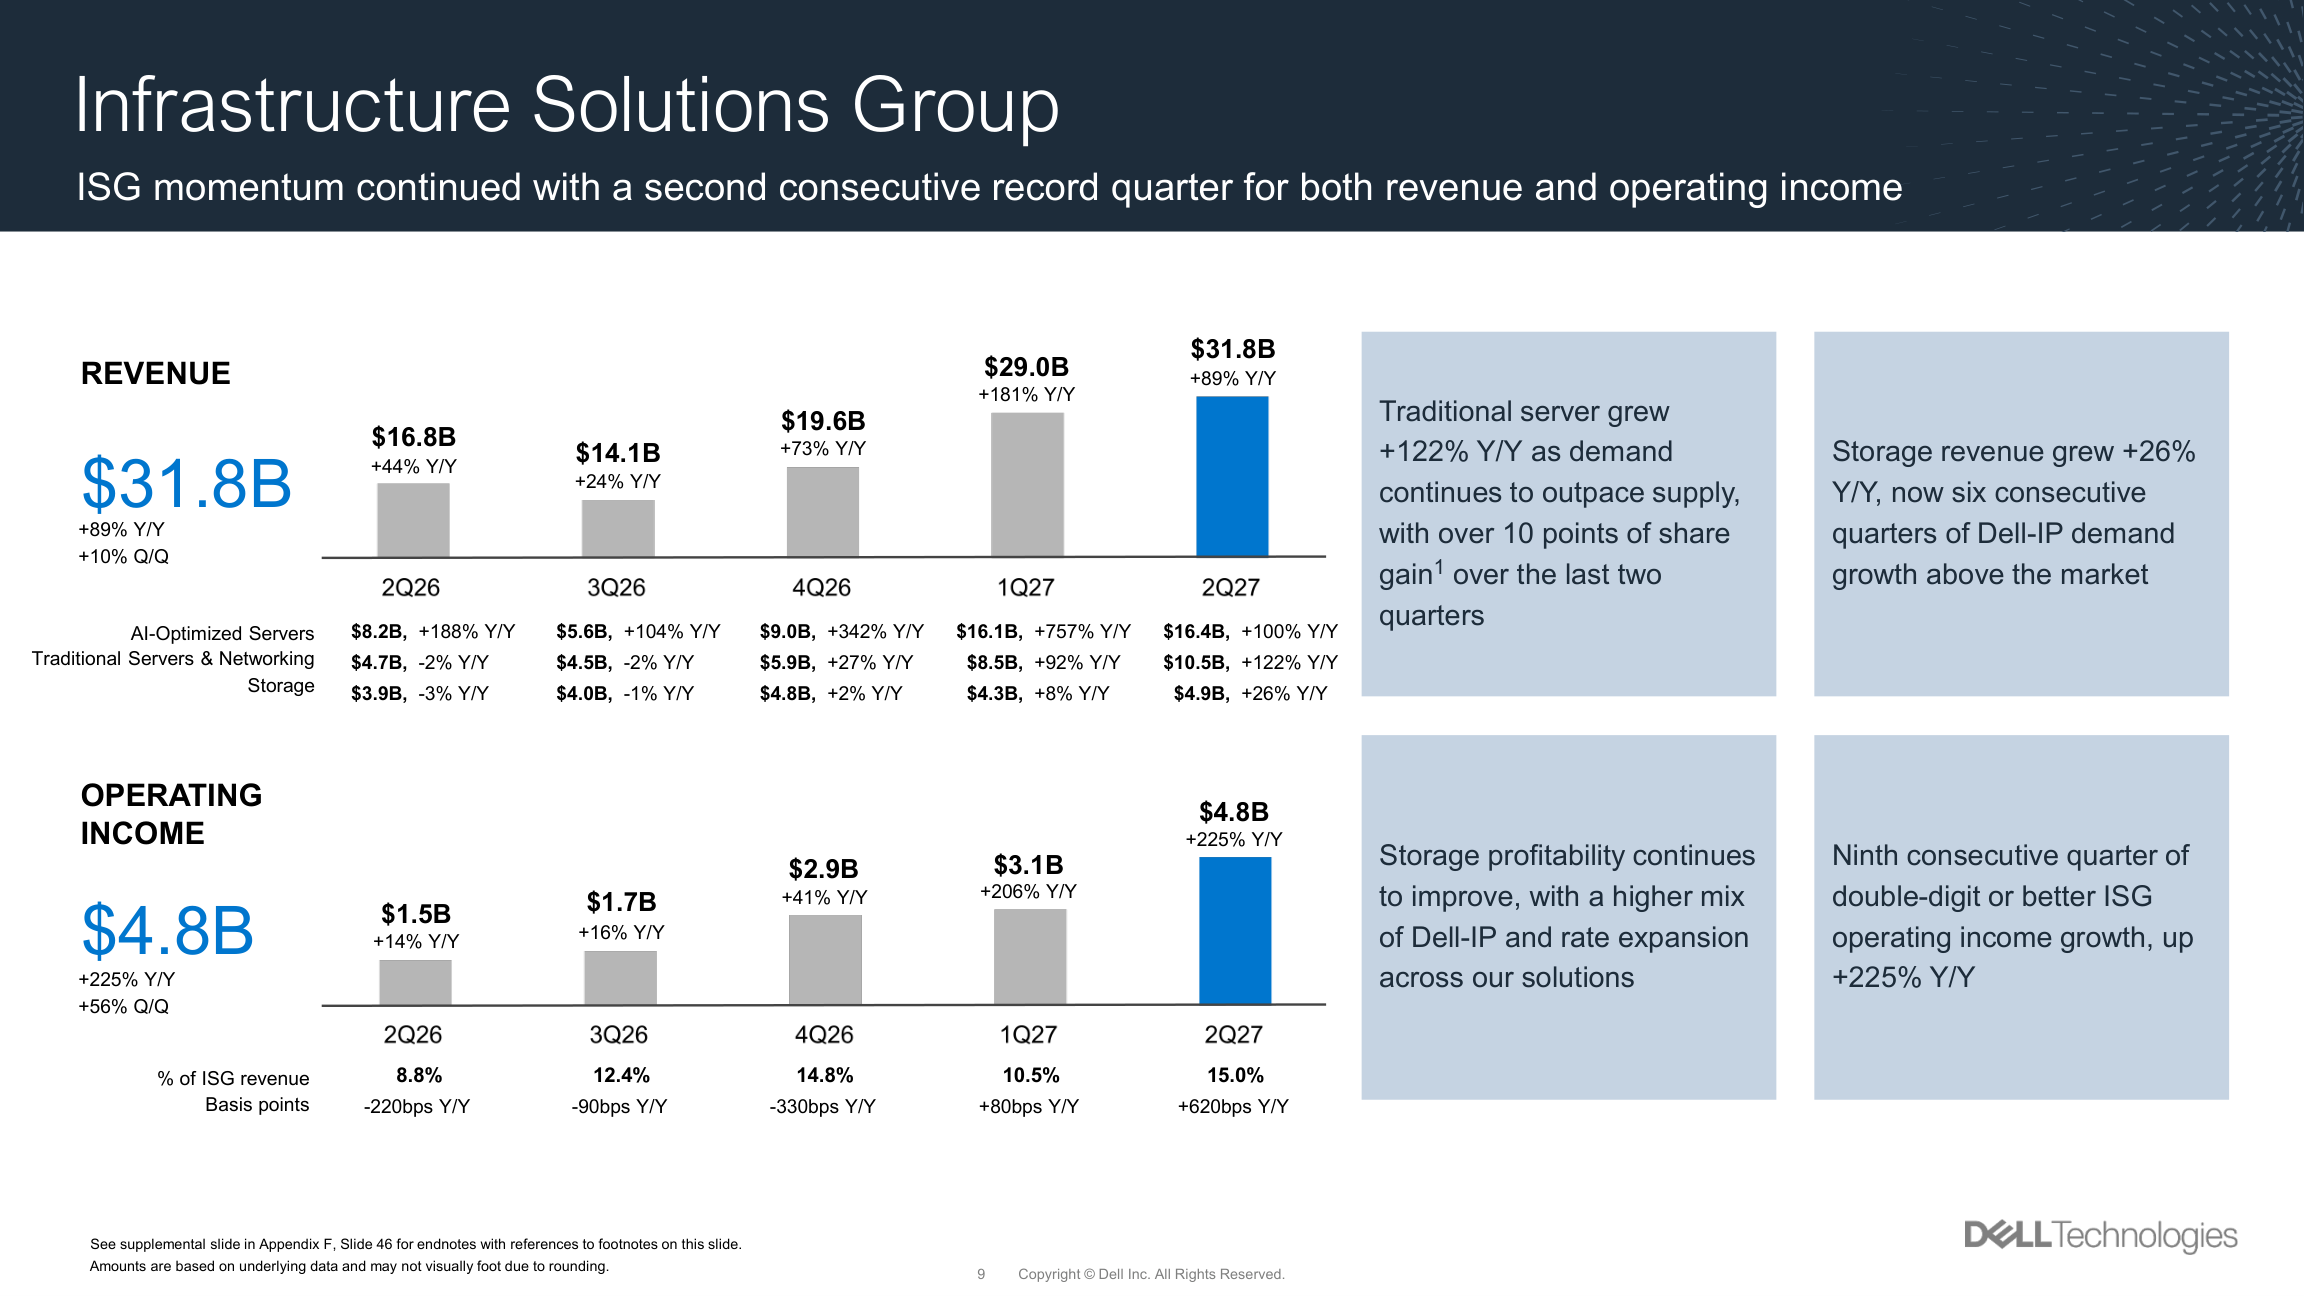
Two segments carry the business. Infrastructure Solutions, which sells servers, networking, and storage, posted $31.782 billion (+89%). Client Solutions, which sells PCs and workstations, posted $15.034 billion (+20%).
Inside infrastructure, the product lines split three ways. AI-optimized servers $16.401 billion (+100%), traditional servers and networking $10.531 billion (+122%), and storage $4.850 billion (+26%).
Revenue and operating margin by segment
Note which line grew fastest. Traditional servers outpaced AI servers, and the company's own performance review says why: "Traditional server grew +122% Y/Y as demand continues to outpace supply, with over 10 points of share gain over the last two quarters."
The order book is larger than the revenue line. Dell booked "a record $60.9 billion in orders, recognized a record $16.4 billion in revenue and exited the quarter with a record $95 billion backlog." Orders ran 3.7 times revenue, and the trailing-year order total reached $131.7 billion.
AI server orders, revenue, and ending backlog
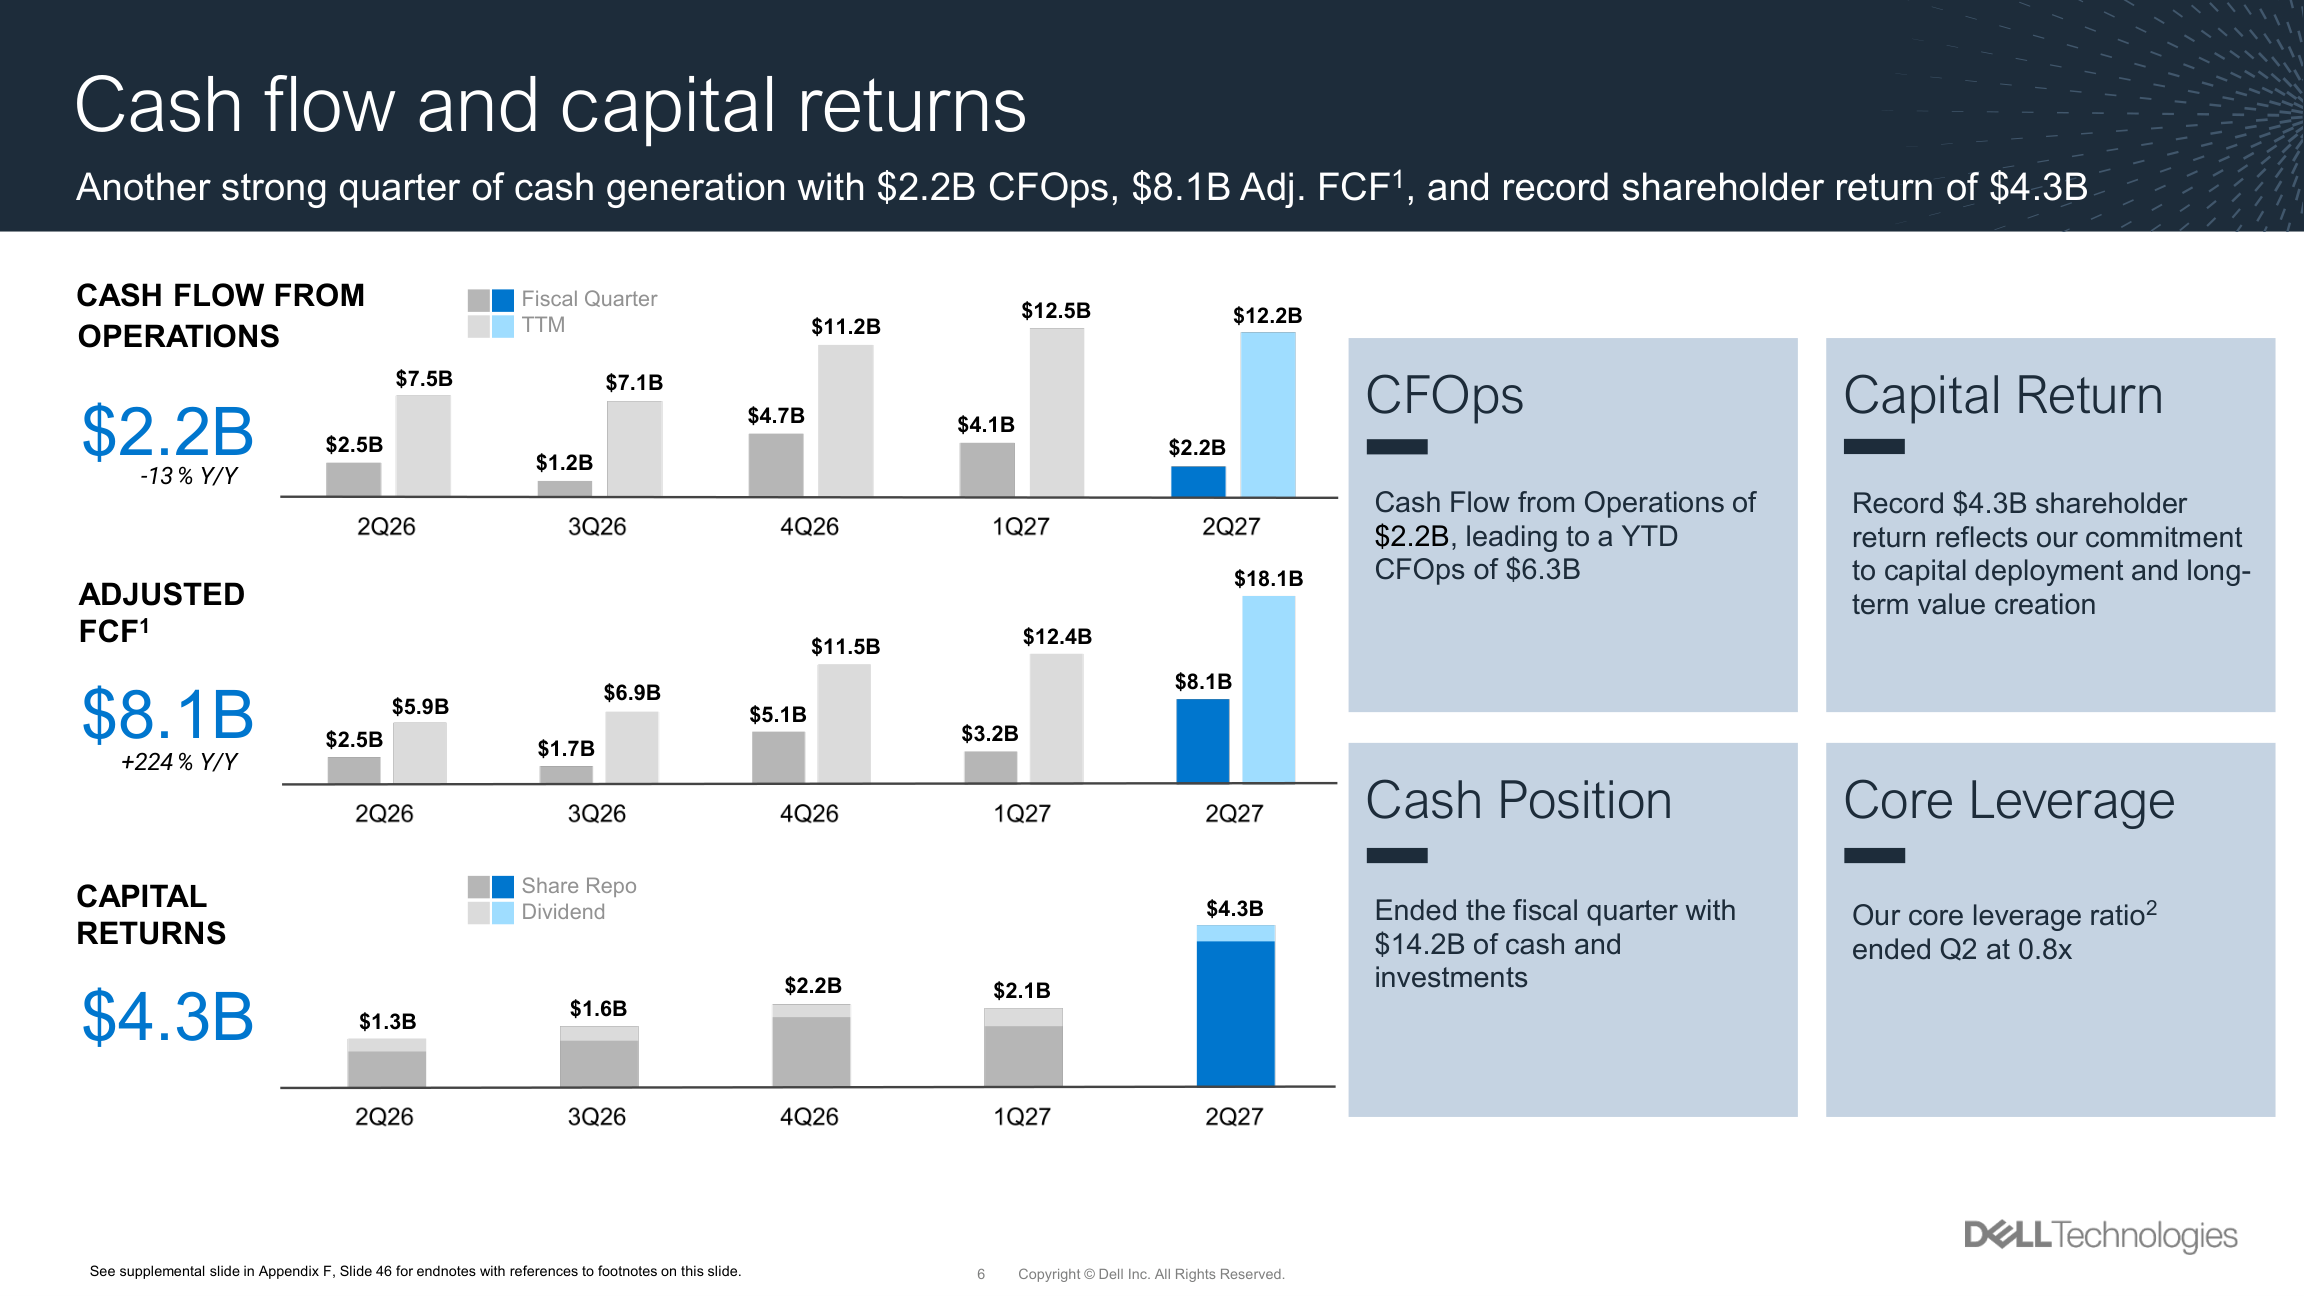
Cash is the other side. Operating cash flow was $2.225 billion, down -12.5% from $2.543 billion a year earlier, while the company's adjusted free cash flow measure came to $8.149 billion, up +224%. Shareholder returns hit a record $4.3 billion, and the board declared a dividend of $0.63 per share.
Dell quarterly earnings per share, GAAP and non-GAAP
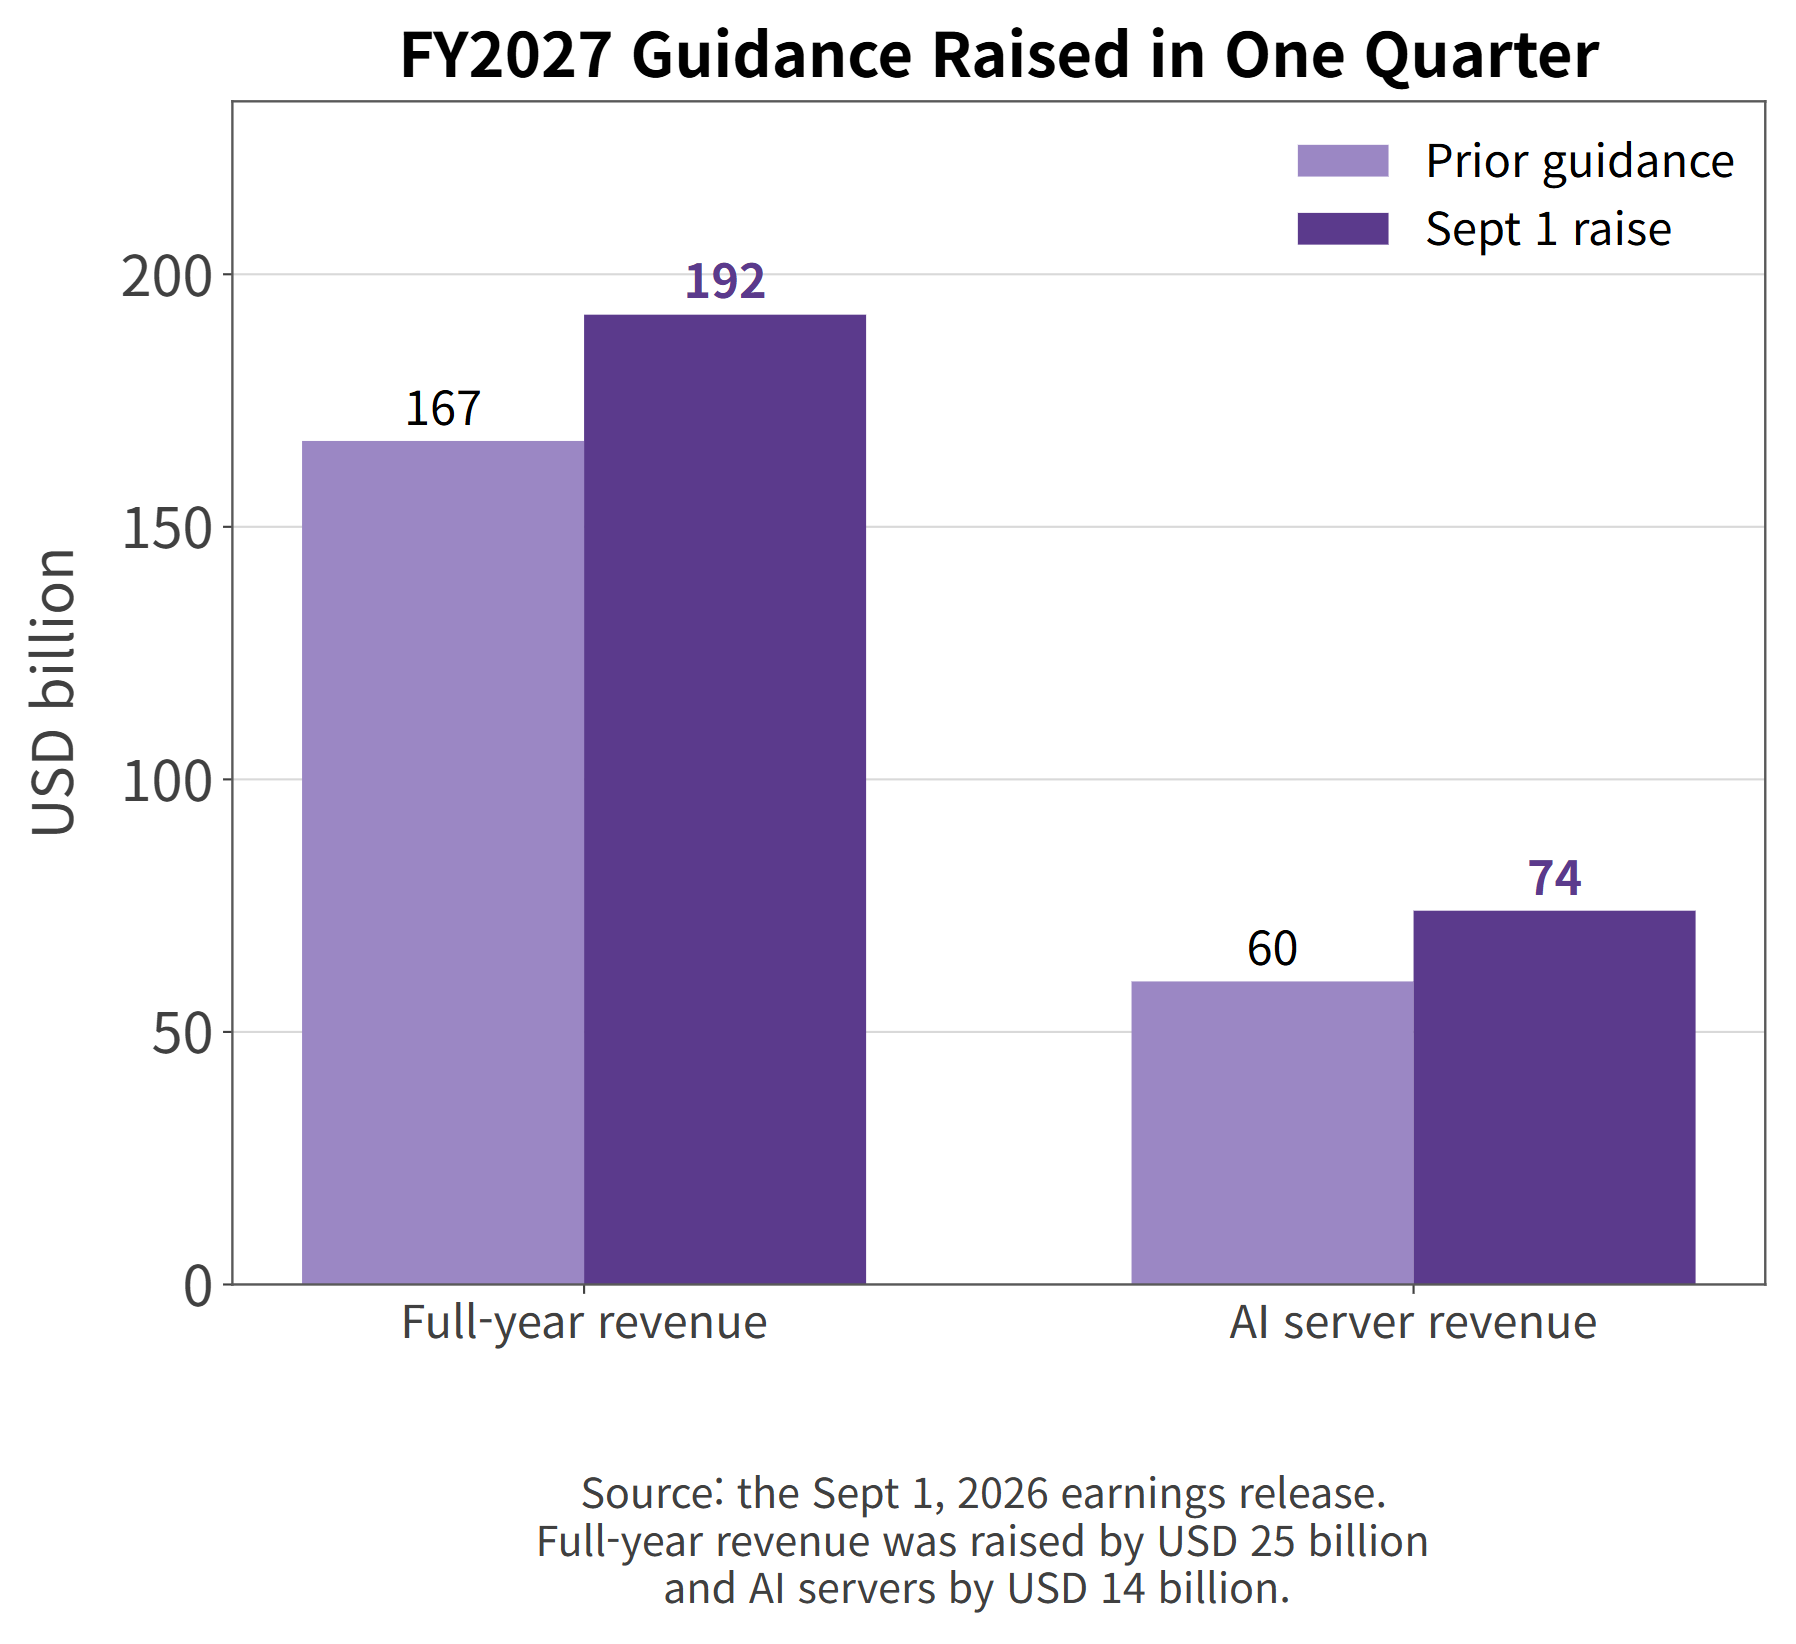
Why Dell Raised FY2027 Guidance by $25 Billion
Third-quarter guidance is revenue of $49.0 billion, plus or minus $500 million, and adjusted EPS of $6.50, plus or minus $0.10. Against last year that is roughly 80% revenue growth and 150% earnings growth.
FY2027 guidance raised in a single quarter
The full-year raise is the bigger number. Revenue goes from $167 billion to $192 billion, and adjusted EPS from $17.90 to $25.50. AI server revenue guidance moves from $60 billion to $74 billion, about three times last year's level. Companies this size do not lift a full-year outlook by 15% one quarter into the year.
Dell attached four assumptions to that outlook: infrastructure revenue growth of roughly +120%, traditional server growth a little over +100%, and mid-teens growth for both storage and Client Solutions.
FY2027 guidance and its assumptions (Source: company filing, Sept 1, 2026)
So the raise is almost entirely infrastructure, and inside infrastructure both AI and traditional servers are pushing. The $95 billion backlog sitting above a $74 billion full-year AI server target points the same way. The constraint on this business right now is delivery, not demand.
What Does Dell Technologies (DELL) Do?
Michael Dell started the company in a University of Texas dorm room in 1984. Headquarters are still in Round Rock, Texas. The company went private in 2013, returned to public markets in 2018, and spun off its software subsidiary VMware in 2021.
Trailing twelve-month revenue is $151.2 billion, which makes Dell one of the largest companies in the world that builds both data-center hardware and PCs.
The fiscal year ends in late January, so the quarter that ended July 31, 2026 is fiscal Q2 2027, and the company is just past the halfway point of the year.
That trip through private ownership and back matters later. The buyout debt and the buybacks that followed are why Dell's book equity is negative today.
Infrastructure and Client Solutions: Products and Buyers
Infrastructure Solutions sells the equipment that goes into a data center: accelerated servers for AI training and inference, general-purpose servers, networking gear, and storage arrays. The buyers are cloud providers, large enterprise IT departments, and government agencies.
Infrastructure Solutions Group results (Source: company filing, Sept 1, 2026)
Client Solutions sells PCs, workstations, and peripherals, split between commercial and consumer. This quarter commercial came in at $13.192 billion (+22%) and consumer at $1.842 billion (+7%). Corporate refresh demand is running about three times as fast as consumer.
There is a third piece outside the two segments. Dell Financial Services lends customers the money to buy the equipment, and that lending business is where the cash flow discussion below starts.
The revenue models differ too. Infrastructure sells hardware and then collects support and maintenance revenue for years afterward. Client Solutions is mostly done at the point of sale. So an infrastructure-heavy mix pulls a services tail along behind it.
Mix has shifted fast. Infrastructure is now 67.7% of revenue and Client Solutions 32.0%. A year ago the split was 56.4% and 42.0%. Operating margins ran 15.0% and 7.6% this quarter, a two-to-one gap.
Where Did the Incremental Profit Come From?
For two years the consensus view has been that AI servers carry thin margins. GPUs absorb most of the bill of materials, so whoever assembles the box keeps very little. The market prices it that way. Super Micro, the purest AI-server play in this group, grew revenue +77.8% and still trades at the lowest price-to-sales multiple in the peer set at 0.62x.
This quarter's arithmetic pushes back. Infrastructure revenue rose $14.982 billion, infrastructure operating income rose $3.311 billion, and the margin on that increase alone was 22.1% — more than double the 8.8% base.
The margin on the revenue increase versus the base margin
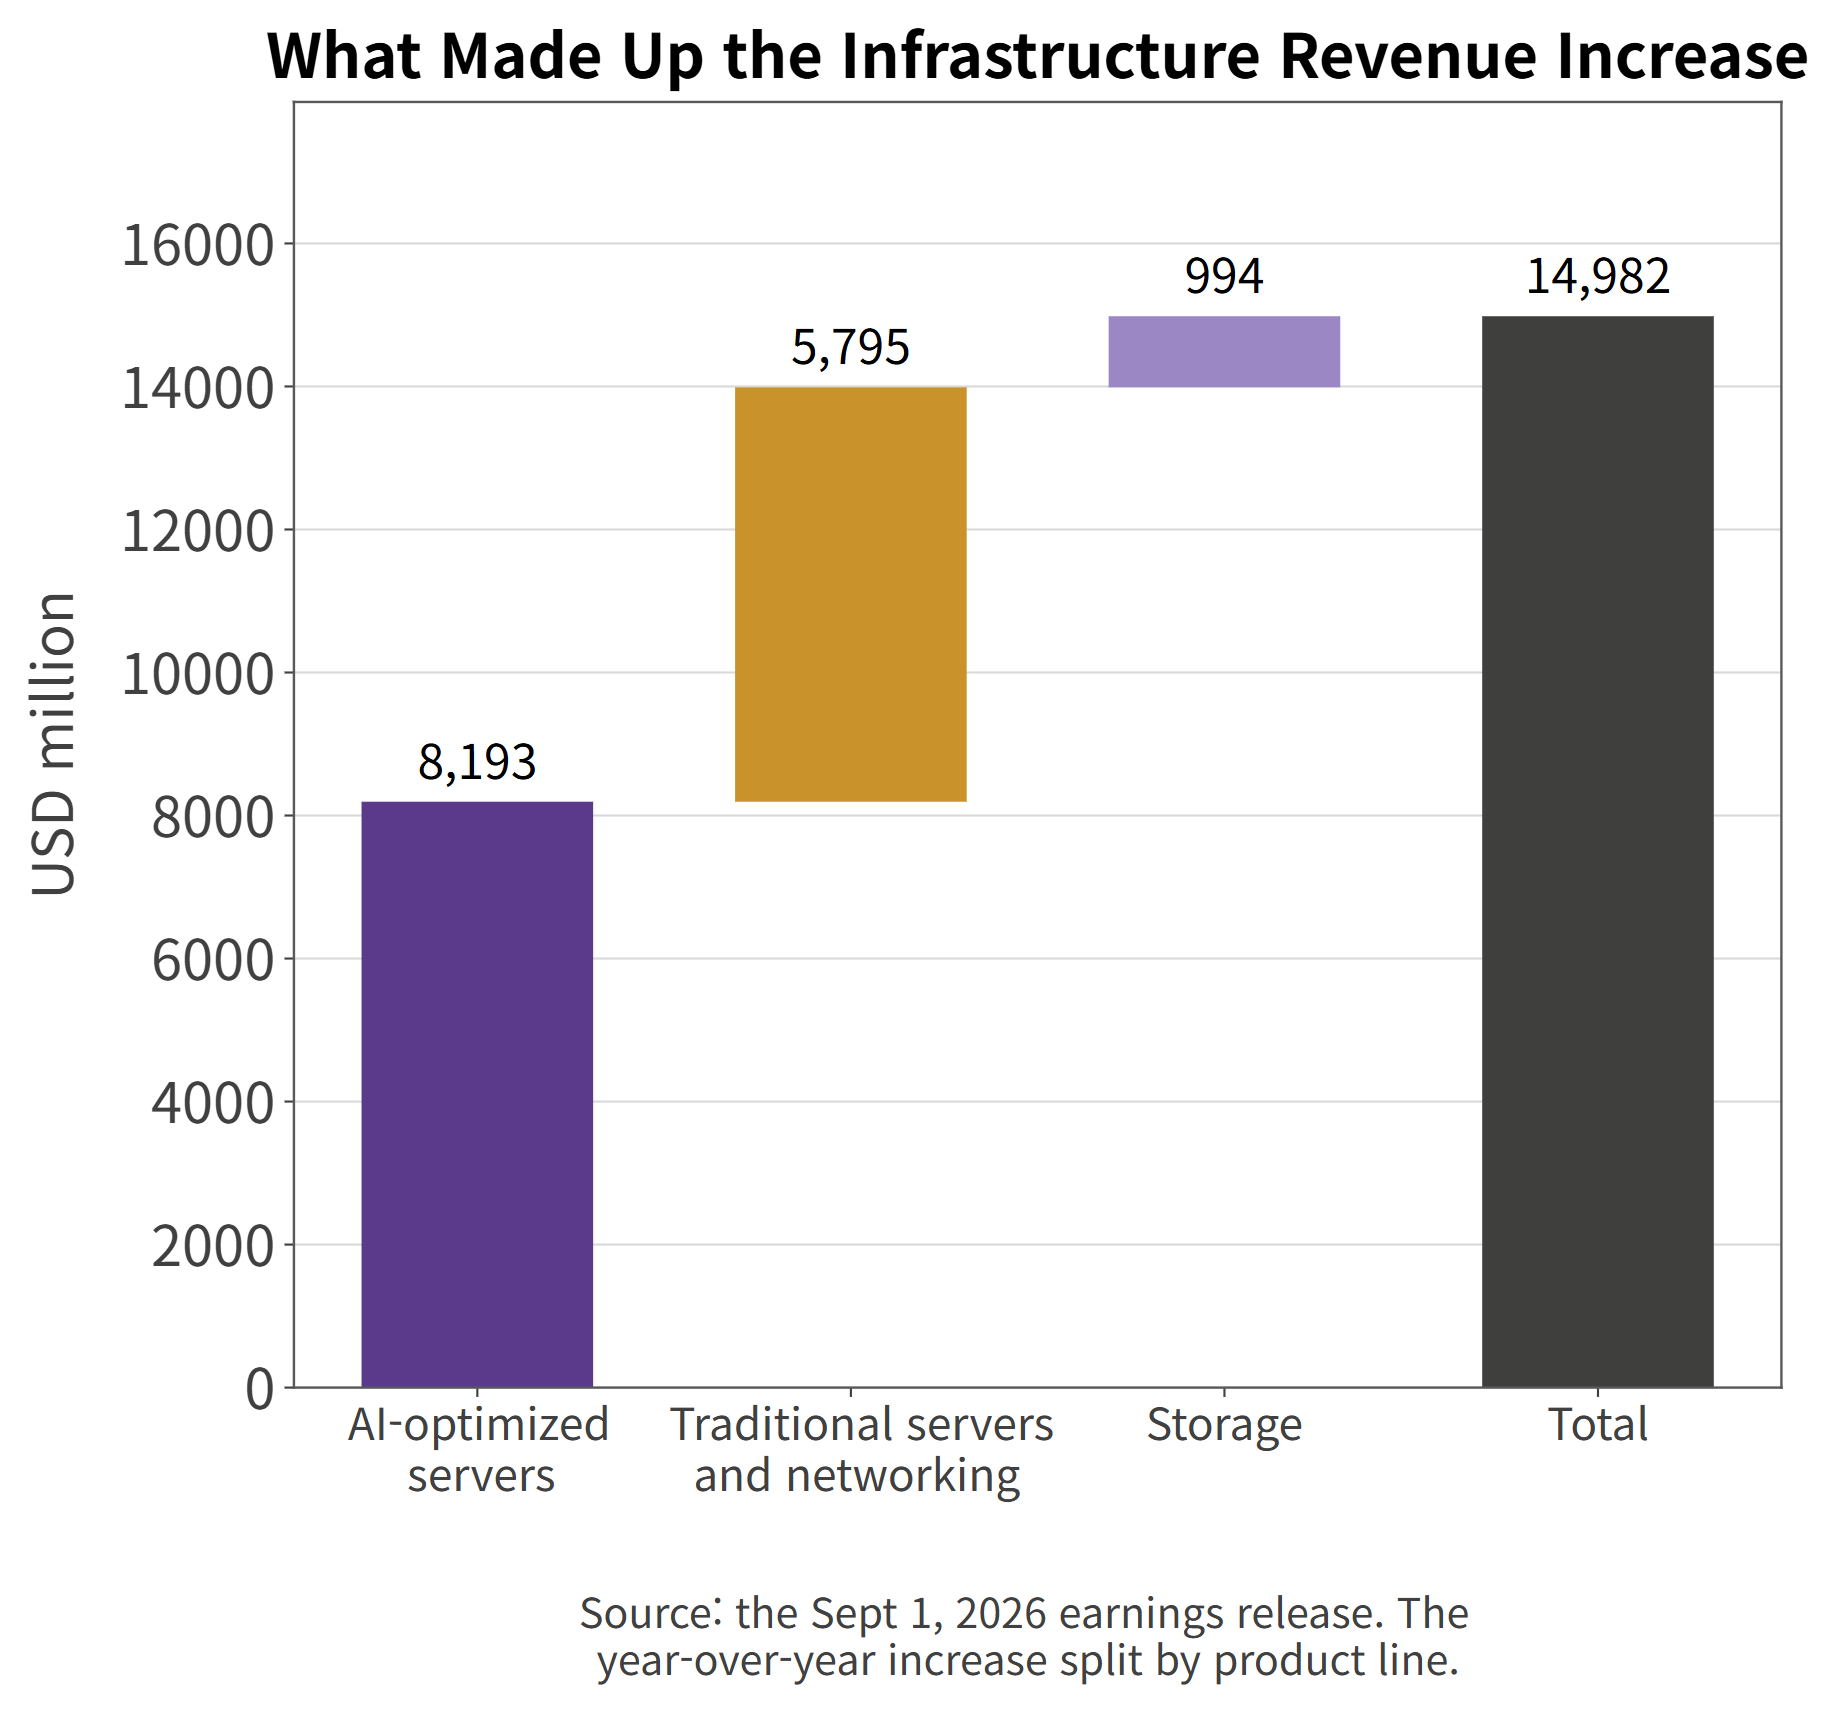
Split the increase by product line and you get AI-optimized servers $8.193 billion (54.7%), traditional servers and networking $5.795 billion (38.7%), and storage $0.994 billion (6.6%).
What made up the $14.982 billion infrastructure revenue increase
That creates a fork. If AI servers supplied more than half the increase and the blended incremental margin still came in at 22%, then either AI server margins are better than the consensus assumes, or the remaining 45% carried unusually good margins.
Dell does not settle it. The company reports operating income by segment, not by product line inside a segment. What it does say is that traditional servers grew faster than AI servers and that demand is outrunning supply. A product you cannot make enough of is not a product you discount.
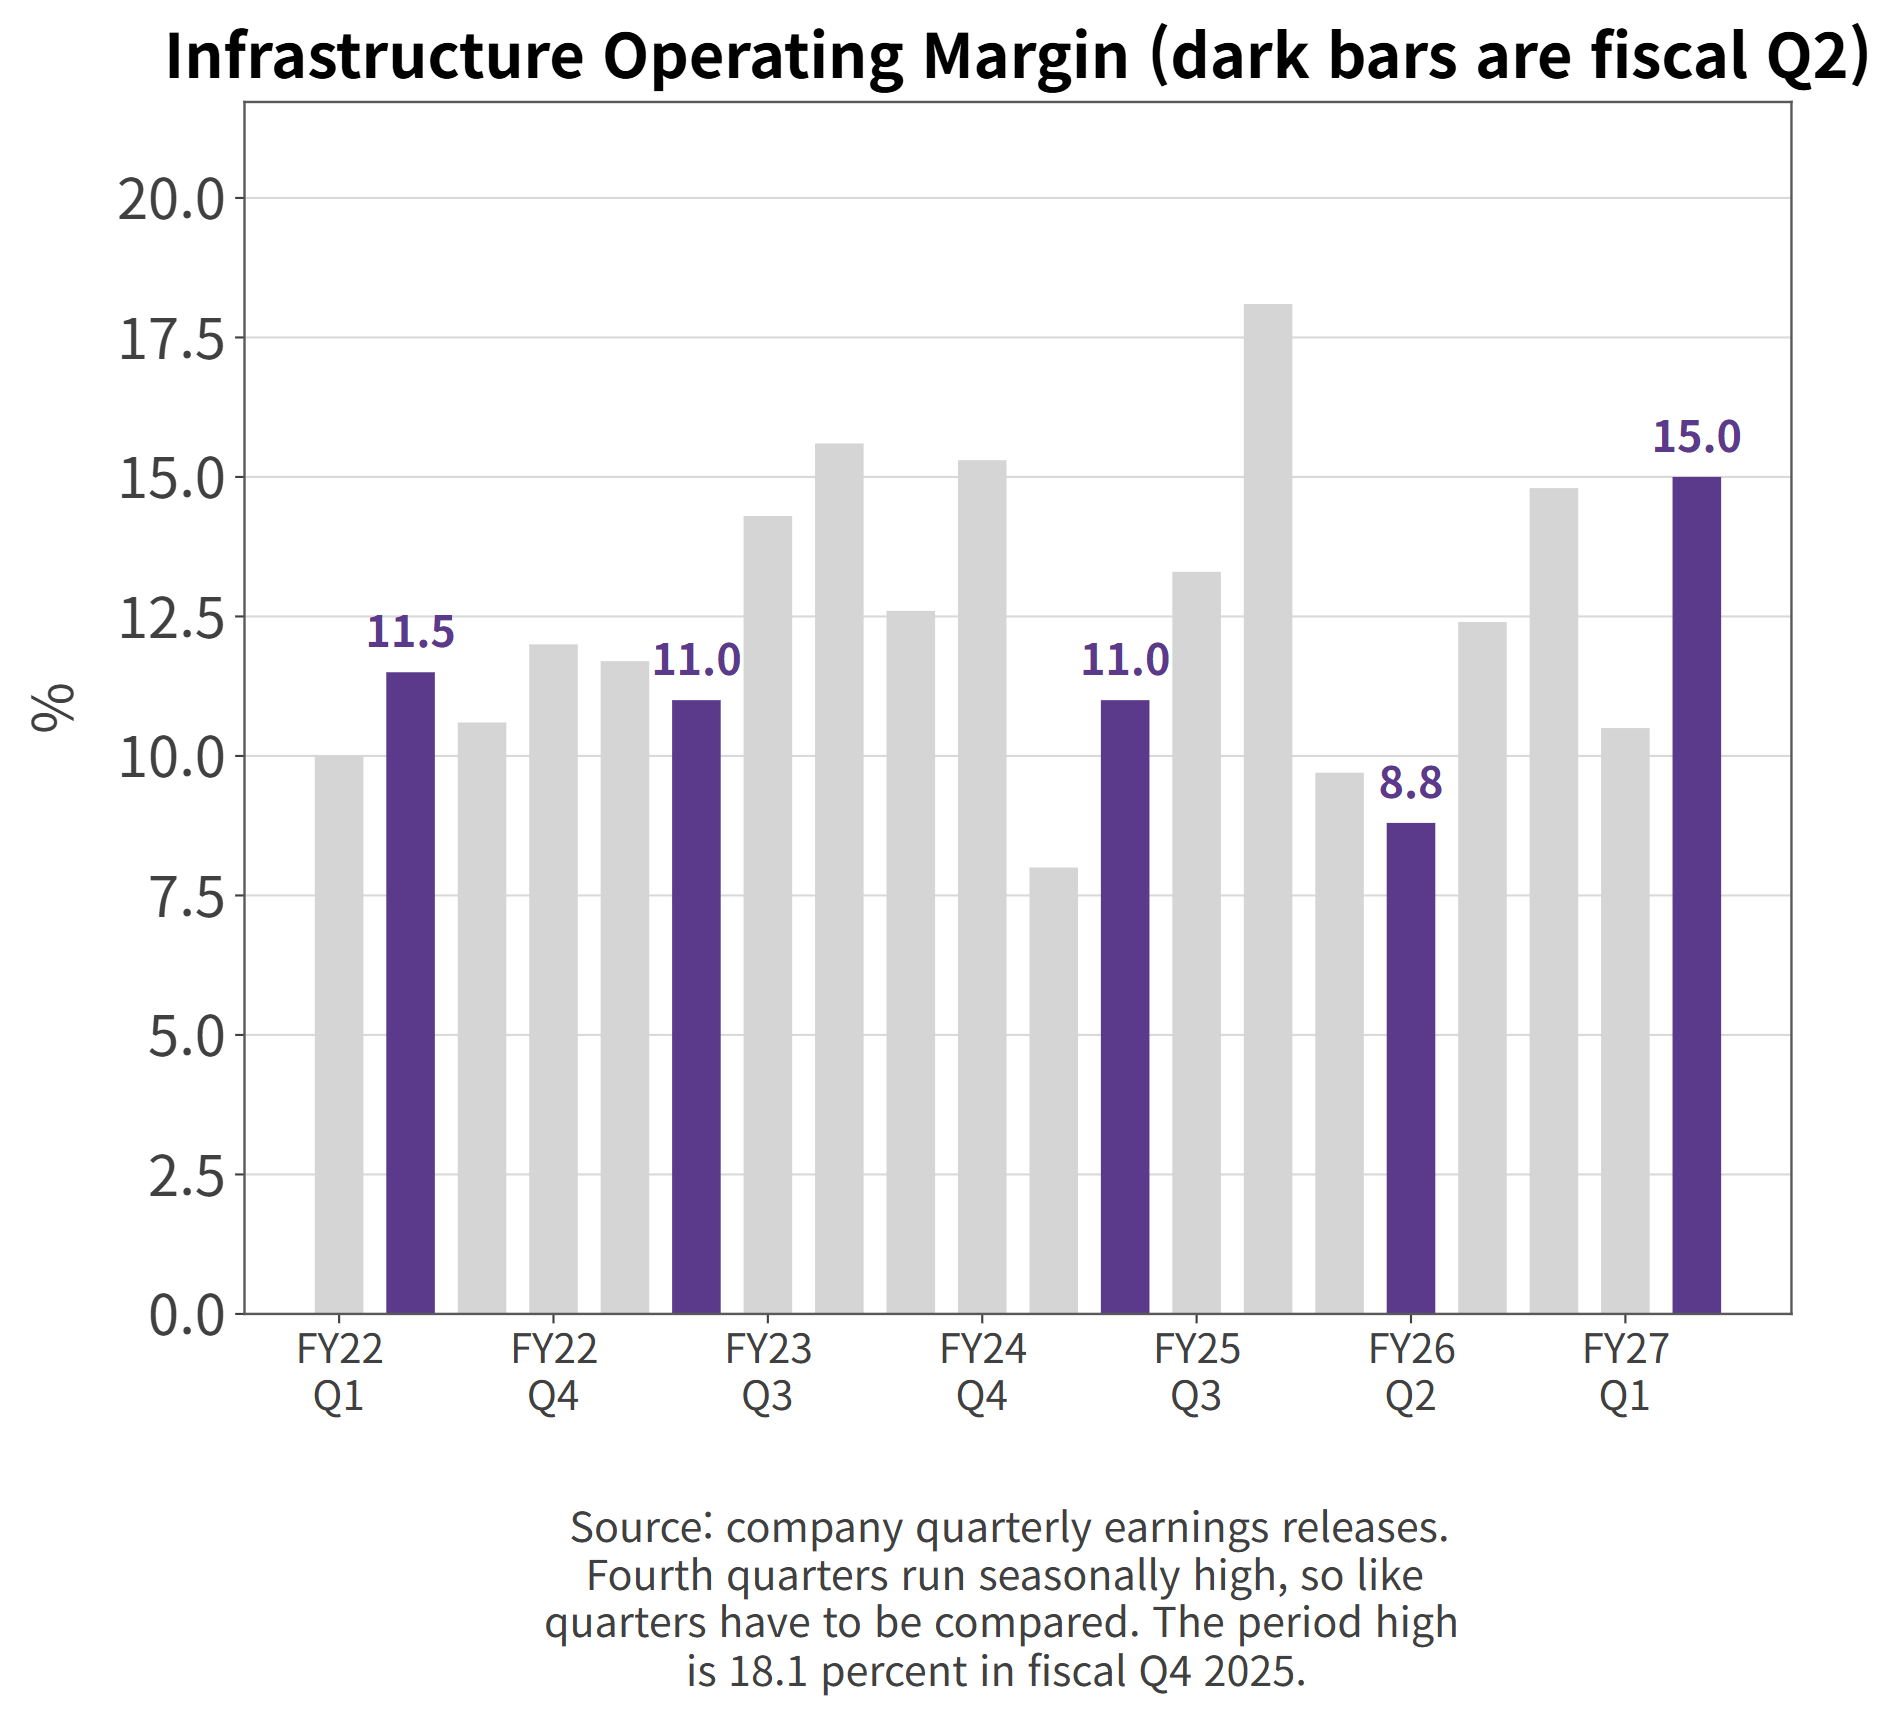
One caution before anyone calls 15.0% a record. It is not. Infrastructure margin hit 18.1% in fiscal Q4 2025 and 15.6% in fiscal Q4 2023, and this company runs seasonally strong fourth quarters. Compared against other second quarters, 8.8% to 15.0% is the best reading since fiscal 2022 — which is the honest version of the claim.
Infrastructure operating margin, second quarters highlighted
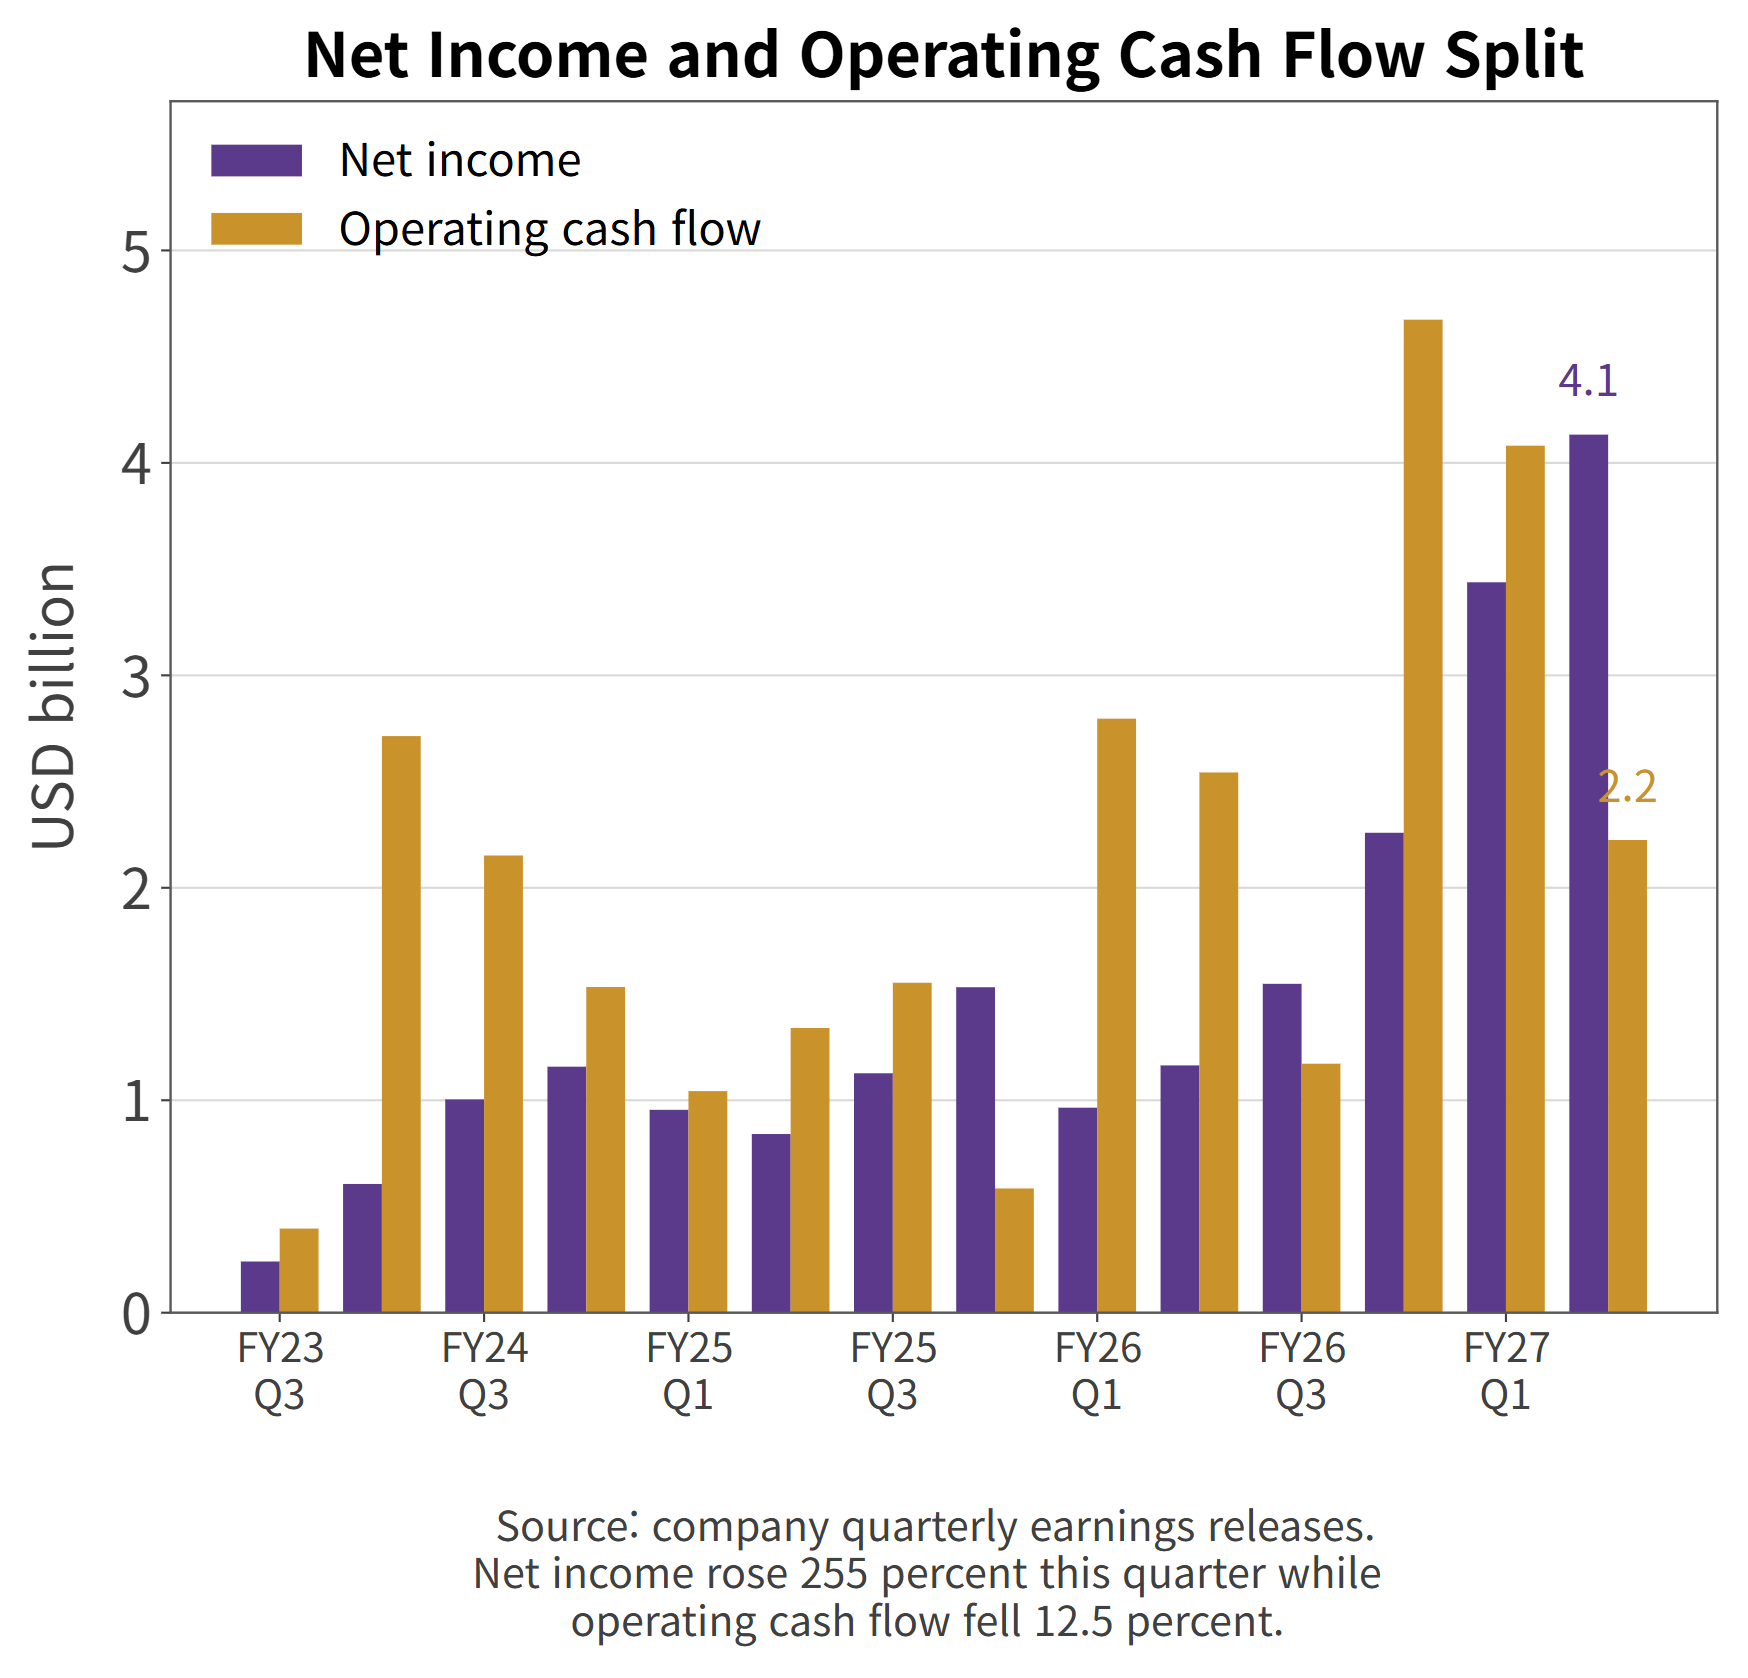
Net Income Rose 255% While Cash Flow Fell
Net income grew +255% in a quarter when operating cash flow fell -12.5%, from $2.543 billion to $2.225 billion.
The company's own adjusted free cash flow measure runs the other way, at $8.149 billion and up +224%. Same quarter, one measure down and the other more than tripled.
Net income and operating cash flow moved in opposite directions
The gap is definitional. Adjusted free cash flow strips out items tied to the financing business, and Dell leases a meaningful amount of equipment to its own customers, so removing those flows changes the picture.
Set the definitions aside and one fact remains. Turning a $95 billion backlog into revenue means buying components and building inventory first. Working capital absorbing cash while revenue grows 58% and backlog sets records is not a surprise.
Cash flow and shareholder returns (Source: company filing, Sept 1, 2026)
That narrows the thing to watch. When revenue climbs to the guided $49.0 billion next quarter, does operating cash flow come back with it? The quality of this growth gets settled there, not in the margin line.
AI Server Market Outlook and Demand Drivers
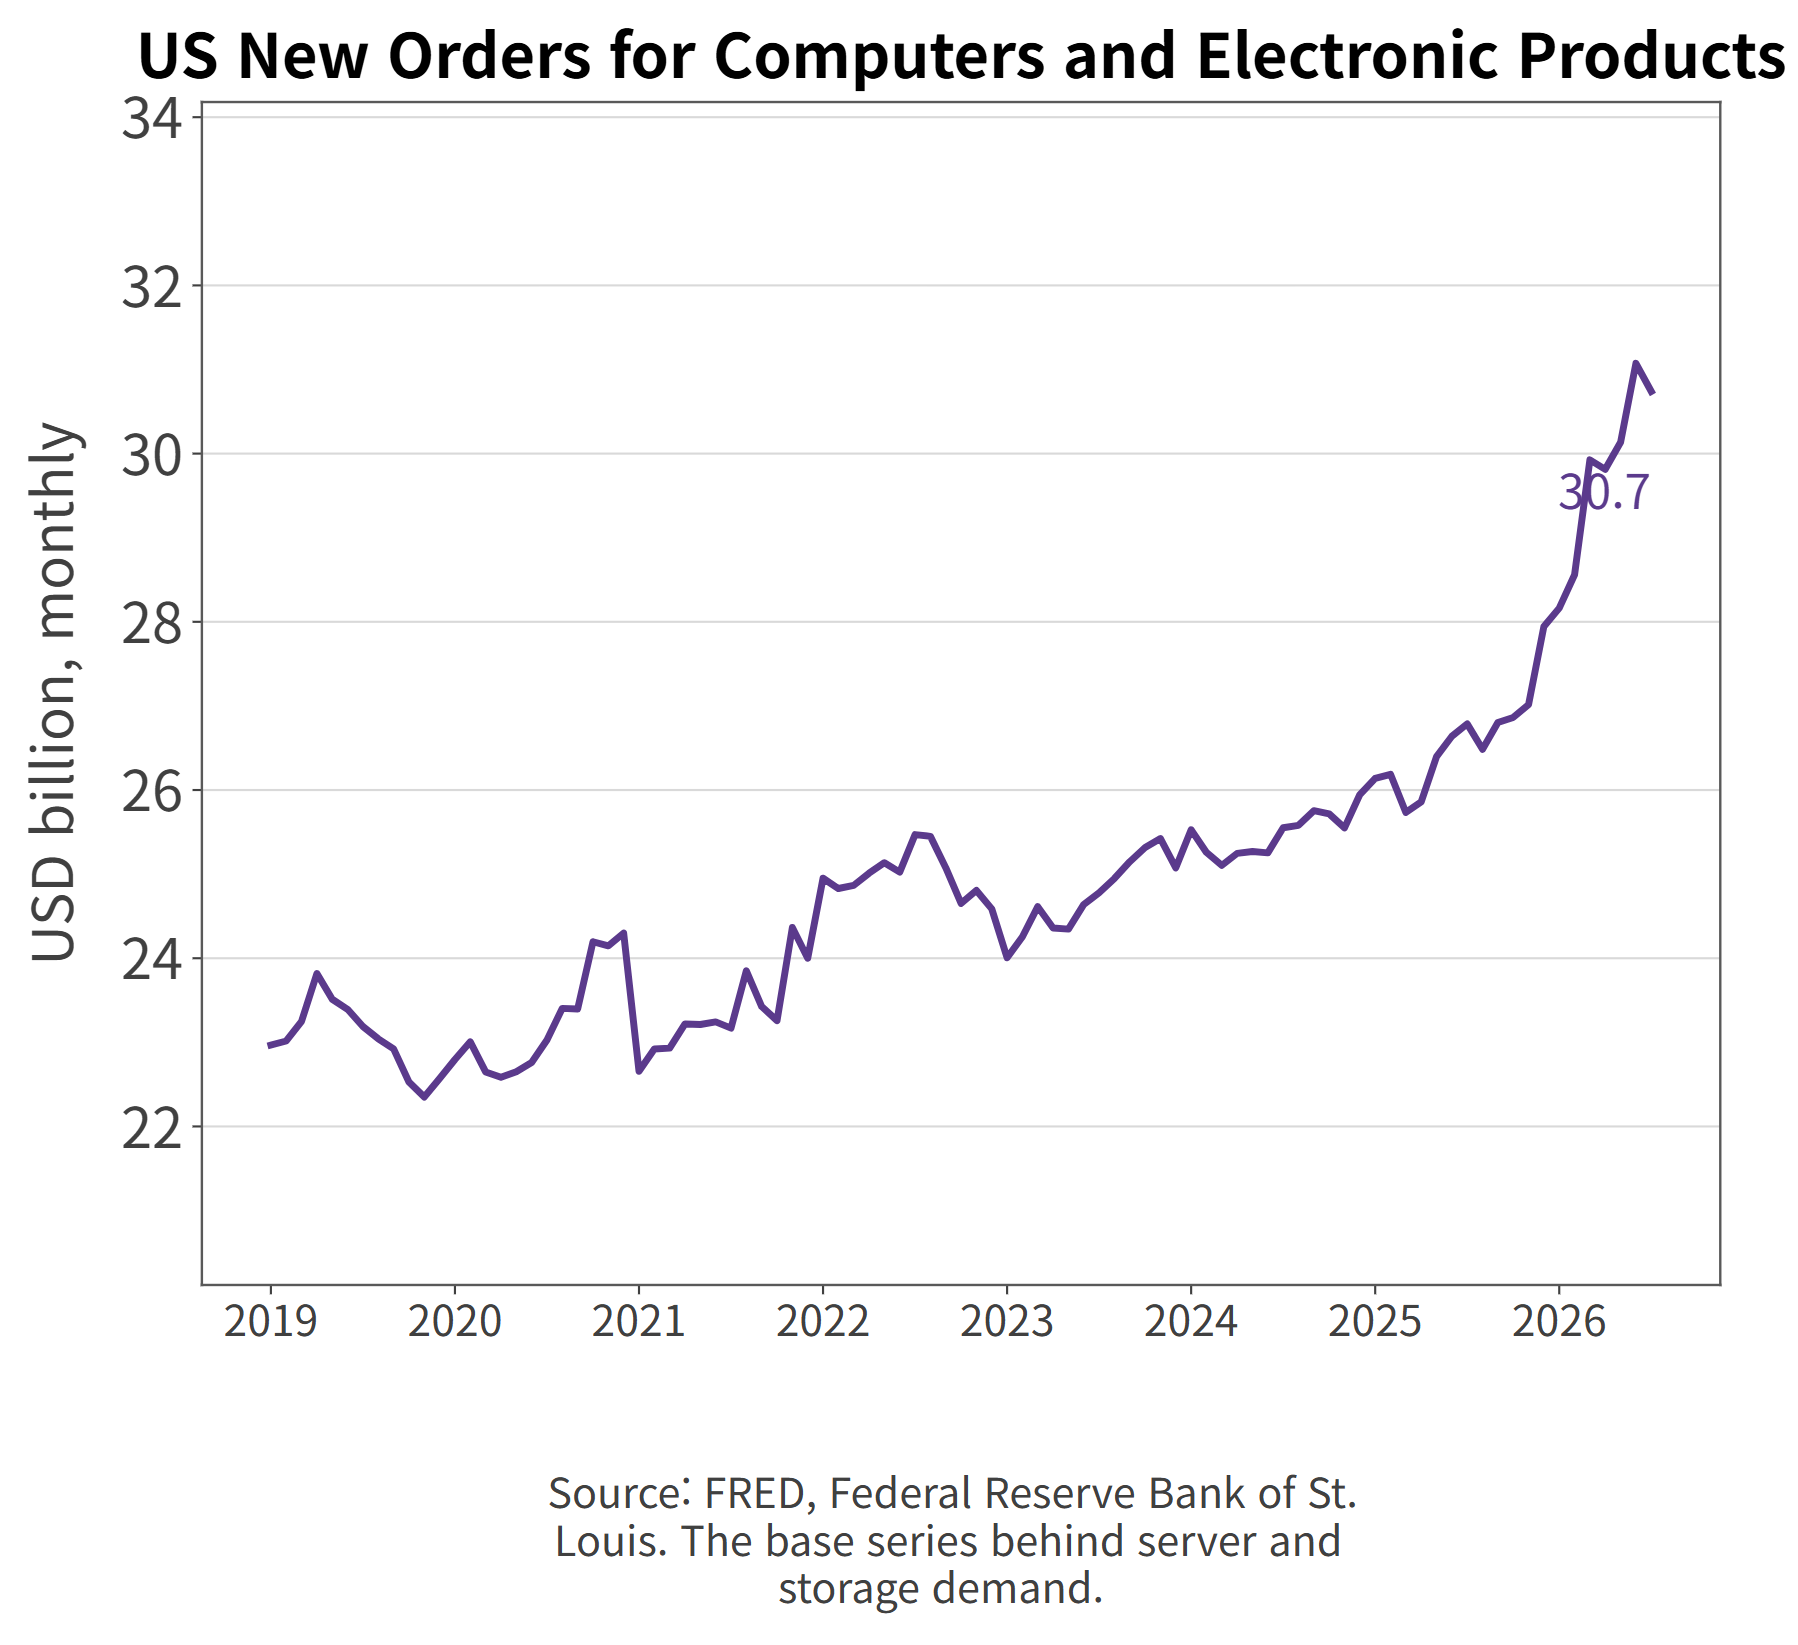
The size of this end market shows up in what businesses order. New orders for computers and electronic products in US manufacturing ran $30.739 billion in July 2026, a series that has drifted upward since 2019.
US new orders for computers and electronic products
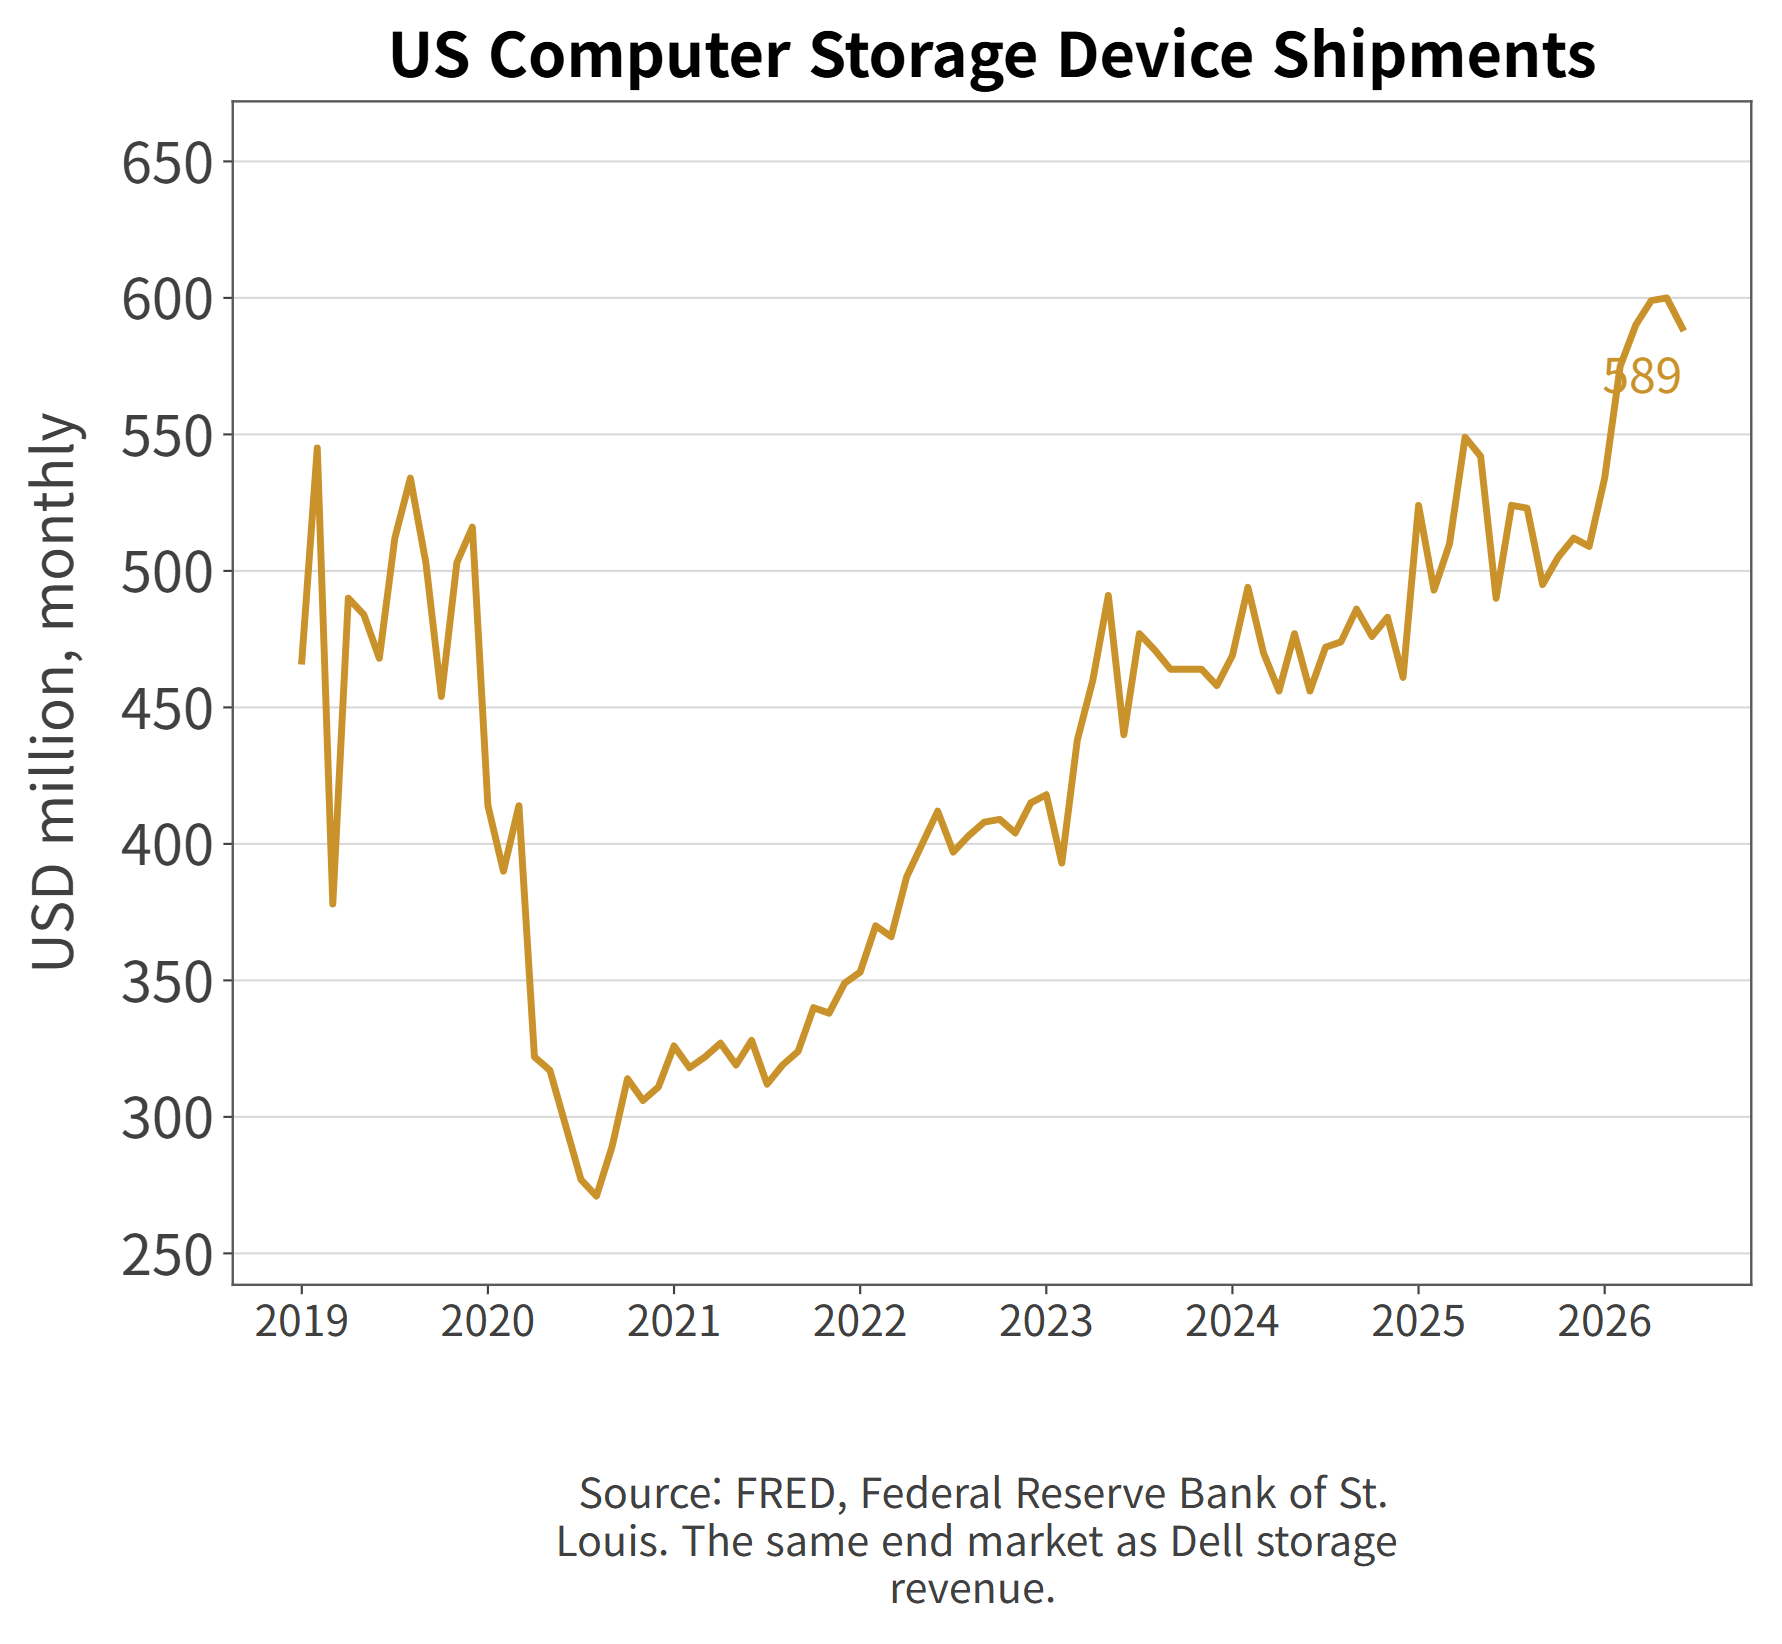
Storage tells a different story. US computer storage device shipments were $589 million in June 2026, roughly flat across recent years. Dell's storage revenue growing +26% is therefore a share story, not a market-growth story — and the company frames it that way, calling it "six consecutive quarters of Dell-IP demand growth above the market."
US computer storage device shipments
The shape of demand matters as much as the size. AI server orders concentrate in a handful of buyers, with cloud providers and large AI labs committing billions at a time. Dell's $60.9 billion of quarterly orders against $16.4 billion of quarterly revenue is what that concentration looks like on a financial statement.
In a market like that, backlog leads revenue. The $95 billion figure exceeds the full-year AI server guidance of $74 billion, and Dell describes a pipeline that runs several times the backlog on top of it.
AI server demand and backlog (Source: company filing, Sept 1, 2026)
The same concentration is the risk. When orders sit with a few buyers, a change in those buyers' capital plans moves the backlog too. Component supply, especially accelerators and memory, sets the delivery schedule from the other direction.
That supply point cuts into margins as well. Accelerators and memory dominate server bill-of-materials cost, so when component prices rise the seller either raises prices or gives up margin. Holding margin this quarter means Dell has so far been able to choose the first.
DELL Valuation vs. HPE, Super Micro, HP and NetApp
Four listed companies compete for the same budgets: Hewlett Packard Enterprise in servers and storage, Super Micro in AI server assembly, HP Inc. in PCs, and NetApp in storage.
Metric
Dell
HPE
Super Micro
HP Inc.
NetApp
Market cap ($B)
274.6
67.4
24.1
28.2
35.9
Revenue, TTM ($B)
151.2
38.8
39.1
59.2
6.9
Revenue growth
+49.0%
+22.6%
+77.8%
+8.1%
+5.4%
Net margin
7.5%
3.7%
5.6%
4.1%
18.5%
Price-to-earnings
24.8x
47.5x
11.3x
11.9x
28.8x
Forward P/E
15.6x
13.0x
8.5x
10.5x
20.3x
Price-to-sales
1.82x
1.74x
0.62x
0.48x
5.19x
Source: aggregated market data as of September 1, 2026
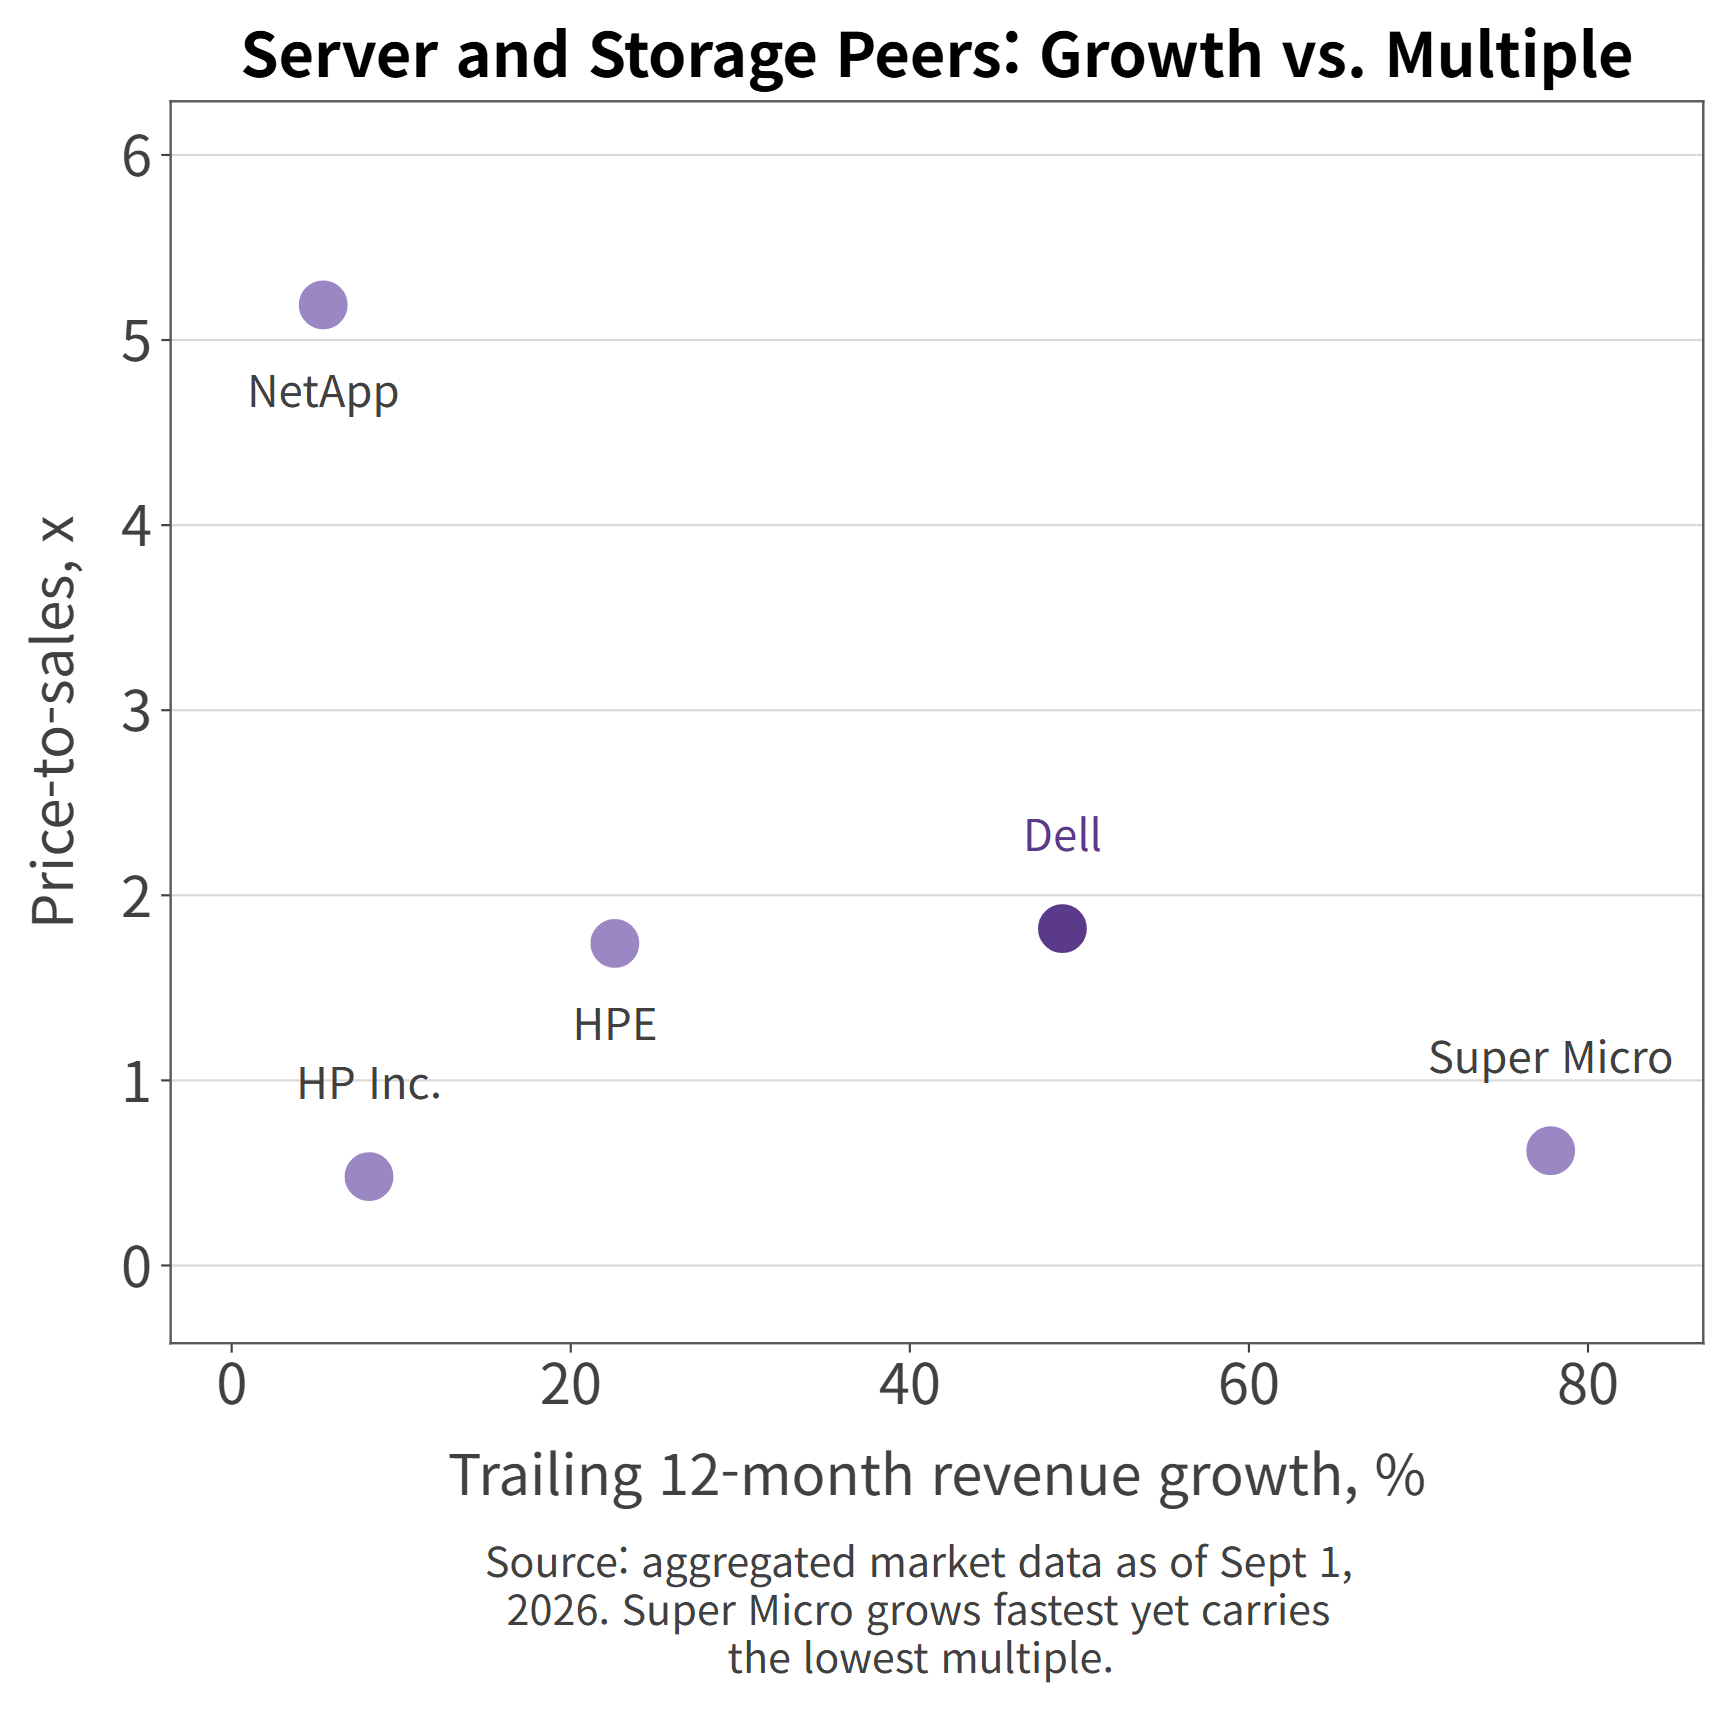
Growth and multiples move in opposite directions here. Super Micro grows fastest and carries the lowest price-to-sales ratio; NetApp grows slowest and carries the highest.
Server and storage peers: revenue growth versus price-to-sales
Margin explains it. NetApp's 18.5% net margin is far above the group, and Super Micro's is 5.6%. The market is paying for what the revenue keeps, not for how much of it there is.
There is a second thing in the table. The distance between current and forward multiples is wide across the group — Dell 24.8x to 15.6x, Super Micro 11.3x to 8.5x — which says the market expects earnings to keep climbing at all five. The size of that gap describes the sector's temperature better than the absolute multiples do.
One competitor is not in the table. The largest cloud providers design their own servers and have them built to order, and none of that volume shows up as Dell revenue. As the AI server market grows, so does that share.
Is Dell Stock Expensive? Two Bands, Two Answers
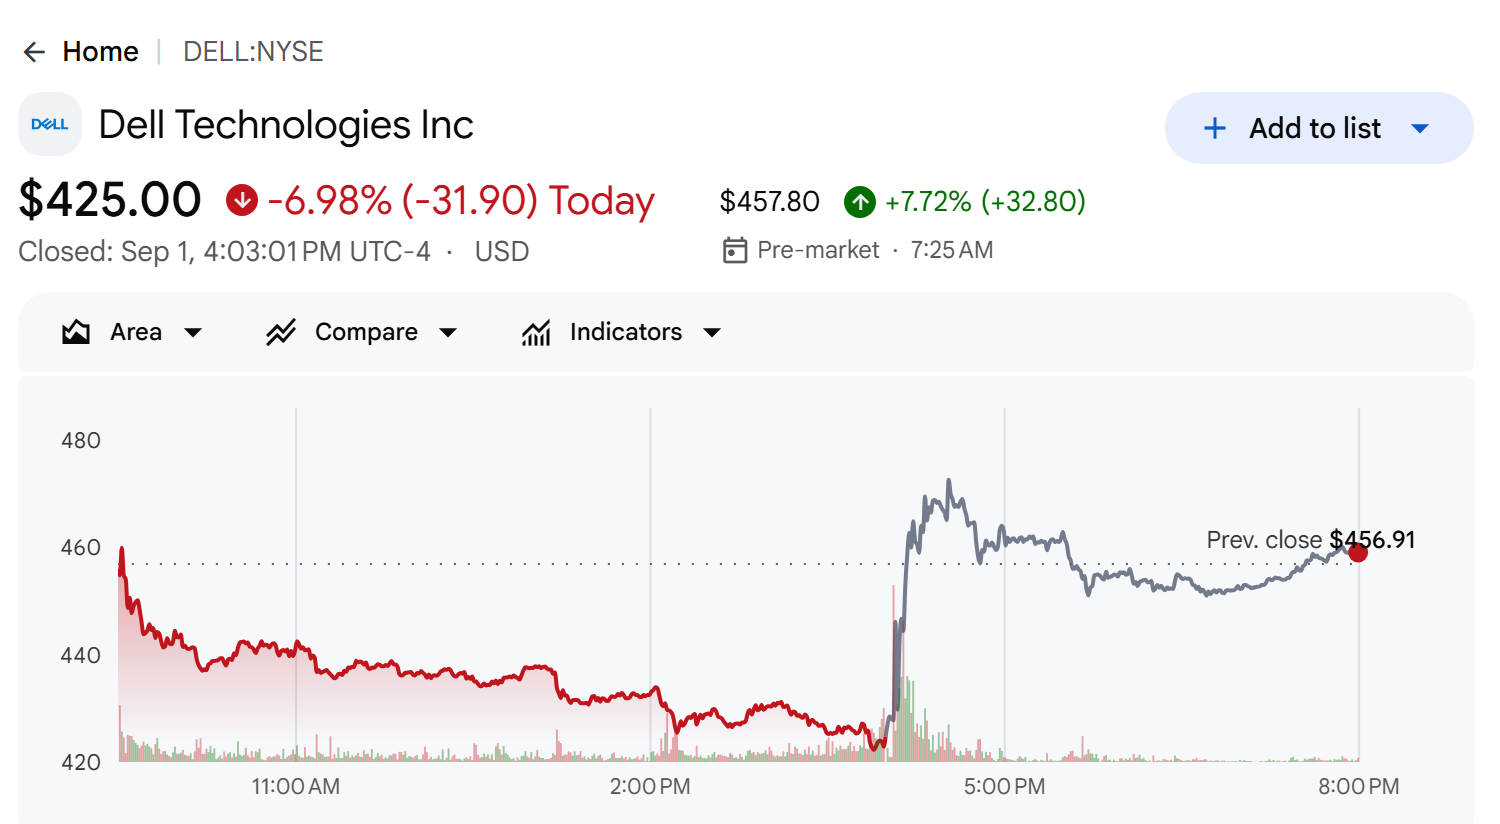
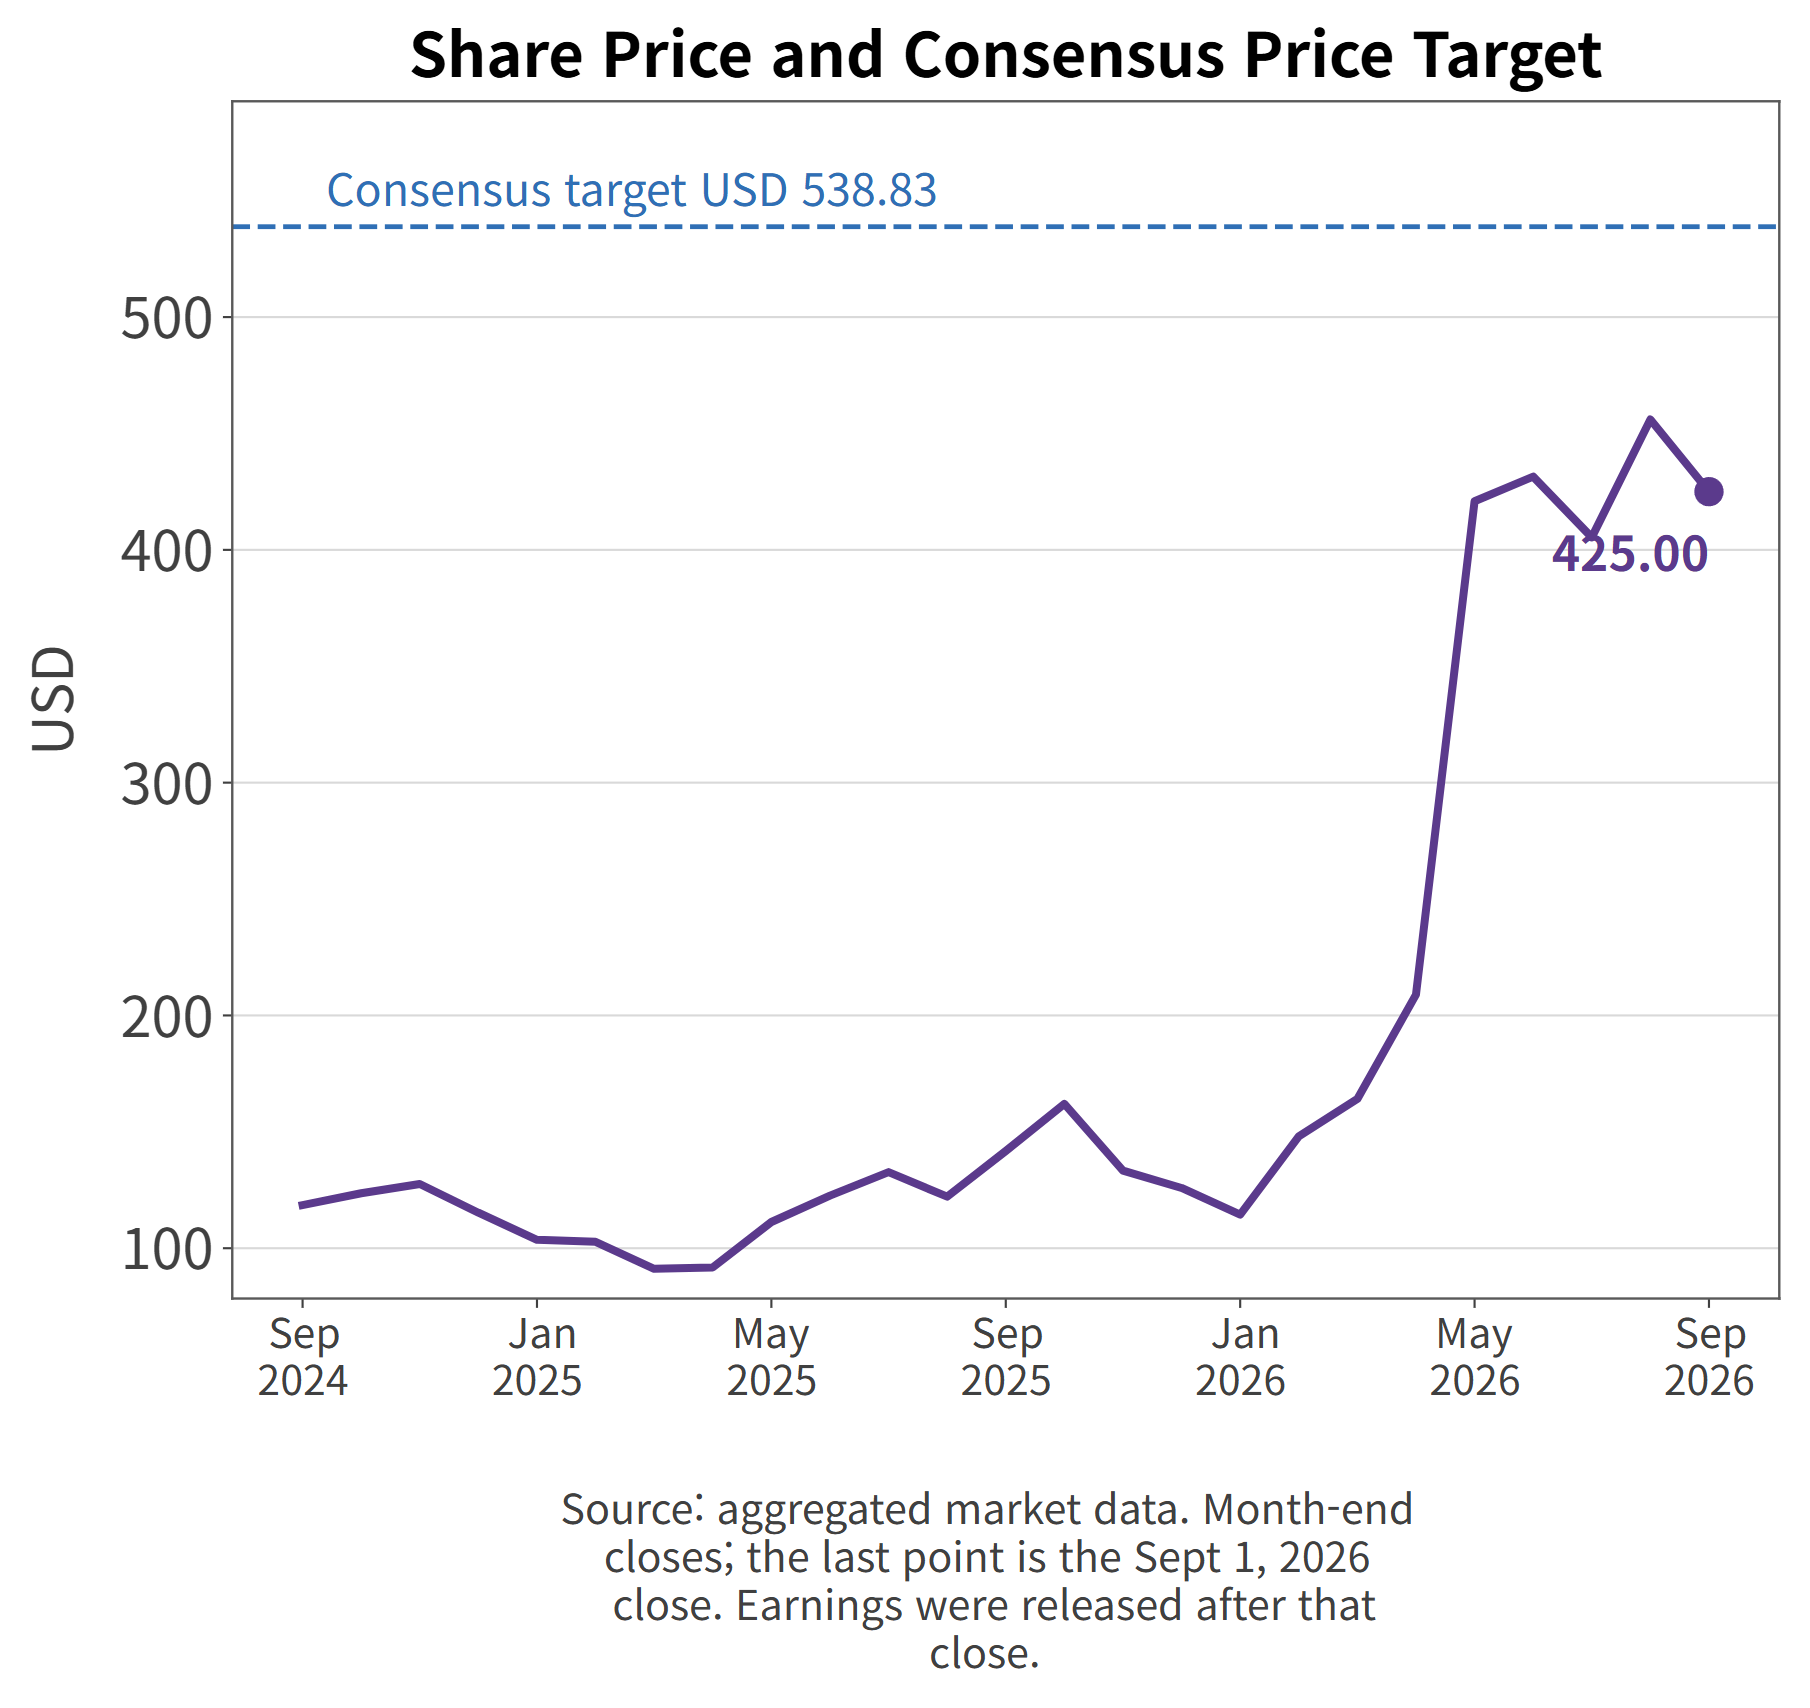
At the September 1, 2026 close of $425.00 the market capitalization is $274.61 billion. Earnings landed after that close, so this price does not contain them. In Wednesday's pre-market the stock traded at $457.80, up +7.72%.
Only two of the three usual bands can be built. Price-to-book does not exist here: the buyout of 2013 and the buybacks since have left stockholders equity negative, most recently at -$1.404 billion.
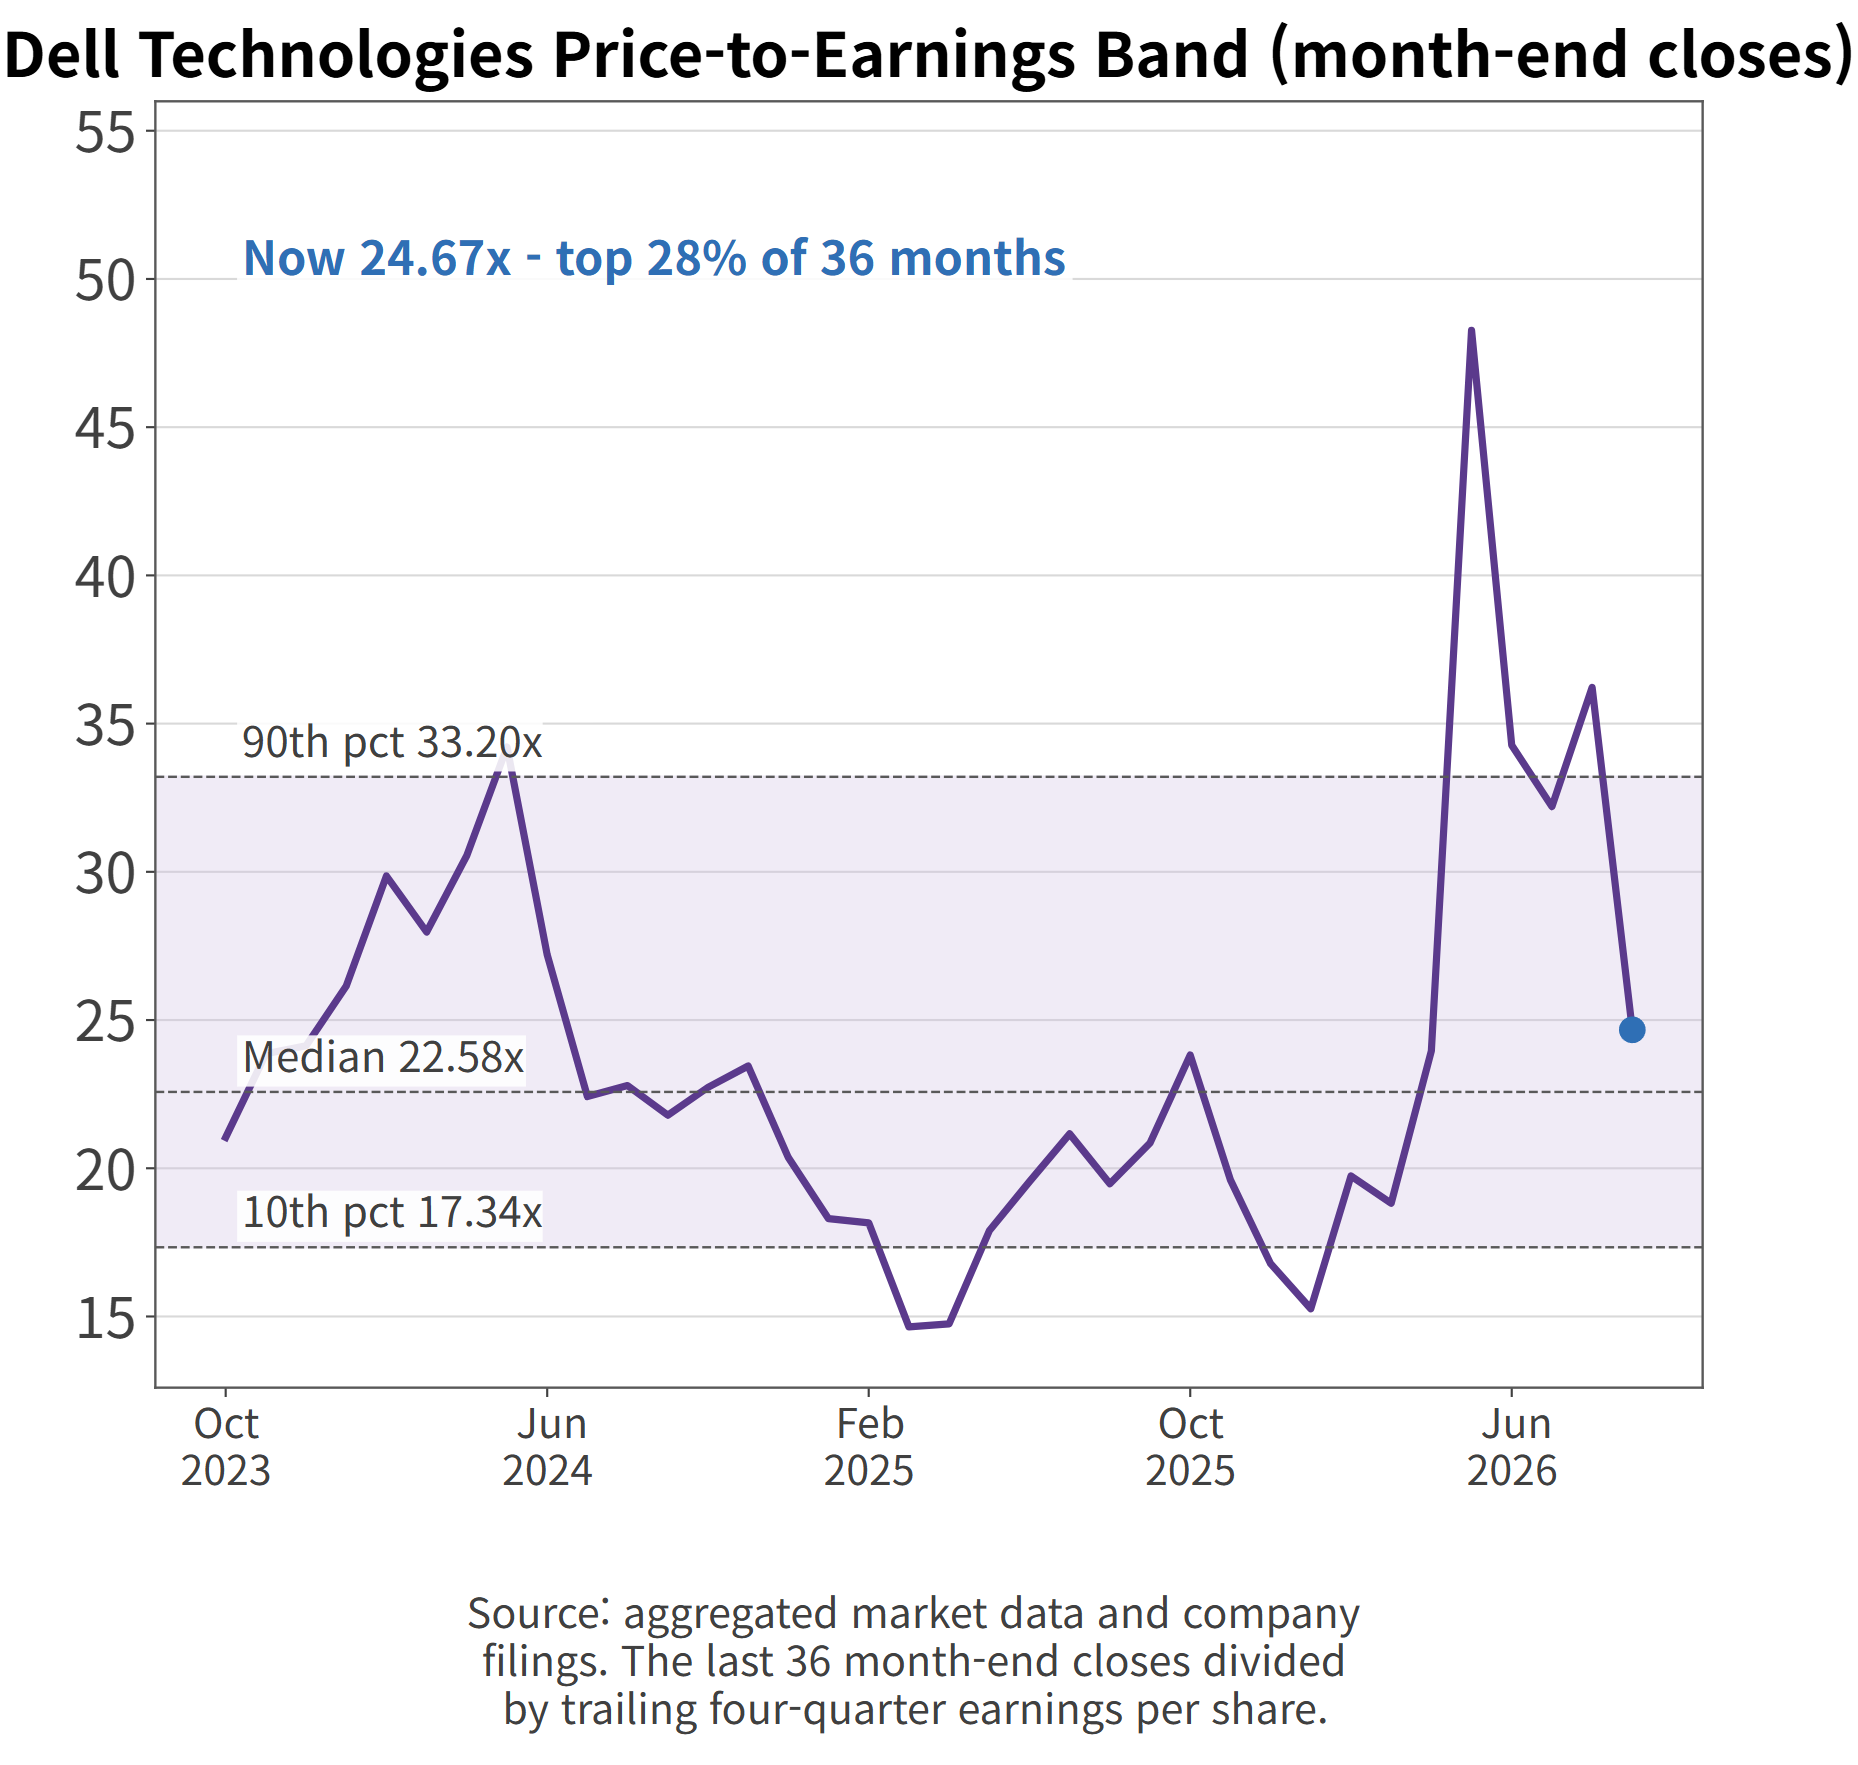
Line up the last 36 month-end closes and the price-to-earnings ratio of 24.7x sits in the top 28% of the range, against a three-year median of 22.73x. Slightly rich, not remarkable.
Dell price-to-earnings band, month-end closes
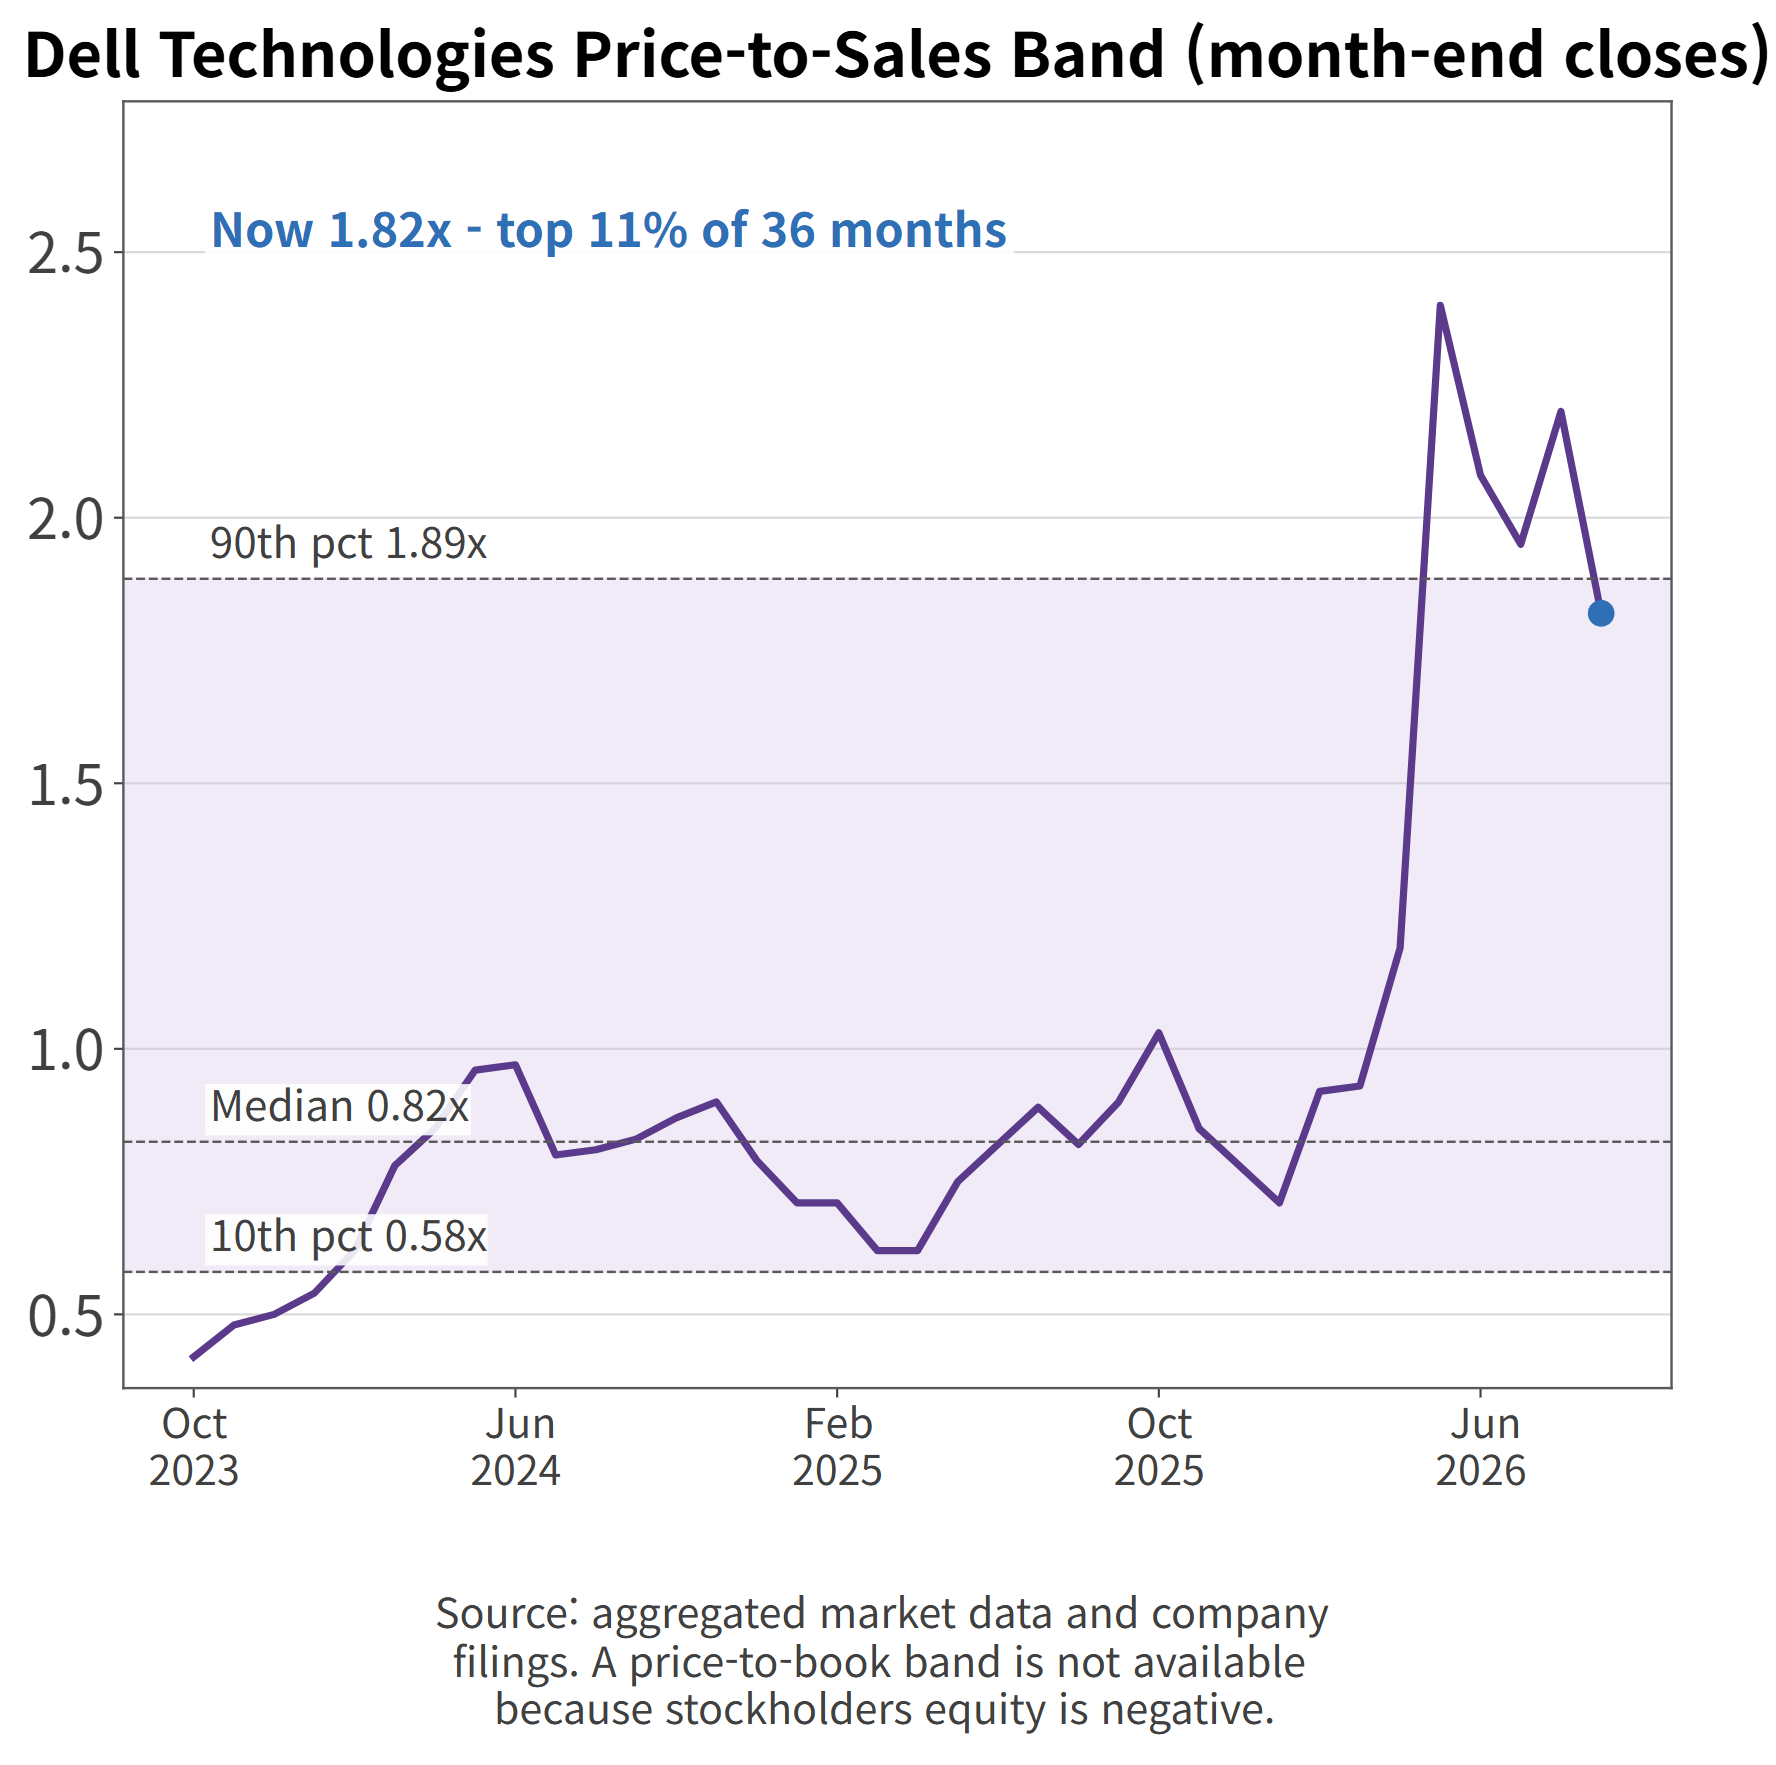
Price-to-sales sits somewhere else entirely. At 1.82x it is in the top 11% of the same window, more than double the 0.83x median. The sales multiple is near the top of its range while the earnings multiple is only a little above the middle.
Dell price-to-sales band, month-end closes
What closed that gap is margin. The same dollar of revenue produces more profit than it did three years ago, so the earnings multiple did not have to stretch as far as the sales multiple did.
Look forward and the two split again. The forward price-to-earnings ratio of 15.6x uses the company's own $25.50 adjusted EPS guidance as the denominator; the trailing figure of 24.7x uses the results just reported. Same share price, nine turns apart.
Analyst consensus is a buy rating with a $538.83 price target, +26.8% above the September 1 close and still above the pre-market print.
Dell share price and consensus price target
Item
Value
Close, September 1, 2026
$425.00
Pre-market, September 2
$457.80
Market capitalization
$274.61 billion
Price-to-earnings
24.7x
Forward price-to-earnings
15.6x
Price-to-sales
1.82x
Price-to-book
not available (negative equity)
Dividend yield
0.59%
Consensus price target
$538.83
Source: aggregated market data as of September 1, 2026
Key Takeaways for DELL Stock
The quarter reduces to three numbers: revenue of $46.97 billion, EPS of $6.34, and a $25 billion raise to the full-year revenue outlook. Record AI server orders of $60.9 billion and a record $95 billion backlog are what the raise rests on.
The number worth arguing about is the margin on the increase. Infrastructure revenue rose $14.982 billion and infrastructure operating income rose $3.311 billion with it, a 22.1% incremental margin against an 8.8% base. That is not what a thin-margin AI-server business looks like.
Cash sits on the other side of the ledger. Net income up 255%, operating cash flow down 12.5%, working capital taking the difference while the backlog builds.
So the next quarter has a job. Show whether 22.1% was one quarter or a run rate, and show whether cash returns as revenue climbs to $49.0 billion. Those two answers set what the September raise was actually worth.
Methodology and Sources
Figures in this analysis come from Dell Technologies' own filings and disclosures. The financial series were built by parsing all 40 quarterly earnings releases the company filed with the SEC between 2016 and September 2026 (CIK 1571996), rather than pulling a vendor summary — the release text is the source for segment revenue, segment operating income, product-line revenue, cash flow, and per-share figures. Those series were cross-checked against XBRL company facts from the same filings, and multiples were cross-checked against aggregated market data.
Valuation bands use month-end closing prices over the trailing 36 months, with trailing four-quarter earnings per share and revenue as denominators. The price-to-book band is omitted because stockholders equity is negative. Industry series are from FRED at the Federal Reserve Bank of St. Louis. Quotations are reproduced verbatim from the September 1, 2026 earnings release and the accompanying performance review deck.
This is not investment advice. It is a research write-up, and the reader is responsible for their own decisions.