Advanced Micro Devices (NASDAQ: AMD) reported second-quarter 2026 revenue of $11.54 billion, up 50% year over year, with Data Center revenue more than doubling to $6.72 billion. This AMD stock analysis works through the quarter's segment results, the composition of net income, the $4.75 billion of senior notes the company issued three weeks after reporting, valuation against Nvidia and other chipmakers, and what to watch when AMD reports the third quarter.
Here is the part worth pausing on. Net income of $2.30 billion came in above operating income of $1.99 billion. That does not happen often, and the gap has a name in the filings.
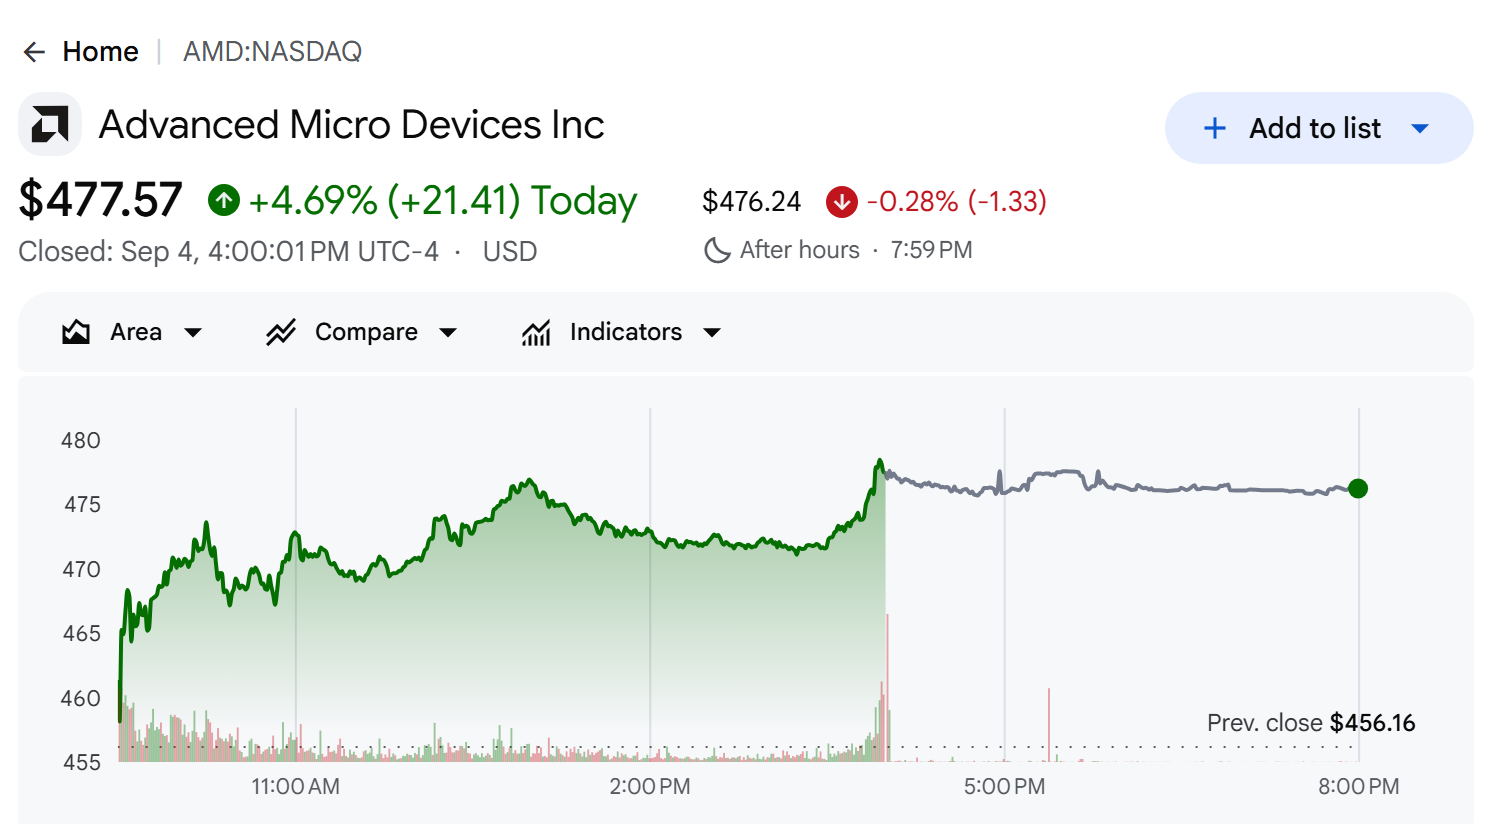
Advanced Micro Devices (AMD) on Google Finance, September 4, 2026 close
The stock closed at $477.57 on September 4, +4.69% on the day, for a market capitalization near $779 billion. Every price figure here is fixed to that close.
AMD closes its books on the last Saturday of December, so quarter ends fall a few days off the calendar. The second quarter ended June 27, 2026.
Metric
Q2 2026
Q2 2025
Change
Revenue
$11,536 million
$7,685 million
+50%
Gross margin
54%
40%
+14 ppts
Operating income
$1,990 million
$134 million loss
To profit
Net income
$2,297 million
$872 million
+163%
Diluted EPS
$1.38
$0.54
+156%
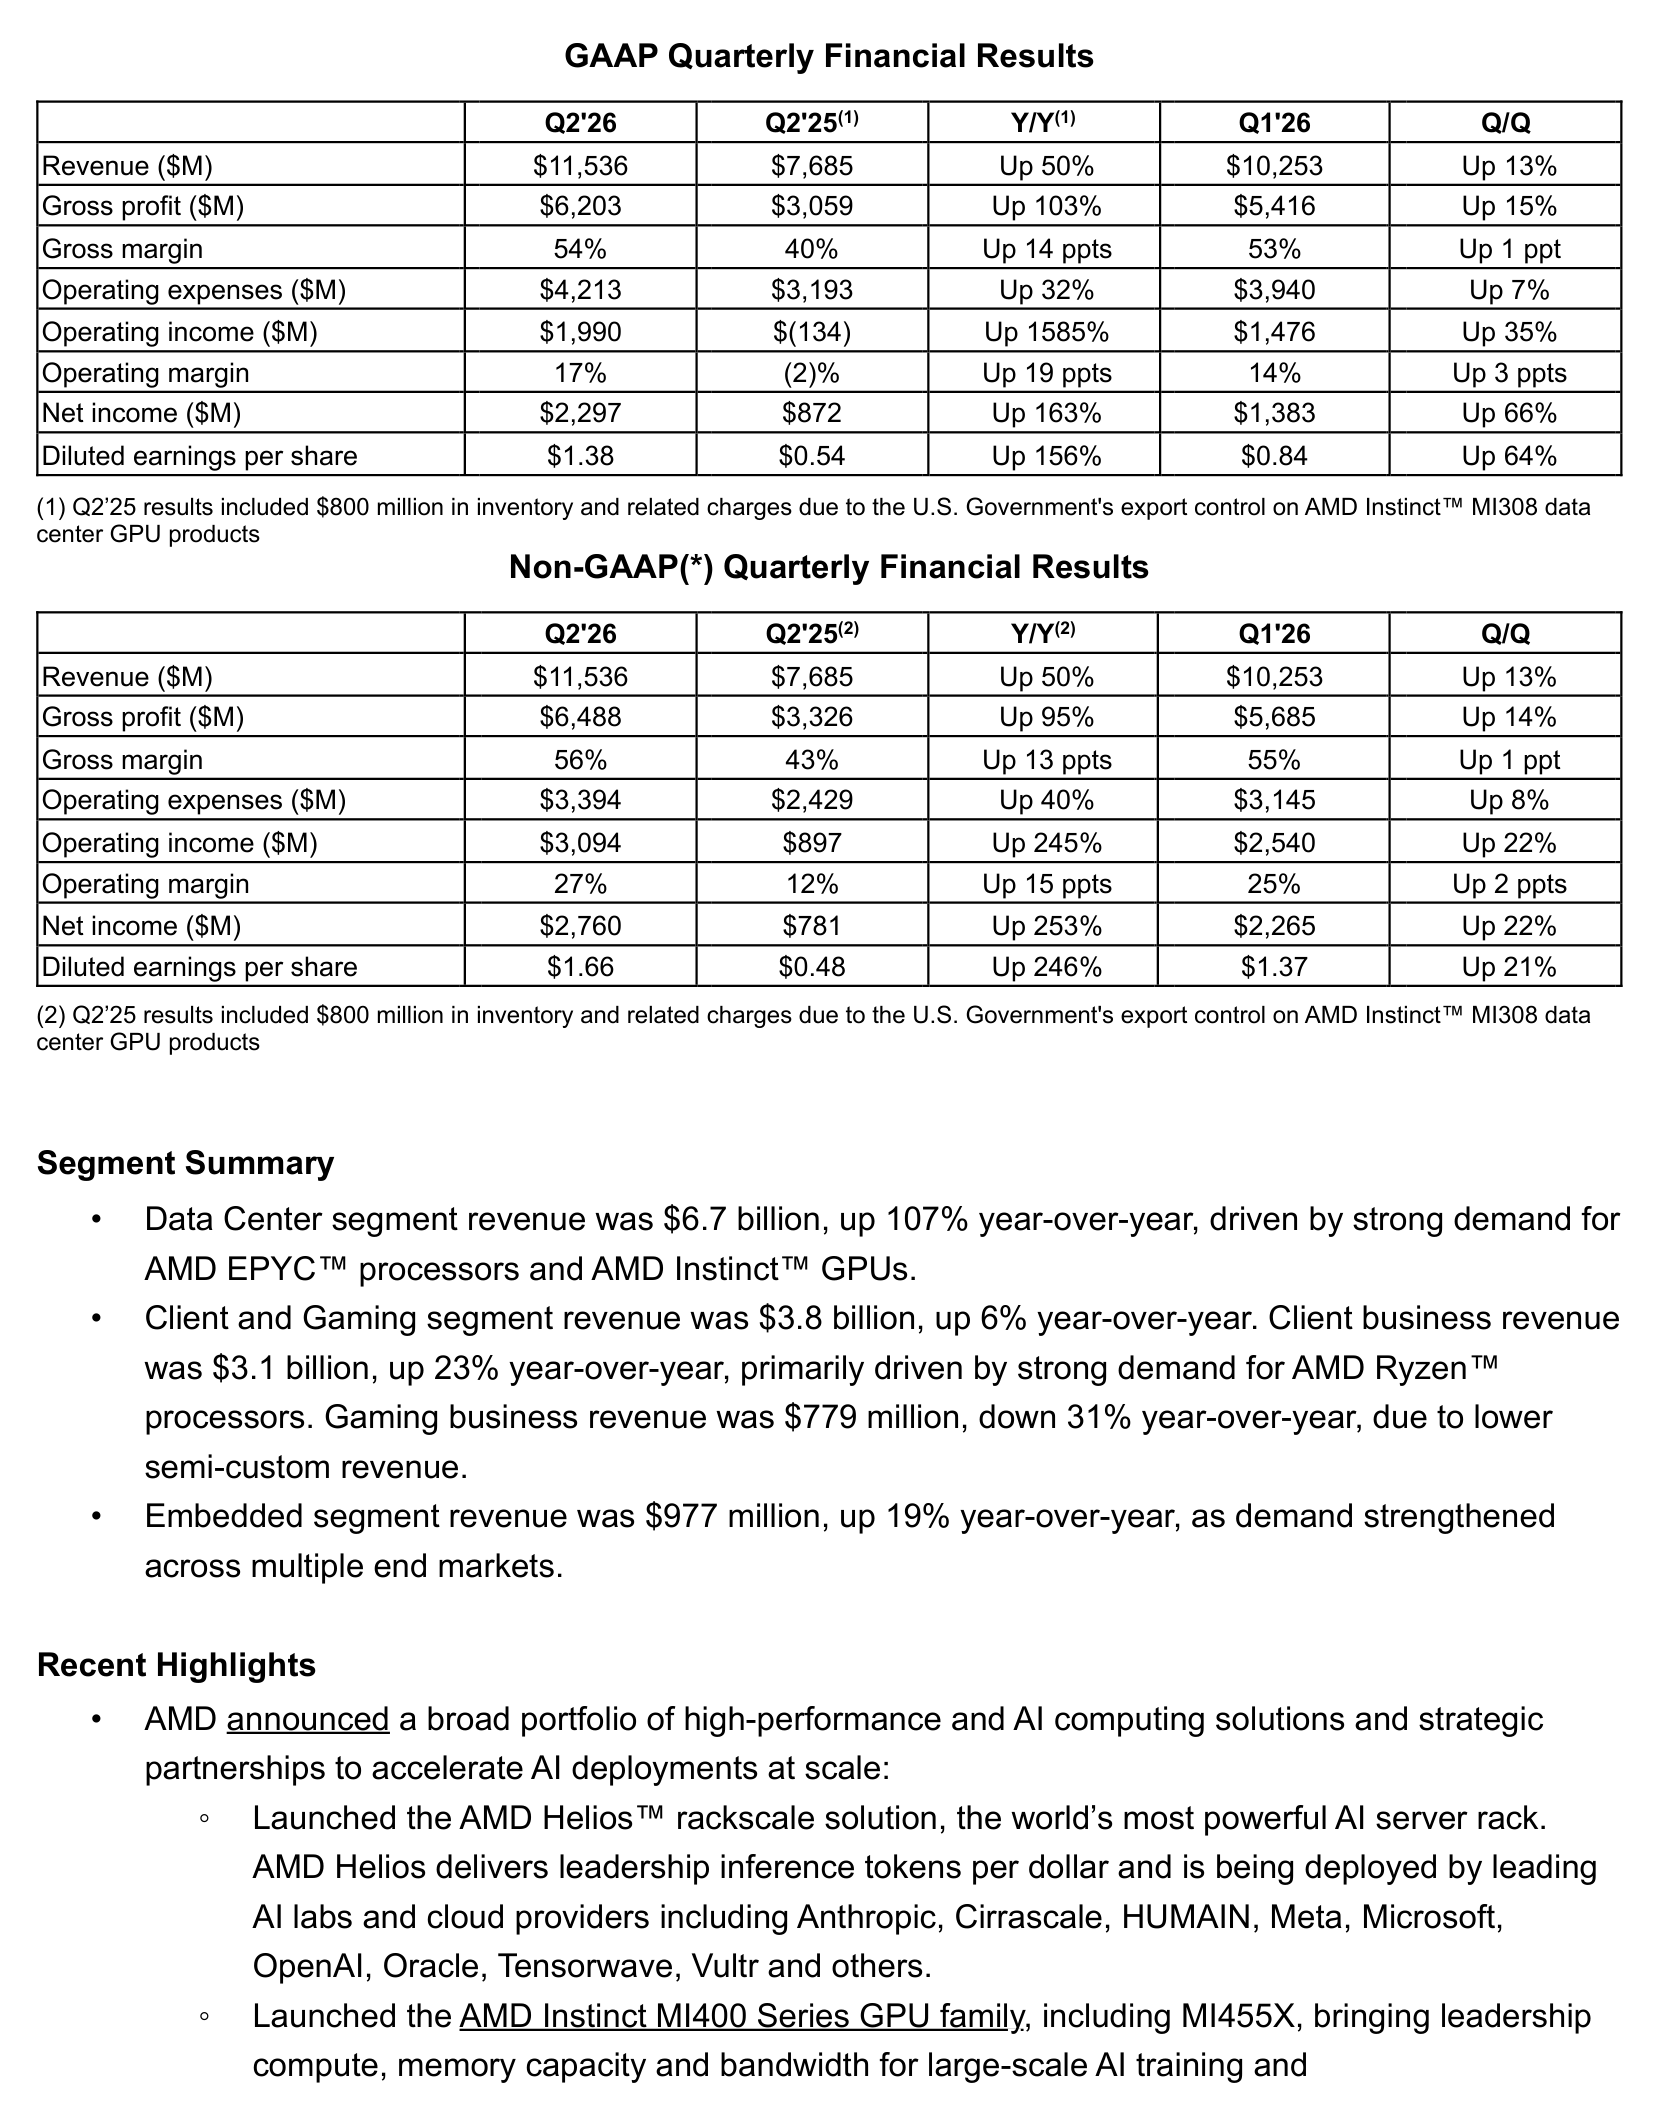
AMD second-quarter 2026 results summary, from the company's earnings release
The prior-year base needs a footnote. Q2 2025 carried $800 million of inventory and related charges tied to the US government export control on Instinct MI308 data center GPUs. So the 40% gross margin and the operating loss a year ago were not a normal run rate, and this year's growth rates read larger because of it.
On a non-GAAP basis, gross margin was 56%, operating income $3,094 million, and diluted EPS $1.66. The $1,104 million gap between GAAP and non-GAAP operating income is mostly stock-based compensation and amortization of acquisition-related intangibles.
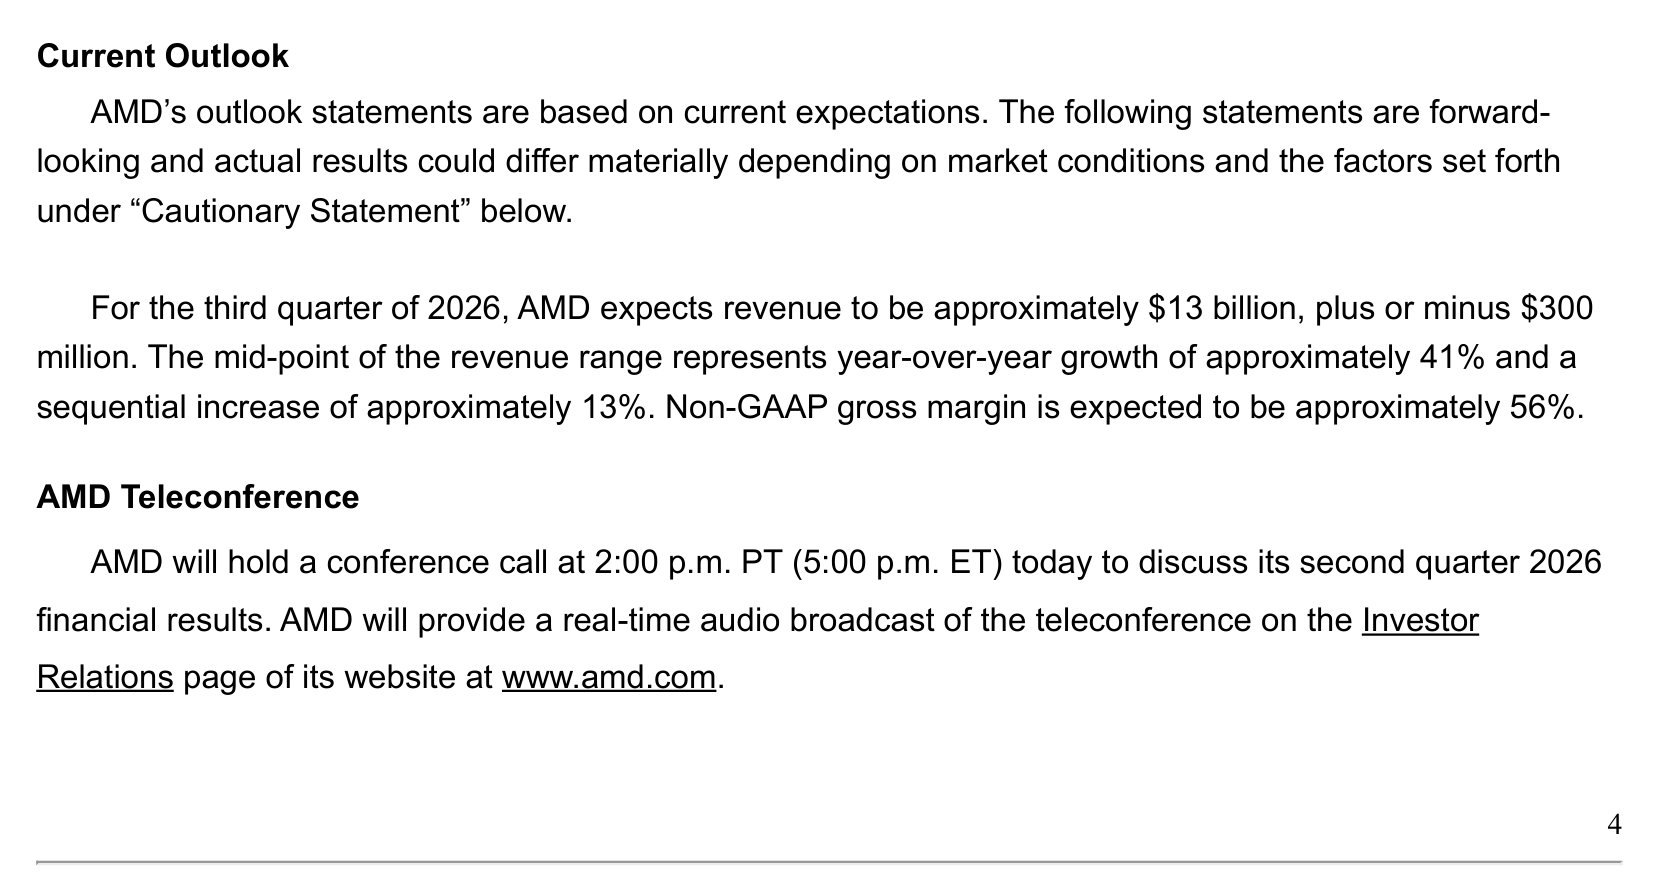
Third-quarter guidance is revenue of approximately $13 billion plus or minus $300 million, with non-GAAP gross margin around 56%. At the midpoint that is +41% year over year.
What Does AMD Do? Three Segments, One Engine
AMD was founded in 1969 in California and designs chips without owning the fabs that make them. Manufacturing goes to foundries. Since Lisa Su became chief executive in 2014 the company has shifted its center of gravity toward server CPUs and GPUs.
The Data Center segment comes first. It holds Instinct AI accelerators, EPYC server CPUs, GPUs, data processing units, AI network interface cards, FPGAs, and adaptive systems on chip for data centers. It was 58% of company revenue in the quarter.
The Client and Gaming segment comes second. Desktop and notebook CPUs and APUs, chipsets, discrete GPUs, and the semi-custom systems on chip that go into game consoles all sit here. Client revenue rose +23% on Ryzen demand while Gaming fell -31% as semi-custom volume declined.
The Embedded segment comes third, covering CPUs, FPGAs, and system-on-modules for industrial, communications, and automotive equipment. It arrived largely through the 2022 Xilinx acquisition.
During the quarter AMD launched the Helios rack-scale solution alongside Instinct MI450 Series GPUs, sixth-generation EPYC CPUs, and Pensando Salina and Vulcano networking. The product unit is moving from the chip to the rack.
That shift changes who the customer is. Instead of buyers who assemble servers from parts, the primary customer becomes the operator who takes a rack and rolls it into a data center. AMD also introduced ROCm.ai, a developer environment for building on its accelerators. Accelerators sell only when the software stack is there, and Nvidia's CUDA has more than a decade of accumulated work behind it. That is one reason research and development spending keeps climbing faster than 30% a year.
Data Center Is Now 58% of AMD Revenue
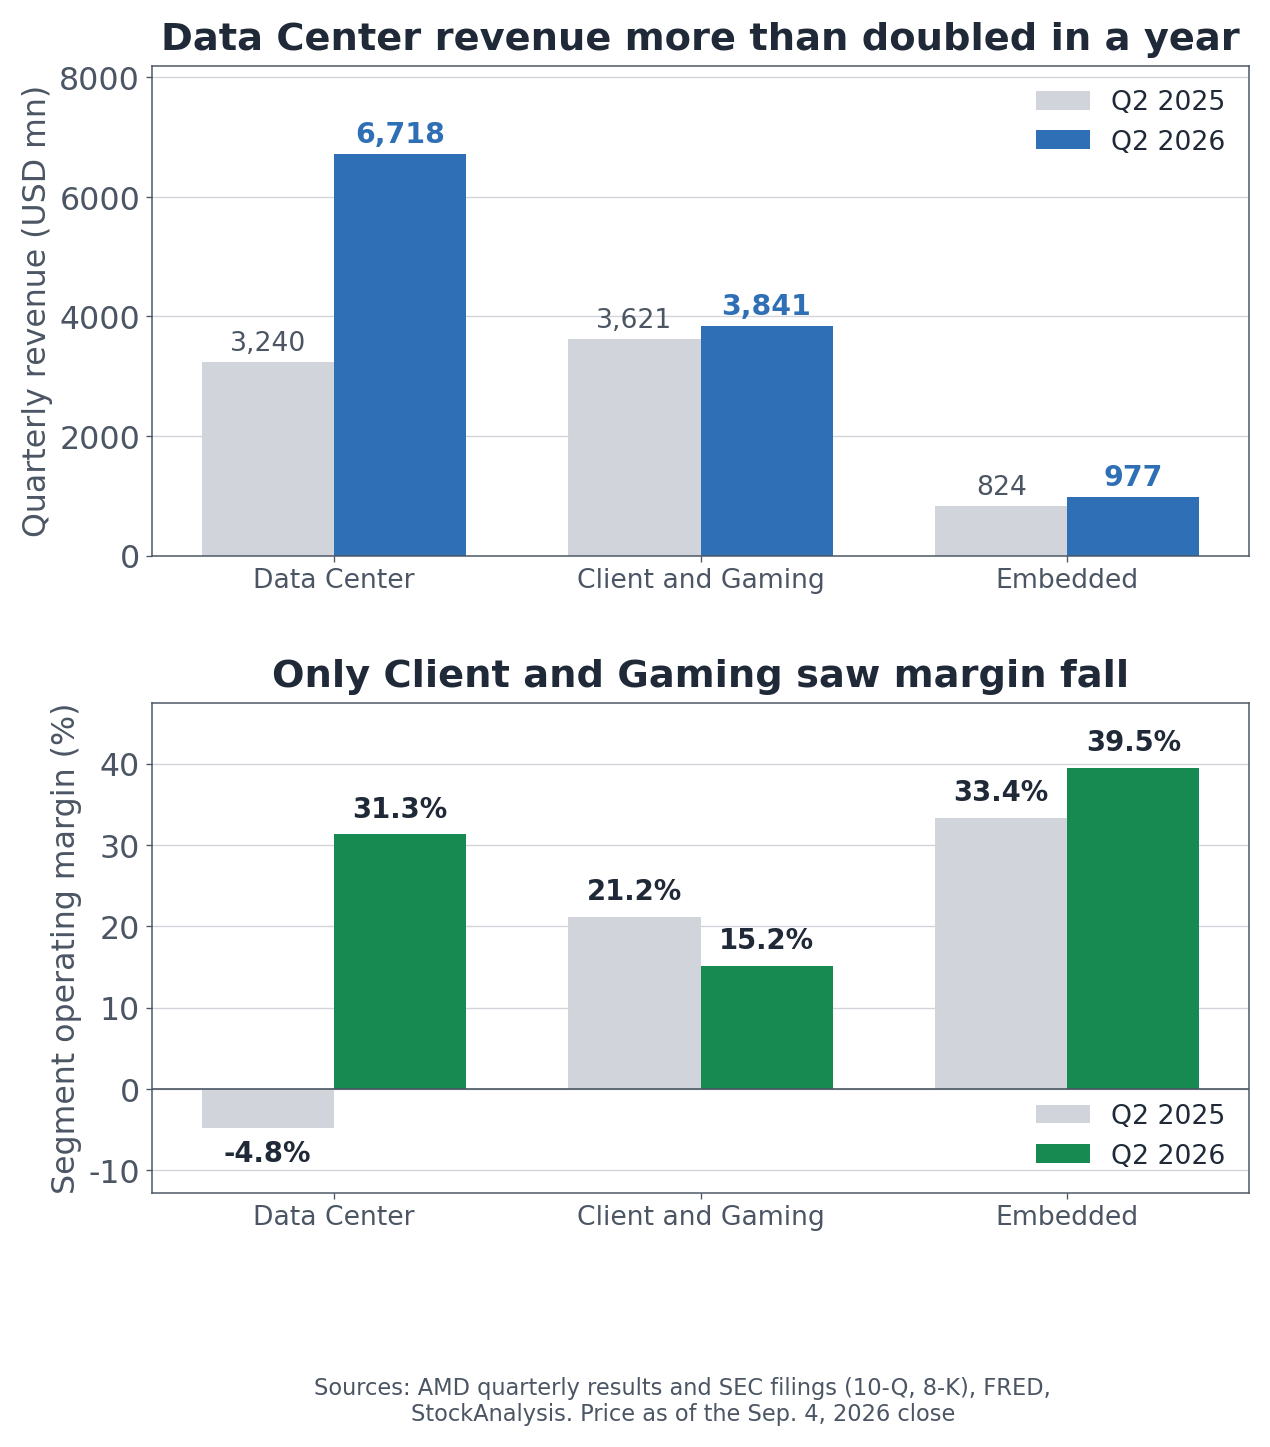
AMD segment revenue and operating margin, Q2 2026 versus Q2 2025
Split by segment, the growth comes from one place.
Segment
Q2 2026 revenue
Year over year
Operating income
Operating margin
Prior-year margin
Data Center
$6,718 million
+107%
$2,103 million
31.3%
negative 4.8%
Client and Gaming
$3,841 million
+6%
$582 million
15.2%
21.2%
Embedded
$977 million
+19%
$386 million
39.5%
33.4%
AMD segment results with capital expenditures, cash, and total debt, from the company's earnings release
Company operating income was $1,990 million while Data Center alone contributed $2,103 million. The segments sum higher than the company because unallocated items run at negative $1,081 million, holding amortization of acquisition-related intangibles and stock-based compensation.
The strategy slides carry one sentence that gives the scale: Anthropic and AMD announced a strategic agreement to deploy up to 2 gigawatts of Instinct MI450 Series GPUs in AMD Helios racks. Microsoft separately expanded a collaboration to deploy Helios and sixth-generation EPYC across Azure at scale. In data center terms, gigawatts is a more meaningful unit than chip counts.
Why Net Income Came In Above Operating Income
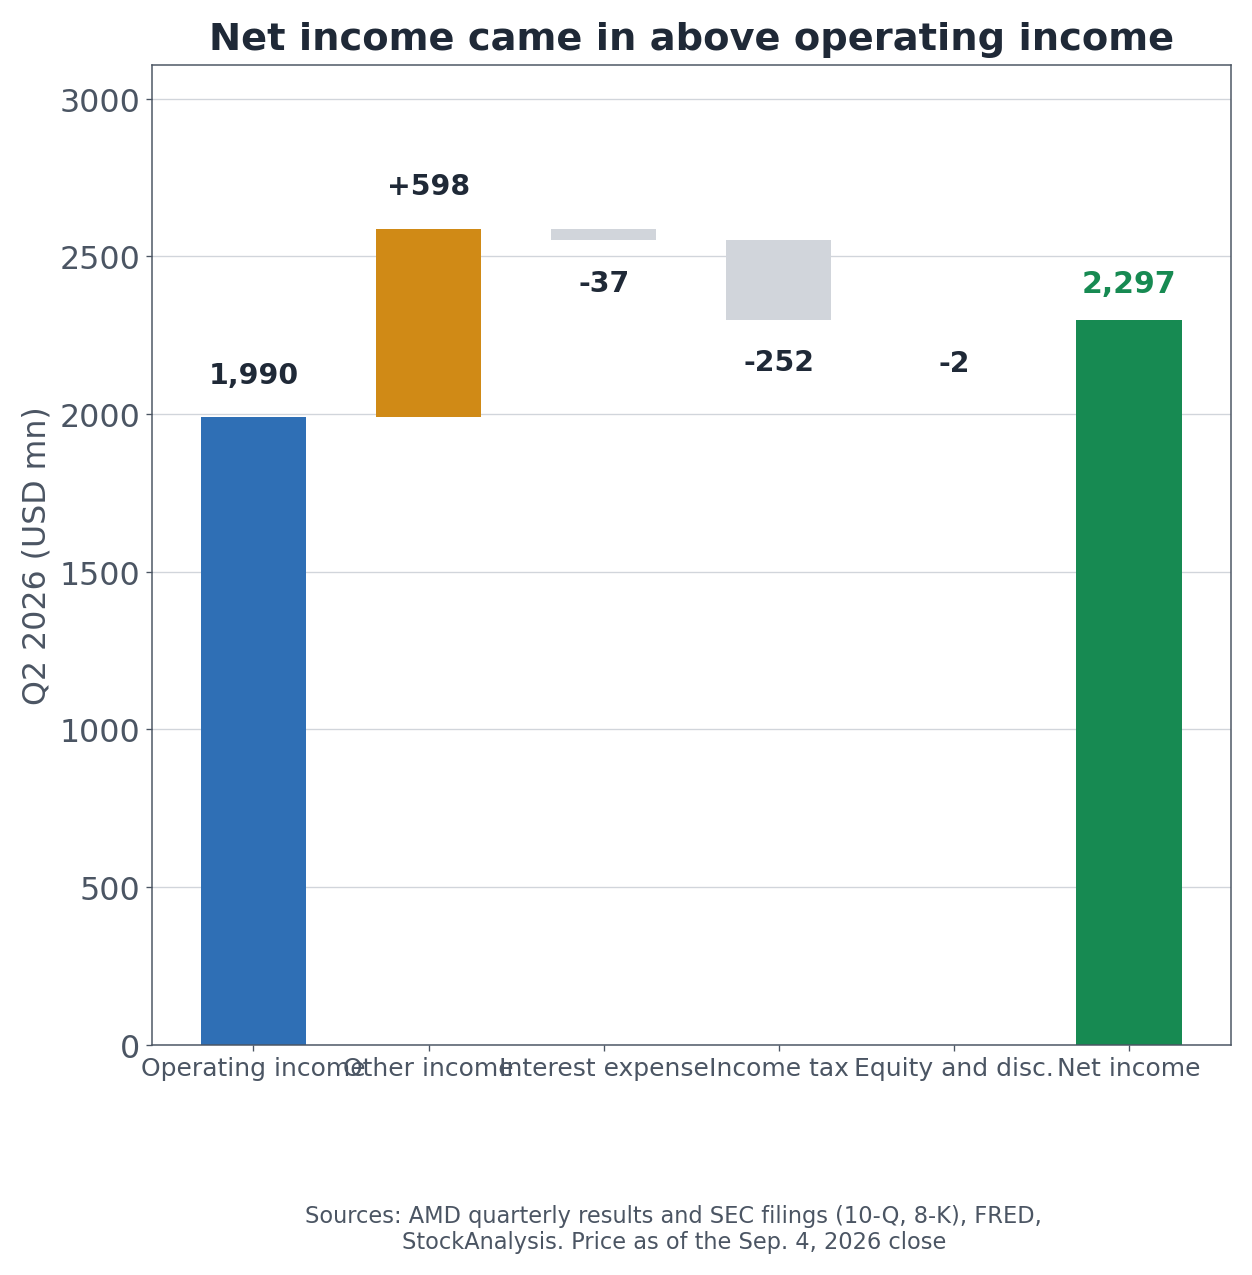
AMD path from operating income to net income, Q2 2026
Start at operating income of $1,990 million. Add other income of $598 million. Subtract interest expense of $37 million and an income tax provision of $252 million. Adjust slightly for equity income and discontinued operations, and net income lands at $2,297 million.
The 10-Q explains the $598 million directly. It rose $500 million, or +510%, from $98 million a year earlier, and the company attributes the increase primarily to unrealized gains from the public market listing of non-marketable equity securities during the second quarter of fiscal 2026.
Other Income Ran 11 Times Its Recent Average
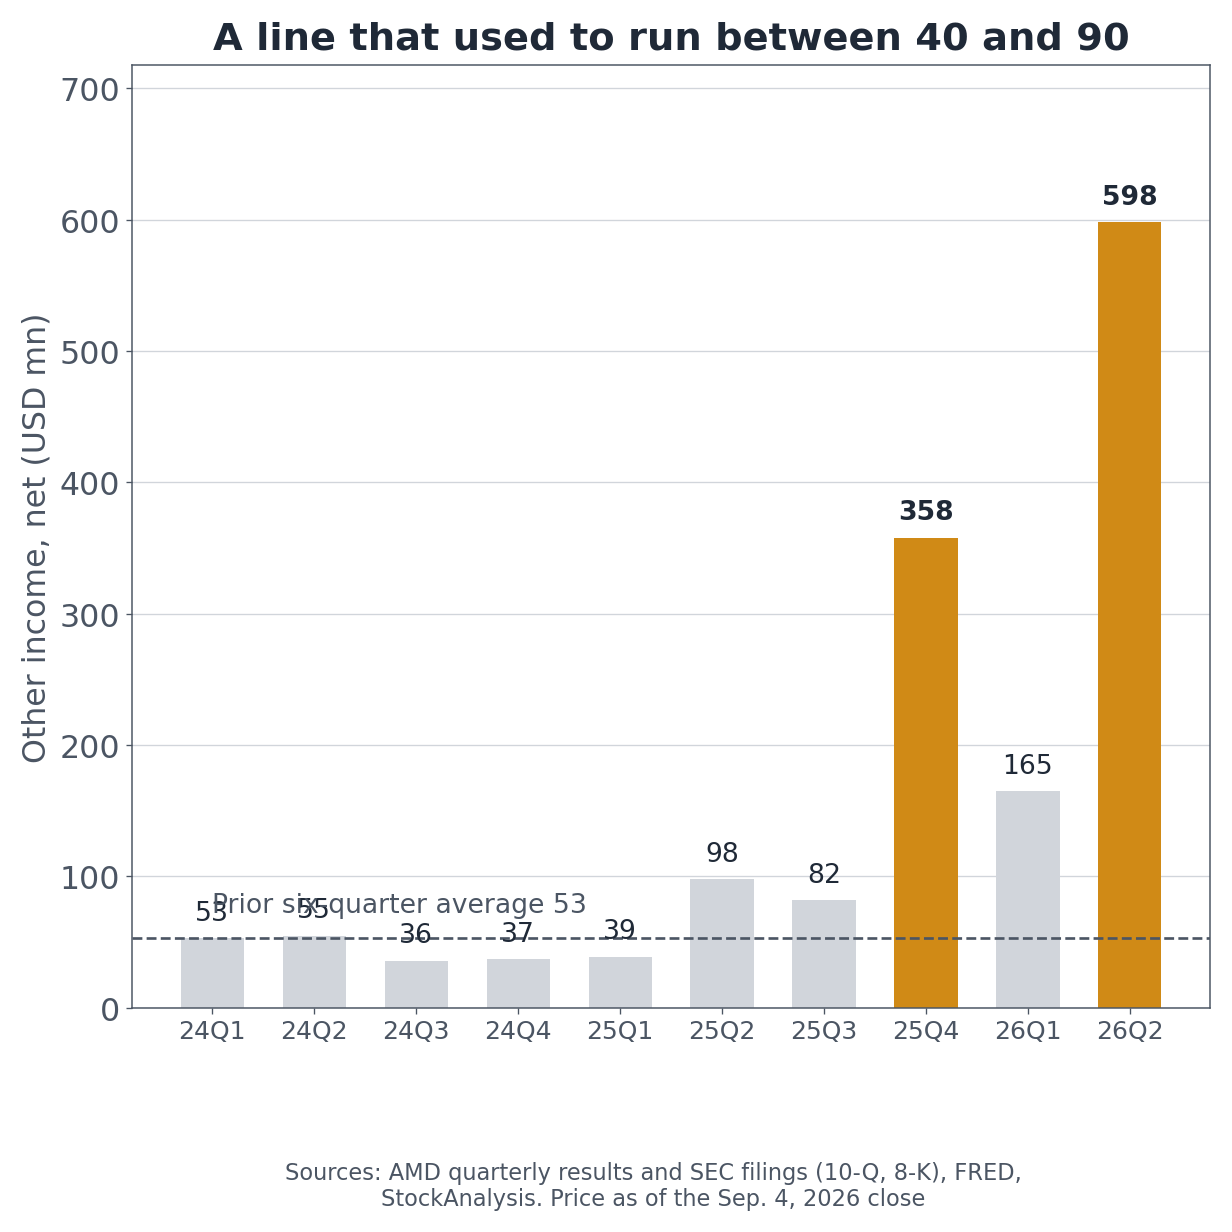
AMD quarterly other income, net, from Q1 2024 through Q2 2026
The time series shows what kind of line this is. From Q1 2024 through Q2 2025 it averaged $53 million across six quarters. Then $358 million landed in Q4 2025 and $598 million in this quarter. AMD disclosed that its long-term investments in non-marketable equity securities stood at $1.7 billion at June 27, up from $1.1 billion at the end of last year.
Taxes deserve a line too. The effective tax rate for the quarter was 9.8%. The company points to foreign-derived deduction eligible income and research and development tax credits as the reason it sits below the 21% US federal statutory rate.
Put the two together. Of $2,551 million in pre-tax income, $598 million was a mark-to-market gain that brought no cash in, and what remained was taxed at less than half the statutory rate. Operating earnings genuinely improved. But reading the 163% net income growth as an operating result overstates what happened.
AMD Raised $4.75 Billion Three Weeks After the Quarter
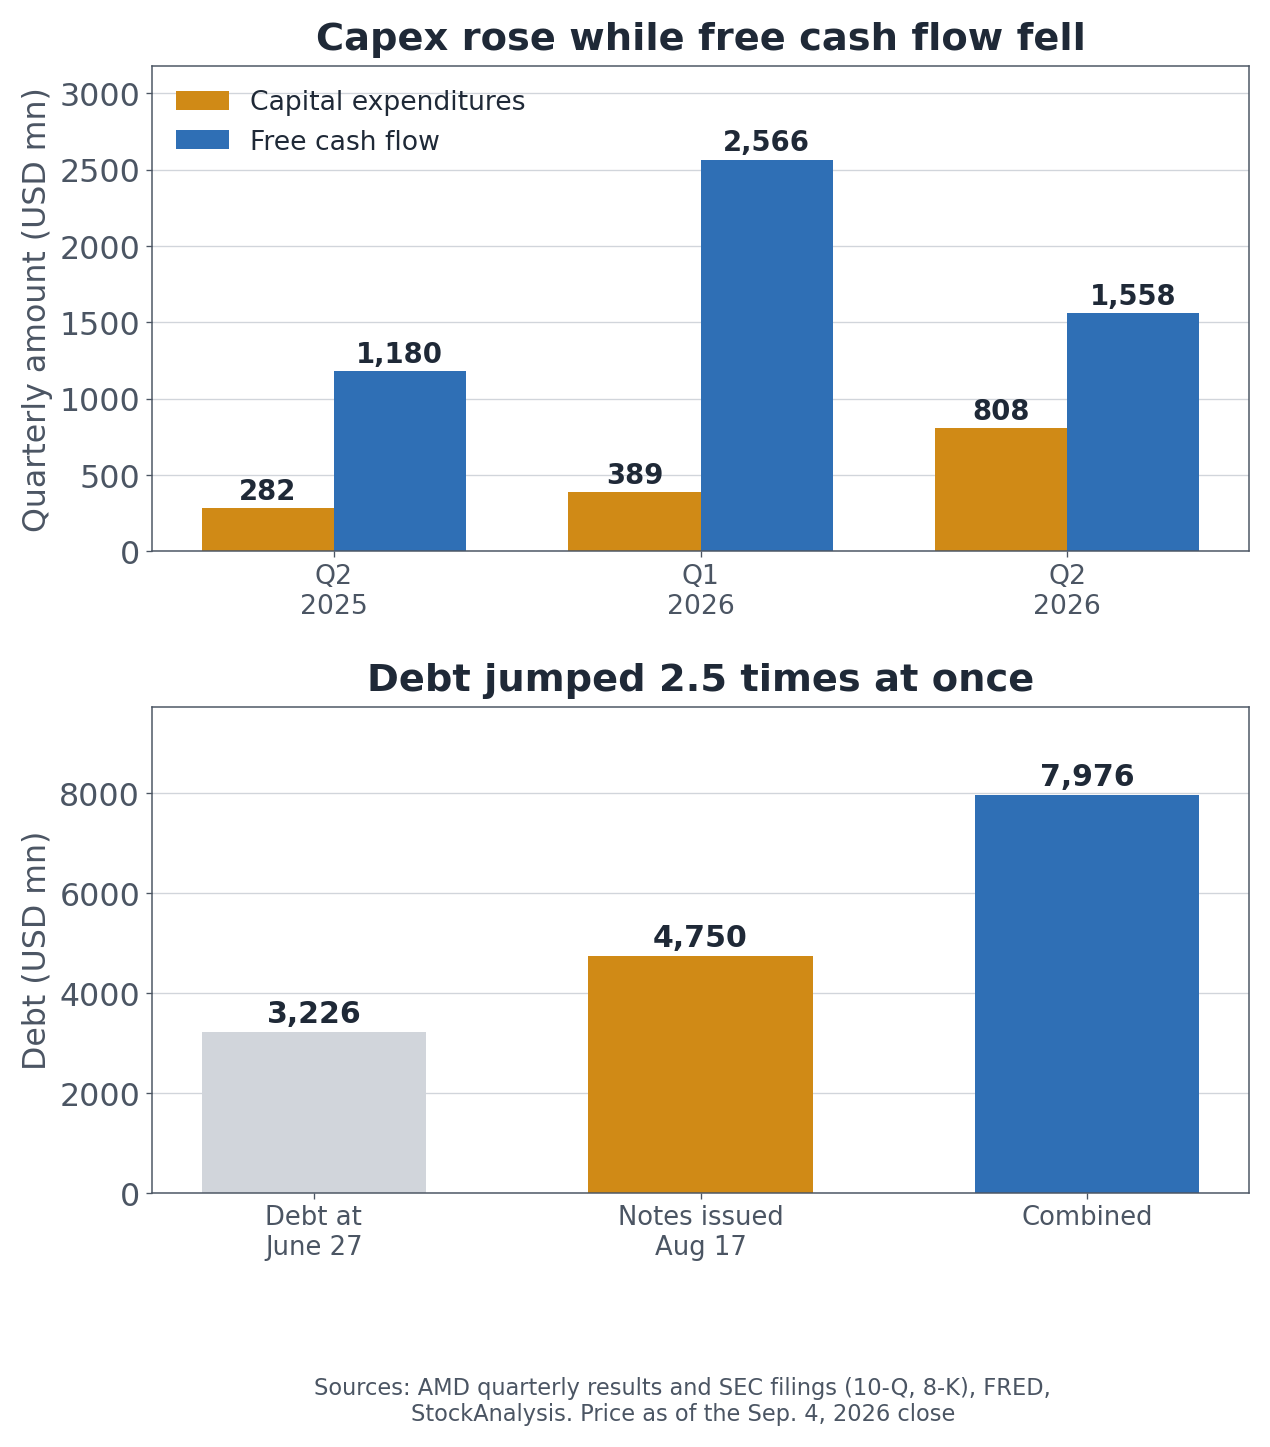
AMD quarterly capital expenditures and free cash flow, and debt after the August note issuance
On August 17 AMD closed a public offering of senior notes totaling $4.75 billion across four maturities.
Maturity
Principal
Coupon
Offering price
2029
$1,250 million
4.600%
99.889%
2031
$1,500 million
5.000%
99.921%
2033
$1,000 million
5.250%
99.919%
2036
$1,000 million
5.500%
99.757%
The underwriters were Barclays, BofA Securities, Citigroup, J.P. Morgan, Morgan Stanley, and Wells Fargo. On use of proceeds the company said only that it intends to use them for general corporate purposes, which may include the repayment of debt.
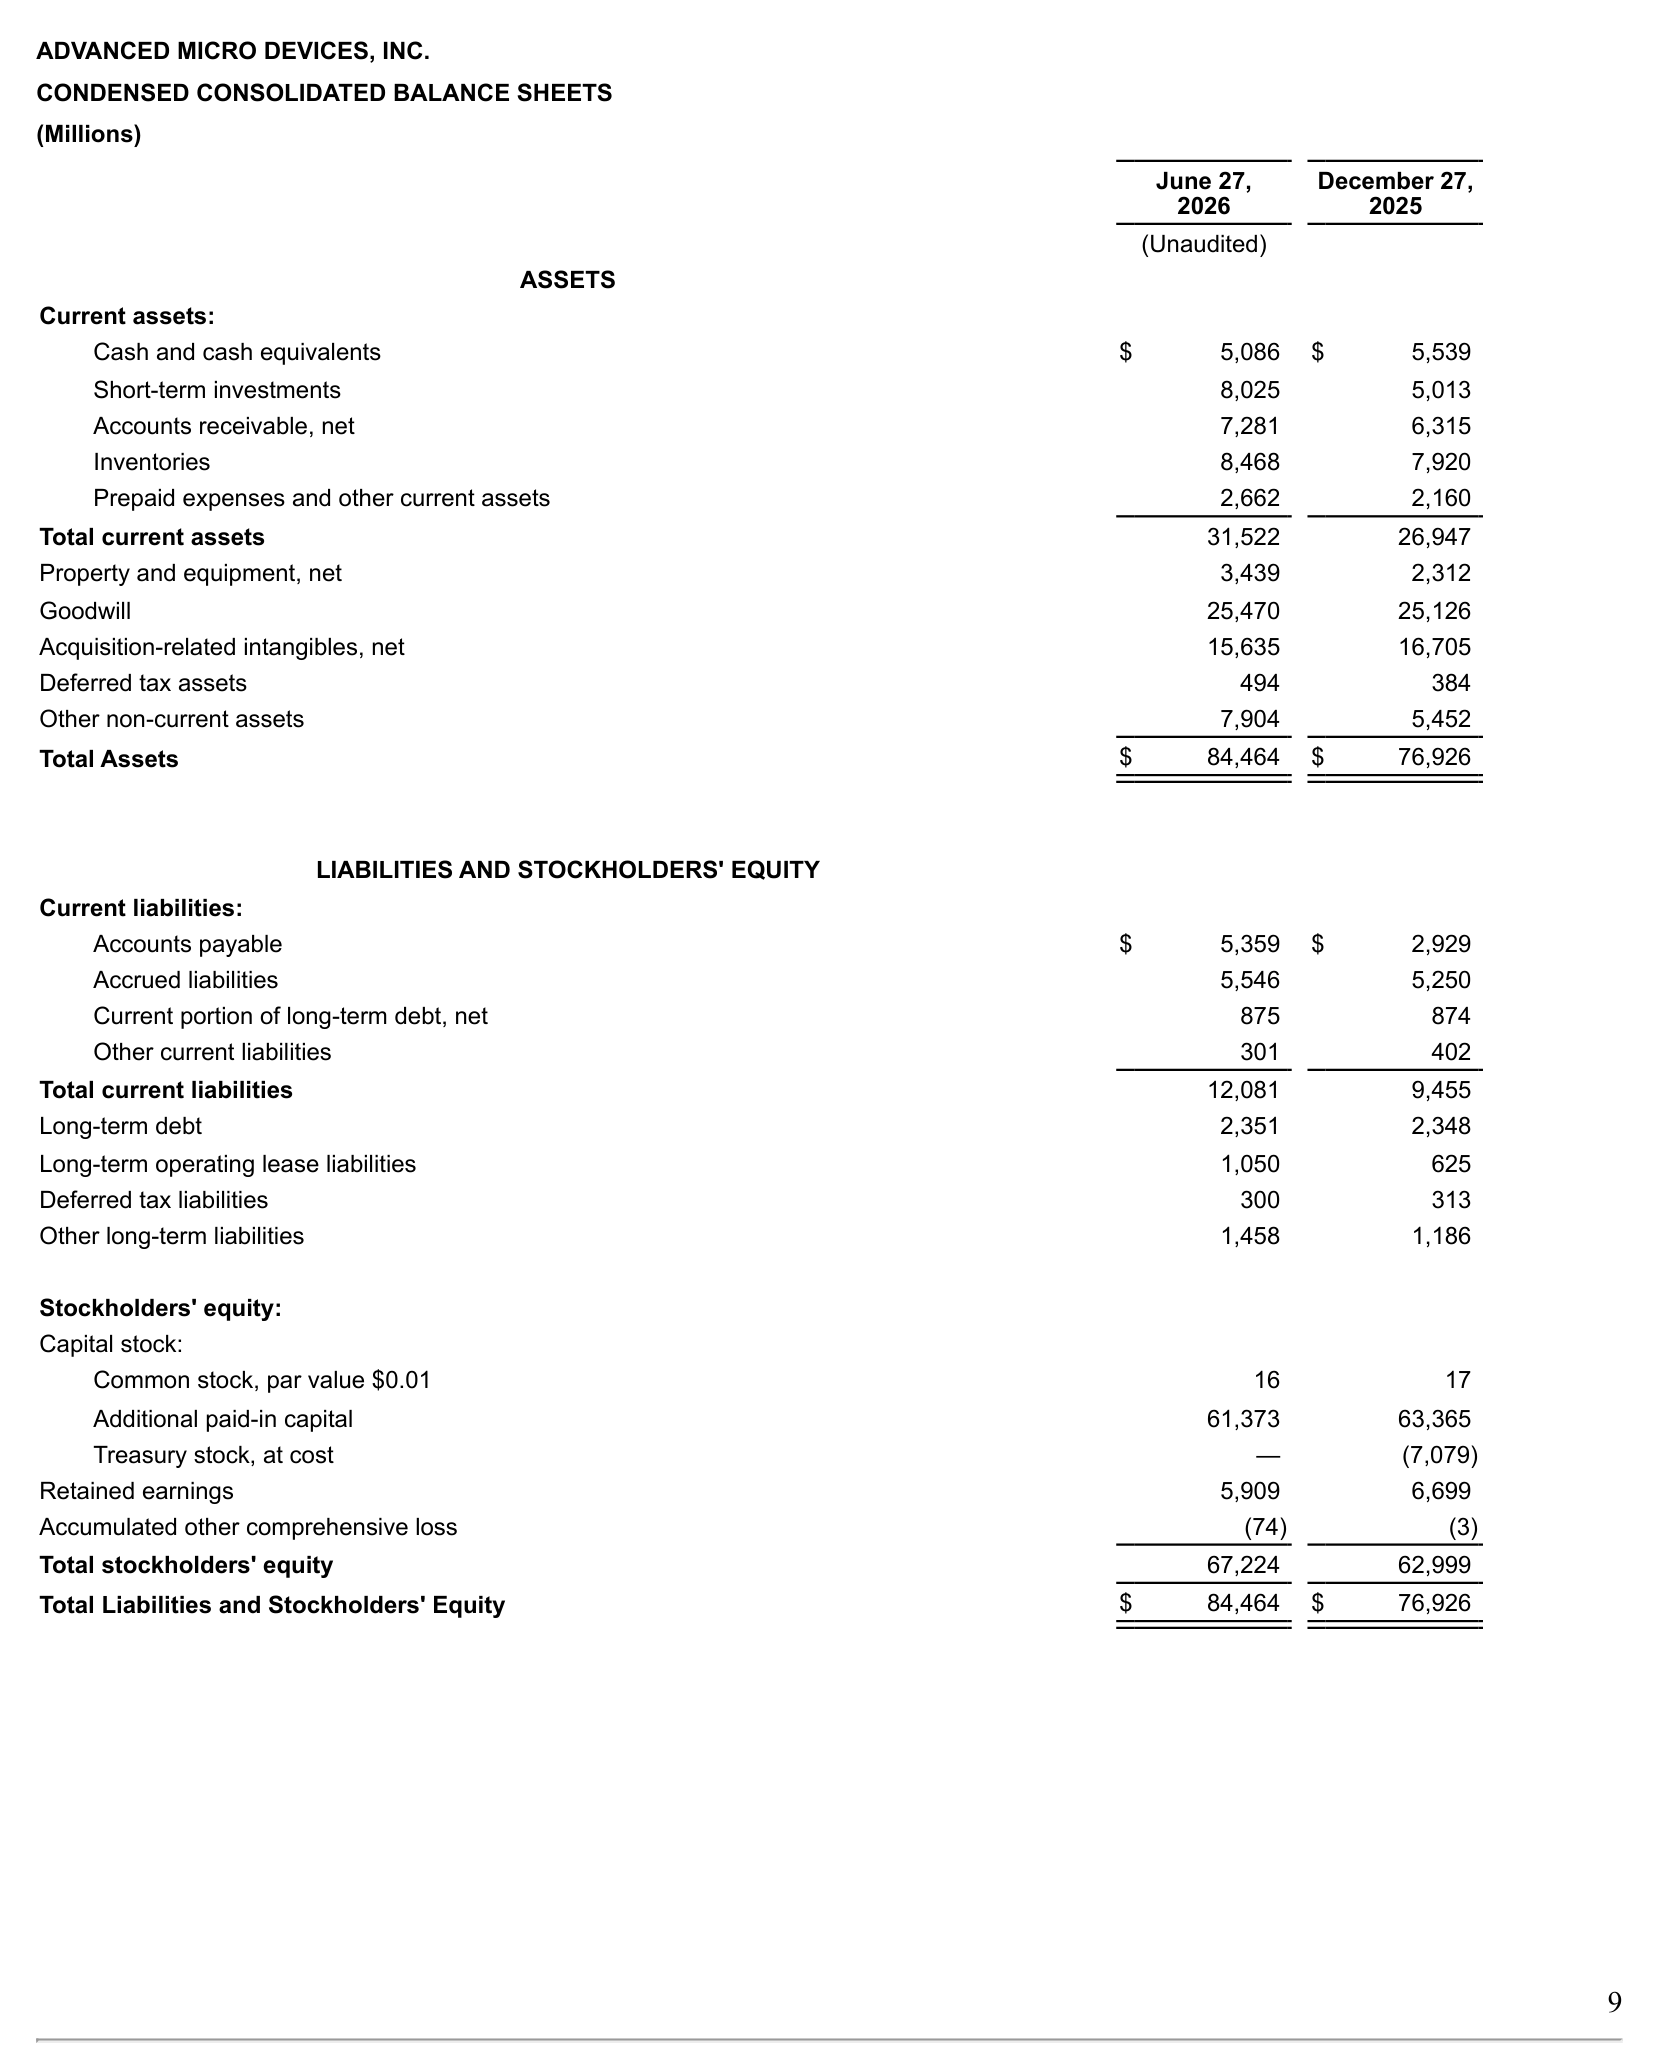
Set the numbers side by side. At June 27, total debt was $3,226 million and cash plus short-term investments were $13,111 million. Adding the new notes takes debt to $7,976 million.
AMD condensed consolidated balance sheet at June 27, 2026
AMD did not explain why a company holding $13.1 billion in cash would borrow. One sentence in the same 10-Q sits nearby, though: subsequent to June 27, 2026, the company entered into investment commitments of up to $5.0 billion, subject to certain contingencies, expected to be made through fiscal year 2028. The $4.75 billion raise and the $5.0 billion commitment ceiling were disclosed three weeks apart, and the company has not linked them.
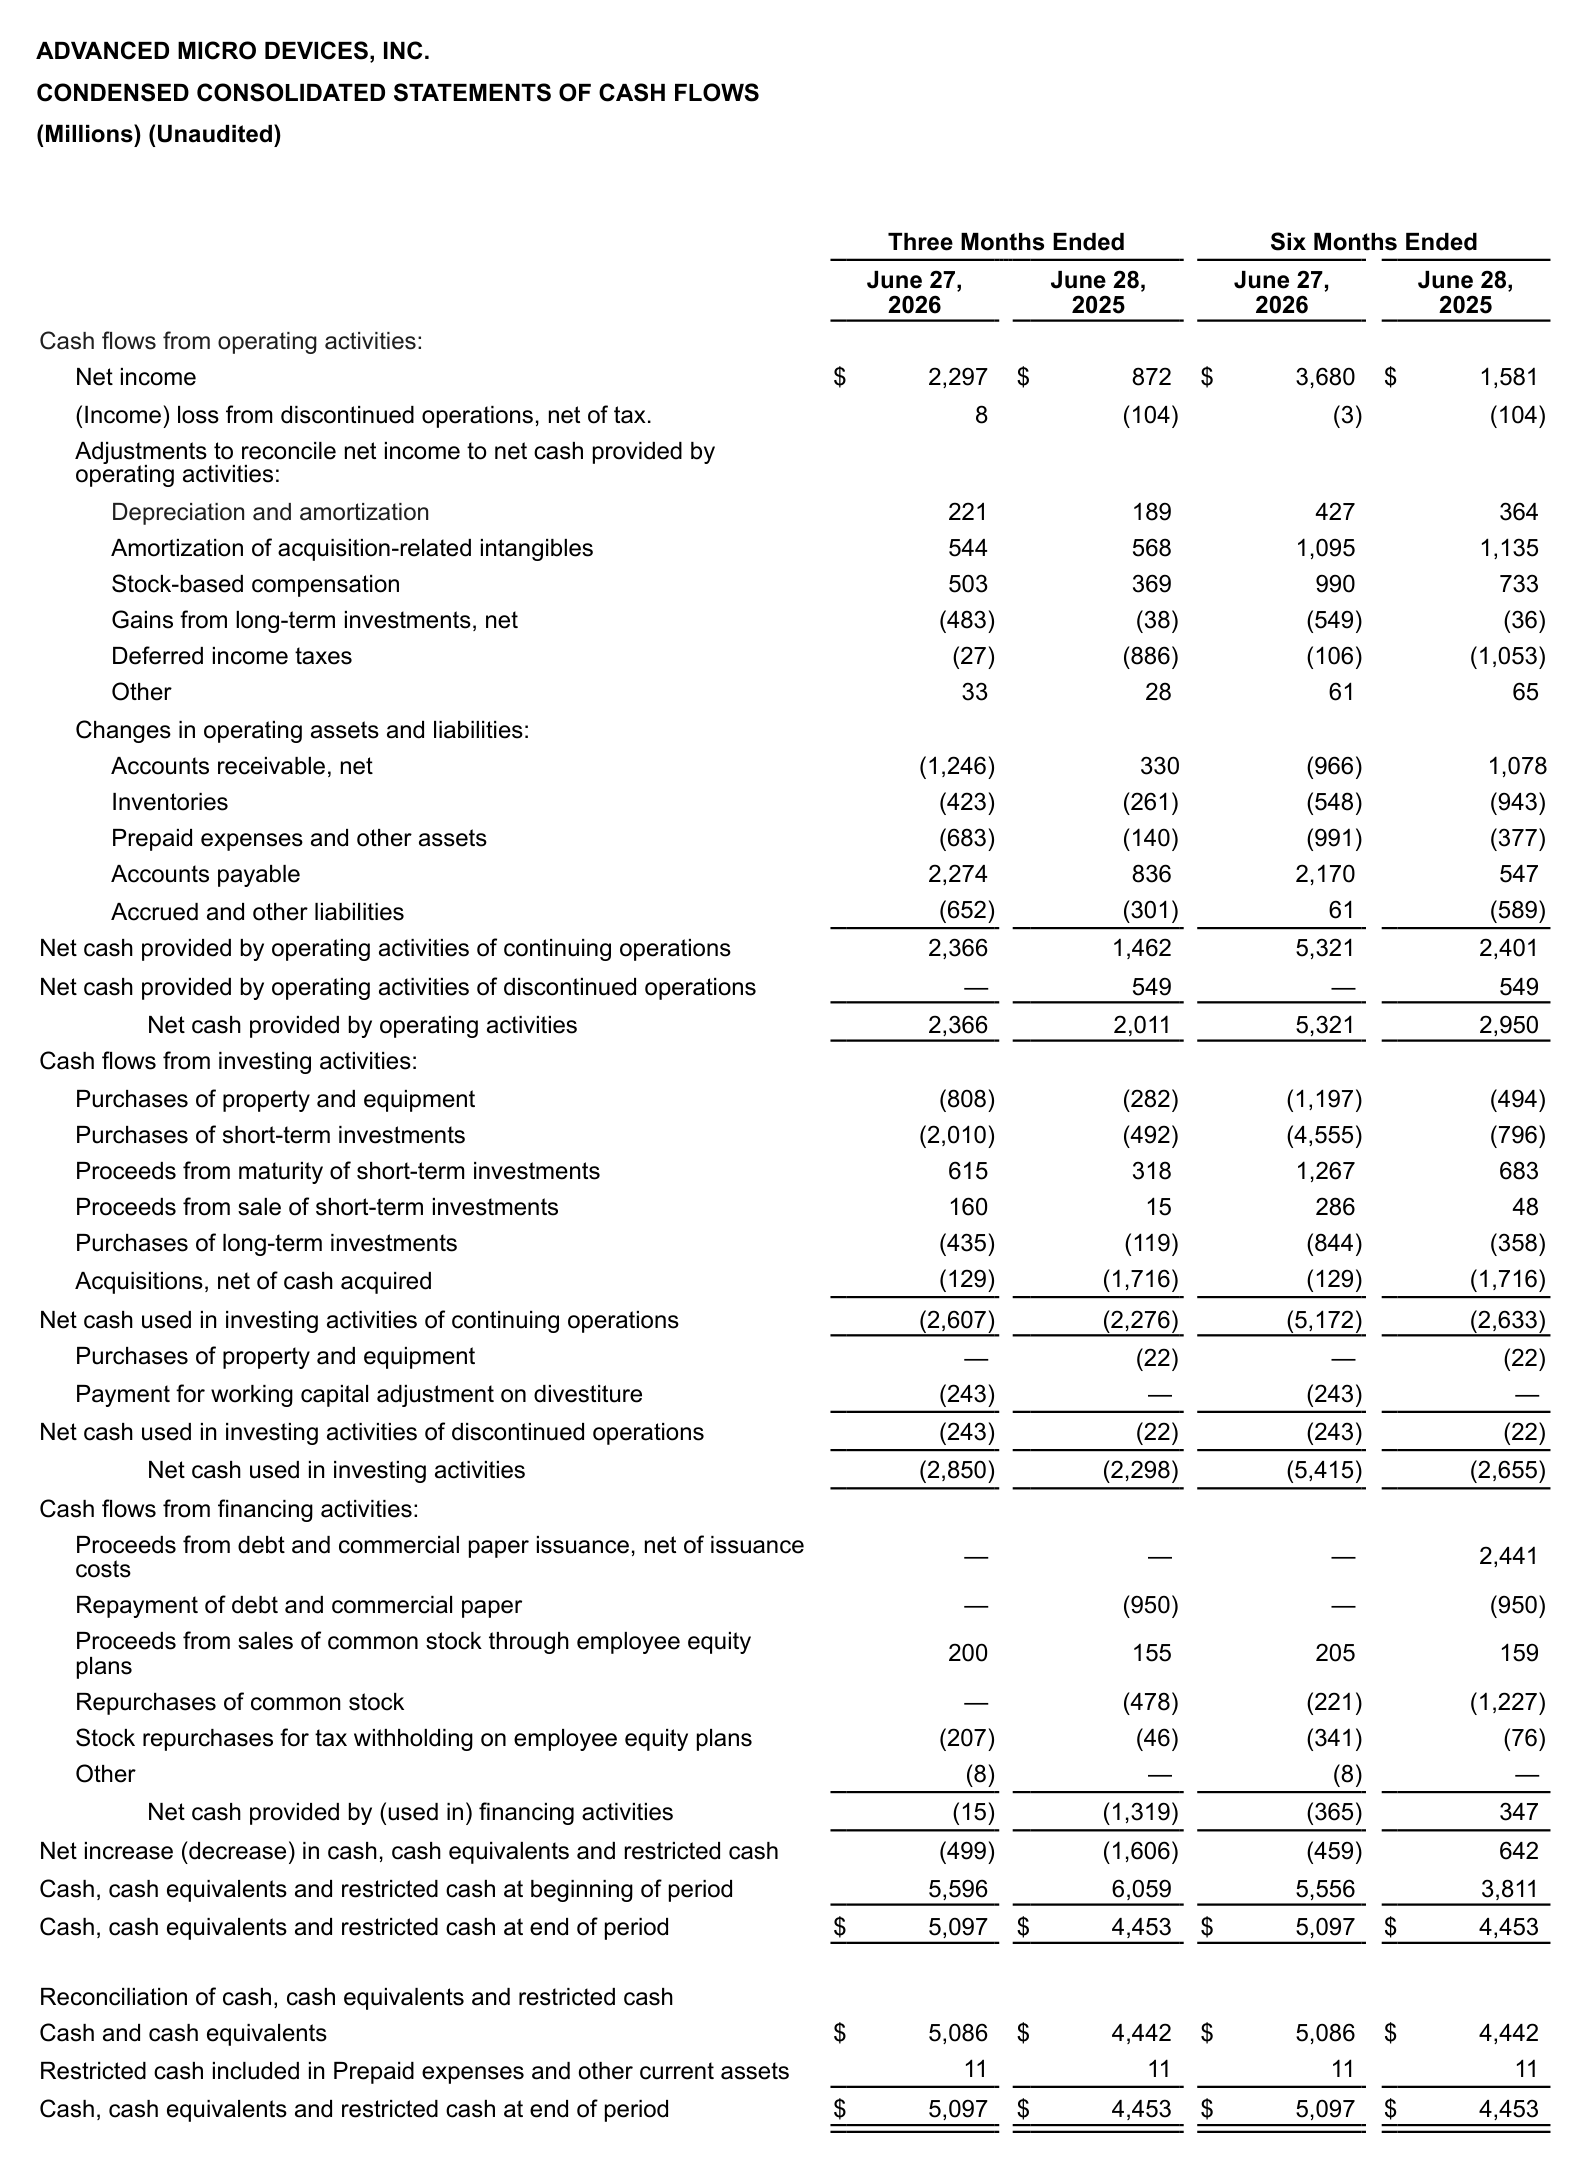
AMD condensed consolidated statement of cash flows, first half of 2026
Cash flow points the same direction. Quarterly capital expenditures went from $282 million in Q2 2025 to $389 million in Q1 2026 and $808 million this quarter, a 2.9 times increase in a year. Free cash flow fell from $2,566 million last quarter to $1,558 million, down -39%. Inventories rose from $7,920 million at year-end to $8,468 million.
US Semiconductor Demand and Order Backlog
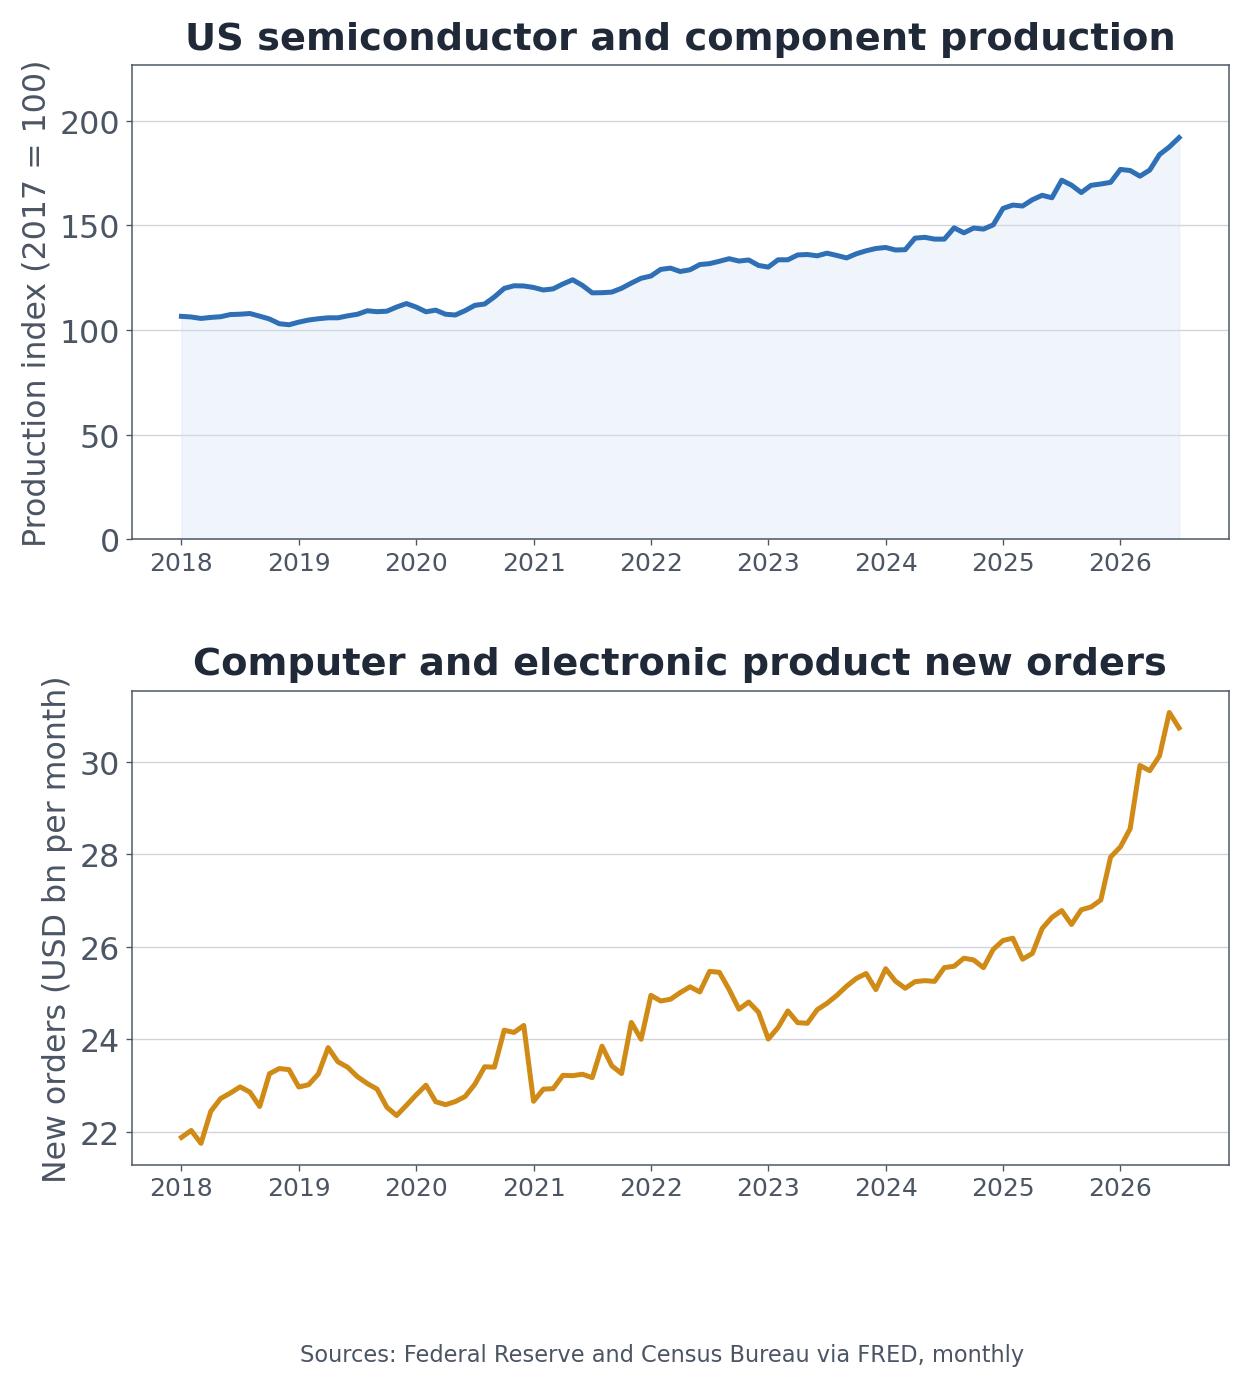
US semiconductor and component production index and computer and electronic product new orders (Federal Reserve and Census Bureau)
AMD is not moving alone. Official series put the quarter in context.
The US industrial production index for semiconductors and other electronic components sits above 170 in 2026 against a 2017 base of 100. New orders for computers and electronic products run near $28.5 billion a month, well above pre-pandemic levels.
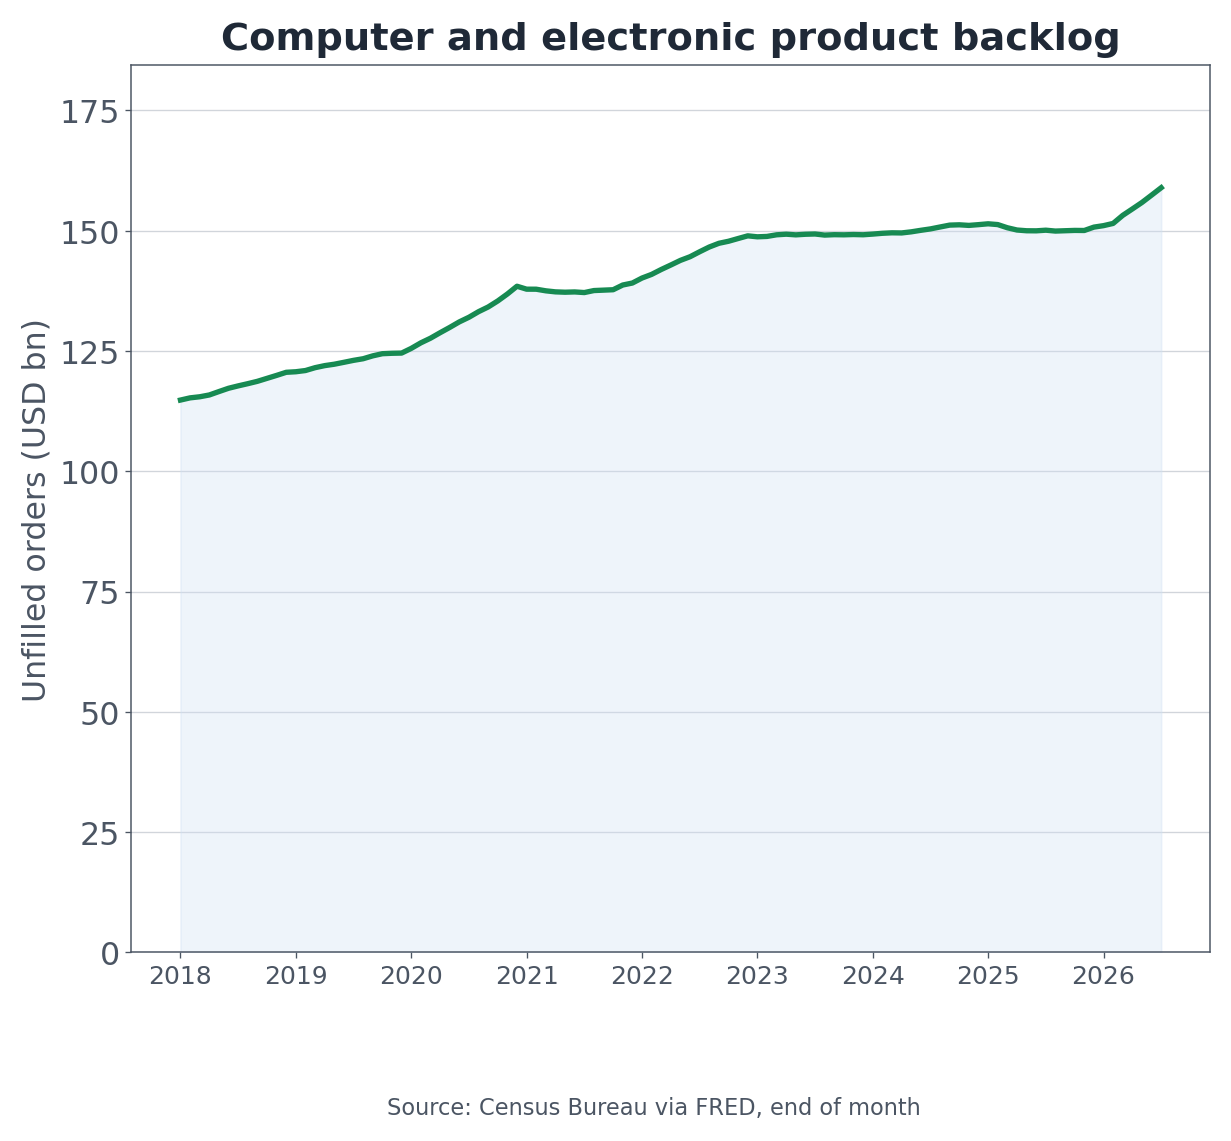
US computer and electronic product unfilled orders (Census Bureau)
The backlog is the more telling series. Unfilled orders stand near $151.5 billion at month end. Orders are on the books that suppliers have not yet filled. When supply trails demand, pricing power shifts toward whoever makes the product, and that environment sits behind a Data Center segment moving from a negative margin to 31% in one year.
These indexes measure the whole industry, so they say nothing about AMD's share of it. Nvidia and Broadcom moved in the same conditions.
Supply constraints belong in the picture as well. AMD is fabless, and leading-edge capacity is allocated by the foundry. A rising backlog means there is somewhere to sell, and it also means competing for a place to build. For a company whose Data Center revenue doubled in a year, the next bottleneck may be secured capacity rather than demand.
Client and Gaming Margin Fell While Revenue Rose
One segment went the other way while the rest of the company improved. Client and Gaming revenue rose +6% but operating income fell from $767 million to $582 million. The margin went from 21.2% to 15.2%, a decline of six percentage points, which the company attributed to operating expense growth outpacing the revenue increase.
Inside the segment the two halves diverge. Client revenue was $3,062 million, up +23% on Ryzen demand. Gaming was $779 million, down -31% as semi-custom console volume declined.
Semi-custom follows console generation cycles, and volumes thin out as a console ages. This segment is a third of company revenue but contributes $582 million of operating income, a little over a quarter of what Data Center produced.
Research and development belongs alongside it. Second-quarter R&D was $2,528 million, up +33% year over year, and $4,925 million for the first six months, up 36%. The company cites higher employee-related costs from headcount growth. Money earned in Data Center funds development across the whole company, and that weight lands mostly in the unallocated line rather than in any segment margin.
AMD Valuation vs. Nvidia, Broadcom and Marvell
Lining up multiples across the group shows what the market is paying for.
Company
Ticker
P/E
P/S
AMD
AMD
121.9x
18.9x
Nvidia
NVDA
29.1x
18.4x
Broadcom
AVGO
45.6x
19.1x
Marvell Technology
MRVL
75.1x
20.4x
Intel
INTC
not meaningful
8.8x
The Nvidia comparison is the one that stands out. Price to sales is 18.9x for AMD and 18.4x for Nvidia, essentially the same. Price to earnings is 121.9x against 29.1x, more than four times apart. The market pays a similar price for a dollar of revenue at both companies and a much higher price for a dollar of AMD earnings. That is a bet that AMD's revenue converts to profit at a materially higher rate ahead.
Intel has no trailing twelve-month profit, so no P/E is produced. Marvell sits between AMD and Nvidia at 75.1x.
AMD's forward price to earnings is 43x. The distance between that and the trailing 121.9x is the earnings growth the market is underwriting.
One multiple does not settle this. Put the five companies' revenue on the same footing over the same three years, and the growth the market is paying for looks different at each of them.
Peer quarterly revenue index, 12 quarters ago = 100, on each company's own fiscal quarter-ends (base quarter is fall 2023)
With the quarter twelve back set to 100, Nvidia stands at 531 and Broadcom at 318. AMD is at 199, Marvell at 193, Intel at 114. The doubling of Data Center revenue this quarter reads differently against that path: over three years AMD has been following the two leaders rather than running with them. That is what makes the matching price-to-sales multiple heavy. The market pays the same for a dollar of revenue at AMD and Nvidia, and the index gap is 2.7 to 1.
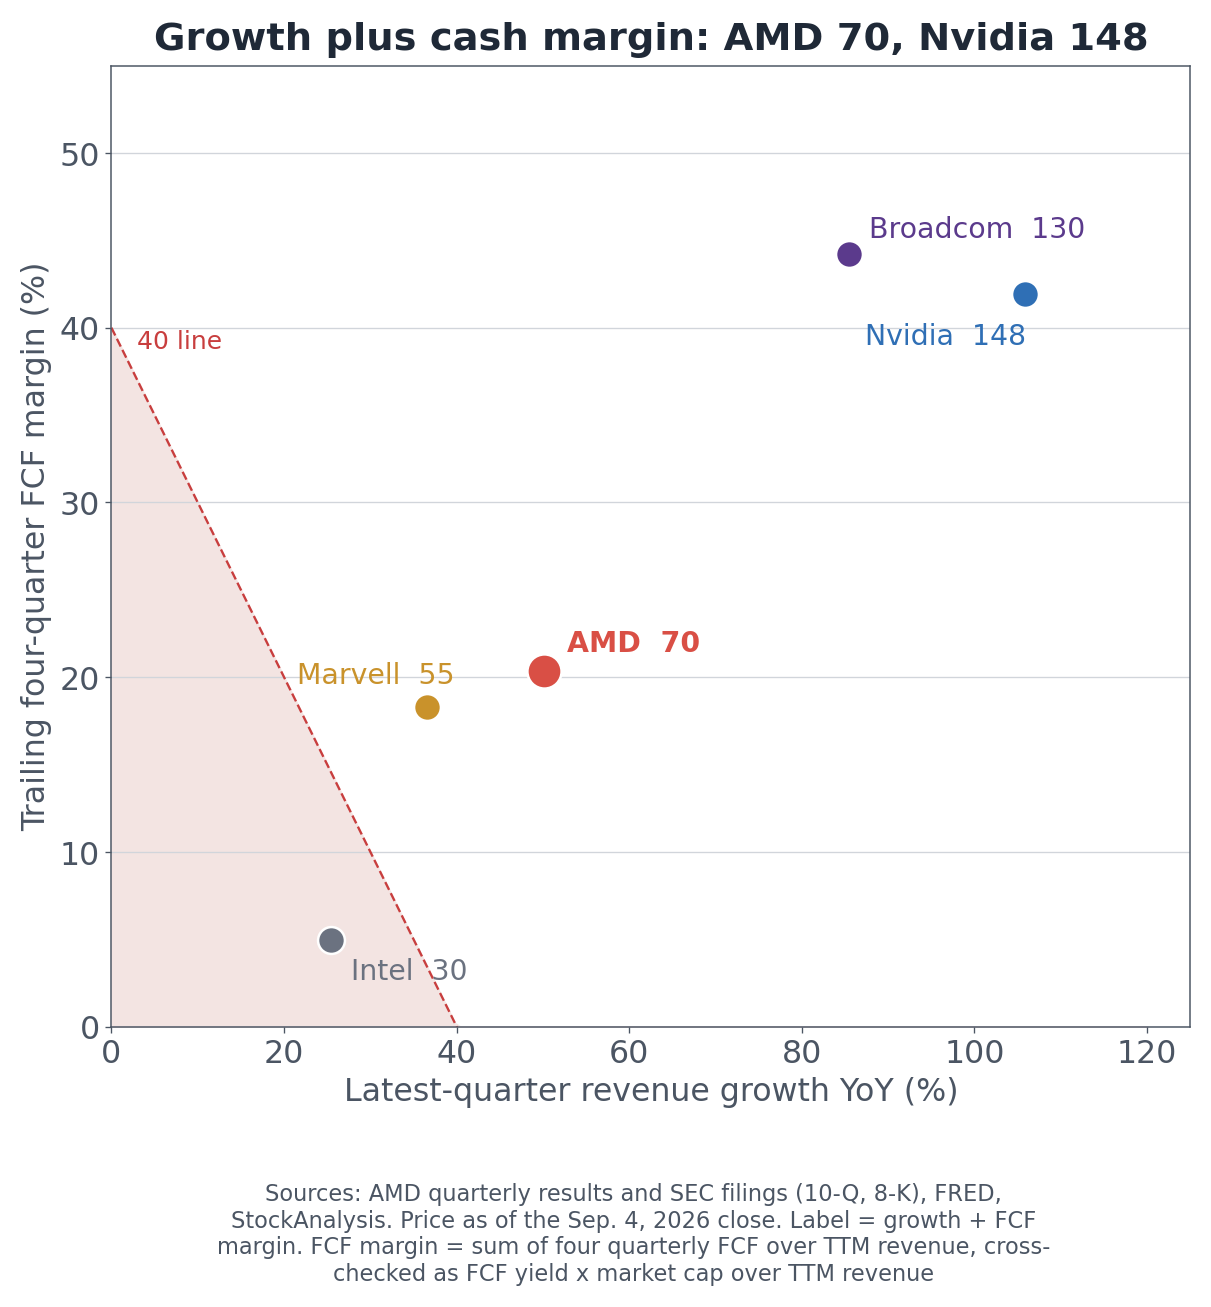
The yardstick has to fit the type first. A company growing revenue +50.1% in its latest quarter with a sales multiple above the peer median belongs in the high-growth premium bucket, and that bucket gets three tests: the Rule of 40, which adds cash margin to growth; a growth-adjusted multiple, which divides price to sales by the growth rate; and the direction of earnings estimate revisions. A mature large cap would be tested on return on capital and shareholder returns instead.
Latest-quarter revenue growth against trailing four-quarter free cash flow margin. The label is the sum of the two; the dashed line marks a total of 40
Company
Revenue growth
FCF margin
Rule of 40
Growth-adjusted P/S
Next-year EPS, 90-day change
Revisions up / down, 30 days
AMD
+50.1%
20.3%
70
0.38
+19.2%
33 / 3
Nvidia
+105.8%
41.9%
148
0.17
+22.4%
39 / 0
Broadcom
+85.5%
44.2%
130
0.22
-0.1%
6 / 1
Marvell Technology
+36.5%
18.3%
55
0.56
+8.9%
28 / 1
Intel
+25.4%
5.0%
30
0.35
+31.6%
33 / 0
Only Intel misses the Rule of 40. AMD clears it at 70, but Nvidia at 148 and Broadcom at 130 are in a different league, and the gap comes from cash margin rather than growth. AMD's trailing four-quarter free cash flow margin is 20.3%, roughly half of Nvidia's 41.9% and Broadcom's 44.2%. The 2.9x jump in capital expenditures and the August note issuance from earlier in this piece show up right here.
The growth-adjusted multiple reads the other way. Dividing price to sales by the growth rate gives AMD 0.38, Nvidia 0.17 and Broadcom 0.22. The market pays the same for a dollar of revenue, but once the speed of that revenue is included, AMD costs close to twice as much. Only Marvell at 0.56 sits above it.
Revisions favor AMD. Next-year EPS estimates moved +19.2% over 90 days, with 33 upward and 3 downward revisions in the past 30 days. Nvidia at +22.4% and Intel at +31.6% point the same way; Broadcom at -0.1% was the one standing still. These are aggregated sell-side estimates and can differ from the adjusted basis each company reports on.
Sources: aggregated market data and company filings. The bucket is defined by revenue growth above 20% and a sales multiple above the industry. Peer trailing periods differ from AMD's by up to two months because of fiscal quarter-ends.
Is AMD Stock Expensive? Only One Band Holds Up
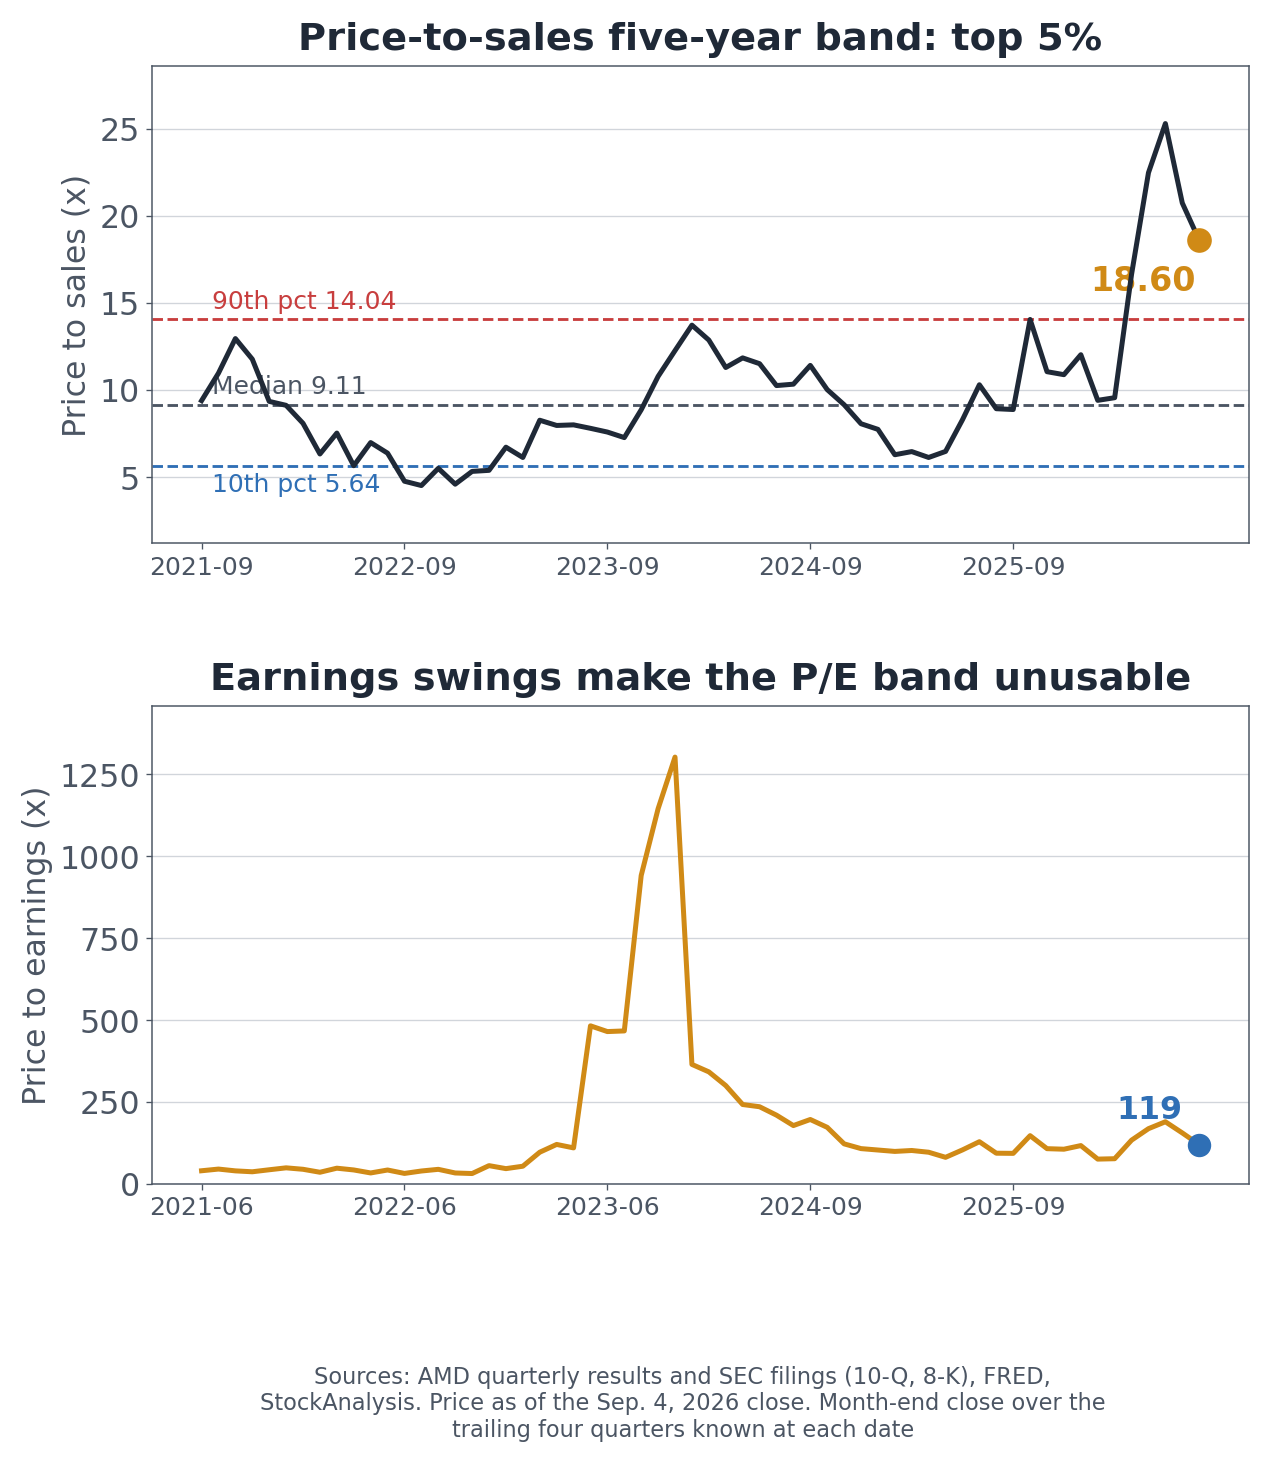
AMD price-to-sales five-year band and price-to-earnings path, using month-end closes and the trailing four quarters known at each date
Plotting the multiples across 60 months of month-end closes, each paired with the trailing four quarters available at that date, ran into a problem worth reporting. The fiscal calendar was mapped in code and checked against aggregator figures for all three ratios before use.
Price to earnings ranged from 31x to 1,303x over five years, an amplitude of 42 times. Price to book spanned 15 times. At that spread, band boundaries stop meaning anything. AMD's earnings went from $854 million in 2023 to $4,335 million in 2025, so the denominator changed shape entirely.
One band holds up: price to sales, with an amplitude of 5.6 times. The current 18.6x sits in the top 5% of five years against a median of 9.11x, almost exactly double.
The path shows when it moved. Price to sales was 8.9x in August 2025, reached 25.3x by June 2026, and stands at 18.6x now. The multiple roughly tripled in a year and then gave back a quarter of that.
The average analyst price target is $613.84, +28.5% above the current price.
What to Watch in the Third Quarter
AMD third-quarter 2026 outlook, from the company's earnings release
AMD reports the third quarter in early November. Three things matter.
The first is whether Data Center revenue fills the guidance. The company put third-quarter revenue near $13 billion and the chief financial officer said Data Center sales accelerate in the second half. From $6,718 million this quarter, how much further it goes is the test of that statement.
The second is where other income settles. This quarter's $598 million came from an investment marking up when it listed publicly, and that does not repeat on a schedule. If the line returns toward its $53 million six-quarter average, net income growth prints far lower than 163% even with operating results intact.
The third is where the $4.75 billion goes. The third-quarter cash flow statement will show the pace of the up-to-$5.0 billion investment commitment through capital expenditures and investing lines. Interest expense belongs in the same view: it has run near $37 million a quarter, and debt just went up 2.5 times.
AMD rebuilt itself around Data Center and the numbers are unambiguous on that. At the same time, this quarter's net income included a gain that brought no cash, and the company borrowed to fund what comes next while its revenue multiple sits at the top of a five-year range. Those facts occupy the same page.
Figures come from AMD SEC filings, including the Form 10-Q for the quarter ended June 27, 2026 and the Form 8-K filed August 17, 2026 covering the senior note offering, together with the company's quarterly earnings release and presentation. Industry series are from the Federal Reserve and the Census Bureau via FRED, and market data from StockAnalysis. Quarterly figures were rebuilt from XBRL with a continuity check, and fourth-quarter values were derived from annual totals where quarterly tags were absent. Valuation multiples pair month-end closing prices with the trailing four quarters publicly available at each date, mapped to AMD's 52- and 53-week fiscal calendar in code and verified against aggregator values for price to earnings, price to sales, and price to book. Share price data is as of the September 4, 2026 close. Peer growth, free cash flow and estimate-revision figures are from StockAnalysis and aggregated sell-side estimates as of the same date. This article is for information only and is not investment advice.