Medtronic (MDT): record revenue growth, flat earnings per share
Medtronic (NYSE: MDT) closed fiscal 2026 with revenue of $36.36 billion, up +8.4% as reported and +5.8% organic, the fastest annual growth the company has posted in a decade. This MDT stock analysis works through what produced that growth, why non-GAAP earnings per share still sits where it did four years ago, what the MiniMed spin-off changes, how the shares are priced against Boston Scientific, Abbott, Stryker, and Becton Dickinson, and what the fiscal 2027 guidance quietly assumes.
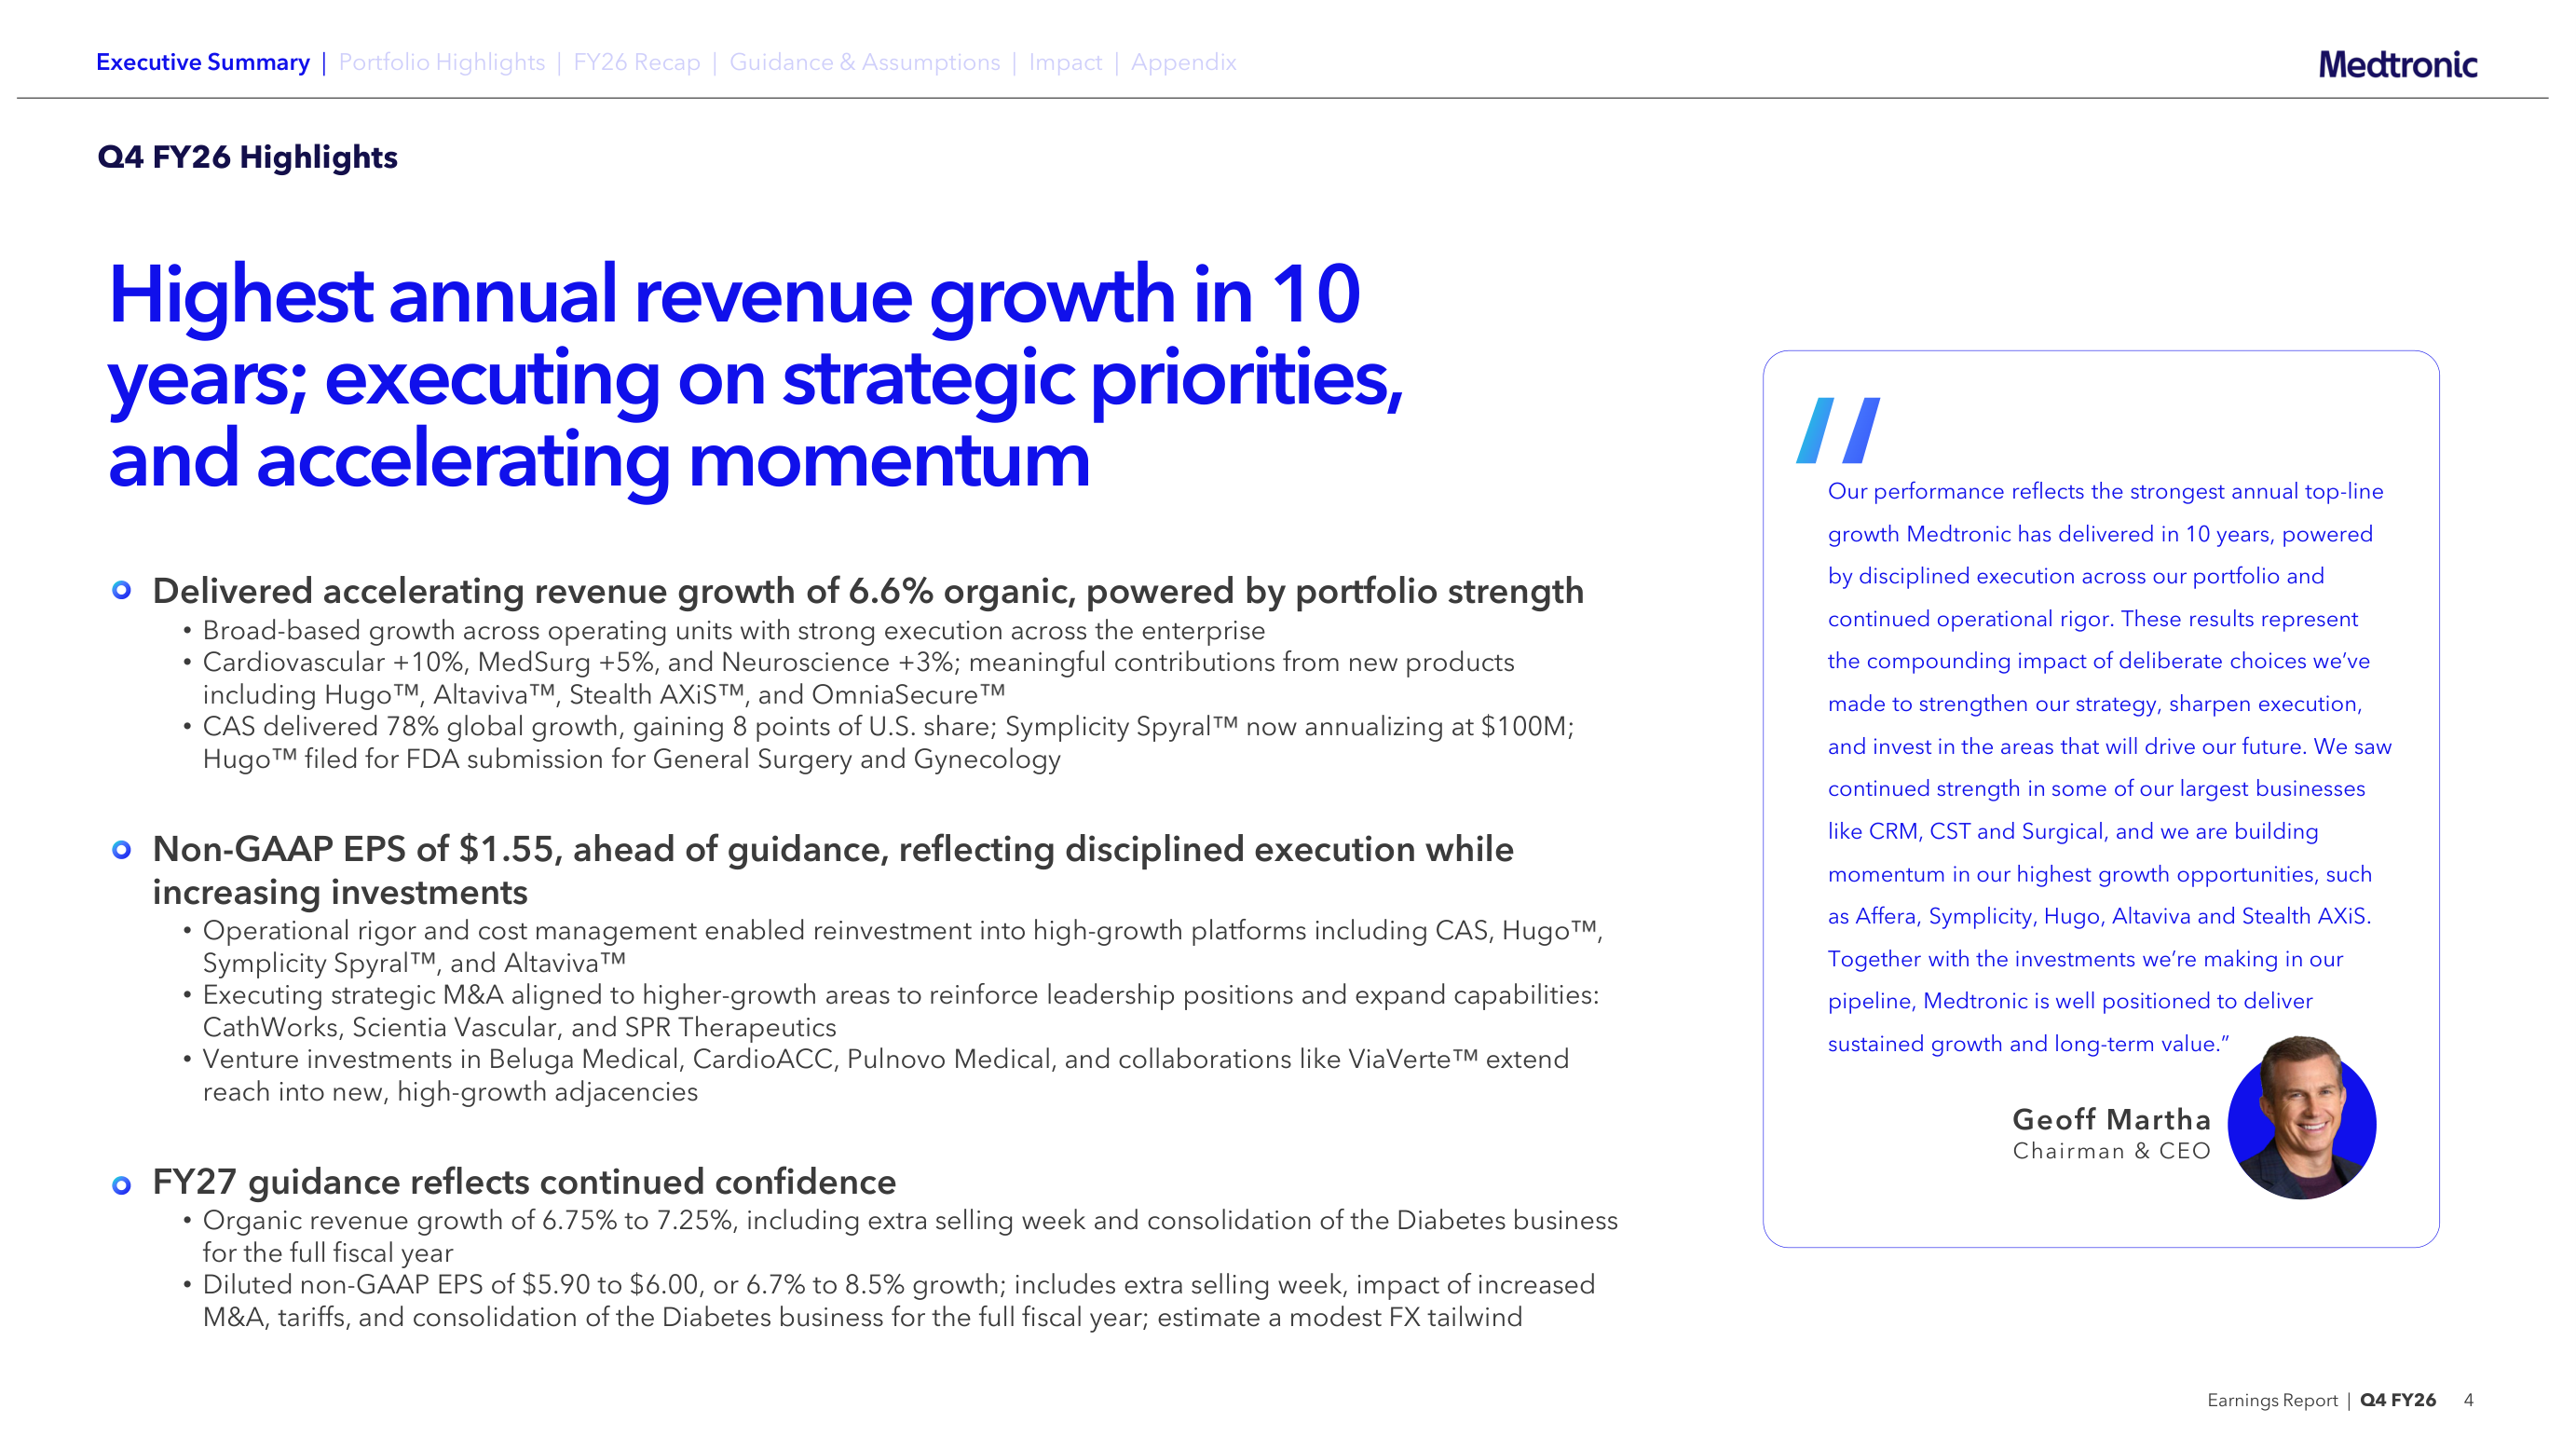
Start with the sentence Medtronic itself put in large type on page 4 of its June 3, 2026 earnings deck: "Highest annual revenue growth in 10 years." Chief executive Geoff Martha repeated it in the quote alongside.
Medtronic Q4 FY2026 earnings presentation, cover (source: company IR, June 3, 2026)
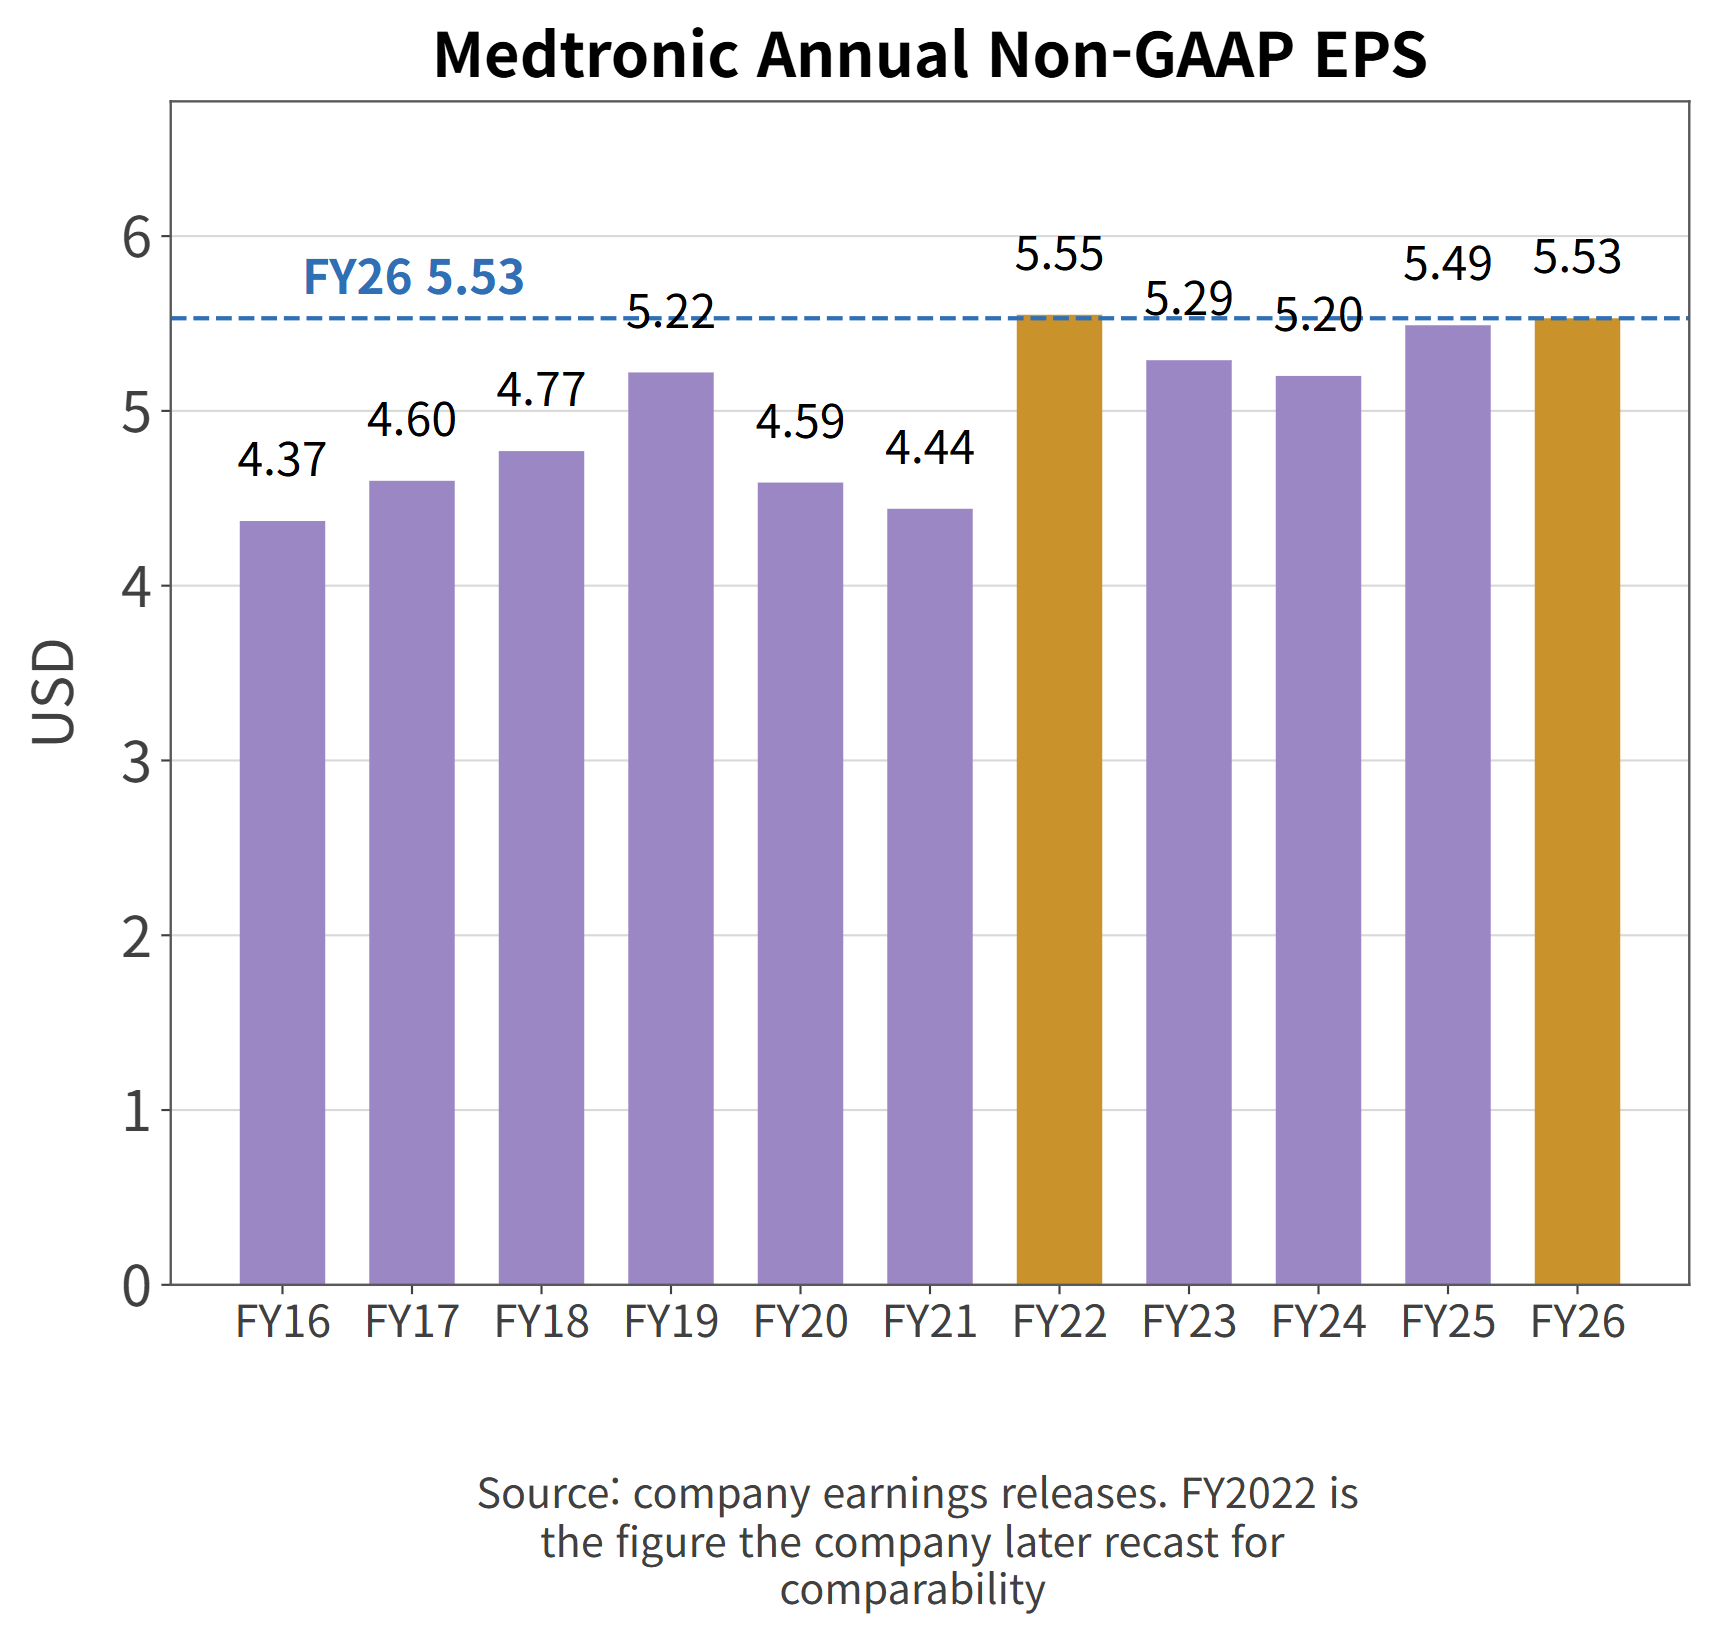
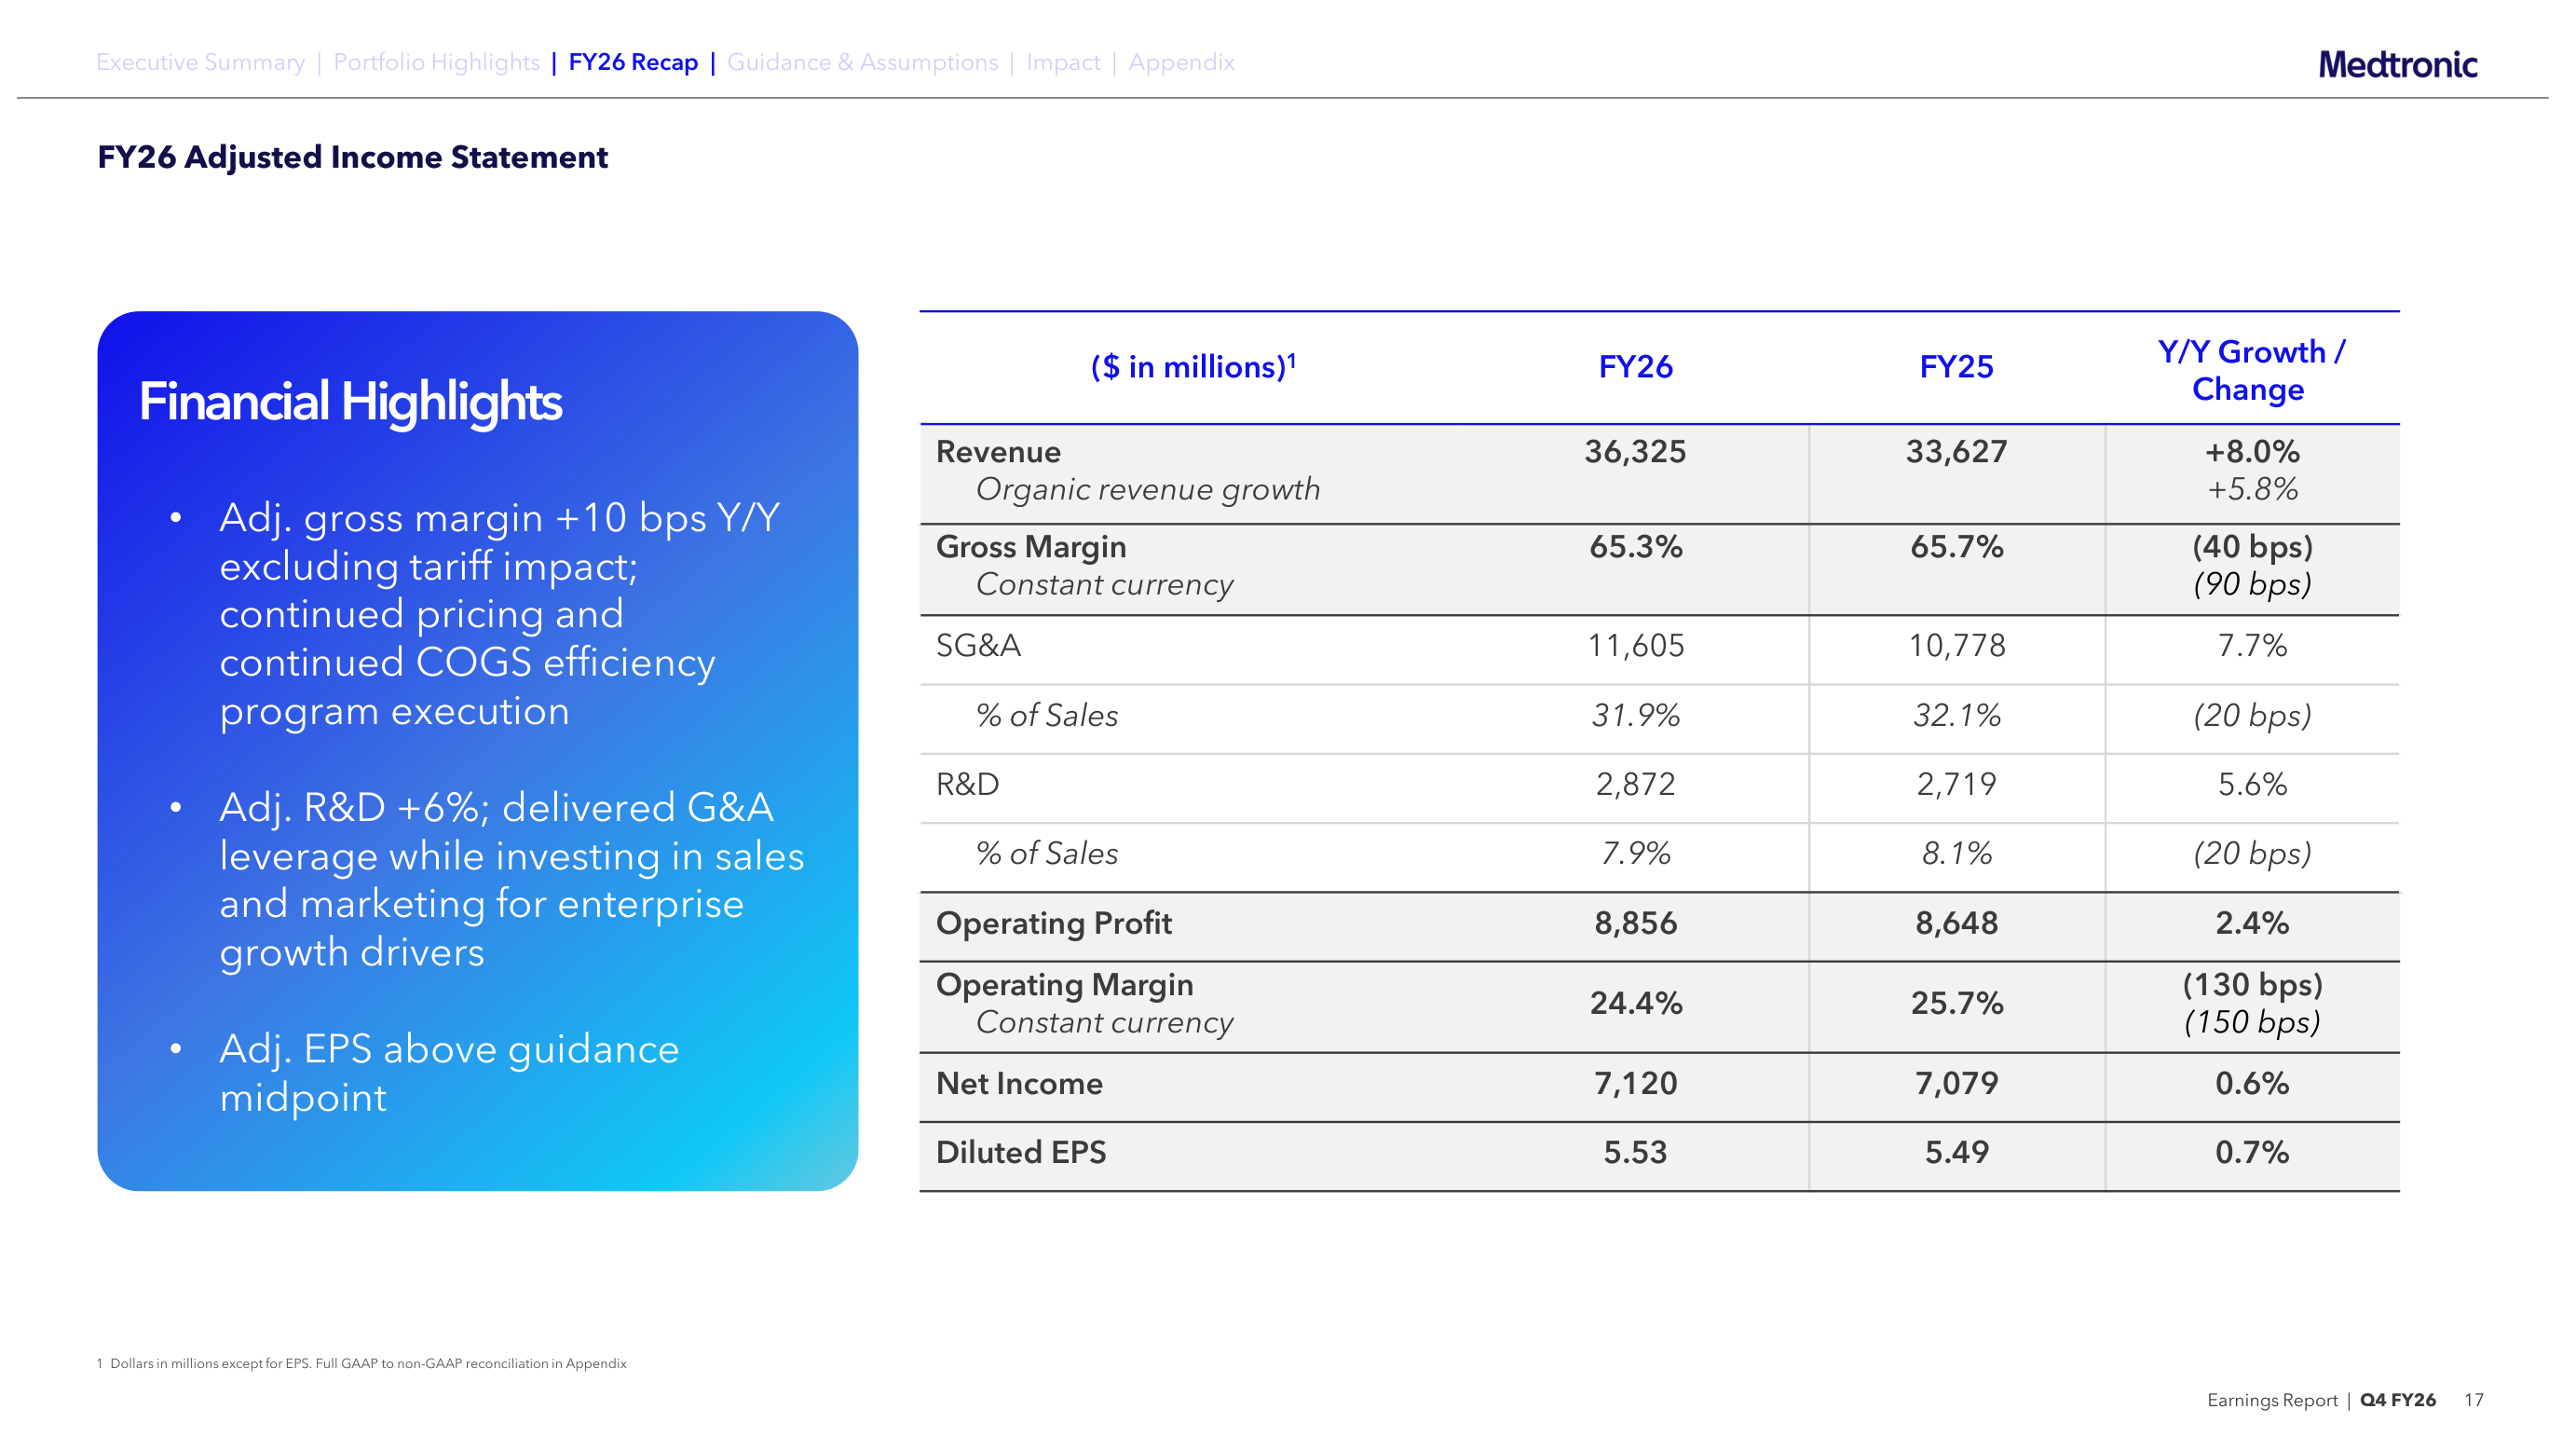
Turn to page 17 of the same deck and a different number appears. Non-GAAP diluted EPS of $5.53, up +0.7%, and down -2.0% once currency is stripped out. Four years earlier, in fiscal 2022, the figure was $5.55.
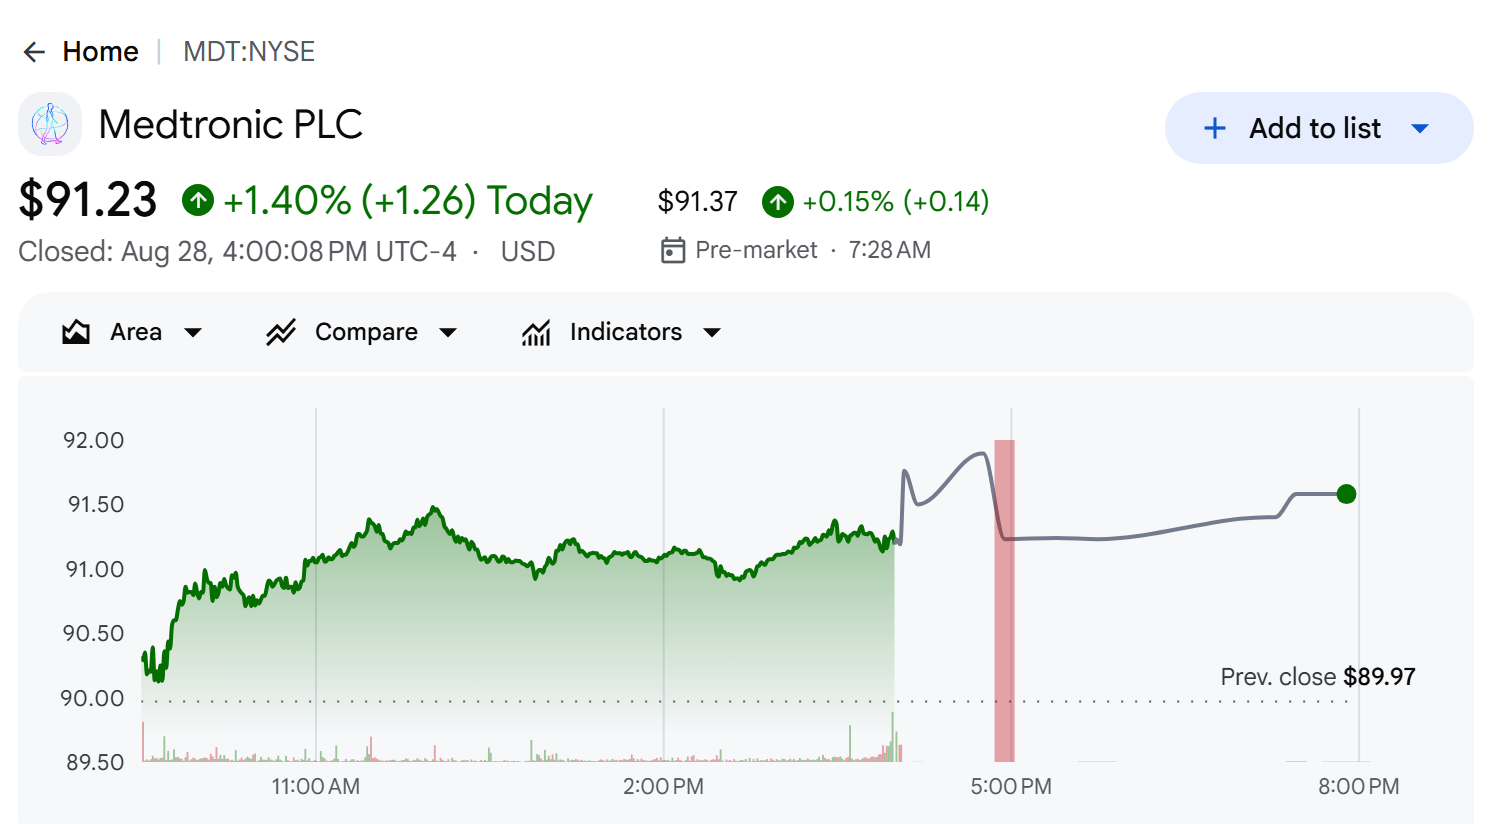
Medtronic (MDT) intraday chart at the August 28, 2026 close
Medtronic Stock Overview: What Does MDT Do?
Medtronic sells devices that go into operating rooms and cath labs. Pacemakers and defibrillators for the heart, navigation and stimulation systems for the brain and spine, staplers and energy instruments for surgery, and insulin pumps for diabetes. Four lines cover nearly all of it.
The line the company put at the top of page 4 of its Q4 deck (source: company IR)
The company started in a Minneapolis garage in 1949, where founder Earl Bakken built the first wearable cardiac pacemaker. Headquarters sit in Galway, Ireland today, with about 95,000 employees selling into more than 150 countries. The fiscal year ends on the last Friday in April, which is why fiscal 2026 closed on April 24, 2026.
How Medtronic Makes Money: Product Lines and Revenue Mix
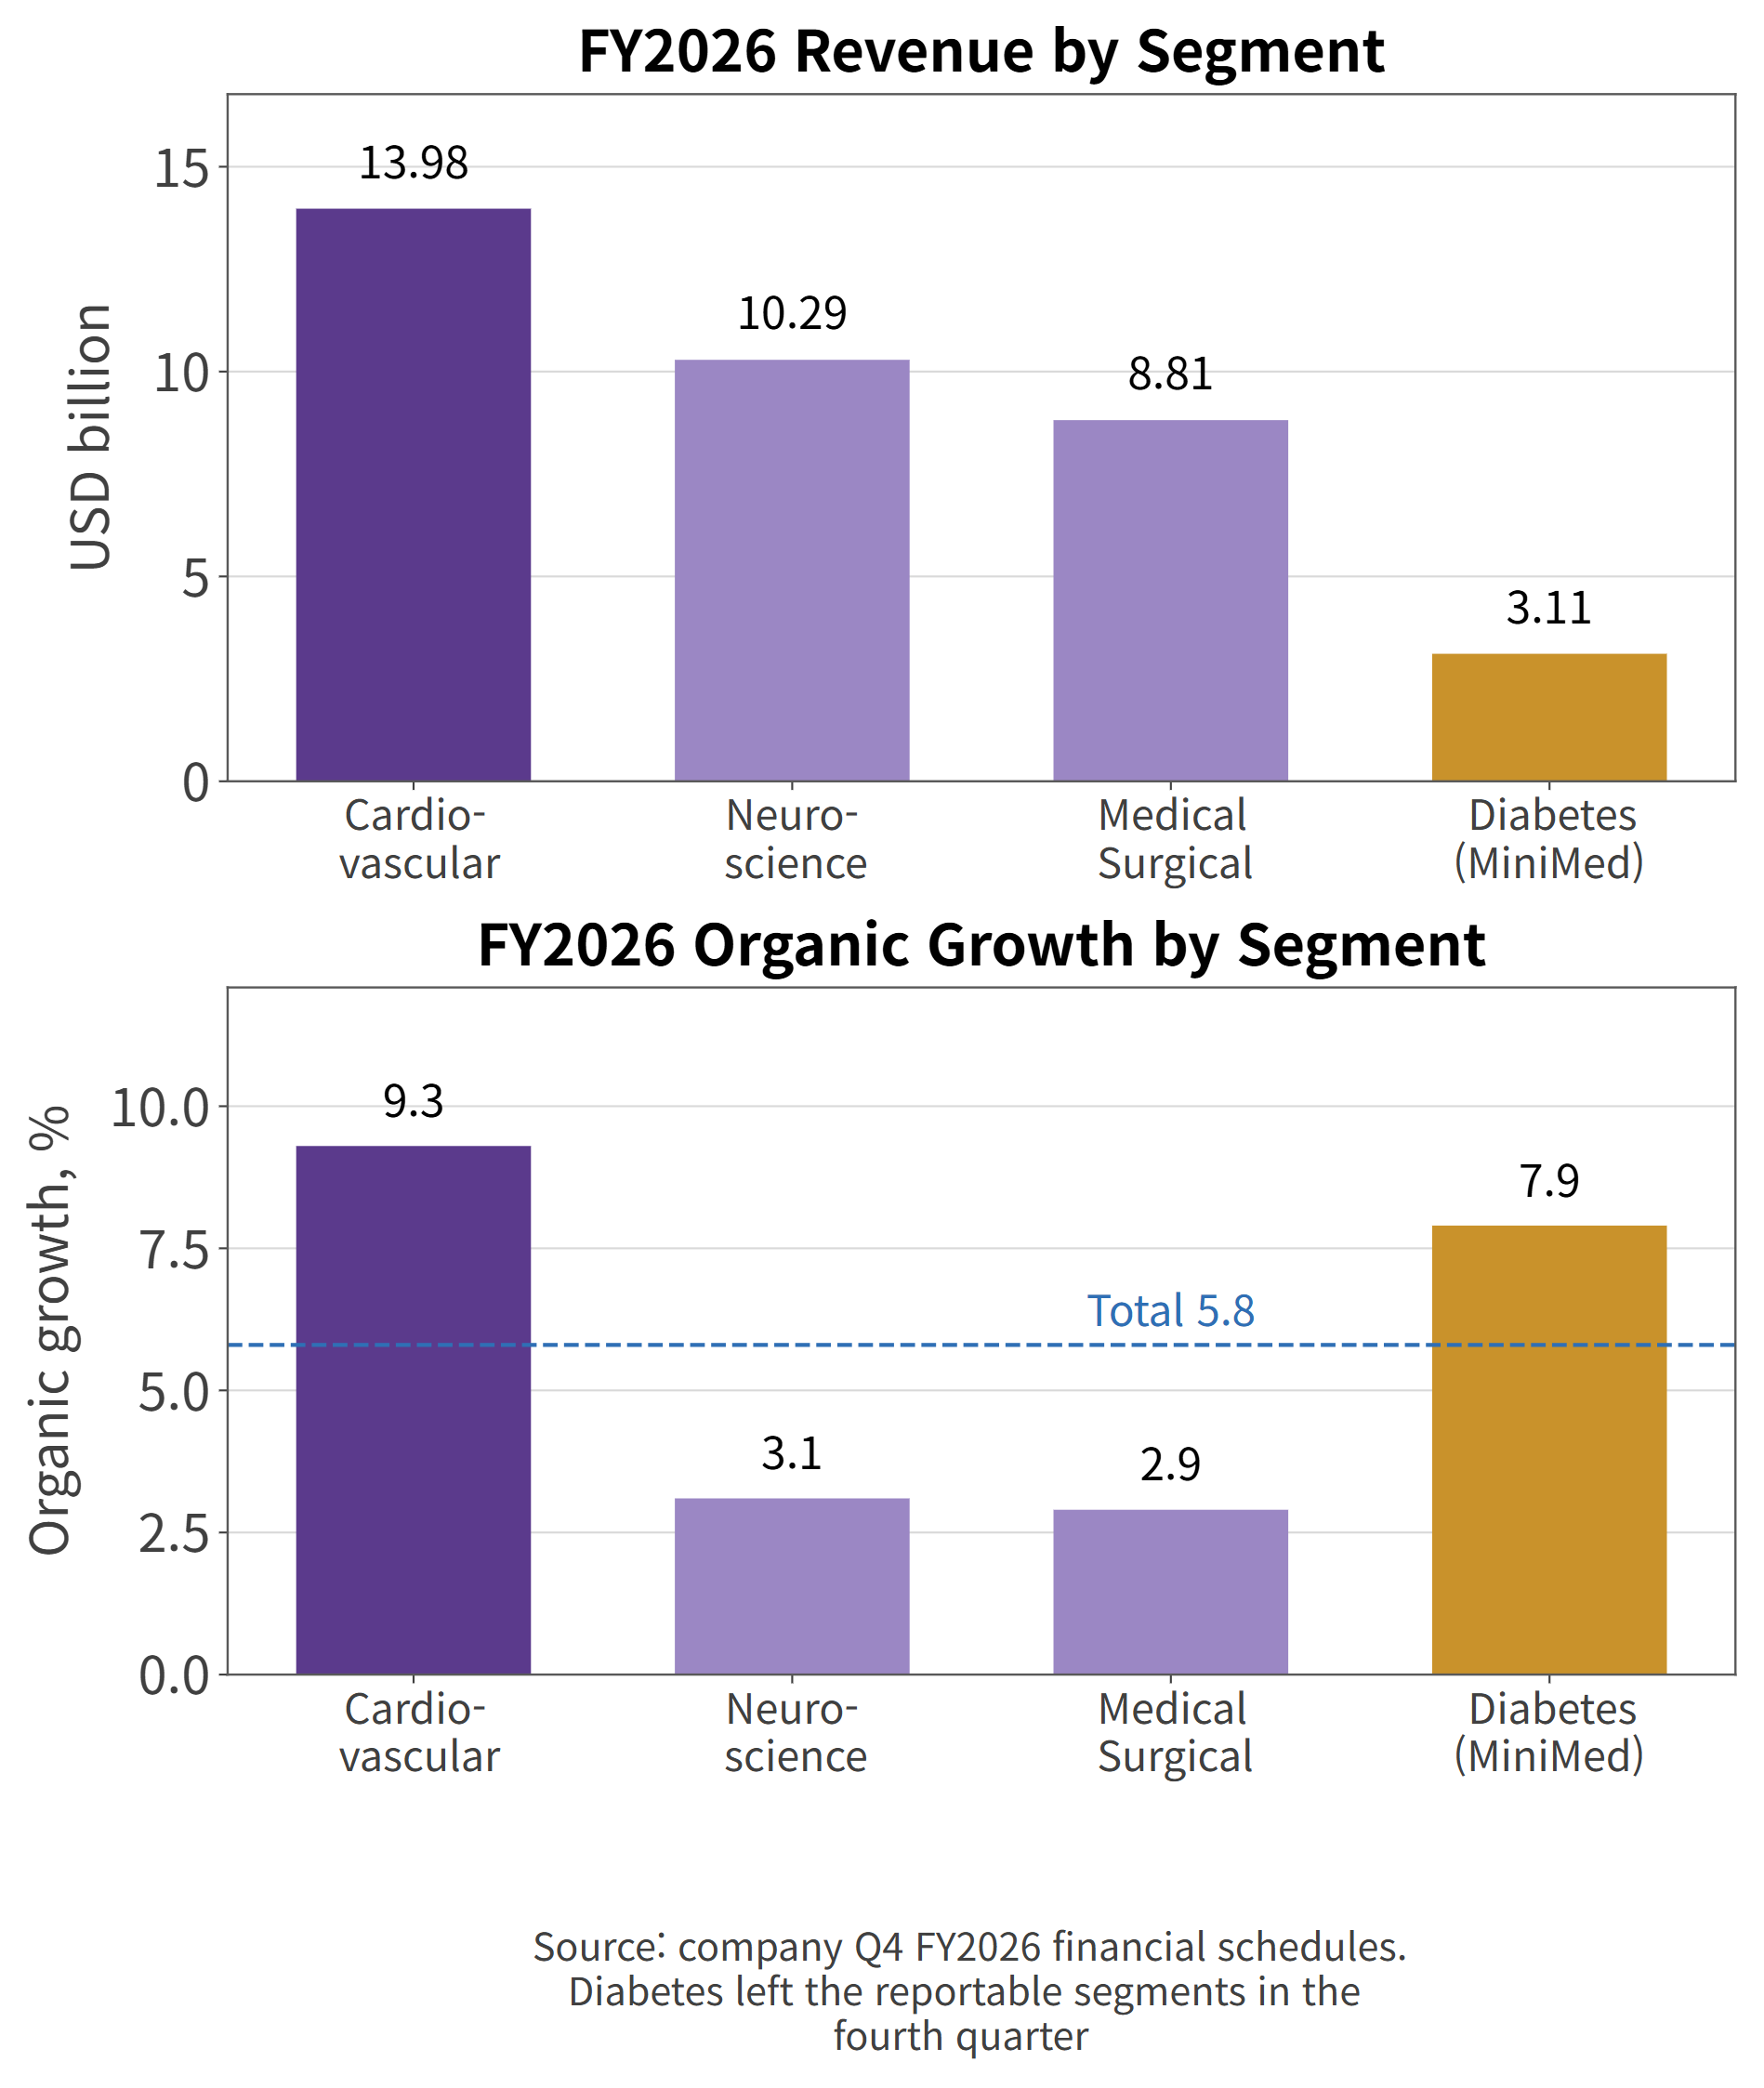
Cardiovascular is the largest piece at $13.98 billion in fiscal 2026, or 38.4% of the total. Inside it, Cardiac Rhythm and Heart Failure alone brings in $7.50 billion, followed by Structural Heart and Aortic at $3.82 billion and Coronary and Peripheral Vascular at $2.66 billion.
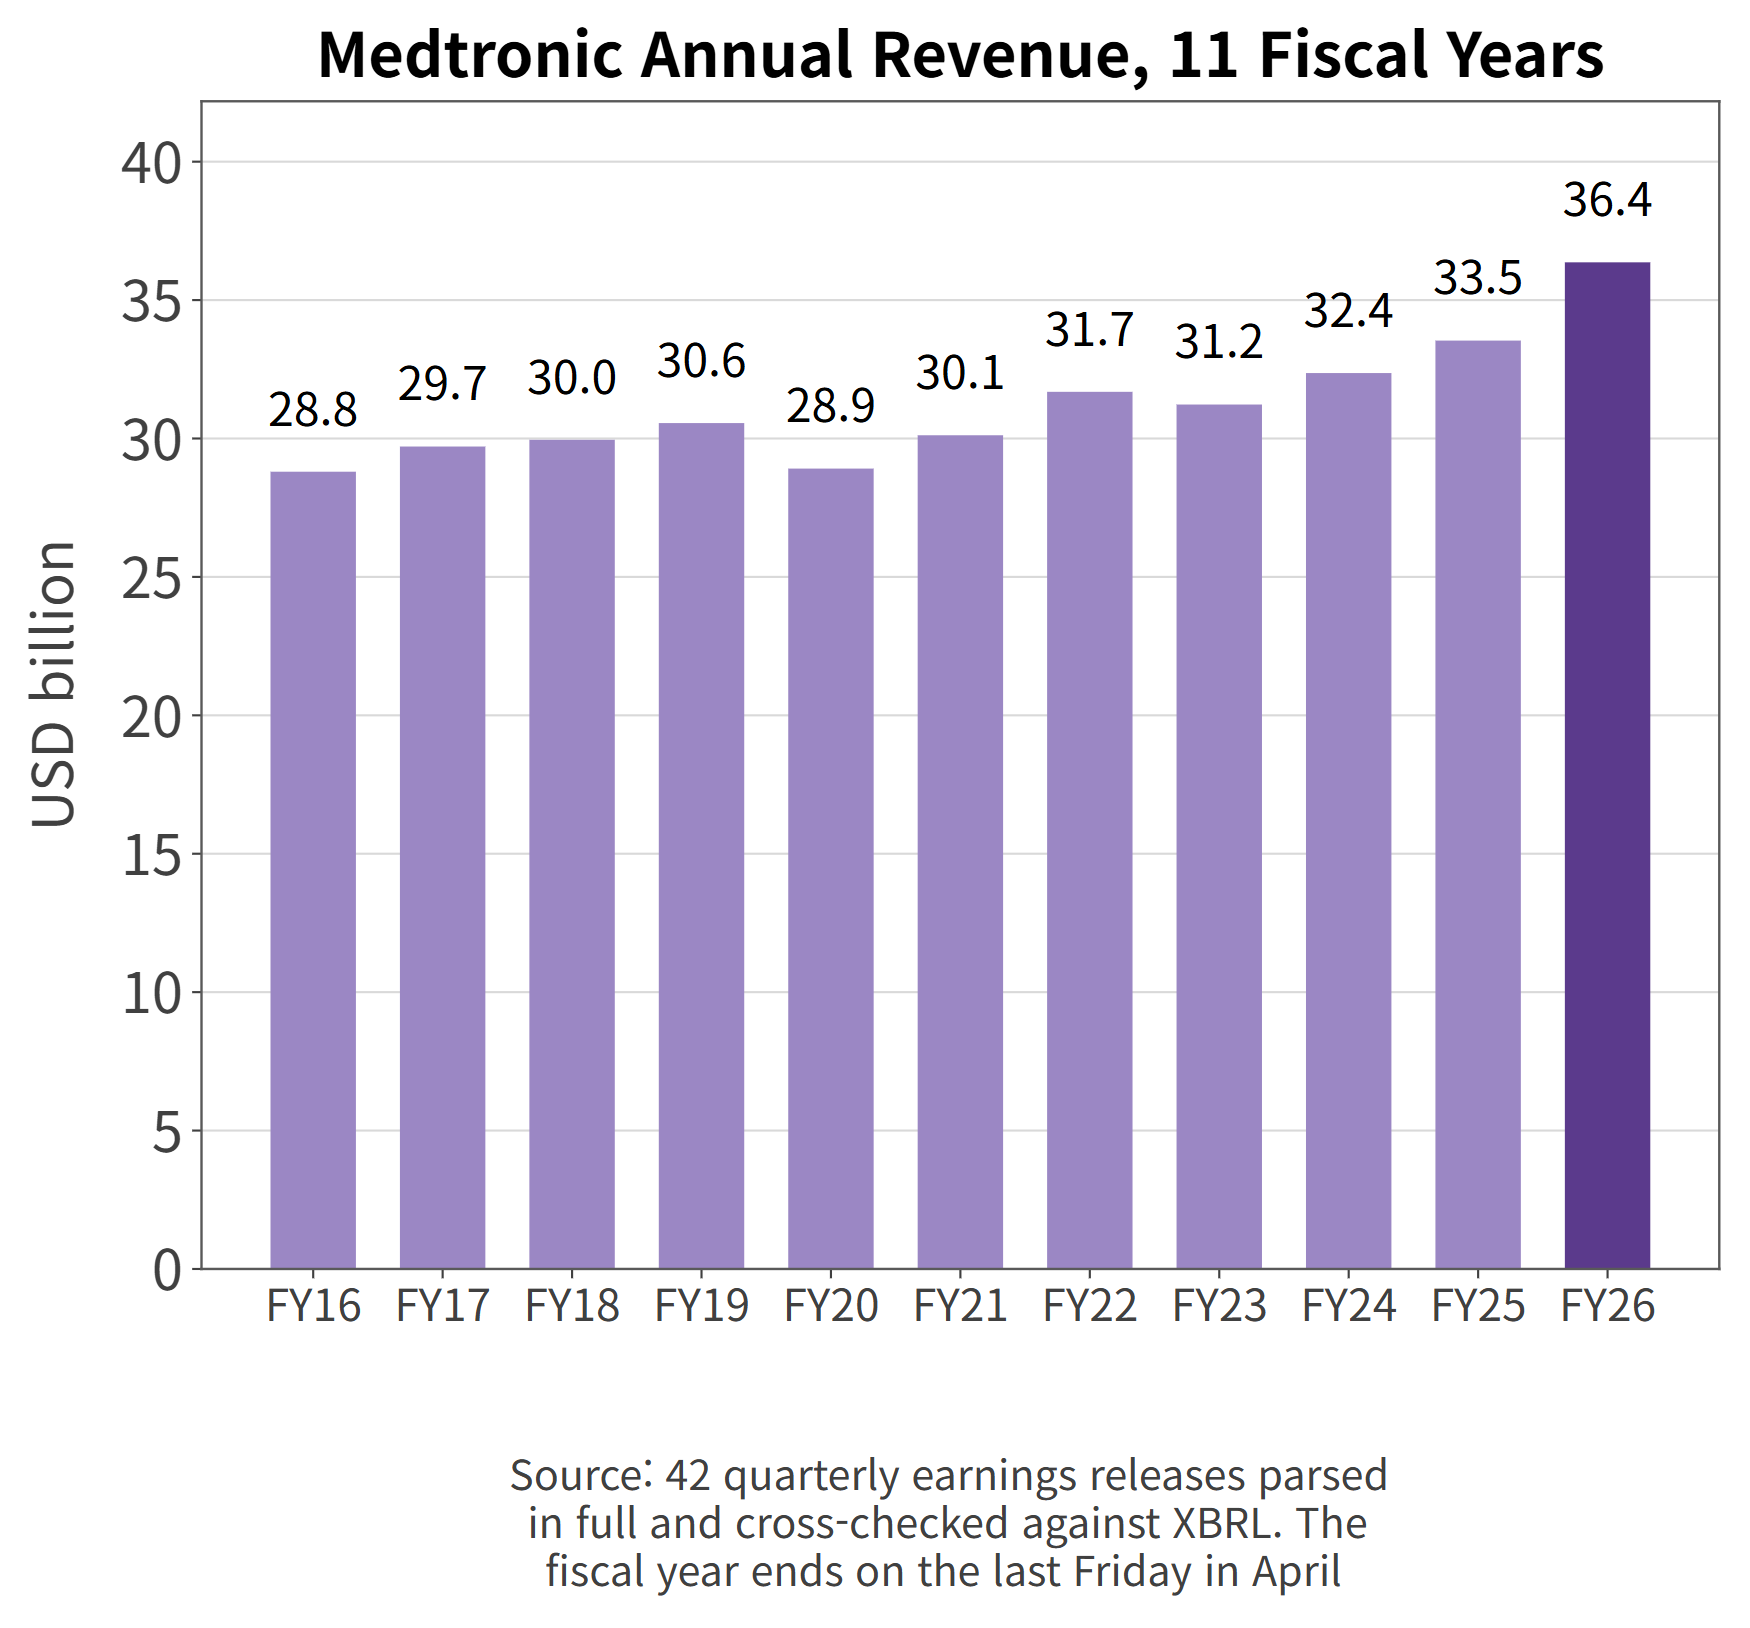
Medtronic annual revenue across 11 fiscal years, parsed from 42 earnings releases
Neuroscience contributes $10.29 billion. Cranial and Spinal Technologies accounts for $5.22 billion of that, Specialty Therapies for $3.00 billion, and Neuromodulation for $2.07 billion.
Medical Surgical adds $8.82 billion, built on surgical staplers, energy devices, and endoscopy. The Hugo robotic surgery system lives here, and the company filed it with the U.S. Food and Drug Administration for general surgery and gynecology indications during the fourth quarter.
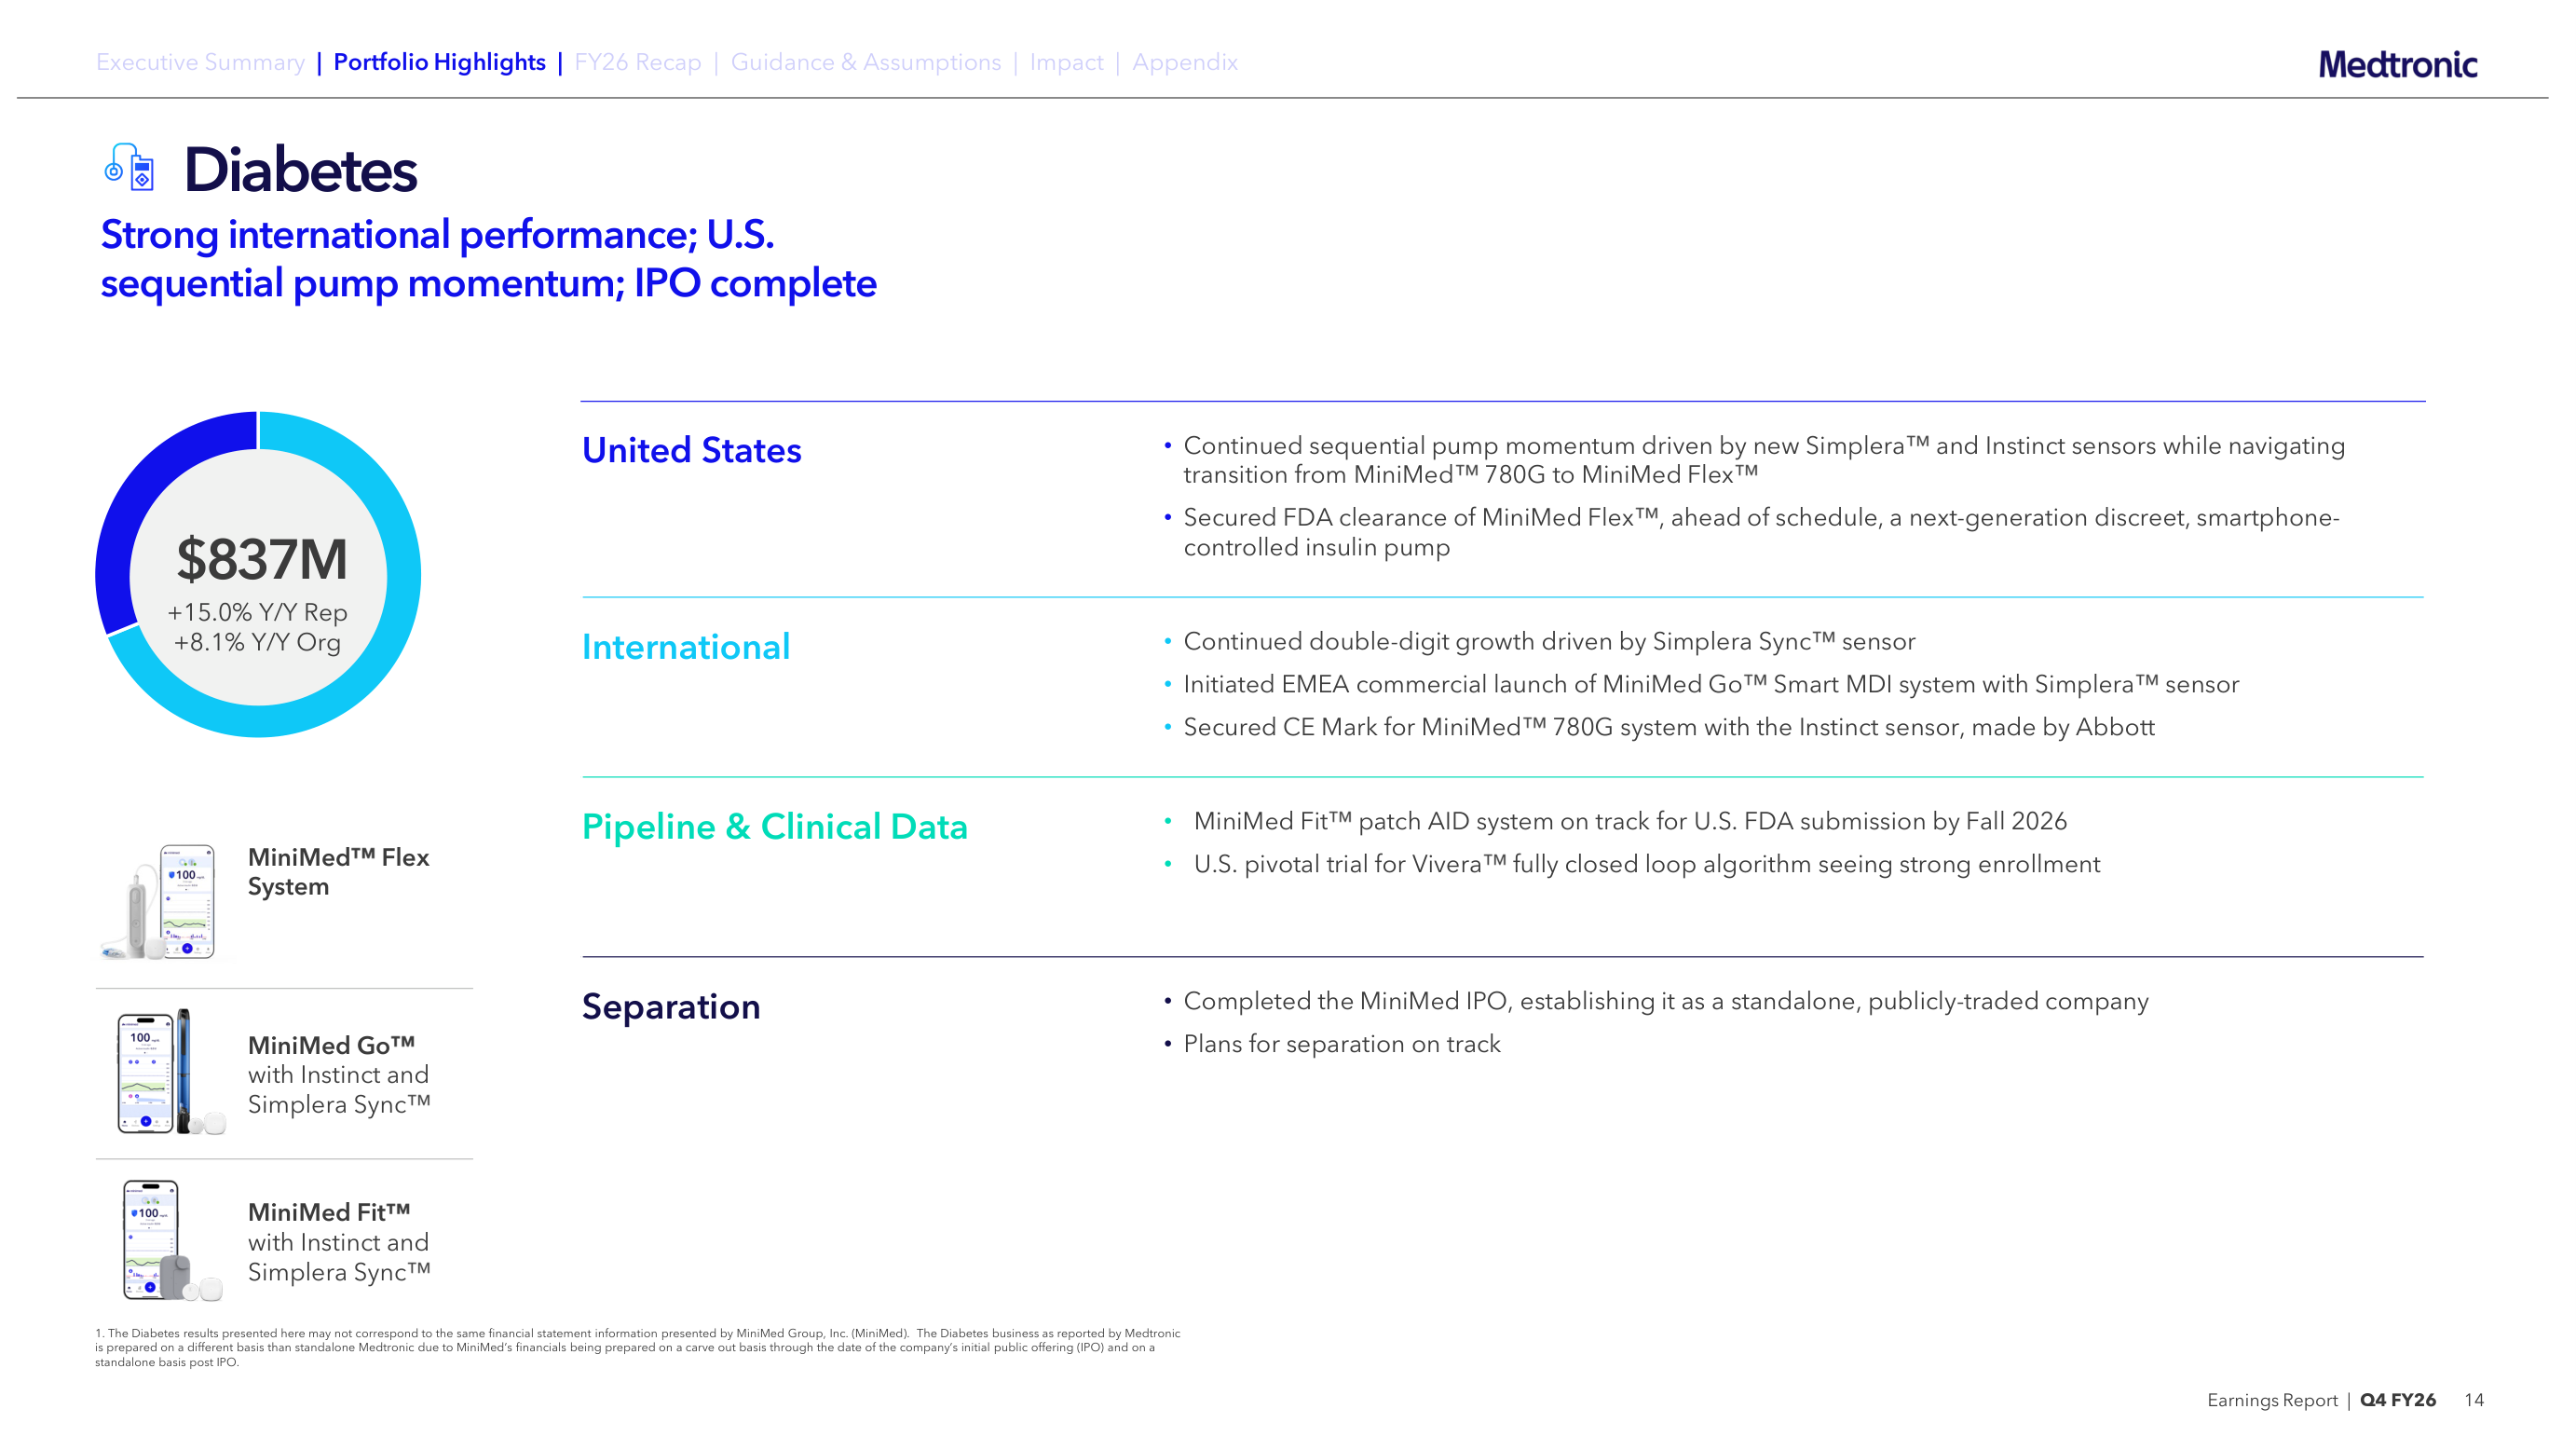
Diabetes brought in $3.11 billion, and that business is now legally separate. It trades as MiniMed Group after a March 9, 2026 initial public offering, with Medtronic still holding roughly 90% of the voting power.
Geography splits close to evenly. The United States accounted for $18.10 billion, or 49.8% of revenue, with the rest coming from Europe, Japan, China, and other markets. That balance matters later, because it is the reason currency moves the reported numbers as much as it does.
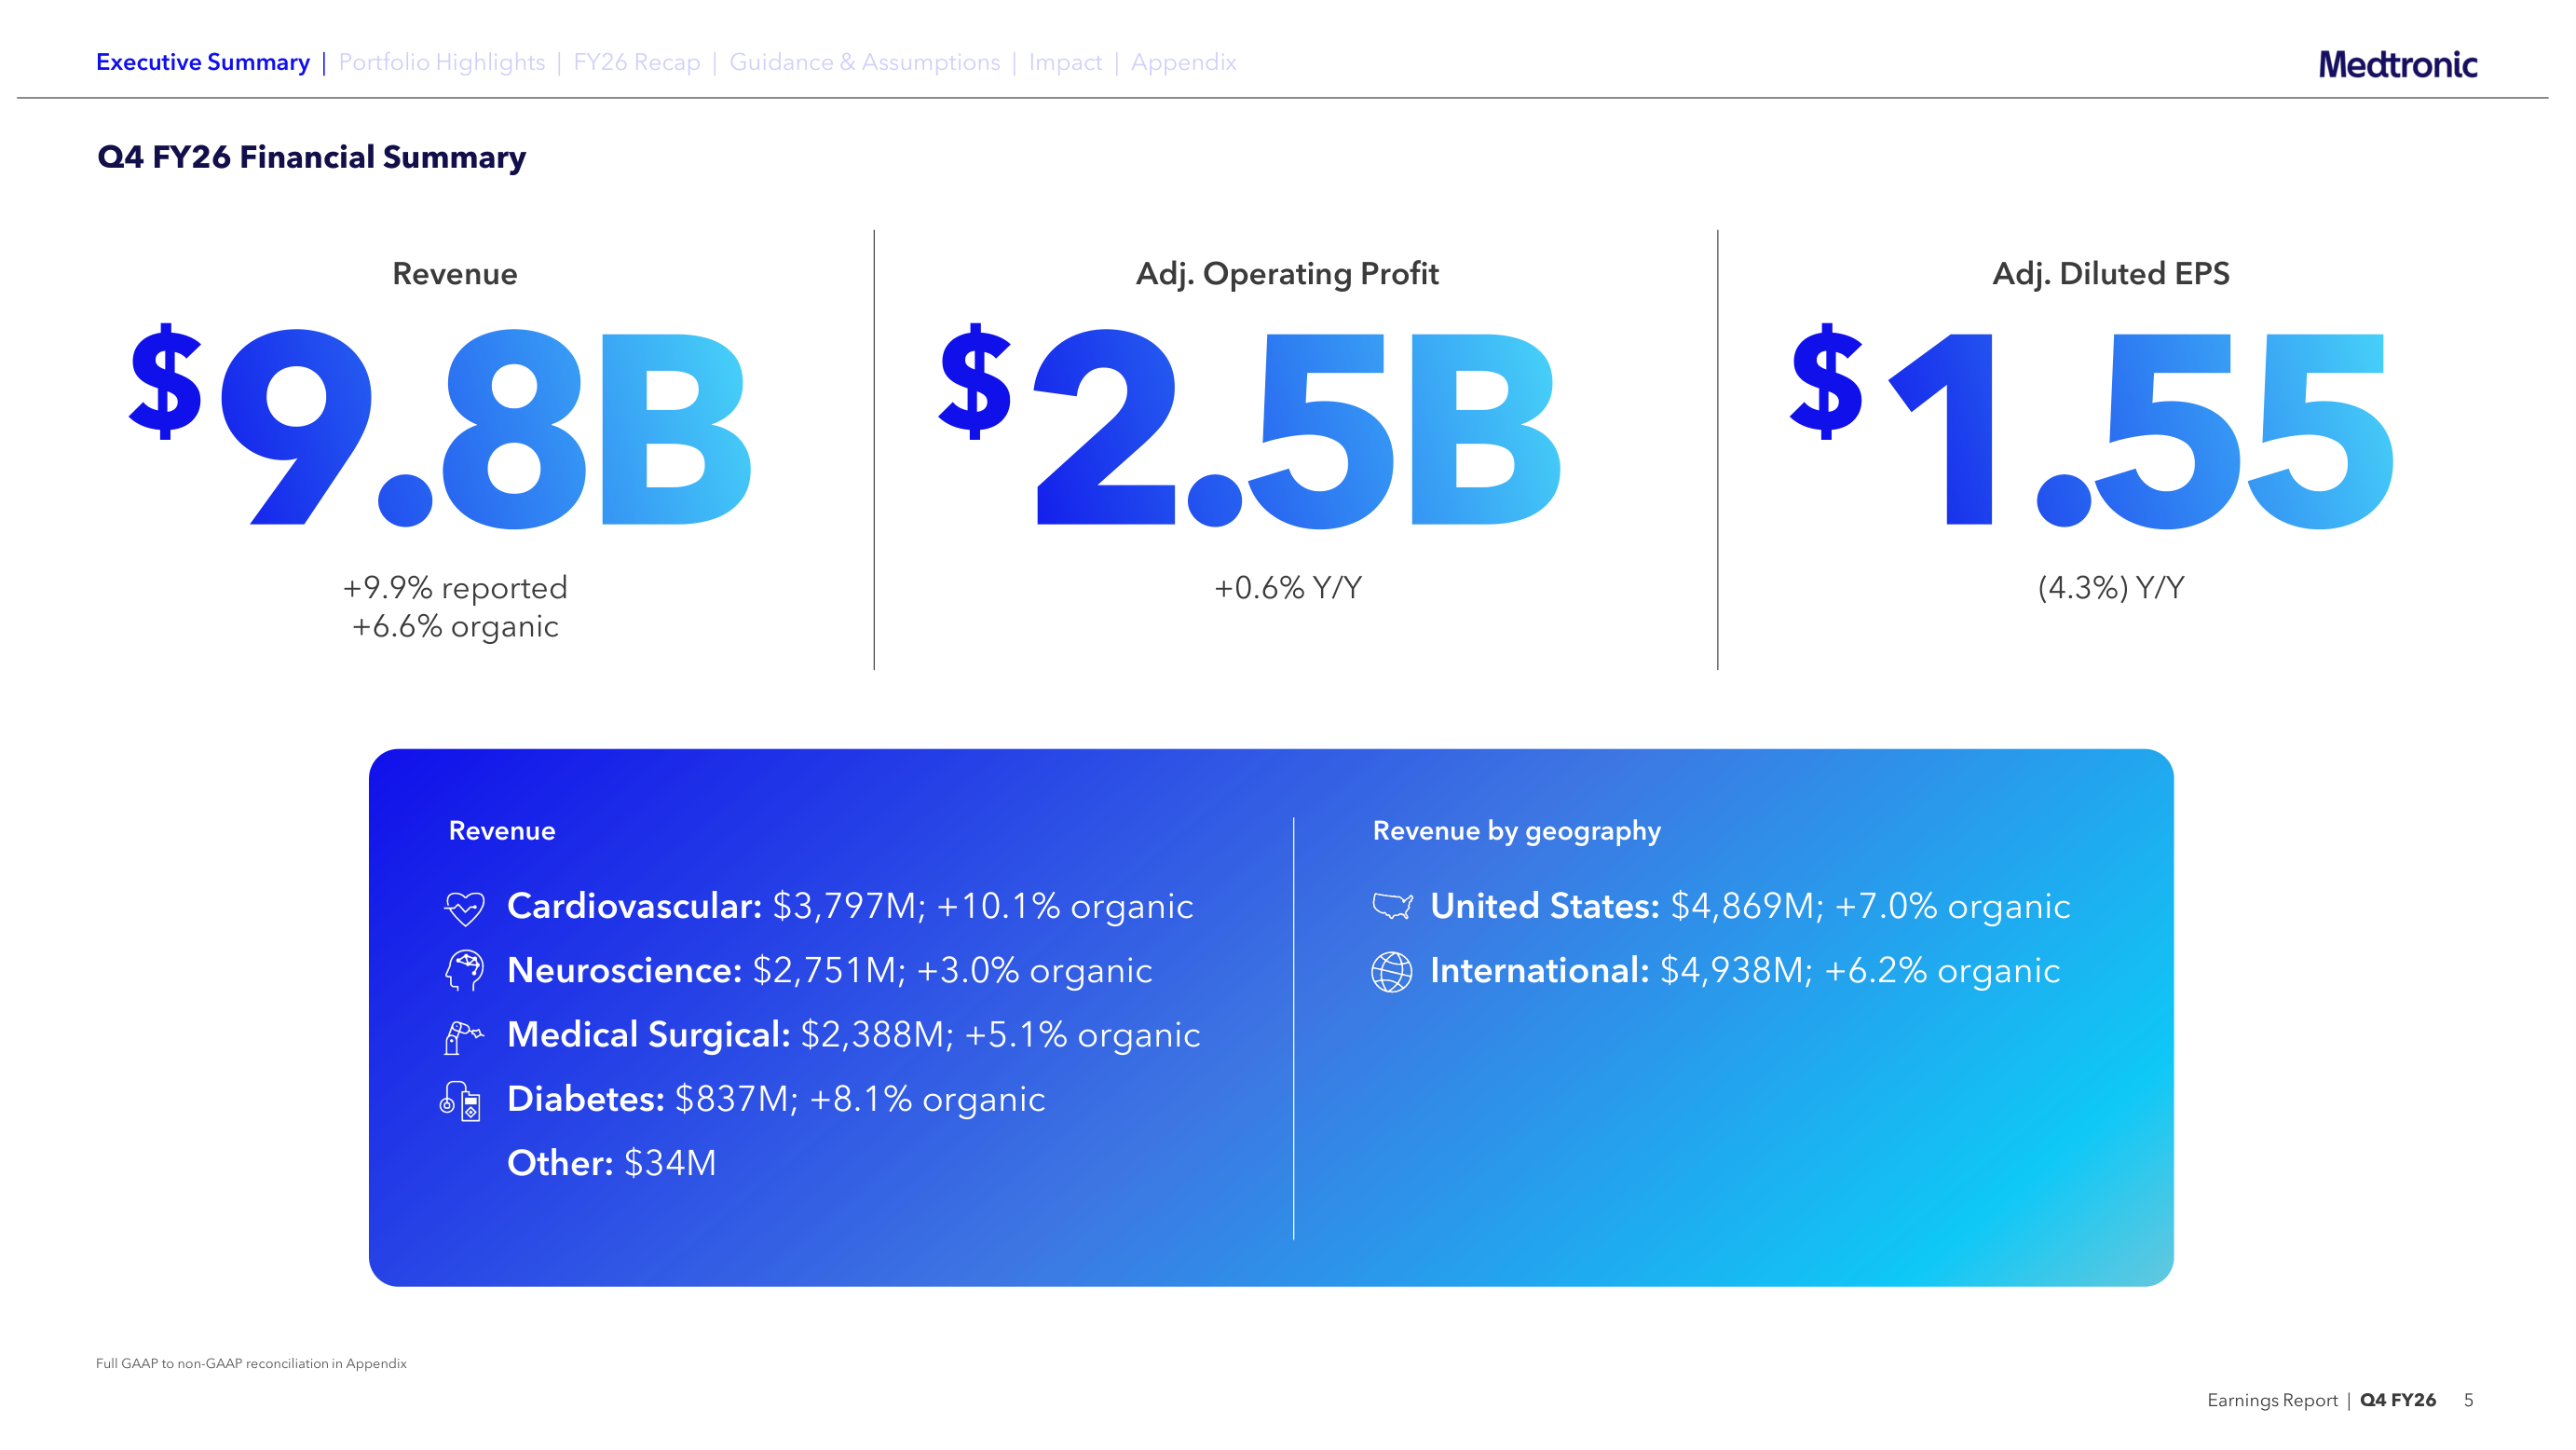
Q4 FY2026 revenue by geography (source: company IR deck, page 5)
Hospitals as customers shape the business. A device sale pulls consumables and service behind it, and surgeons rarely switch instruments they have trained on. The trade-off is that new products need regulatory clearance before they turn into revenue, which takes years. Growth arrives slowly and then holds.
FY2026 revenue and organic growth by segment
Cardiovascular Grew 9.3%, but Half the Business Grew Just 3%
Organic growth in fiscal 2026 splits sharply by unit. Cardiovascular grew +9.3% and Diabetes +7.9%, while Neuroscience managed 3.1% and Medical Surgical 2.9%. Only the first two cleared the 5.8% company average.
Neuroscience and Medical Surgical together bill $19.10 billion, more than Cardiovascular on its own, yet they contributed less than half as much to growth.
Cardiac ablation drove the cardiovascular result. That product family grew 78% globally in the fourth quarter, 124% in the United States, and picked up 8 points of U.S. share, according to the company. The names Medtronic repeats as fiscal 2027 growth engines cluster in the same place: Affera for atrial fibrillation, Symplicity Spyral for renal denervation, Hugo for robotic surgery, and Altaviva for urinary incontinence.
Neuroscience runs slow across all three sub-units. Cranial and Spinal grew 4.0% and Neuromodulation 5.2%, but Specialty Therapies came in at 0.3%, effectively flat. Spine hardware tracks hospital budgets and procedure counts directly, so staffing and reimbursement land on it first.
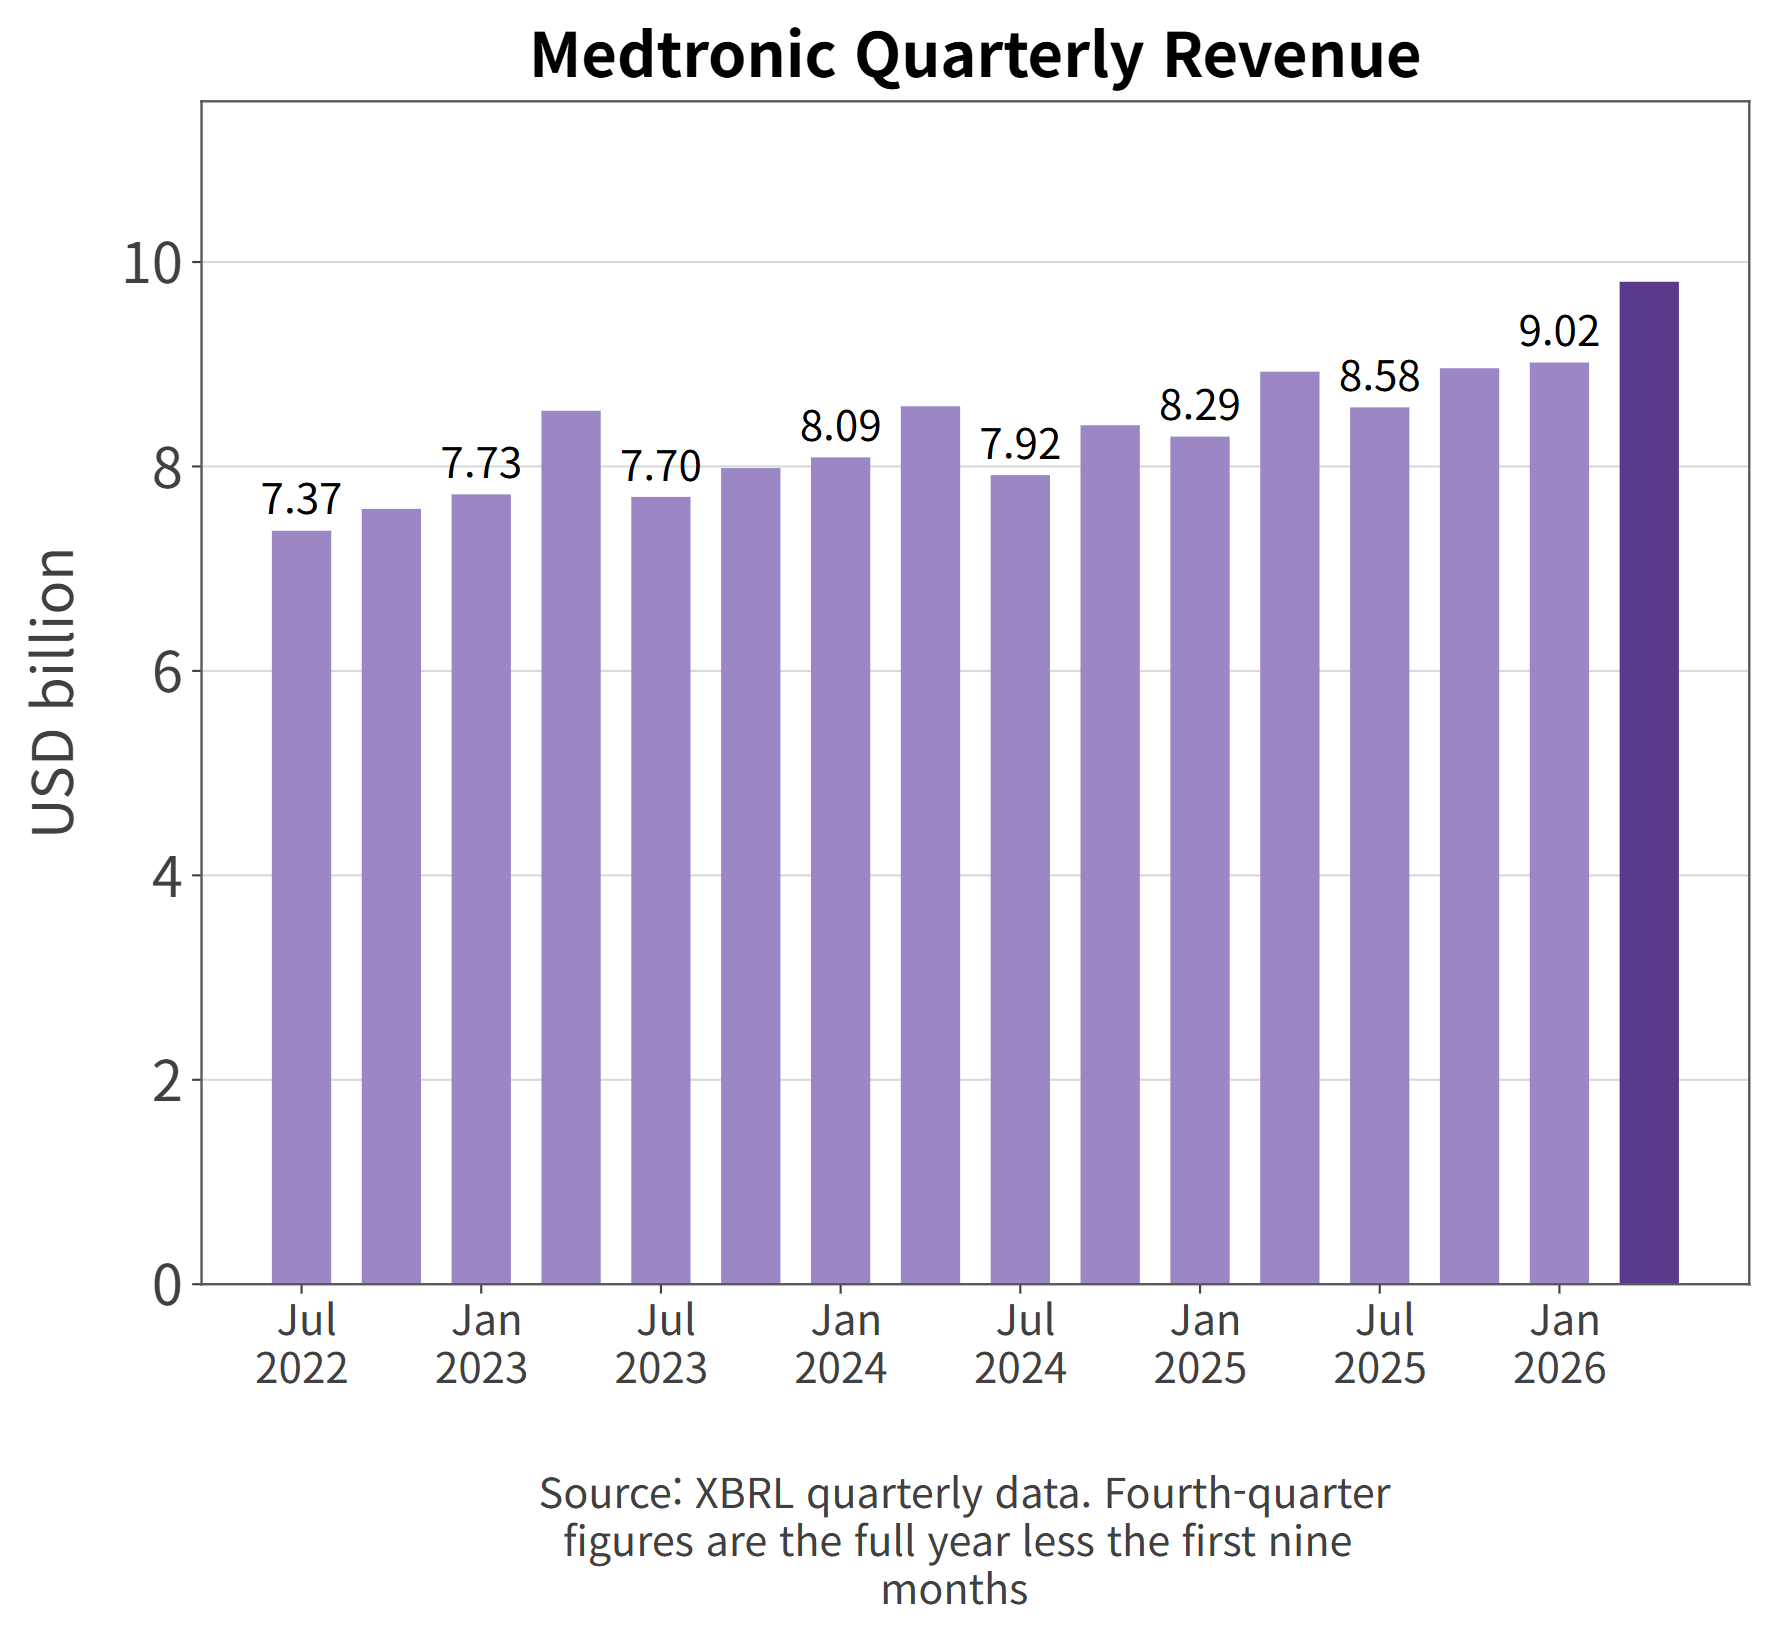
Medtronic quarterly revenue; fourth quarters are the full year less nine months
Medtronic Revenue Growth Hit a 10-Year High—But 29% Came From FX
I pulled all 42 quarterly earnings releases Medtronic has filed with the SEC and built the revenue series from fiscal 2016 through fiscal 2026 myself, then checked every year against the XBRL data in the annual filings. The two agreed on all eleven.
Reported and organic revenue growth across 11 fiscal years
Only one year beat fiscal 2026's +8.4%: fiscal 2016, at +42.0%, when the Covidien acquisition landed on the top line. Exclude that year and the streak is exactly ten. The company's phrasing was not loose language; it was calibrated.
The organic series says the same. The best year between fiscal 2017 and fiscal 2025 was fiscal 2019 at 5.5%, and fiscal 2026 came in at 5.8%.
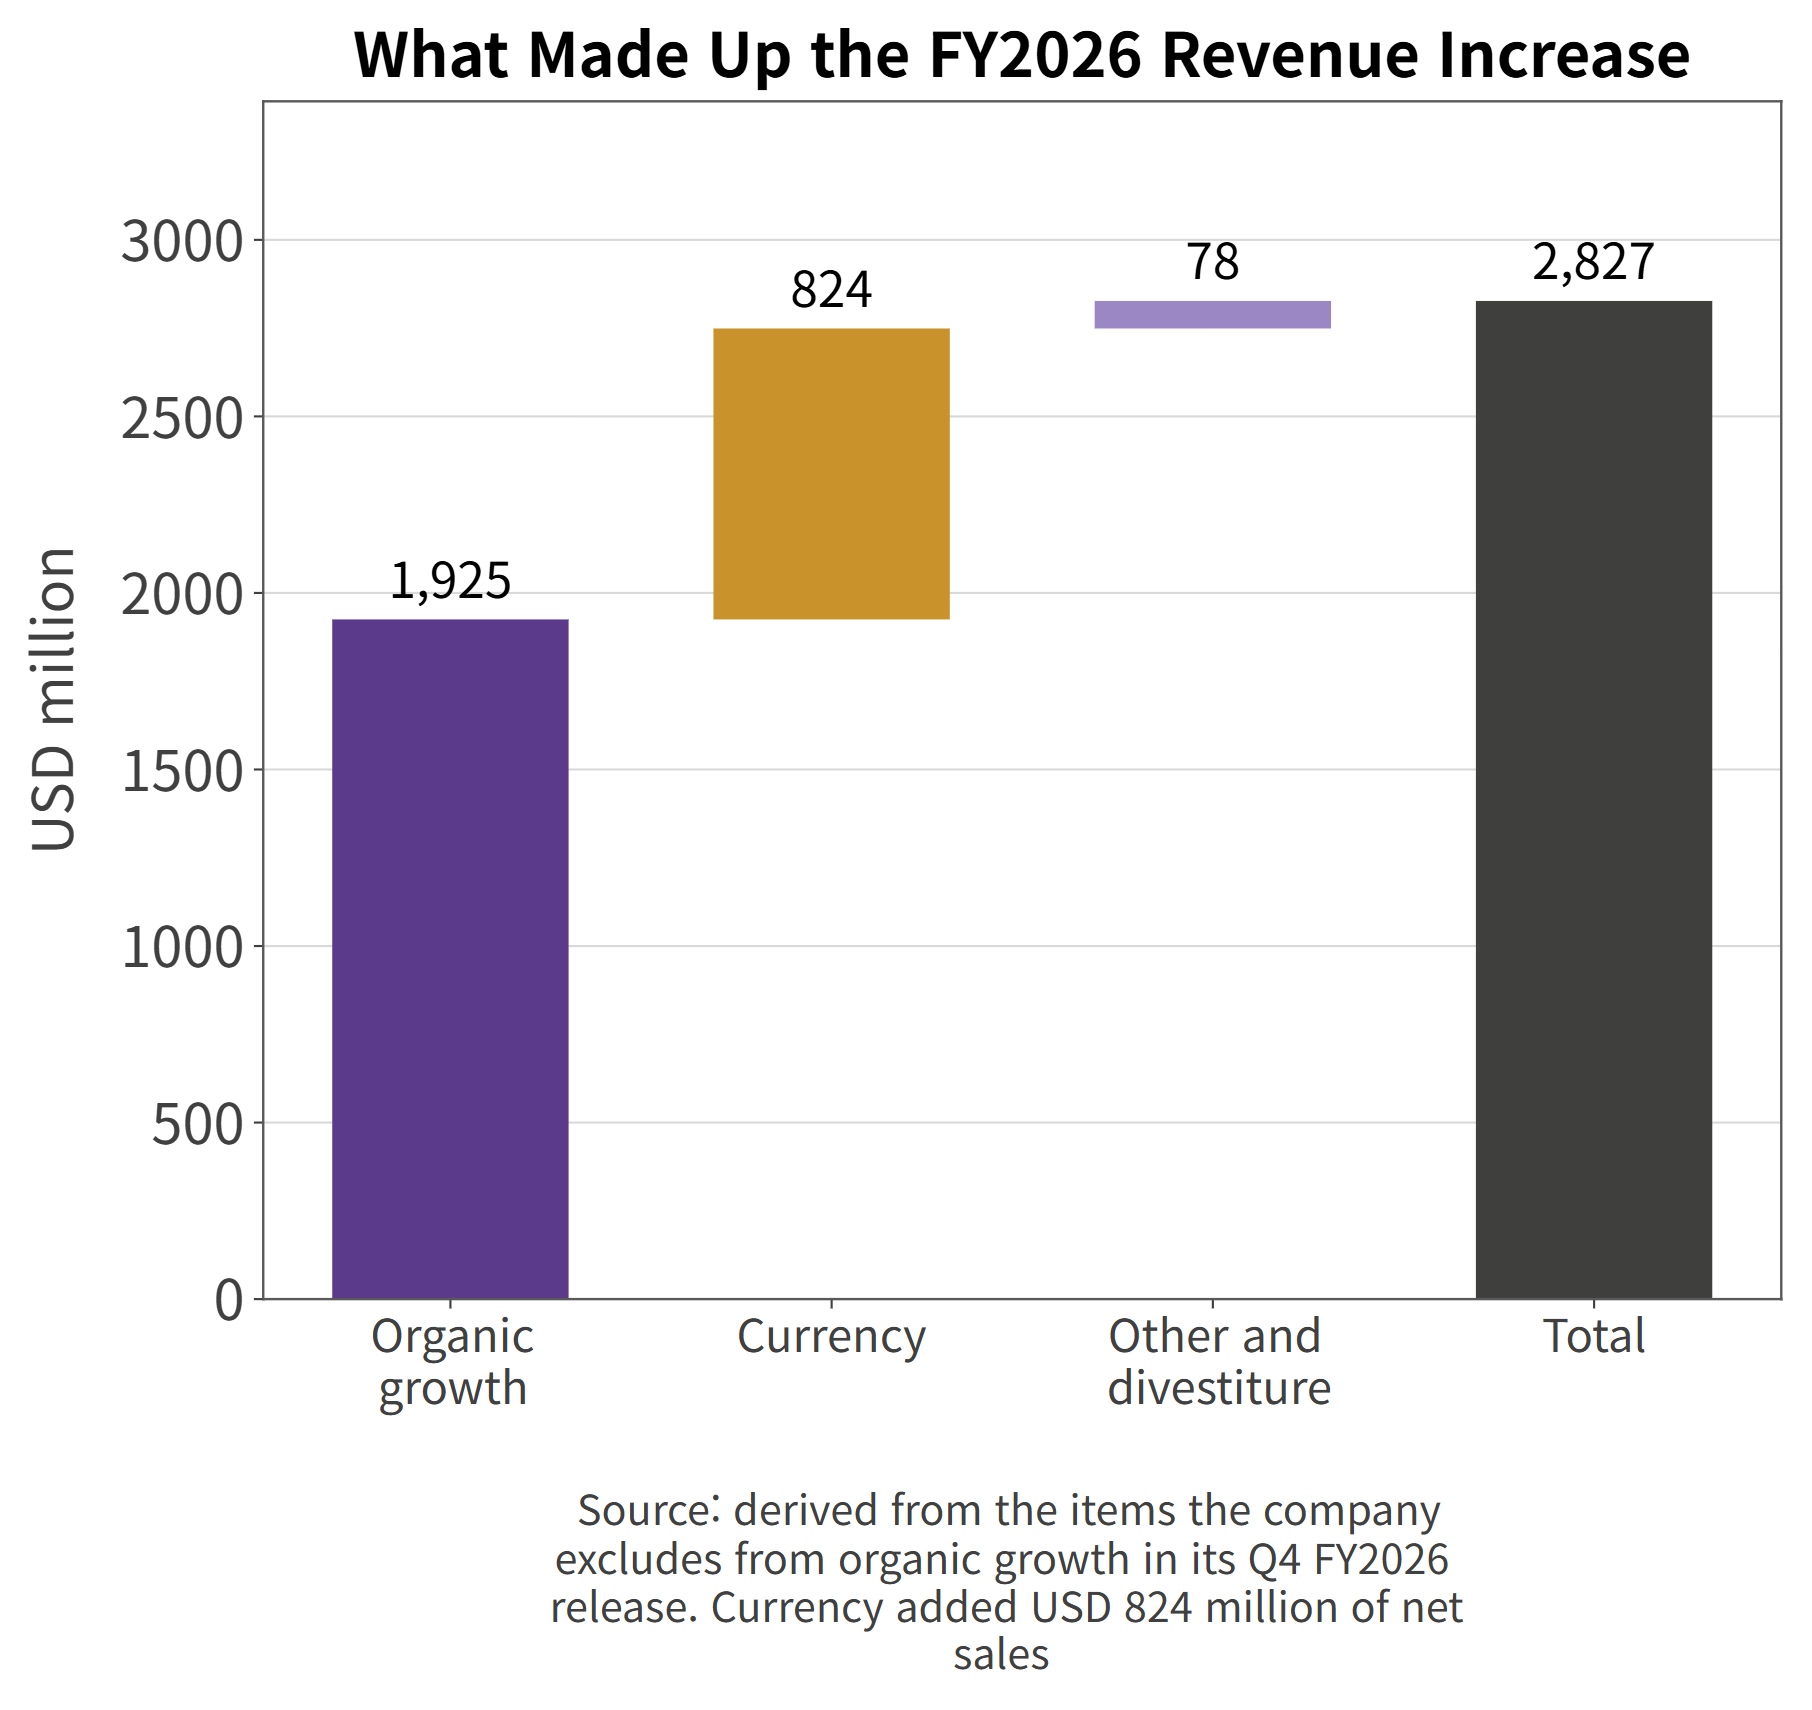
So what filled the $2.83 billion of added revenue? Breaking it against the items the company excludes from organic growth gives three pieces: $1.93 billion organic, $824 million currency, and $78 million from other revenue and the Dutch Obesity Clinic divestiture.
What made up the $2.83 billion increase in FY2026 revenue
Currency accounted for 29.1% of the increase. That is not something management produced. When the dollar weakens, euros and yen convert into more dollars; when it strengthens, the reverse. With half of revenue booked outside the United States, the swing is large. Close to a third of the "best in ten years" number came from outside the company's control.
Non-GAAP operating profit reached $8.86 billion, up +2.4% and down -0.6% at constant currency. Adjusted revenue grew 8.0% that same year.
Medtronic annual non-GAAP EPS, with FY2022 and FY2026 highlighted
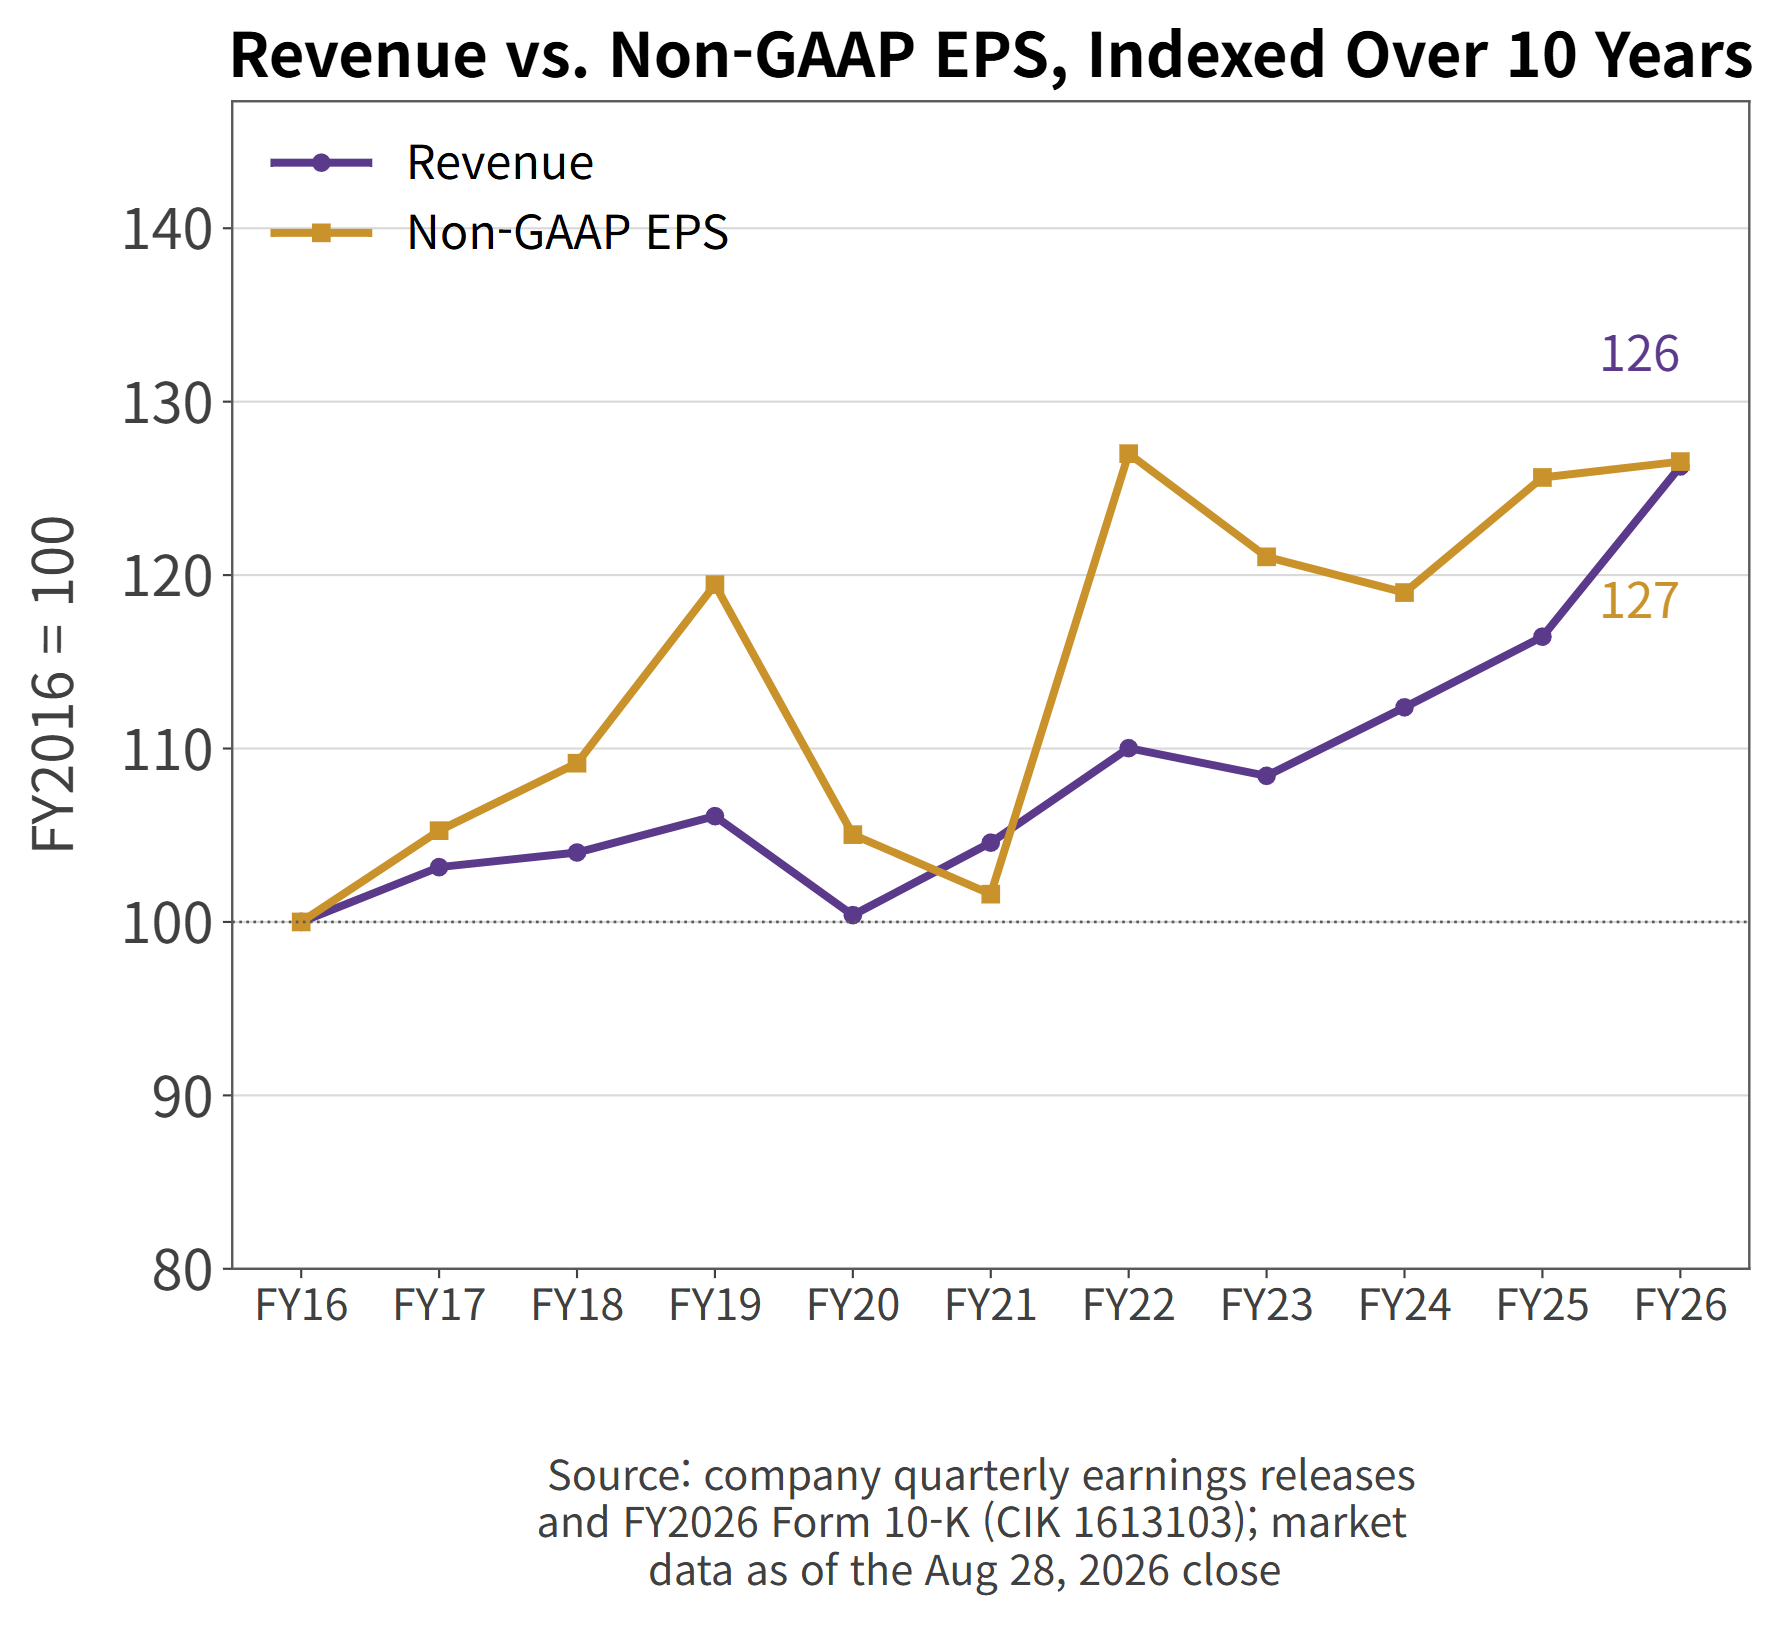
Per share, the picture sharpens. Non-GAAP EPS of $5.53 beat fiscal 2025's $5.49 by four cents but trailed fiscal 2022's $5.55 by two. Revenue over those four years went from $31.69 billion to $36.36 billion, a gain of +14.8%.
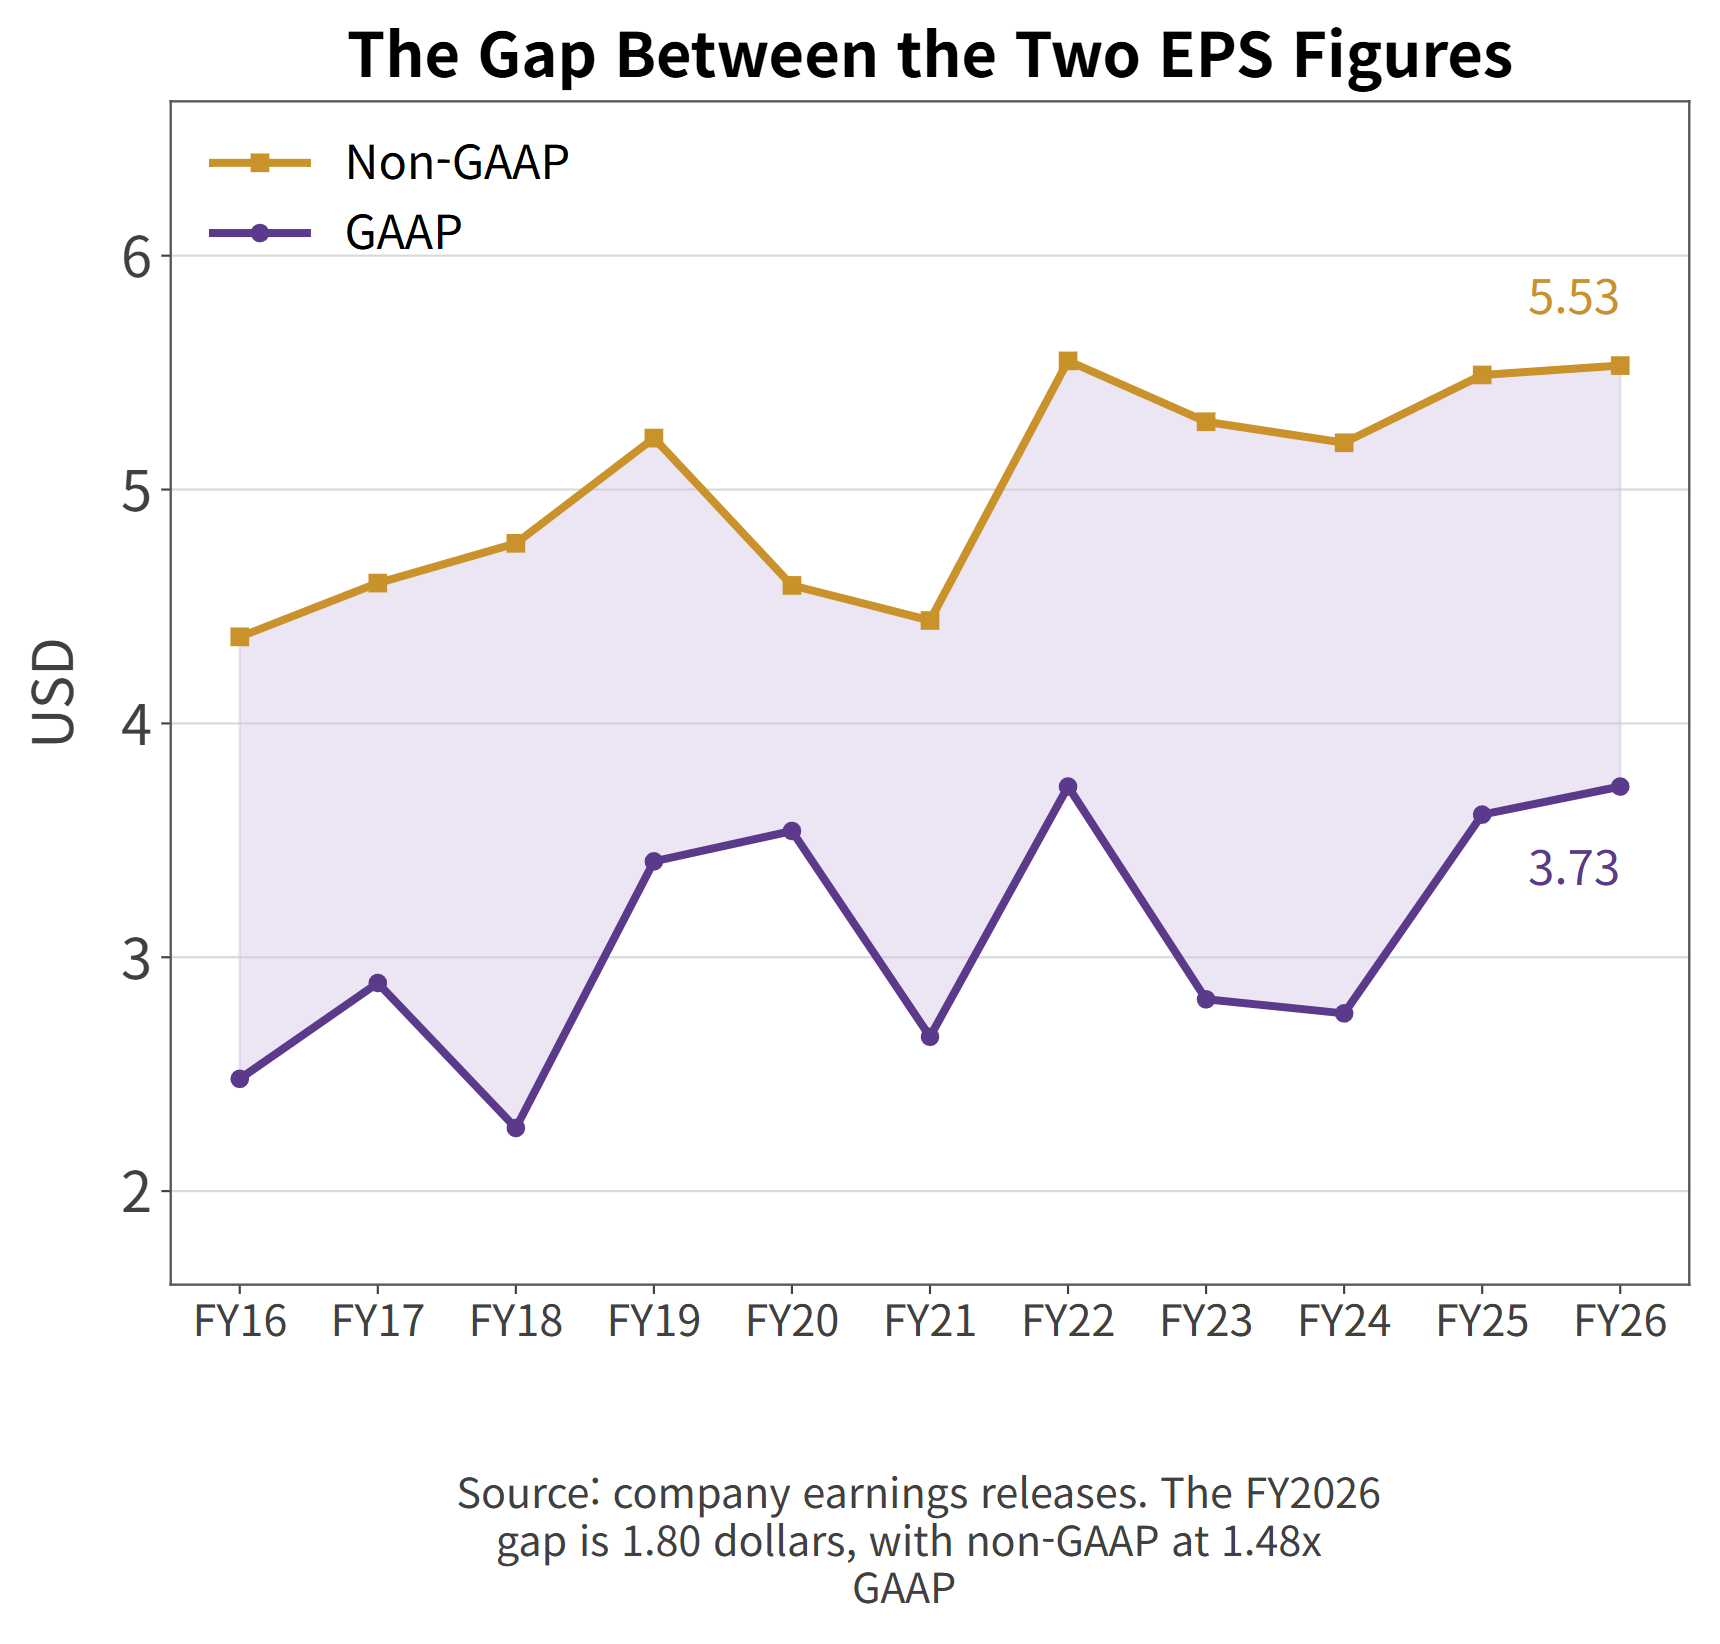
On a GAAP basis the coincidence is cleaner still. Diluted EPS was $3.73 in fiscal 2022 and $3.73 in fiscal 2026, identical to the cent.
The gap between GAAP and non-GAAP earnings per share
Tariffs and Blackstone Cut Operating Margin by 130 Basis Points
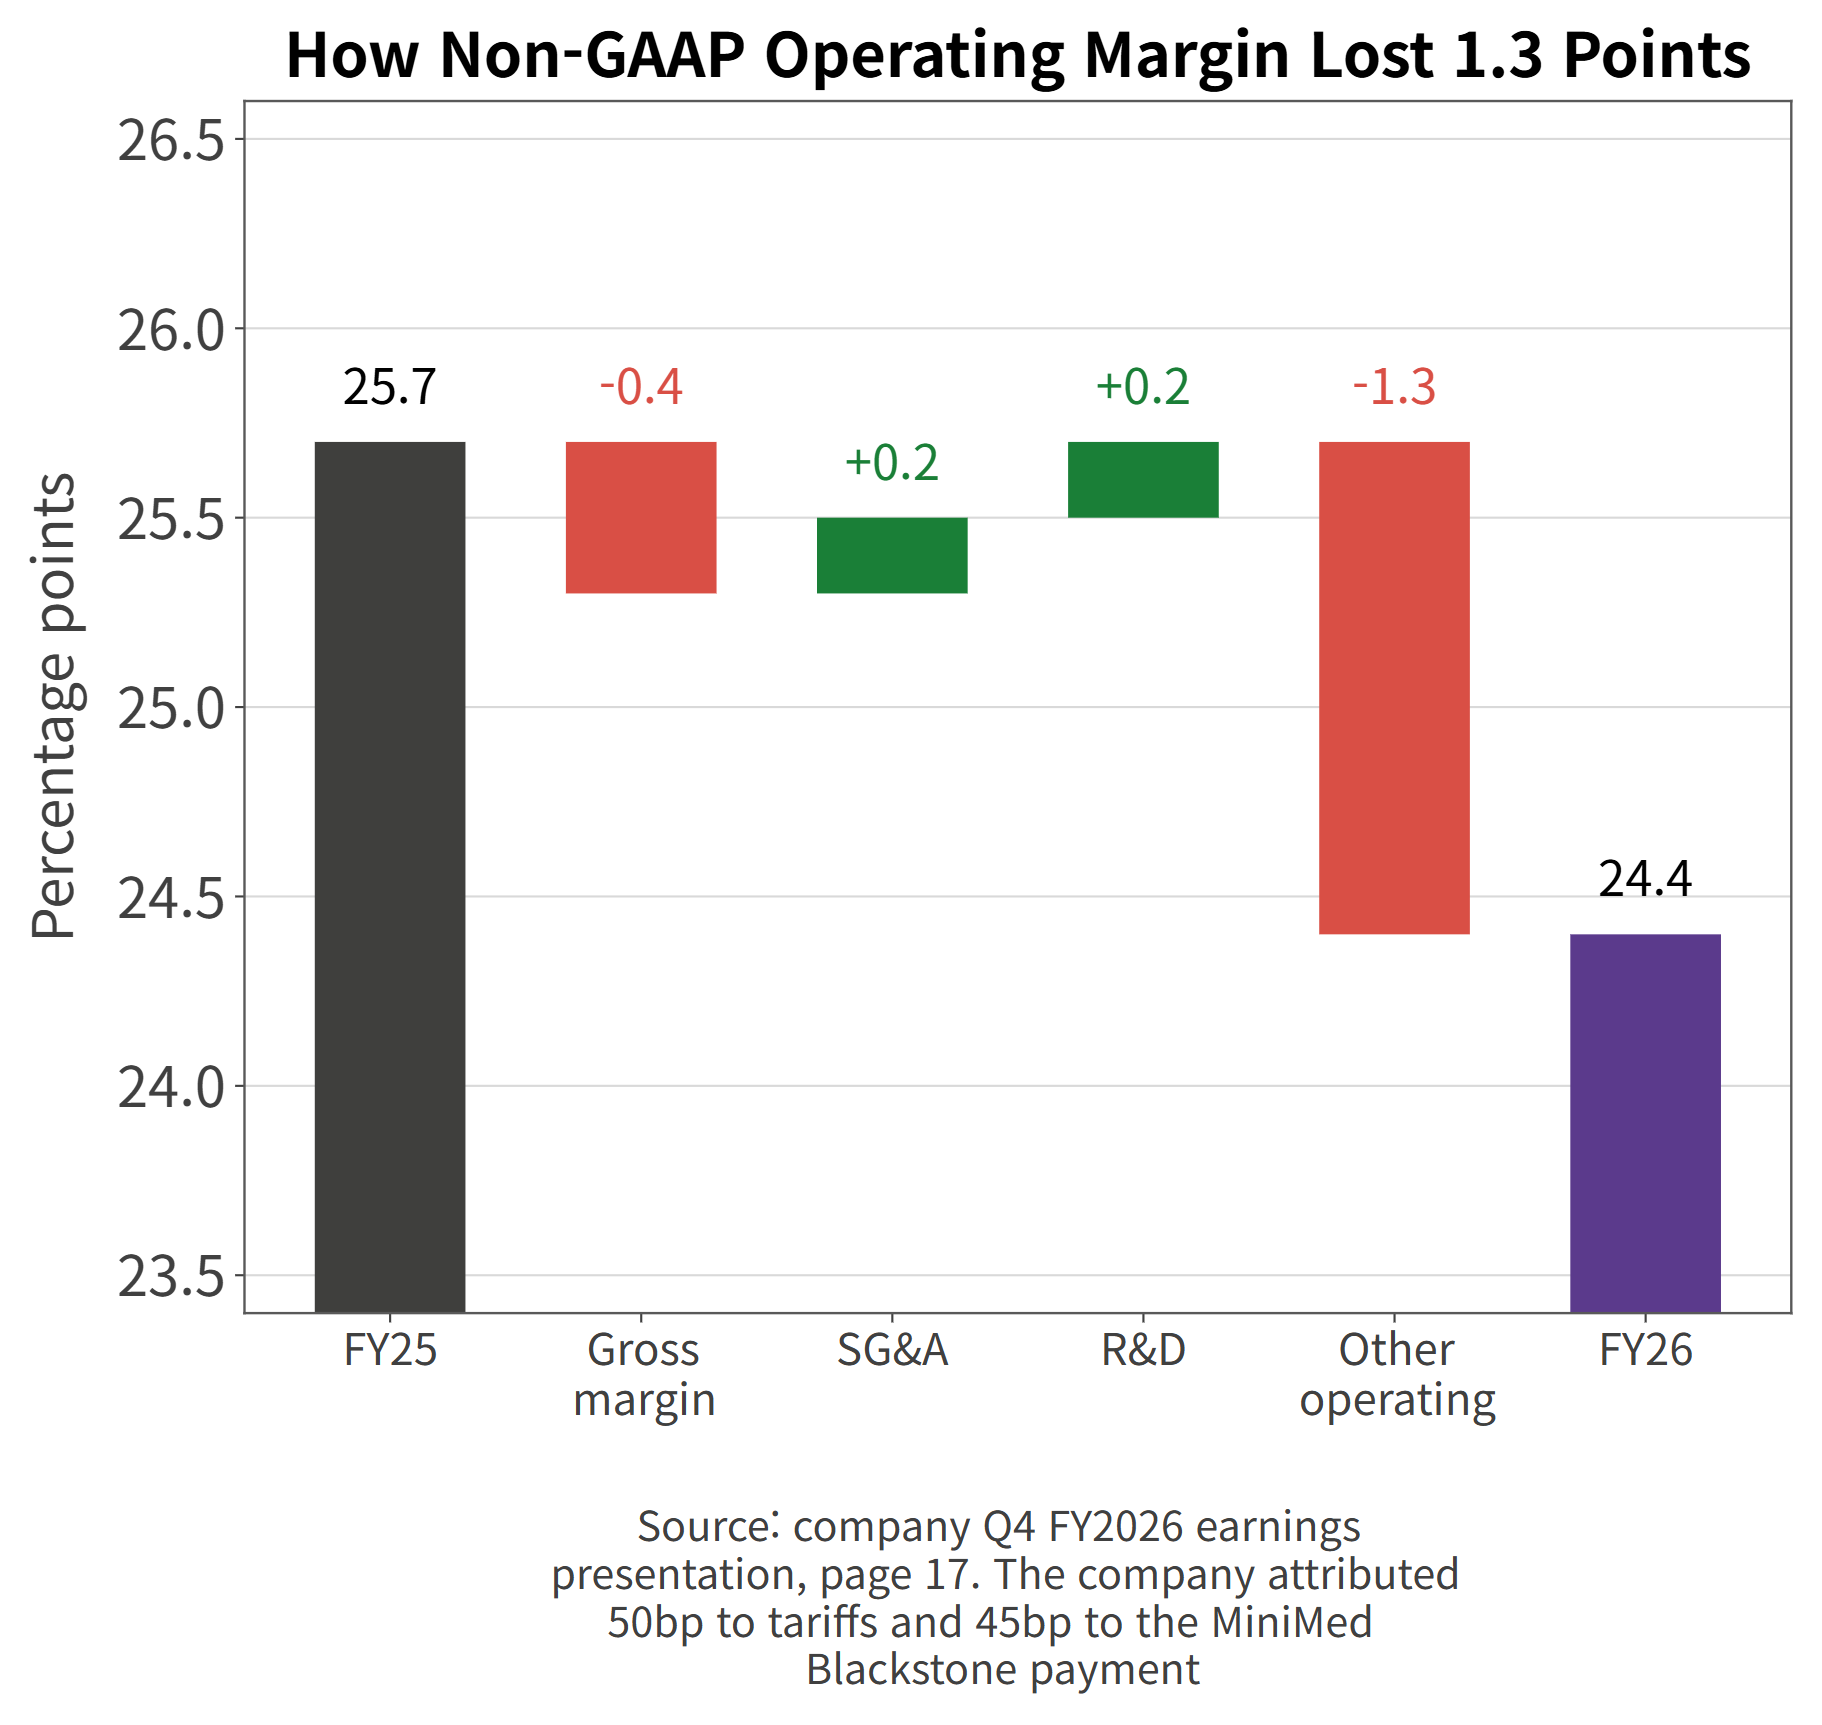
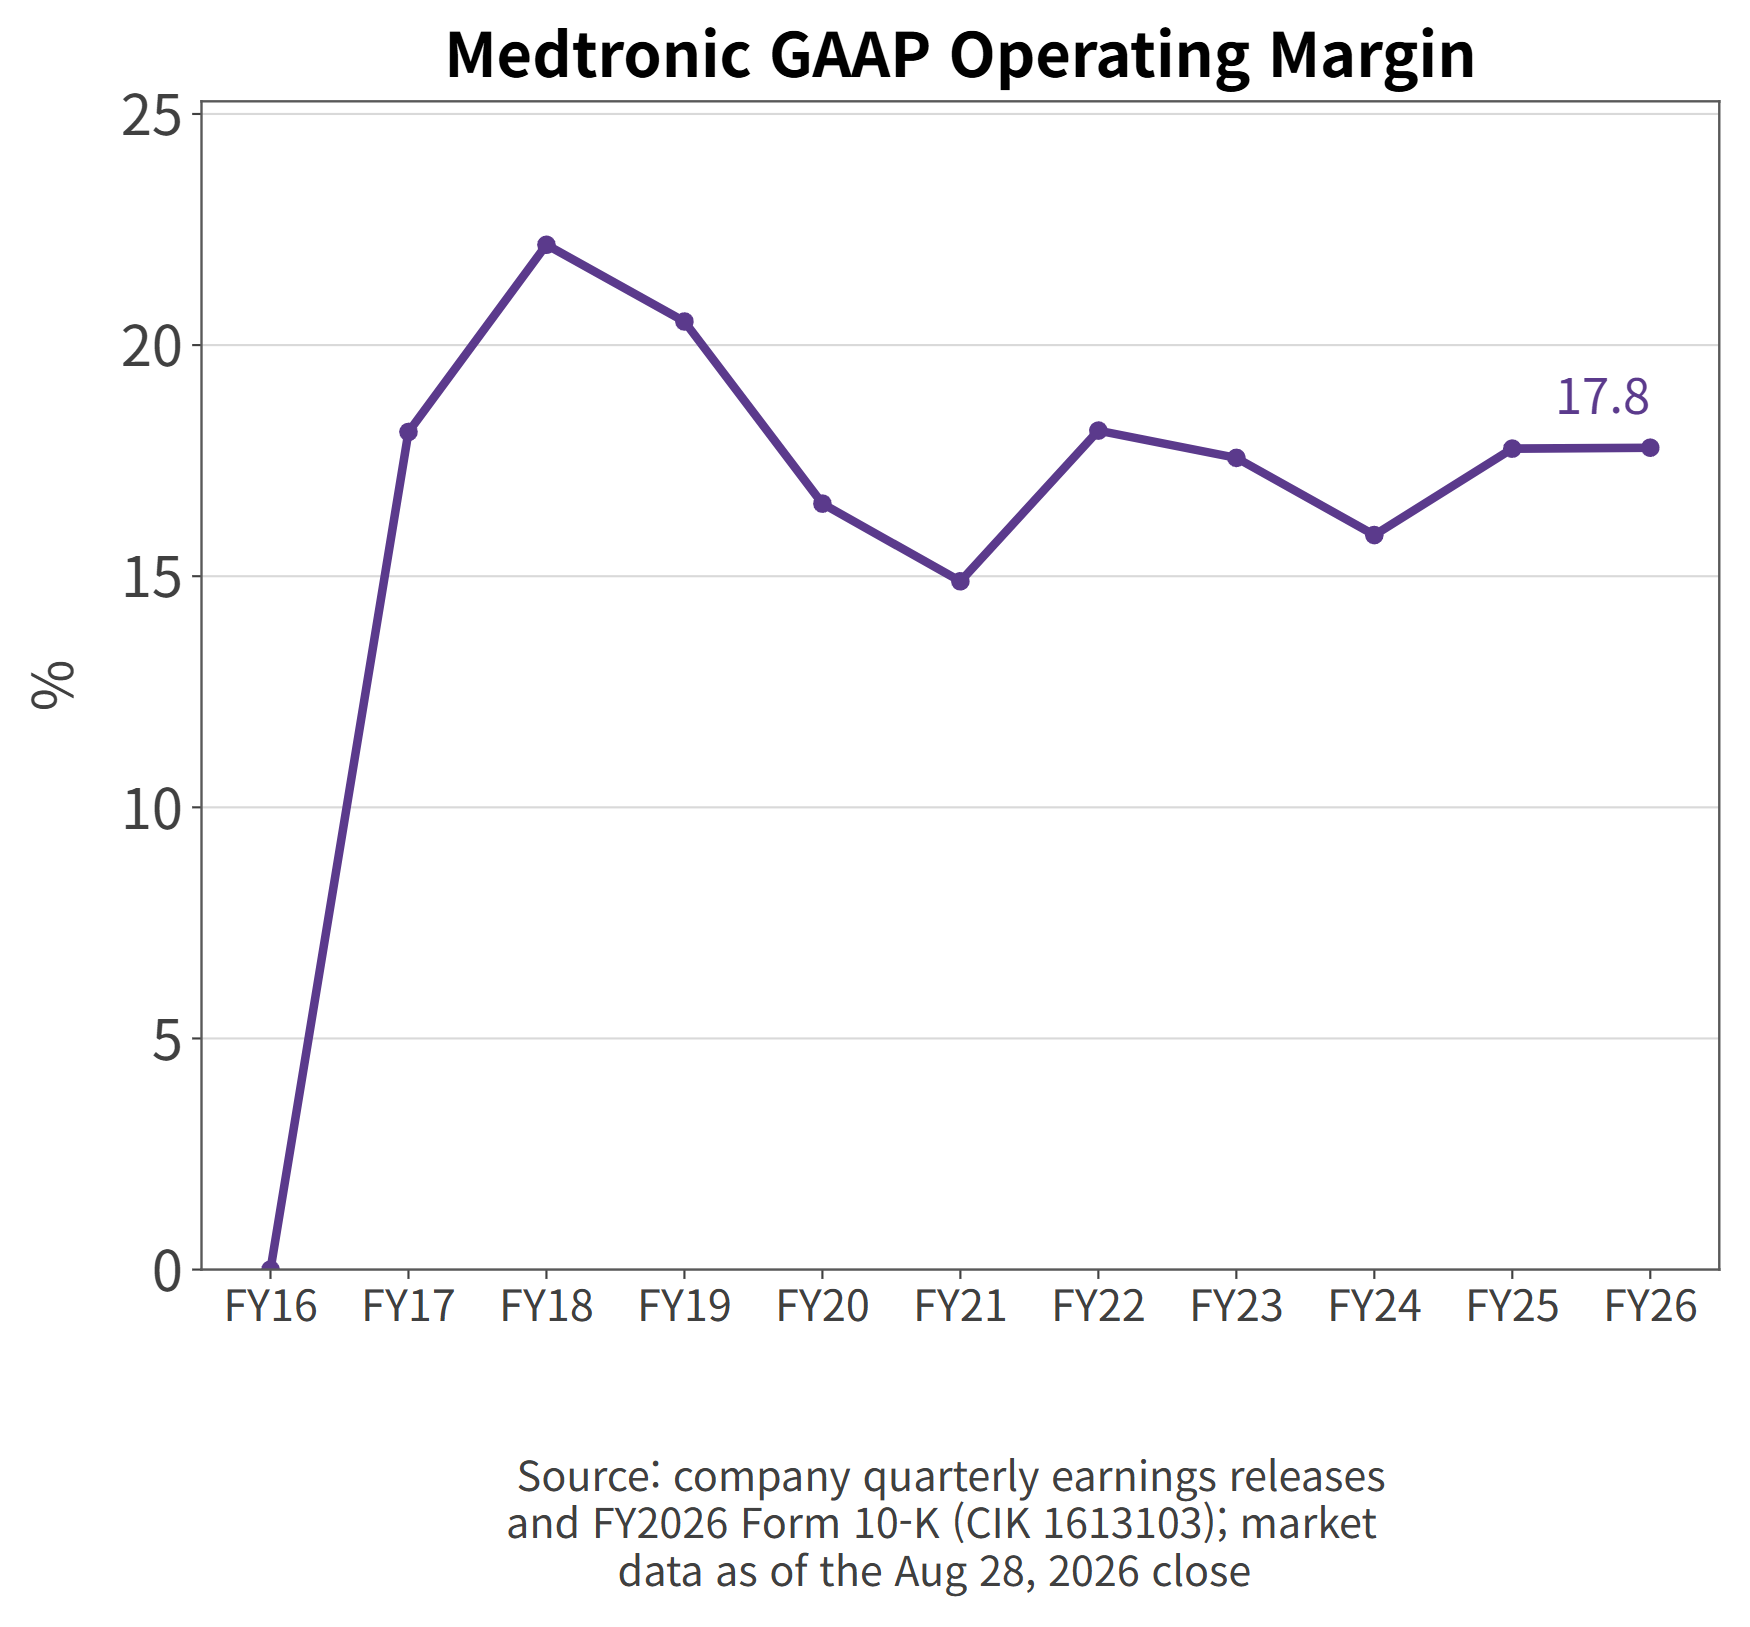
Non-GAAP operating margin fell from 25.7% to 24.4%, a decline of 1.3 points. Medtronic laid out the components on page 17.
How non-GAAP operating margin lost 1.3 points
Gross margin slipped from 65.7% to 65.3%, a drag of -0.4 points. Selling, general, and administrative expense fell from 32.1% of sales to 31.9%, and research and development from 8.1% to 7.9%, each adding 0.2 points back. Those three cancel out.
What remains is other operating expense, and 1.3 points went there. The company named two causes: 50 basis points from tariffs and 45 basis points from the MiniMed Blackstone payment.
On tariffs, a footnote on the same page reads that adjusted gross margin would have risen 10 basis points excluding the tariff impact. The 40-point decline is a 50-point tariff hit against a 10-point improvement in the underlying business.
FY2026 adjusted income statement (source: company IR deck, page 17)
The Blackstone item works differently. Medtronic has taken development funding from Blackstone Life Sciences for cardiovascular and diabetes products, and owes milestone payments and sales royalties once those products clear approval and commercialization. Fiscal 2026 is when the bill came due. Because the payment is triggered by development succeeding, those 45 basis points read less like a cost of failure and more like an invoice for success.
Why Is Medtronic Spinning Off MiniMed, Its Fastest-Growing Business?
Medtronic announced its intent to separate the diabetes business in May 2025. MiniMed Group completed its IPO on March 9, 2026, and the annual report states that the Diabetes Operating Unit stopped being a reportable segment in the fourth quarter of fiscal 2026 as a result.
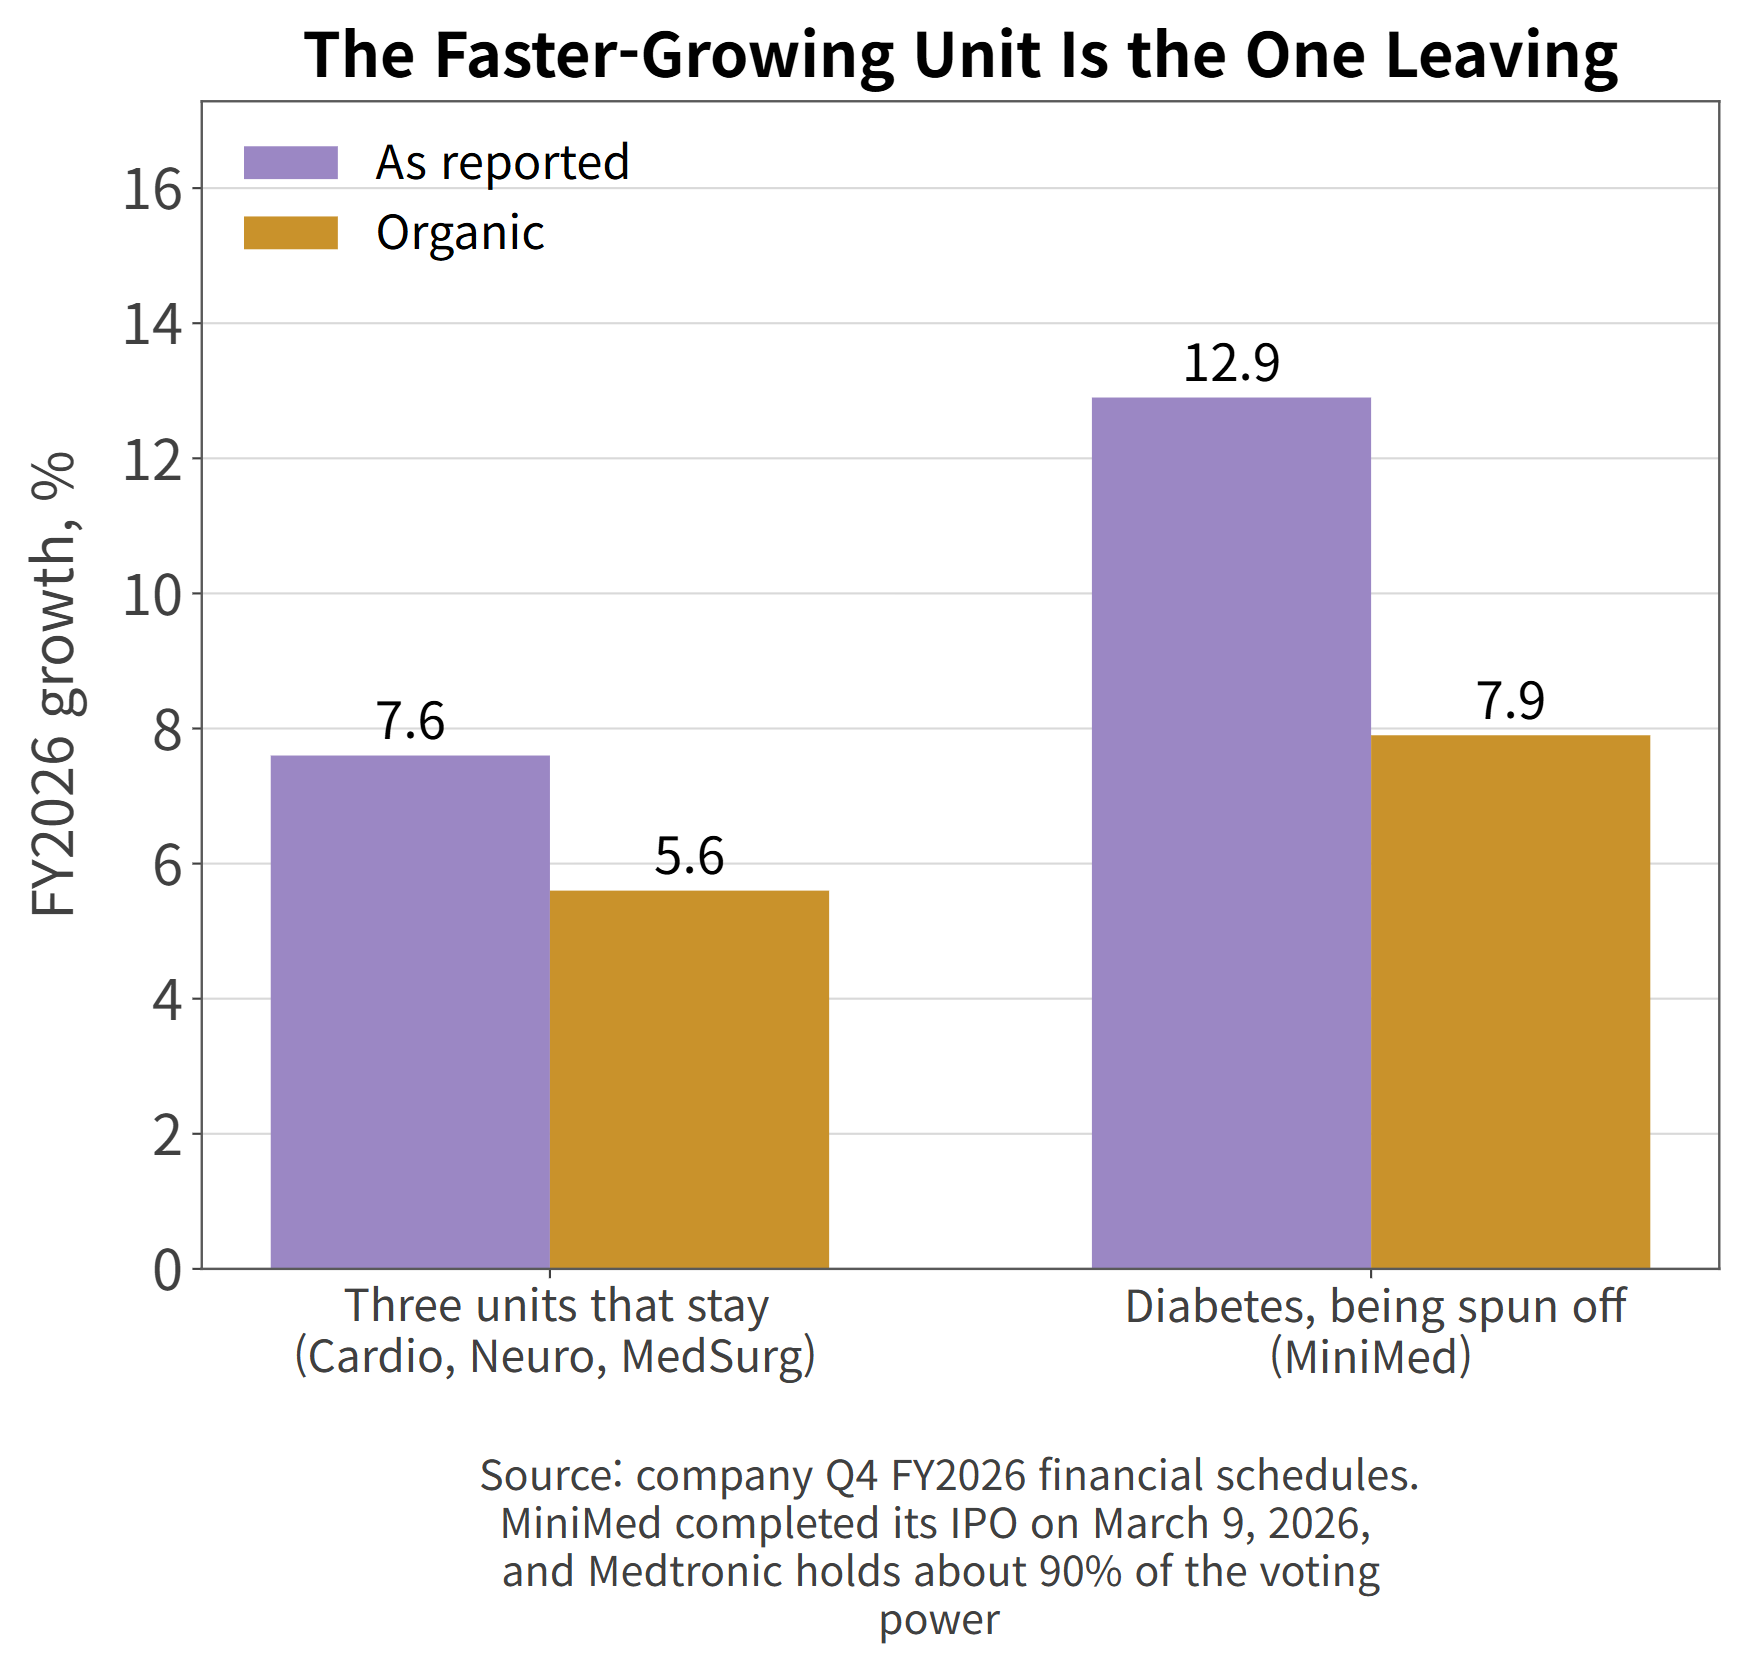
The faster-growing unit in FY2026 is the one being spun off
The question is which speed that unit was running at. On a reported basis, the three units that stay grew 7.6% in fiscal 2026 while diabetes grew +12.9%. Organic tells the same story, 5.6% against 7.9%.
The growth Medtronic put in large type was helped along by a business on its way out the door.
The exit is not finished. Medtronic holds about 90% of MiniMed's voting power, so the results still consolidate. MiniMed's own annual report notes that while Medtronic holds a majority of voting power, other stockholders generally cannot affect the outcome of matters put to a vote.
The diabetes business and the MiniMed IPO (source: company IR deck, page 14)
Fiscal 2027 guidance rests on that arrangement. The company states it assumes diabetes stays consolidated for all twelve months and that guidance will be updated should separation occur before year end. The growth rate and EPS range on offer today are provisional in a specific way.
Medical Device Market Outlook: Rising Demand, Stagnant Production
The Diabetes Device Market Could Grow Over 10% Annually Through 2030
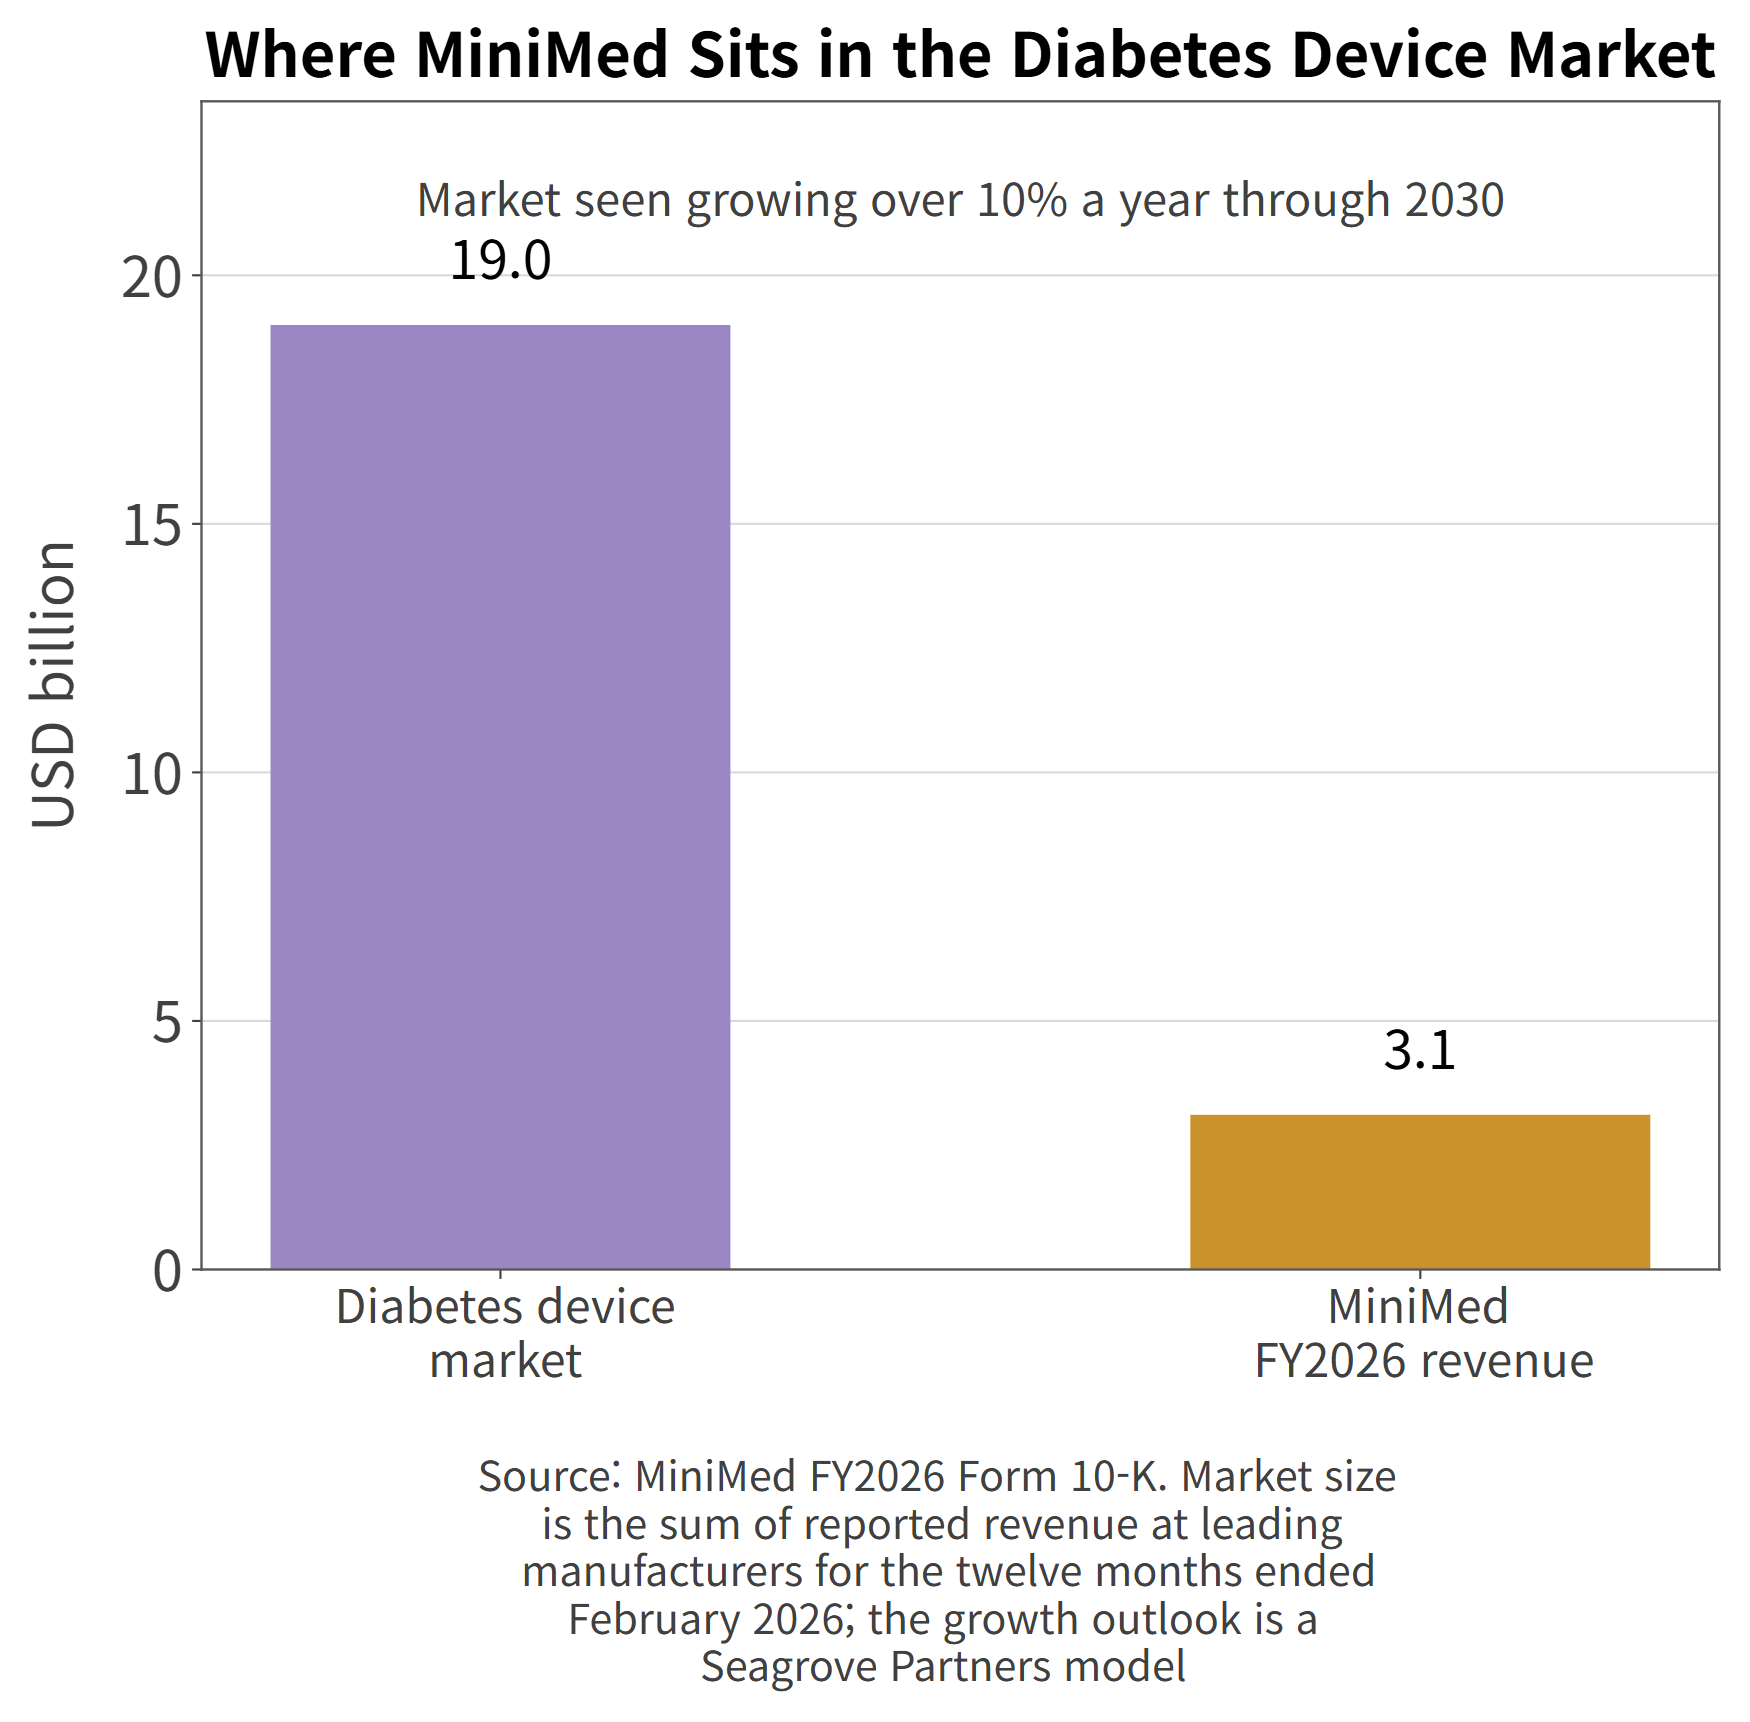
MiniMed puts the diabetes device market at more than $19 billion in its annual report, measured as the summed revenue leading manufacturers reported for the twelve months ended February 2026. A Seagrove Partners model from March 2026 has that market compounding at better than 10% a year through 2030.
Where MiniMed sits in the diabetes device market
Population sets the floor. The 2025 IDF Diabetes Atlas counts 589 million people living with diabetes worldwide, a figure projected to pass 850 million by 2050.
Penetration remains low. In the United States, roughly 1 million of 2.2 million people with type 1 diabetes use a pump, and about 270,000 of 1.9 million insulin-requiring type 2 patients do.
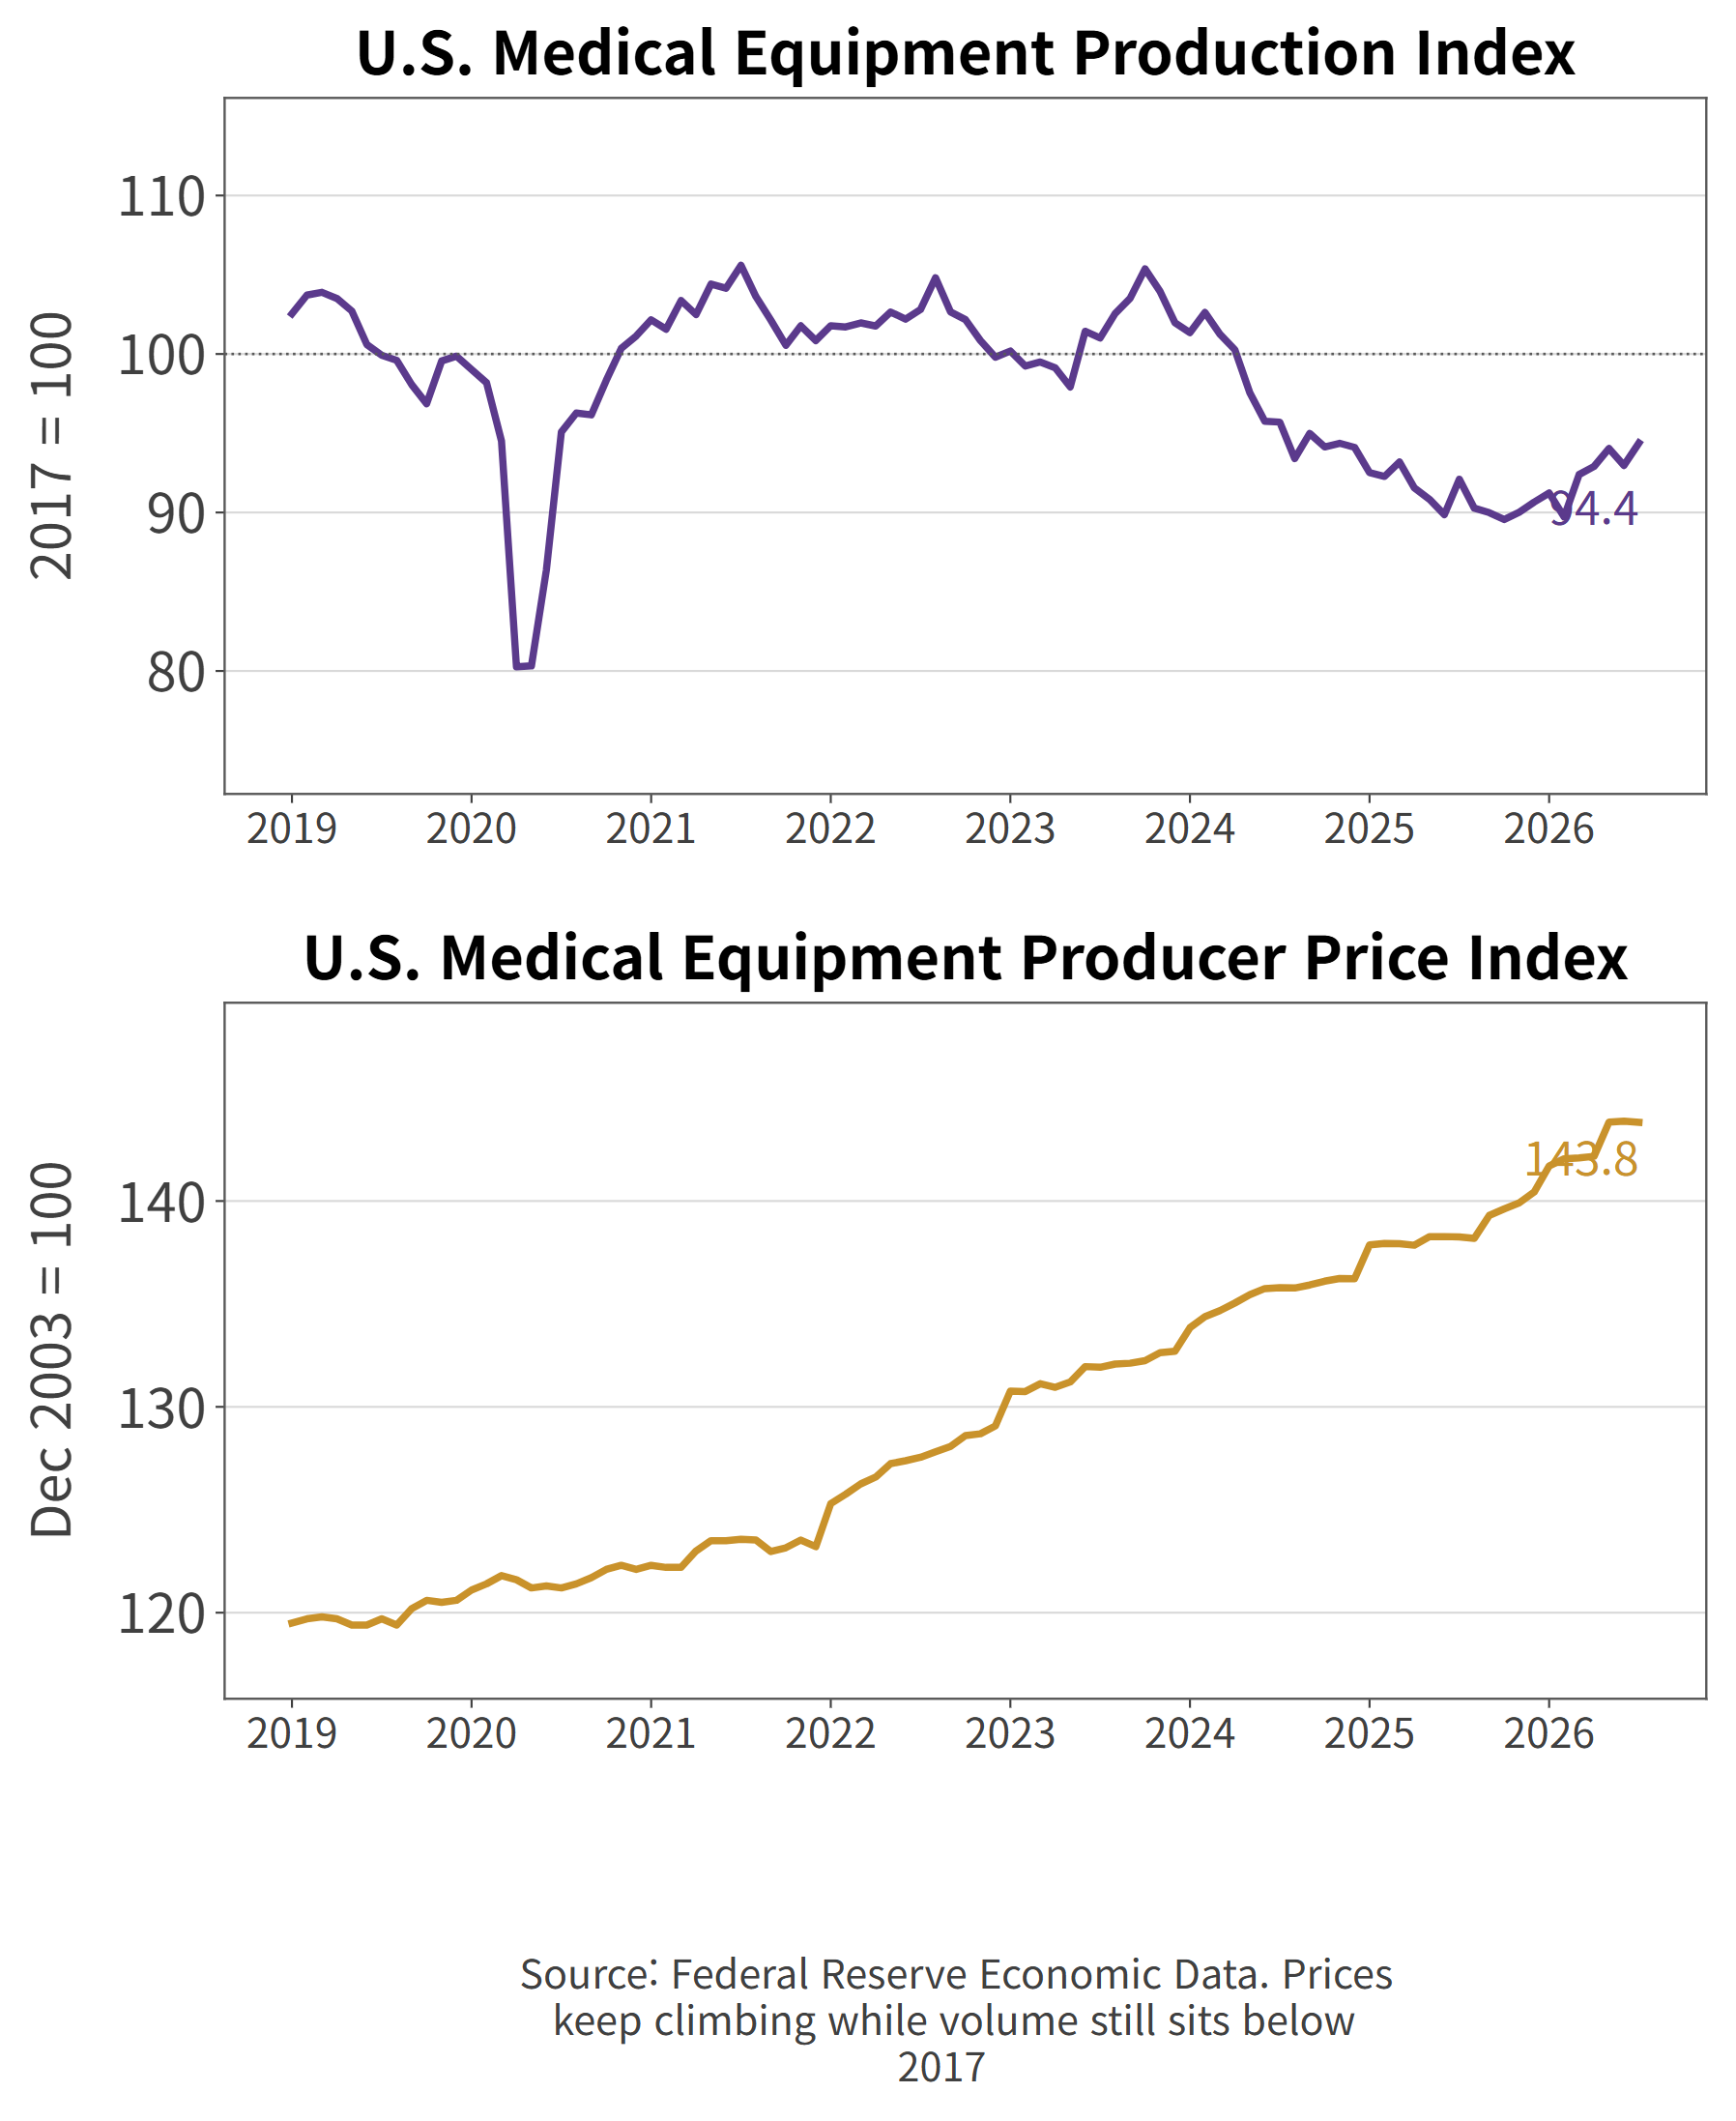
U.S. production data cuts the other way. The Federal Reserve's industrial production index for medical equipment and supplies stood at 94.4 in July 2026 against a 2017 base of 100. Six years after the pandemic dip, output has not recovered.
U.S. medical equipment production and producer price indices
The producer price index for the same industry reached 143.8 over the same stretch, on a December 2003 base of 100, and has climbed steadily for three years.
Prices rising while volume sits below where it was nine years ago tells you where industry growth is coming from. Much of it is price and mix rather than procedure count, which is the backdrop to Medtronic's organic growth running in the mid single digits.
End demand comes down to procedure volumes and hospital capital budgets. An aging population lifts cardiac and spine caseloads, but the pace at which hospitals buy new equipment is bound by staffing and reimbursement. Neuroscience running at 3% sits on exactly that constraint.
Which leaves two ways to lift growth in this industry. Replace an existing procedure with a more expensive new product, or open a category where devices have not gone yet. Cardiac ablation taking 8 points of U.S. share is the first. Insulin pumps reaching well under half of eligible patients is the second.
Boston Scientific Is Growing Faster as Tariff Costs Rise
Medtronic competes for the same hospital purchasing budget as Boston Scientific and Abbott in cardiovascular, and Stryker and Becton Dickinson in surgical.
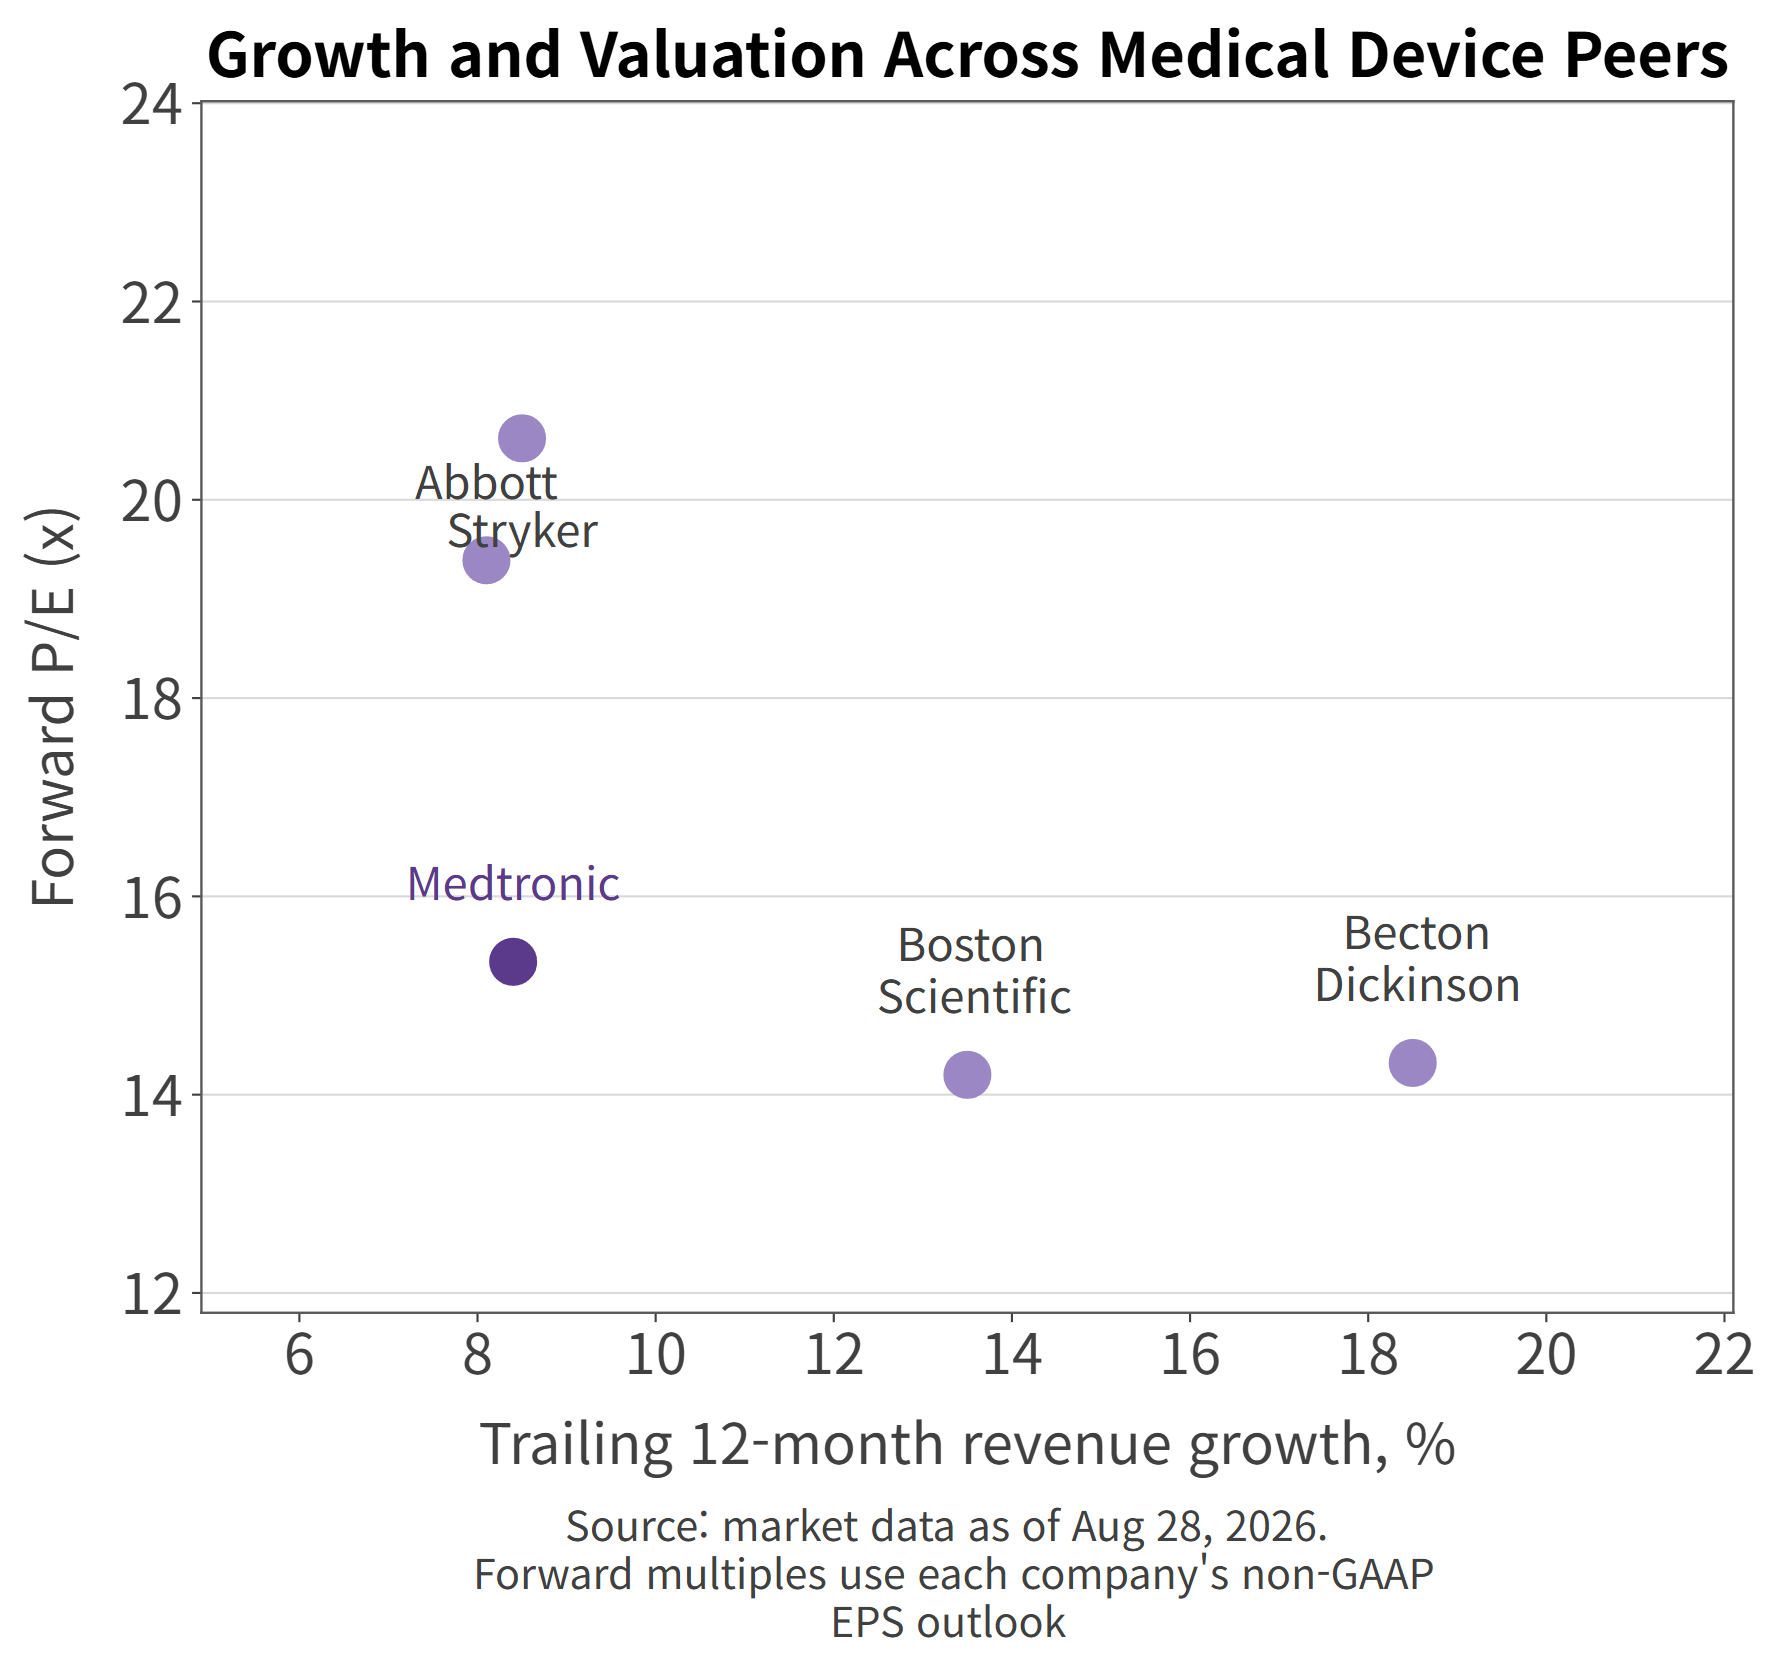
Growth and forward multiples across medical device peers
On growth alone it sits mid-pack. Trailing twelve-month revenue growth runs 18.5% at Becton Dickinson, 13.5% at Boston Scientific, 8.5% at Stryker, 8.4% at Medtronic, and 8.1% at Abbott.
Profitability sorts differently. Net margin comes in at 17.5% for Boston Scientific, 14.4% for Stryker, 13.2% for Medtronic, 11.6% for Abbott, and 4.2% for Becton Dickinson. Medtronic lands in the middle again.
Boston Scientific is the only peer holding both growth and margin at the top of the group, and it is also the company pressing hardest against Medtronic in cardiovascular.
Tariffs weigh on everyone here, and Medtronic has quantified its share. The fiscal 2026 annual report estimates a pre-tax net tariff impact of $250 million in fiscal 2027 based on rates as of June 3, 2026, before any consideration of government refunds. That is roughly 0.6% of expected revenue.
Medtronic GAAP operating margin across 11 fiscal years
Manufacturing footprints in this industry span many countries, so tariffs land directly on cost of goods. The same filing notes that tariff regulations adopted by different countries and trading zones govern its import and export activity. The 40 basis points of gross margin lost in fiscal 2026 was the first installment.
Regulation is not only tariffs. Every device needs clearance from each jurisdiction's regulator, and that timeline sets when revenue starts. Medtronic flagged the Hugo submission and the Stealth AXiS clearances in the fourth quarter for exactly that reason: approvals are where the next few years of revenue live.
High barriers cut both ways. New entrants struggle to get in, and incumbents move slowly into new territory. Buying CathWorks and announcing Scientia Vascular and SPR Therapeutics was Medtronic paying cash to skip that wait.
Is Medtronic Stock Undervalued? 24.5x Trailing vs. 15.3x Forward P/E
At the August 28, 2026 close of $91.23, market capitalization stands at $116.77 billion.
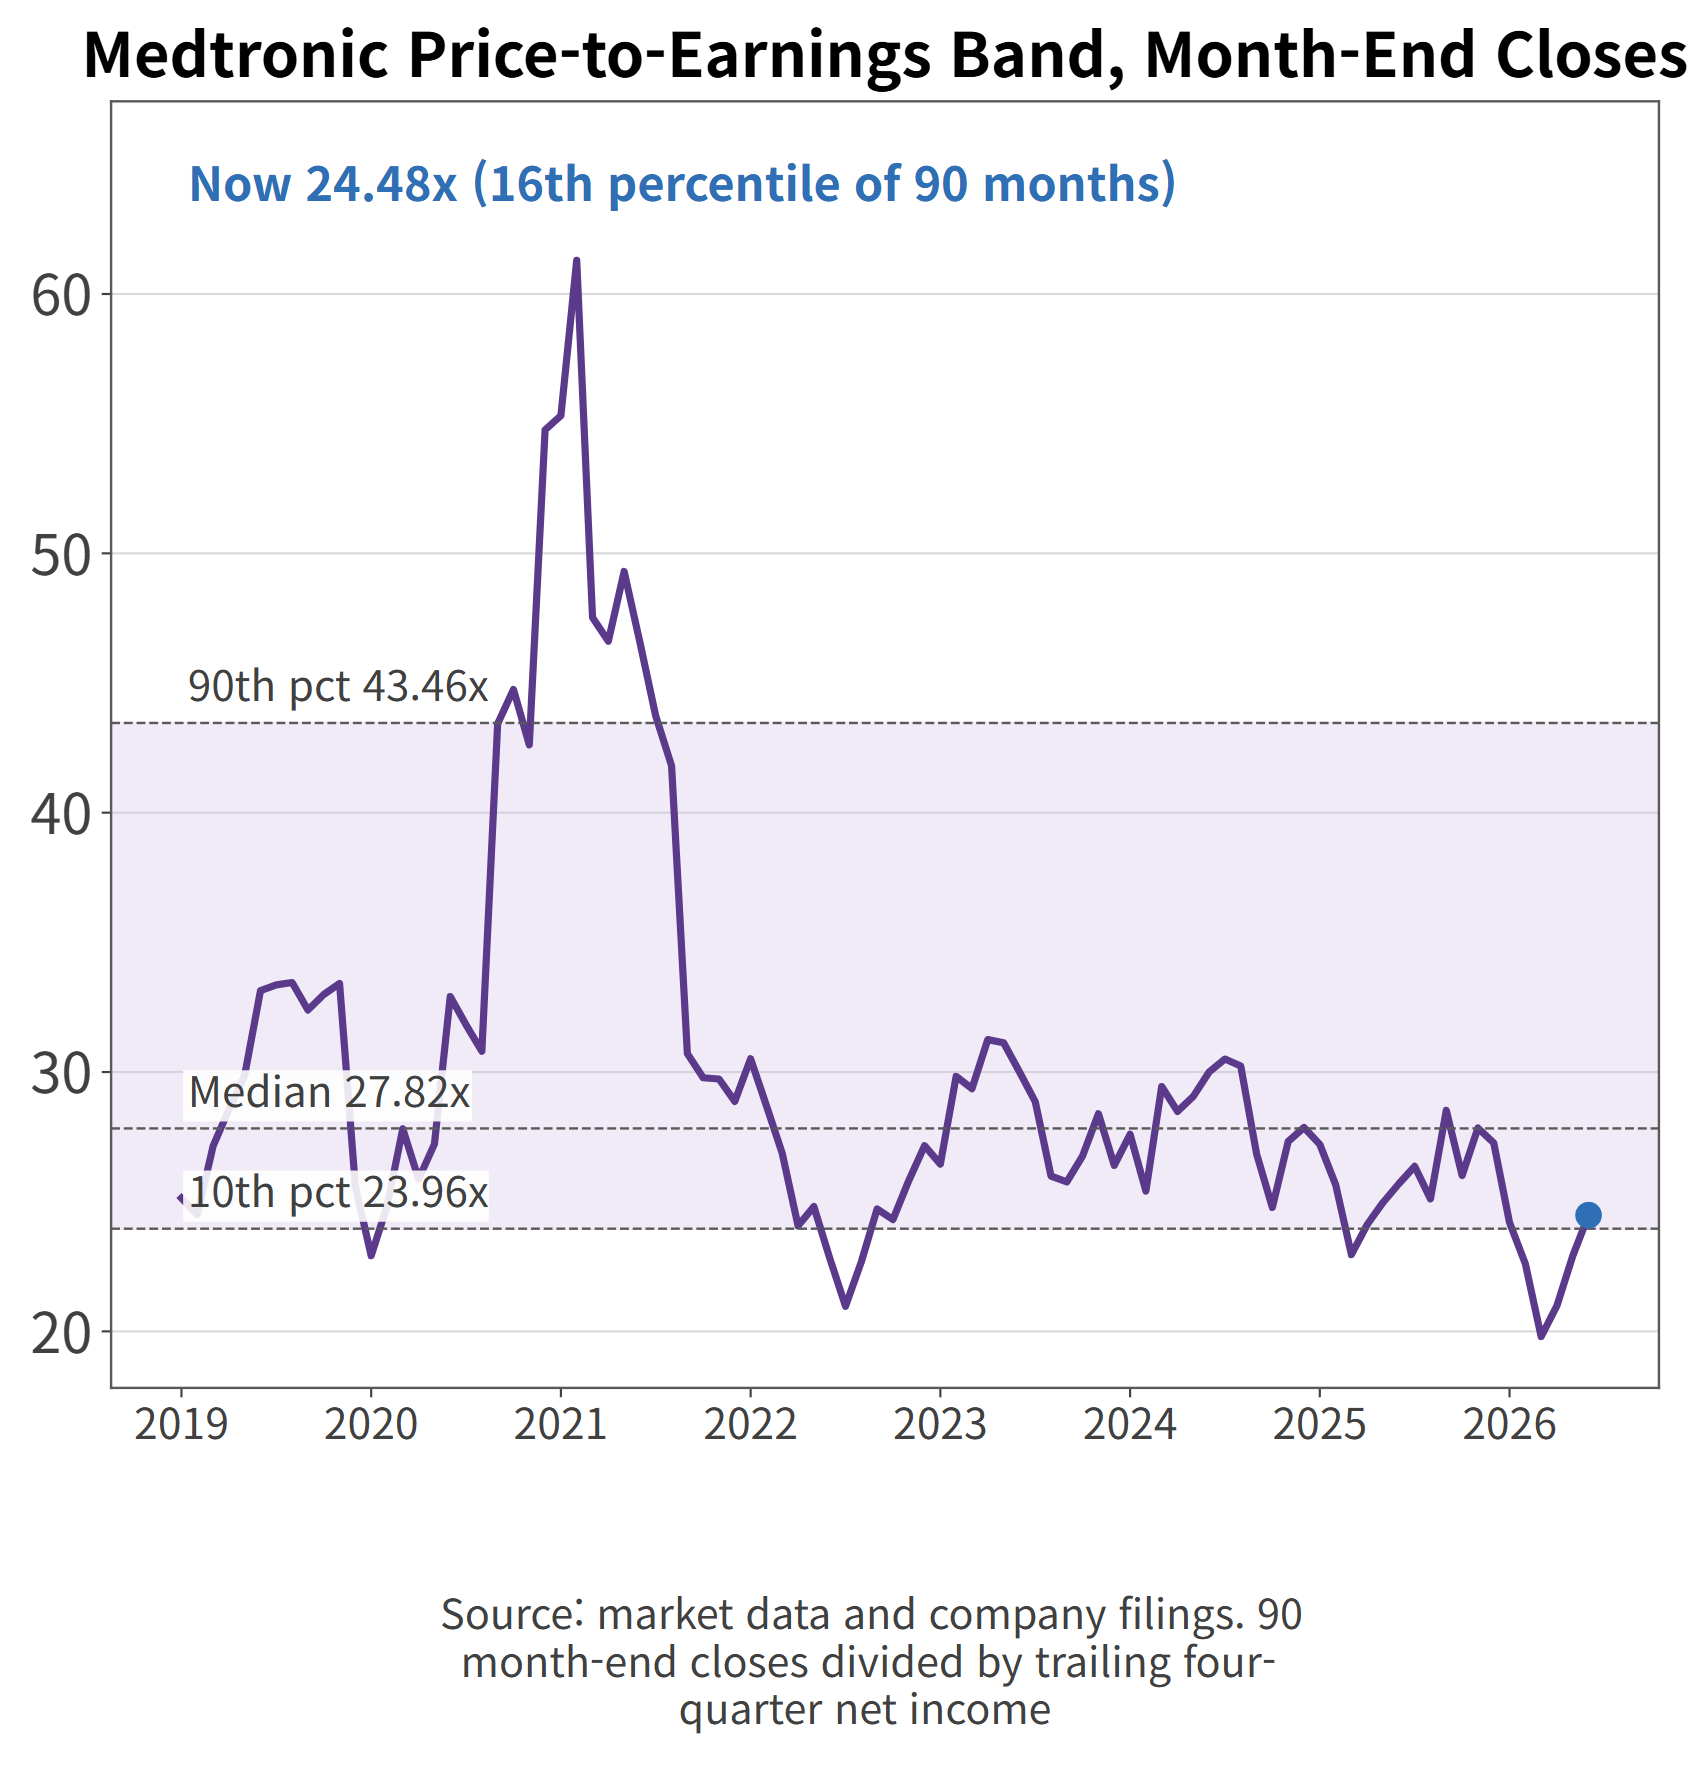
Medtronic price-to-earnings band across 90 month-end closes
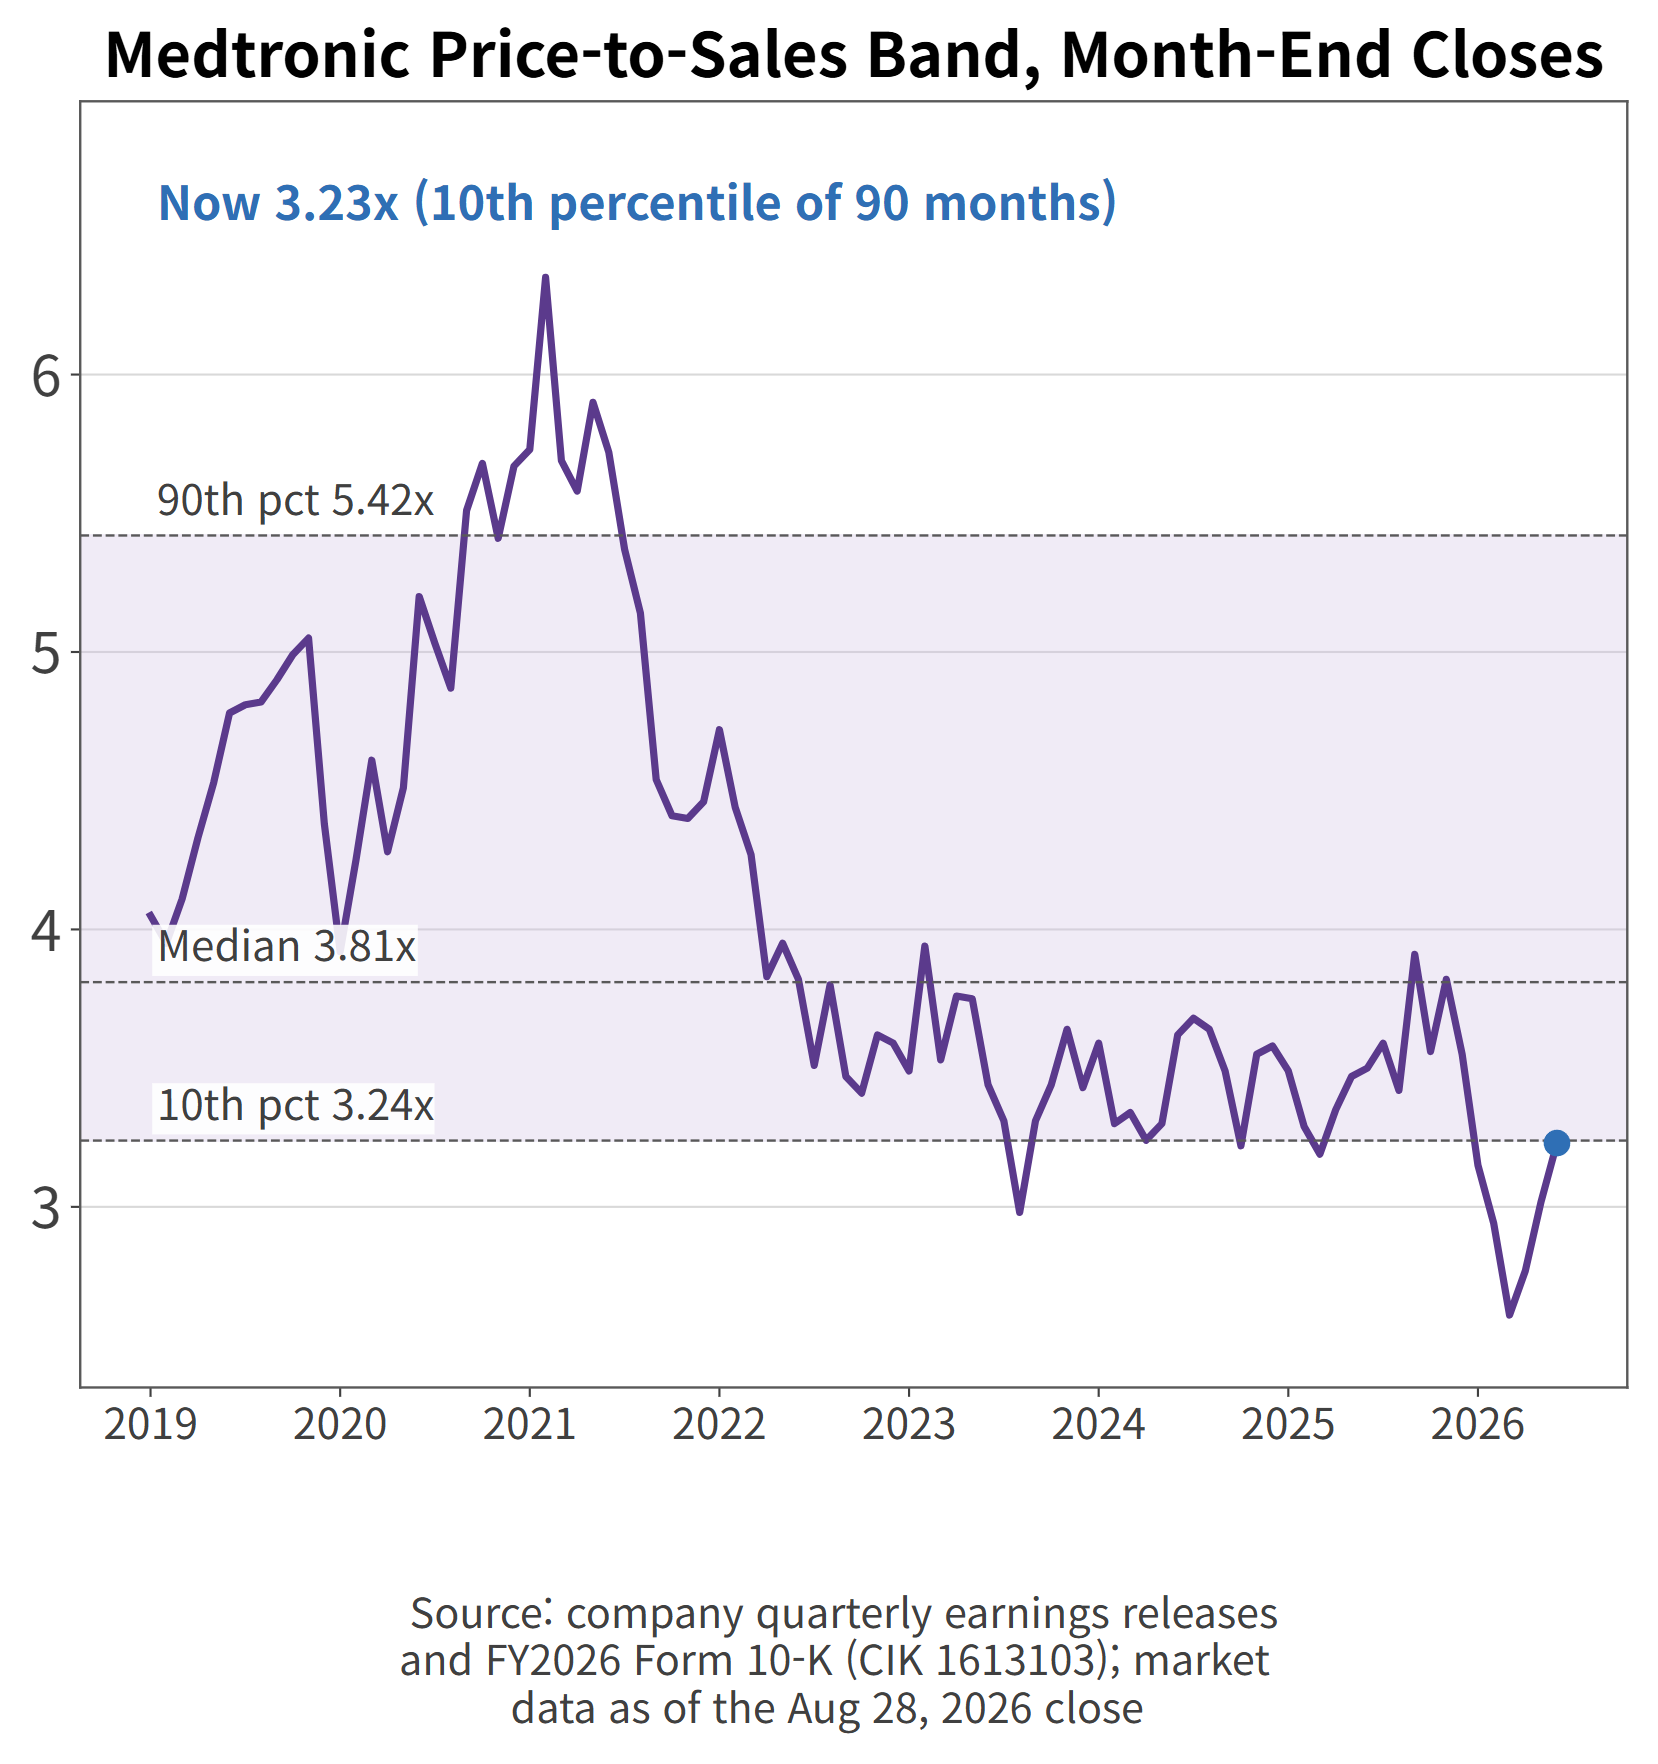
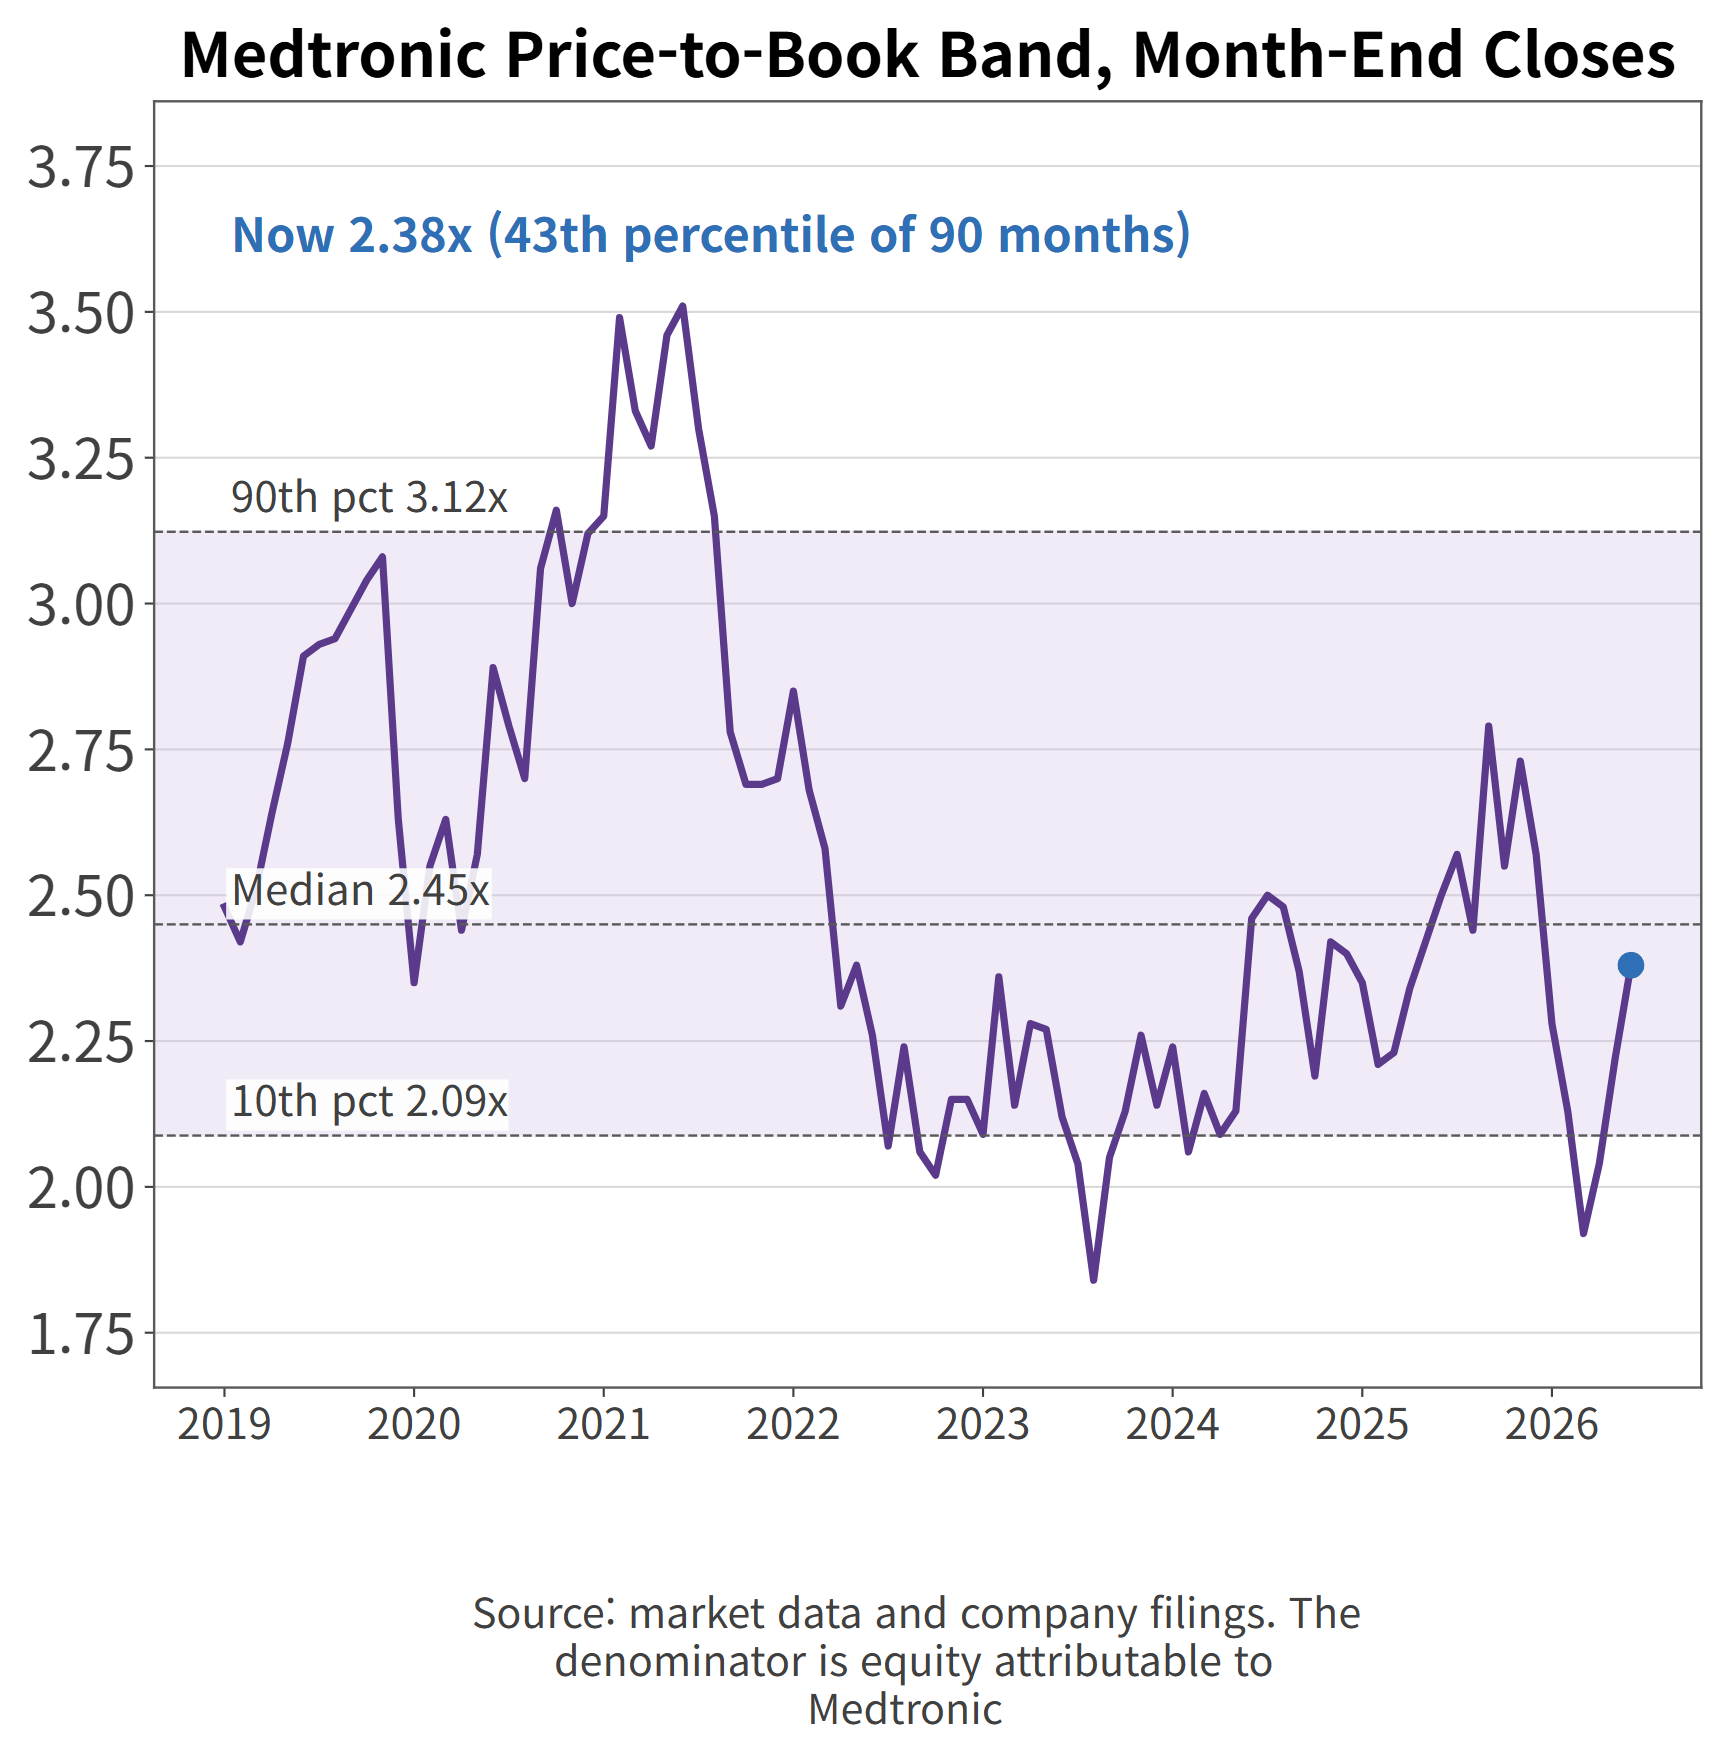
Laid against 90 months of month-end closes, the current multiples sit low. The price-to-earnings ratio of 24.5x falls at the 16th percentile, price-to-sales of 3.23x at the 10th, and price-to-book of 2.38x at the 20th. All three point the same direction.
Which is where the measuring stick splits. Data providers show a forward P/E of 15.3x, using the company's fiscal 2027 non-GAAP EPS guidance of $5.90 to $6.00 as the denominator. Use the GAAP figure of $3.73 and you get 24.5x. Same price, nine turns apart, entirely because of what sits underneath.
Medtronic price-to-sales band across 90 month-end closes
Neither is wrong. It is worth holding onto the fact that the gap between non-GAAP and GAAP EPS ran $1.80 in fiscal 2026, with non-GAAP at 1.48x GAAP.
Metric
Medtronic
Boston Scientific
Abbott
Stryker
Becton Dickinson
Market cap (USD bn)
116.8
67.9
194.6
126.8
51.6
Revenue growth (TTM)
+8.4%
+13.5%
+8.1%
+8.5%
+18.5%
Net margin
13.2%
17.5%
11.6%
14.4%
4.2%
P/E
24.5x
19.0x
36.4x
34.3x
32.5x
Forward P/E
15.3x
14.2x
19.4x
20.6x
14.3x
P/S
3.21x
3.23x
4.18x
4.91x
2.30x
Dividend yield
3.16%
none
2.24%
1.06%
2.22%
Market data as of the August 28, 2026 close
Medtronic carries the second-lowest P/E among the five and the highest dividend yield. Mid-pack growth priced at the bottom of the group.
The dividend is the long-running part of this story. The board raised the fiscal 2027 first-quarter payout to $0.72 a share, an annualized $2.88, marking the 49th consecutive year of increases. Medtronic returned $4.2 billion to shareholders in fiscal 2026.
Medtronic price-to-book band across 90 month-end closes
One number complicates the picture. Diluted share count fell from 1.3514 billion in fiscal 2022 to 1.2881 billion in fiscal 2026, a reduction of -4.7%, and EPS still went nowhere. Whatever buybacks added, something else took back.
Medtronic FY2027 Guidance: Three Assumptions Investors Should Know
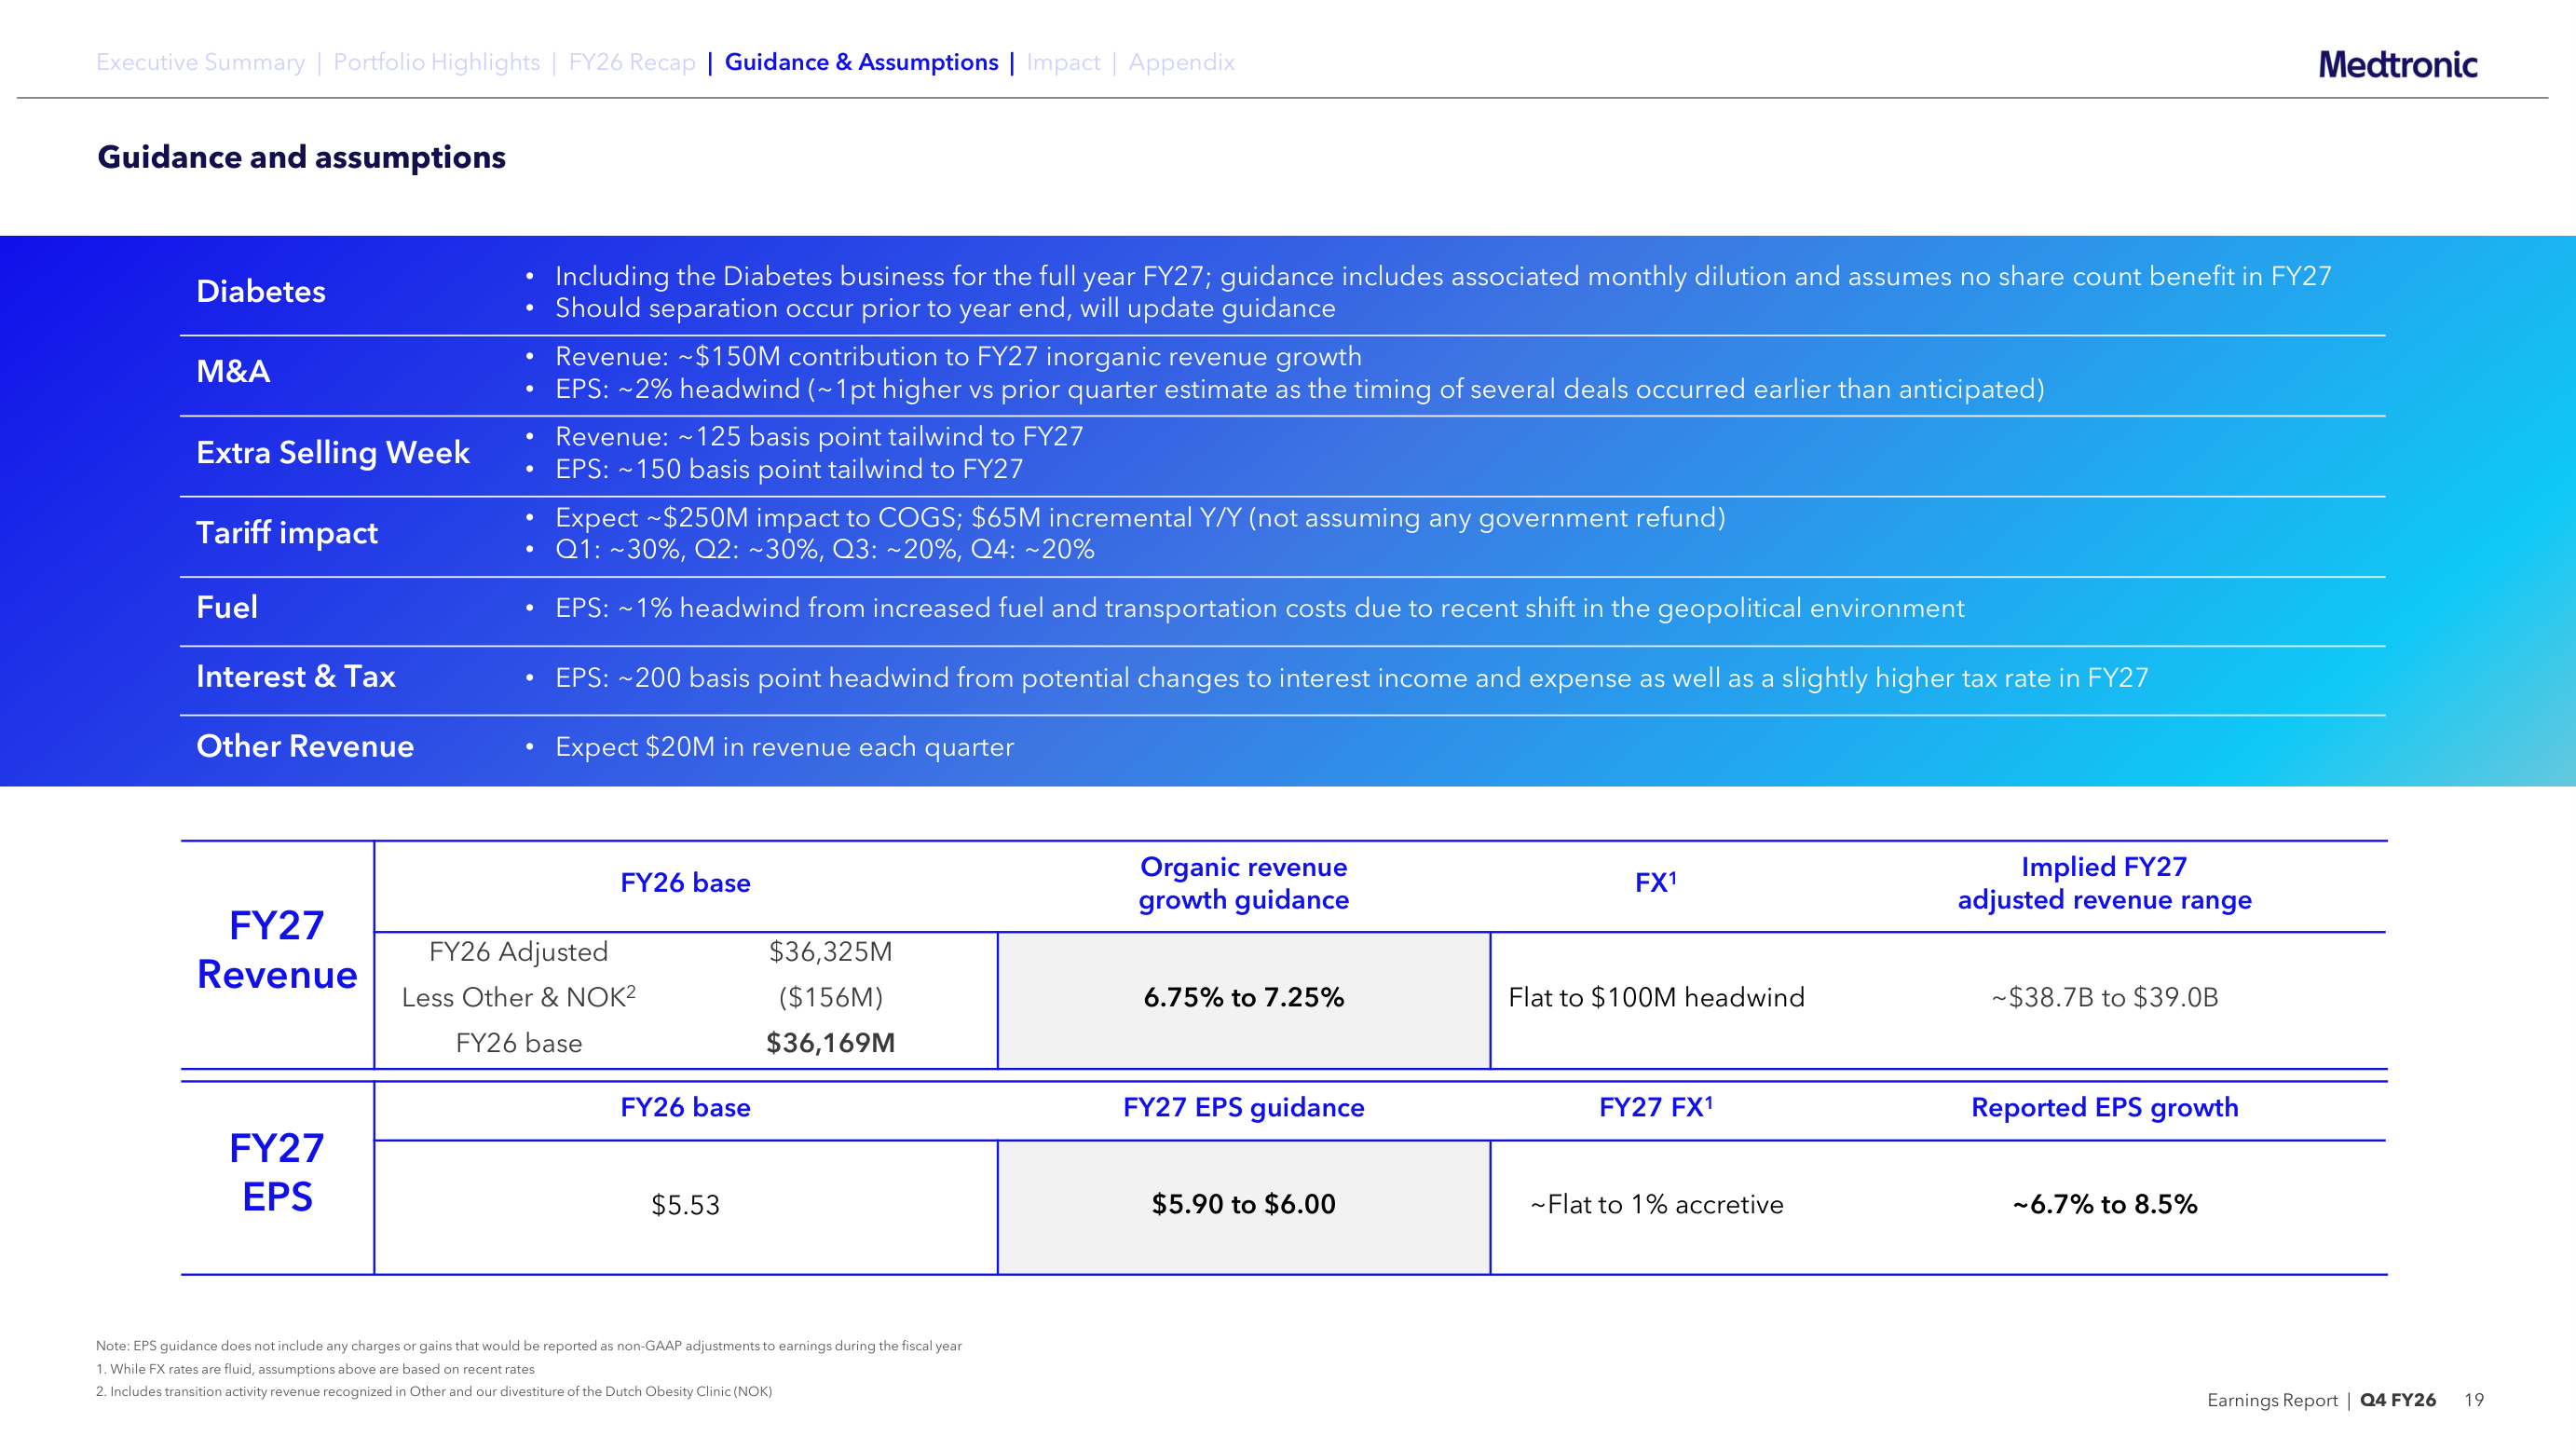
Guidance calls for organic revenue growth of 6.75% to 7.25% and non-GAAP diluted EPS of $5.90 to $6.00, which works out to EPS growth of 6.7% to 8.5%.
FY2027 guidance and its assumptions (source: company IR deck, page 19)
Faster than last year on the face of it. The assumptions printed on the same page deserve equal attention.
Item
Figure
FY2026 adjusted revenue
$36.325 billion
Less other revenue and NOK divestiture
$156 million
FY2027 base revenue
$36.169 billion
Organic growth guidance
6.75% to 7.25%
Currency assumption
Flat to $100 million headwind
Implied FY2027 adjusted revenue
$38.7 billion to $39.0 billion
FY2026 non-GAAP EPS
$5.53
FY2027 EPS guidance
$5.90 to $6.00
M&A contribution
About $150 million of FY2027 inorganic revenue
Source: company Q4 FY2026 earnings presentation, page 19
The first assumption is a 53rd week. Because Medtronic closes its books on the last Friday in April, an extra week lands every few years, and fiscal 2027 is one of those years. The company states plainly that both the growth and EPS guidance include the extra selling week. A week is 1.9% of a year.
The second is twelve months of consolidated diabetes, which reverses if separation completes mid-year.
The third is acquisitions. About $150 million of fiscal 2027 revenue is expected to come from deals. CathWorks has closed; Scientia Vascular and SPR Therapeutics were announced in May.
Strip the extra week and the acquired revenue out of 6.75% to 7.25% and what the base business generates on its own sits lower. The company has not published that figure separately.
A test arrives shortly. Medtronic reported fourth-quarter fiscal 2026 results on June 3, about two weeks later than the late-May timing of the prior three years. Shifted by the same amount, first-quarter fiscal 2027 results would land in the first days of September, though no date has been confirmed in a company filing or investor relations notice.
When the release does come, two things settle the question. Whether organic growth cleared 6.75%, and how much further tariffs pushed into gross margin.
Medtronic Stock Outlook: EPS Growth Is the Metric That Matters
Fiscal 2026 was, as Medtronic said, its fastest revenue growth in ten years. It was also a year in which 29.1% of the increase came from currency, the fastest-growing unit had already completed an IPO on its way out, and tariffs plus a development milestone took 1.3 points off operating margin.
Which is how EPS ends up where it stood four years ago, with revenue +14.8% higher and the share count -4.7% lower.
The case rests on fiscal 2027. What remains of 6.75% to 7.25% after the extra week and the acquisitions, and whether that growth reaches per-share earnings this time. A 49-year dividend growth streak and a P/E at the 16th percentile of nine years are what an investor collects while that gets answered.
Medtronic Stock Analysis: Methodology and Sources
Revenue, growth rates, and non-GAAP EPS for fiscal 2016 through fiscal 2026 were parsed from all 42 quarterly earnings releases Medtronic filed as Form 8-K exhibits with the SEC, then cross-checked line by line against XBRL company facts from the annual filings; the two sources agreed on every year. Segment revenue and organic growth come from the Q4 FY2026 financial schedules. Margin components and guidance assumptions come from the Q4 FY2026 earnings presentation, pages 17 and 19. Diabetes market data and MiniMed ownership come from MiniMed Group's FY2026 Form 10-K. Industry production and price indices are Federal Reserve Economic Data series IPN3391S and PCU33913391. Peer figures and month-end closes are from market data providers. Valuation multiples were computed from 90 consecutive month-end closes divided by trailing four-quarter figures, with book value based on equity attributable to Medtronic.
This article is for information only and is not investment advice. Last updated: August 31, 2026.