Credo (CRDO) Stock Analysis: GAAP vs Non-GAAP Earnings Gap
by Global Stock Brief2026. 8. 31.
Credo Technology Group Holding (CRDO) — two books, one firm
Credo Technology Group (NASDAQ: CRDO) is one of the fastest-growing AI connectivity companies in the semiconductor sector: fiscal 2026 revenue rose +205.7% to $1.34 billion. This CRDO stock analysis works through the gap between Credo's GAAP and non-GAAP earnings, its stock-based compensation, its customer concentration, its guidance track record, and its valuation.
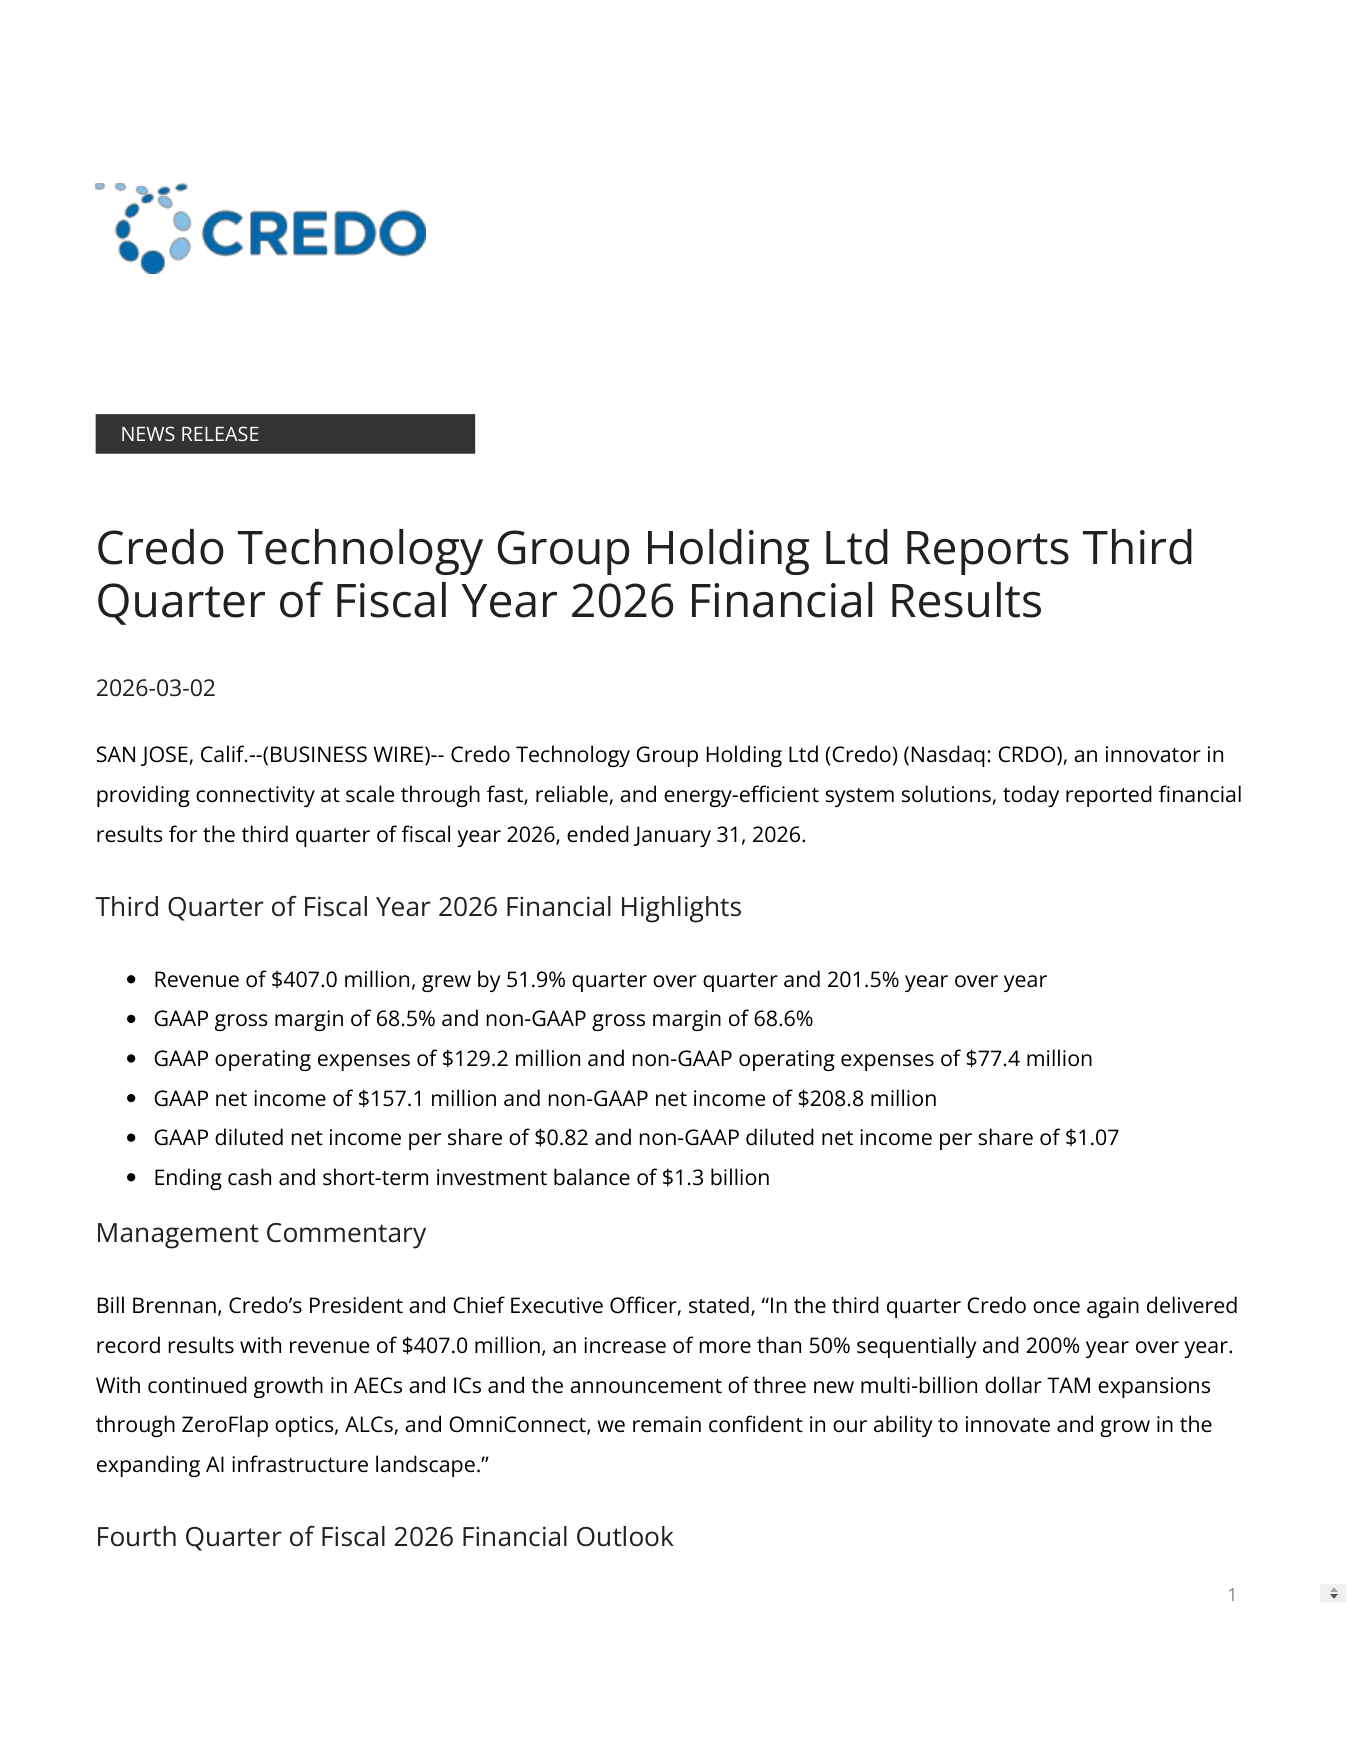
Credo fiscal 2026 third-quarter earnings release (source: company IR, March 2, 2026)
Start with the number the company led with. Credo closed fiscal 2026 with adjusted net income of $661.5 million, more than five times the prior year. Two pages later in the same release, the income statement says $472.3 million. The $189.2 million did not go missing. It is the amount the company asks you to leave out. And it is still growing.
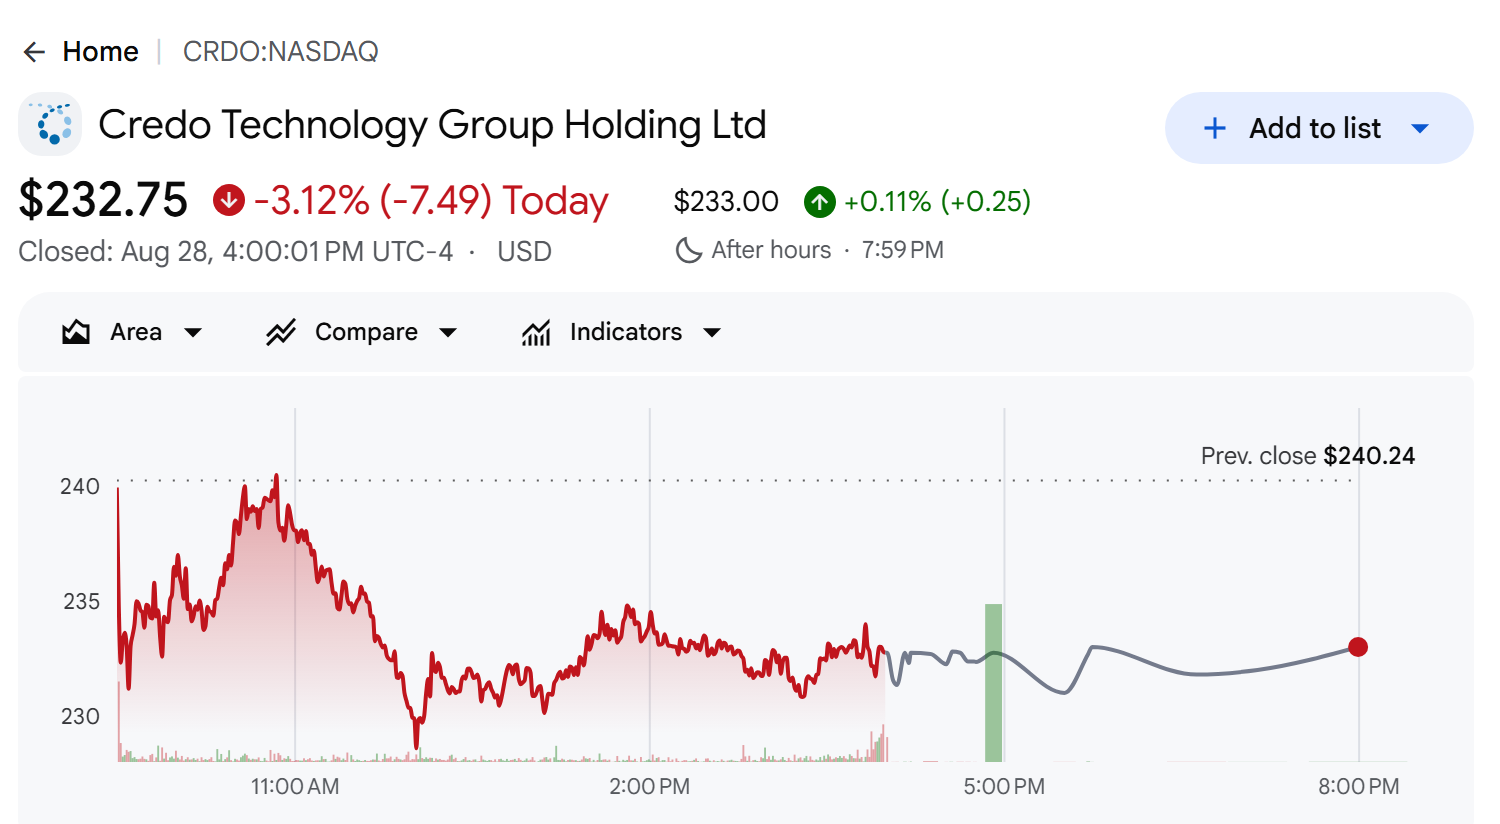
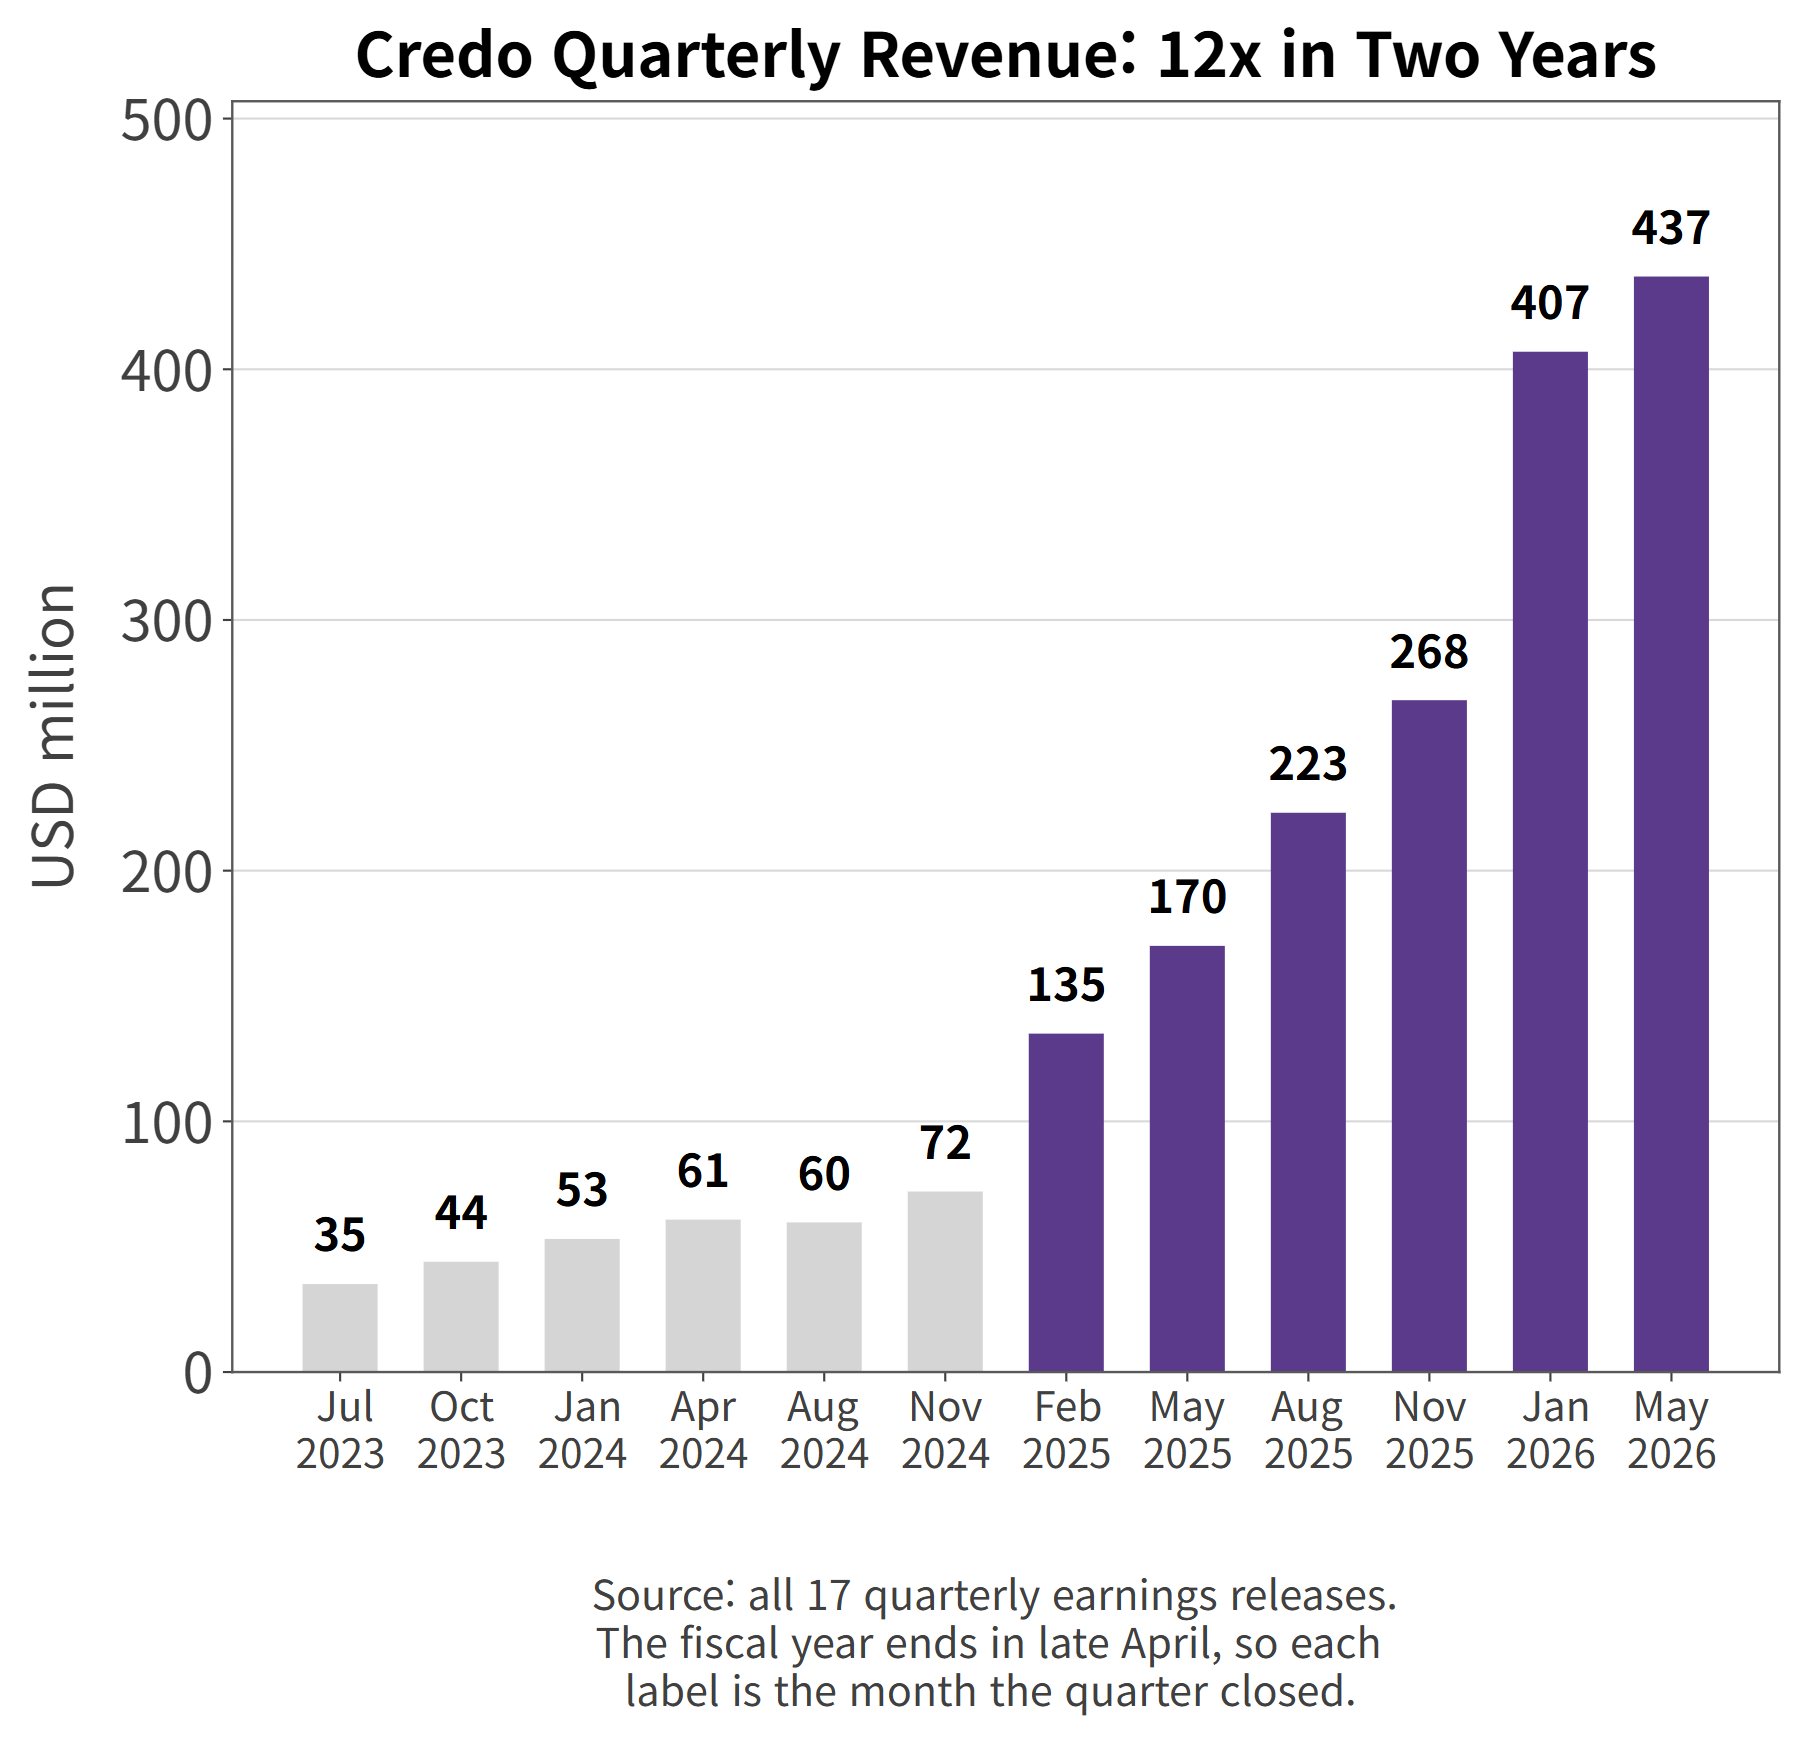
Credo closed at $232.75 on August 28, 2026, down -3.12% on the day, for a market value of $43.8 billion. Two years ago the company booked $35.1 million of revenue in a quarter. Last quarter it booked $437.0 million.
Credo Technology Group Holding (CRDO) intraday chart (captured August 28, 2026)
I parsed all 17 of Credo's quarterly earnings releases and lined them up against the XBRL filings. What follows is not the growth story. It is the gap between two profit numbers, and the five quarters when only one of them was positive.
What Does Credo Technology (CRDO) Do?
Credo's Four Product Lines
Credo builds the parts that carry signals inside a data center. The fiscal 2026 10-Kbreaks the portfolio into four lines: active electrical cables, optical transceivers, retimers and DSPs, and licensed SerDes intellectual property.
Credo quarterly revenue, last 12 quarters
The job behind all four is the same. Tie tens of thousands of GPUs into one cluster and you need wire between them; the longer the wire, the worse the signal gets. Credo sells the silicon and the cable that rebuild that signal.
What the 10-K leads with is not speed. It is power and cost. The company says it matches competitors' performance on an older, cheaper process node. Wafers cost less there, and capacity is easier to get.
One product carries a name the company repeats. ZeroFlap optics, developed with Oracle, cut the link-flap problem in AI clusters. A cluster that stabilizes faster is a cluster that leaves fewer GPUs idle.
The lineup kept widening through the year. Company press releases introduced Robin, an 800G optical DSP family; Cardinal, a low-power 1.6T optical DSP family; and a 224G scale-up retimer supporting UALink and Ethernet. That last one pushes Credo into the fabric that ties GPUs to each other, not just to the network.
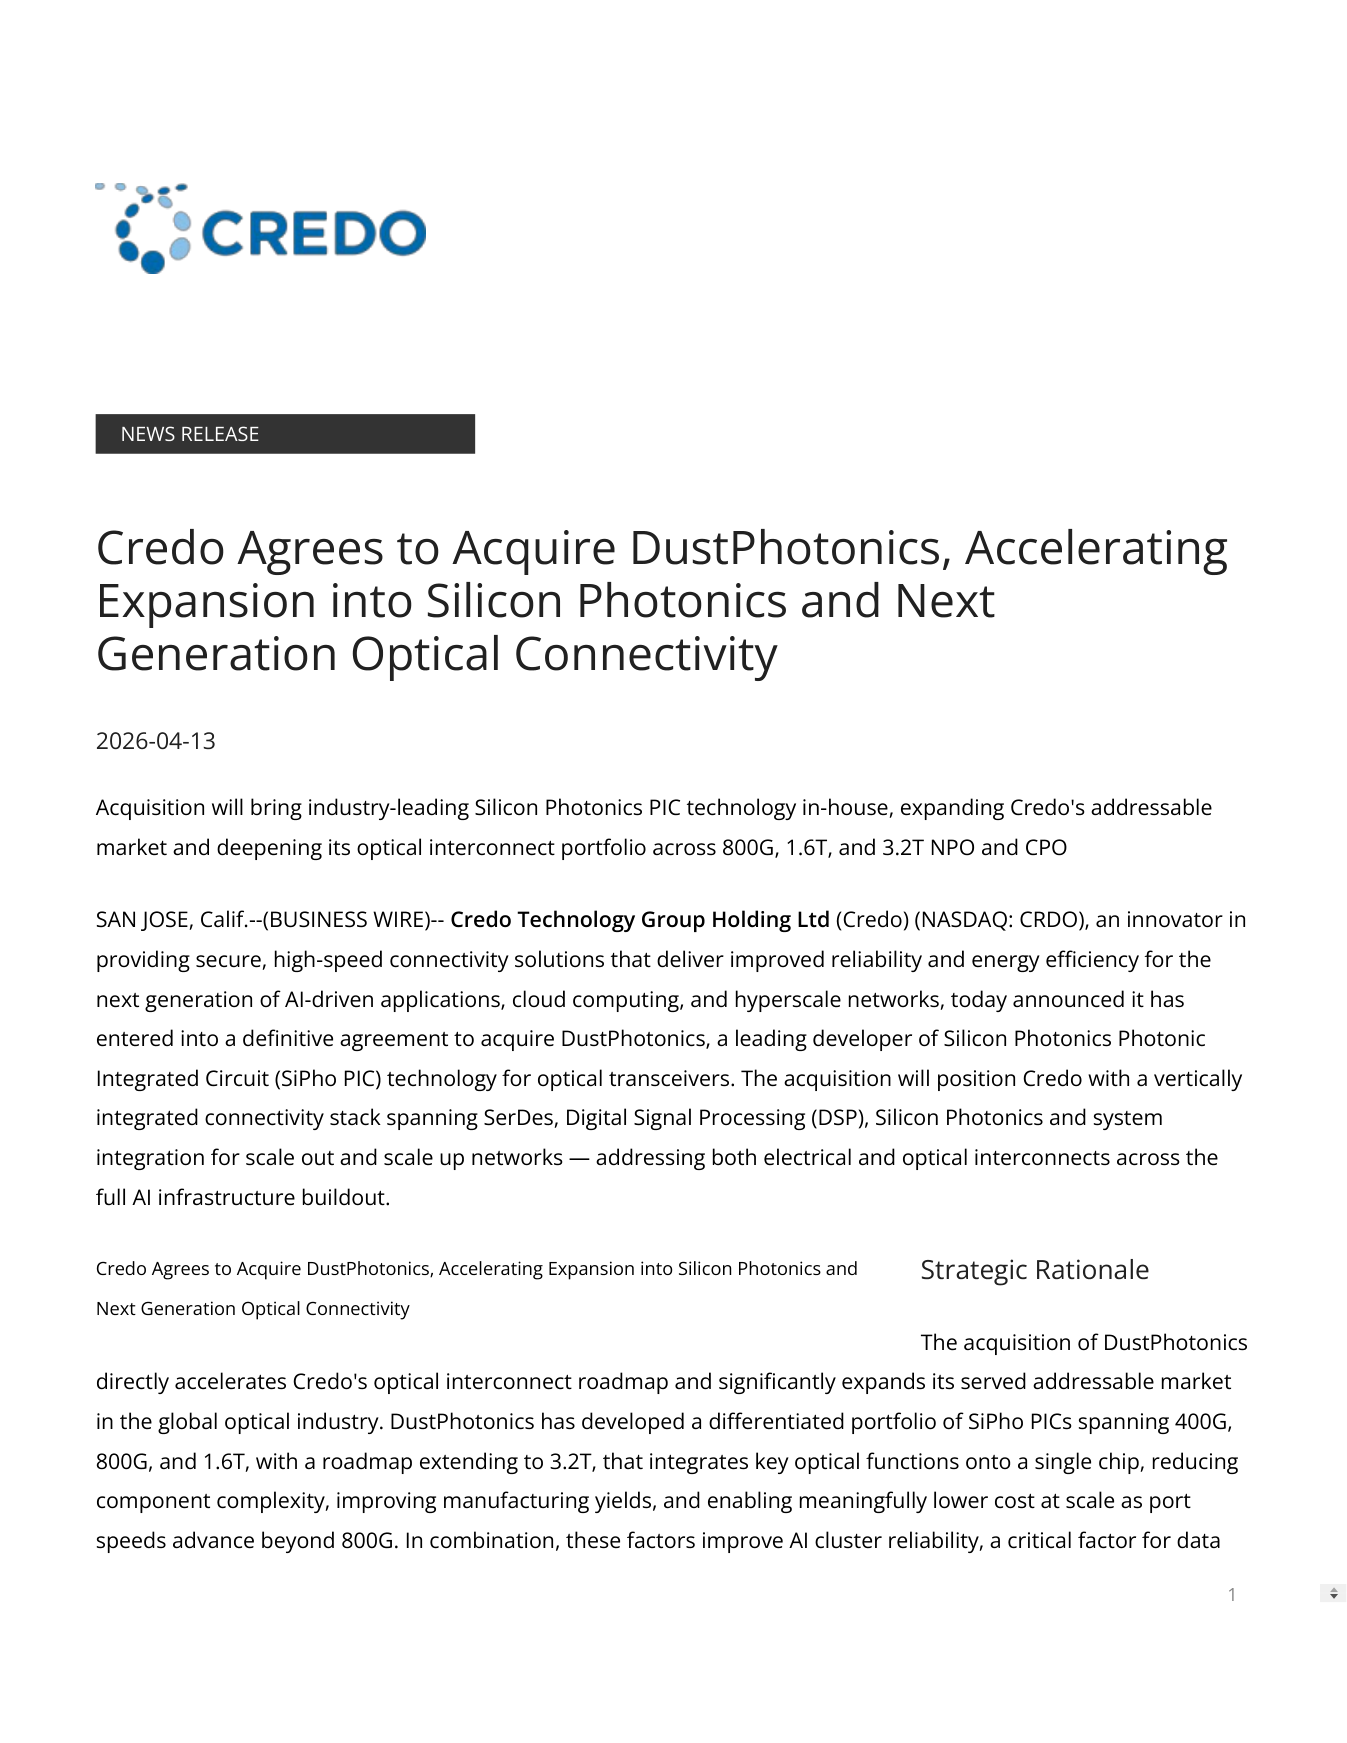
Some of it was bought rather than built. Credo agreed to acquire silicon-photonics firm DustPhotonics and completed its purchase of CoMira Solutions. The $9.3 million of acquisition and integration costs that first appear in the May 2026 income statement are the trace those deals left.
Credo announcement of the DustPhotonics acquisition (source: company IR)
Who Are Credo's Largest Customers?
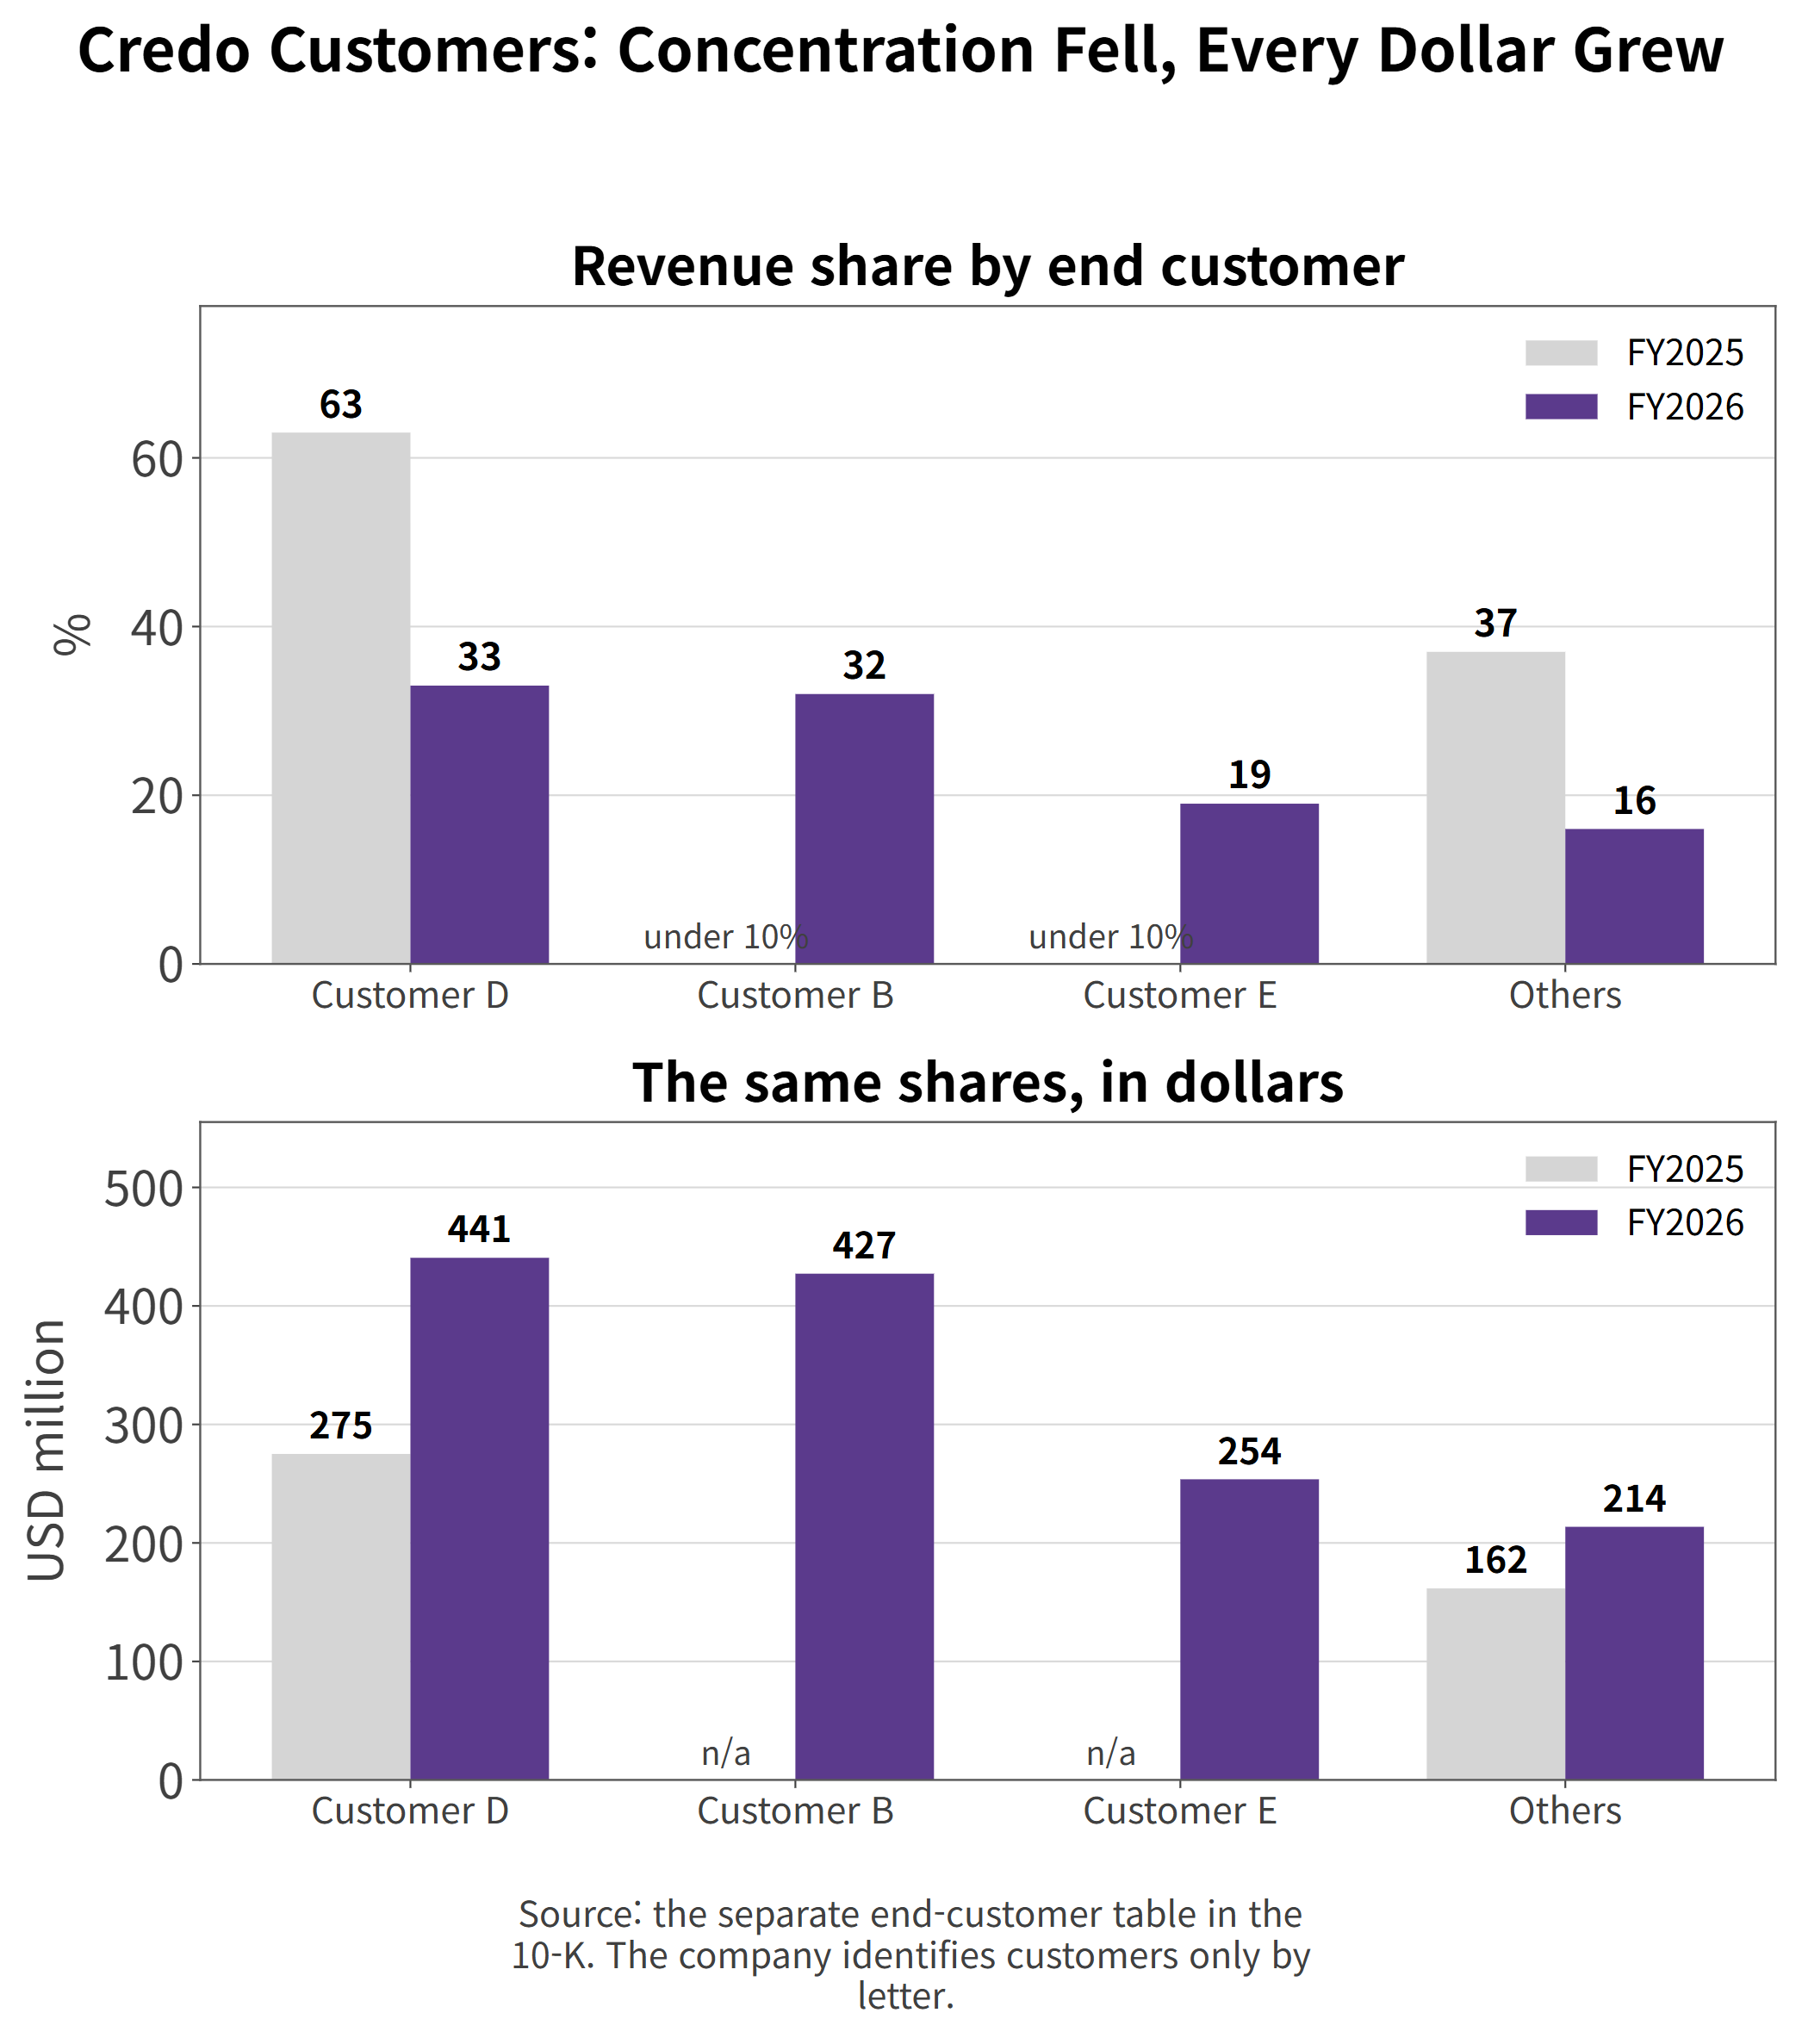
Credo's customer list is short. The 10-K says the top 10 customers accounted for about 90% of fiscal 2026 revenue, with two customers above 10% each.
What makes the disclosure unusual is that Credo publishes it twice. The customers named in the financial statements are often contract manufacturers placing the orders. So the company adds a second table, built on end-customer profile instead.
End customer
FY2025
FY2026
Customer D
63%
33%
Customer B
under 10%
32%
Customer E
under 10%
19%
Others
37%
16%
The company identifies these buyers only by letter. The 10-K describes its demand base as hyperscale data-center operators and neoclouds, and a separate release announced work with TensorWave on AMD-based AI clusters.
Credo revenue share by end customer, and the same shares in dollars
AI Data Center Connectivity Market Outlook
Output Is at a Record; Utilization Is Not
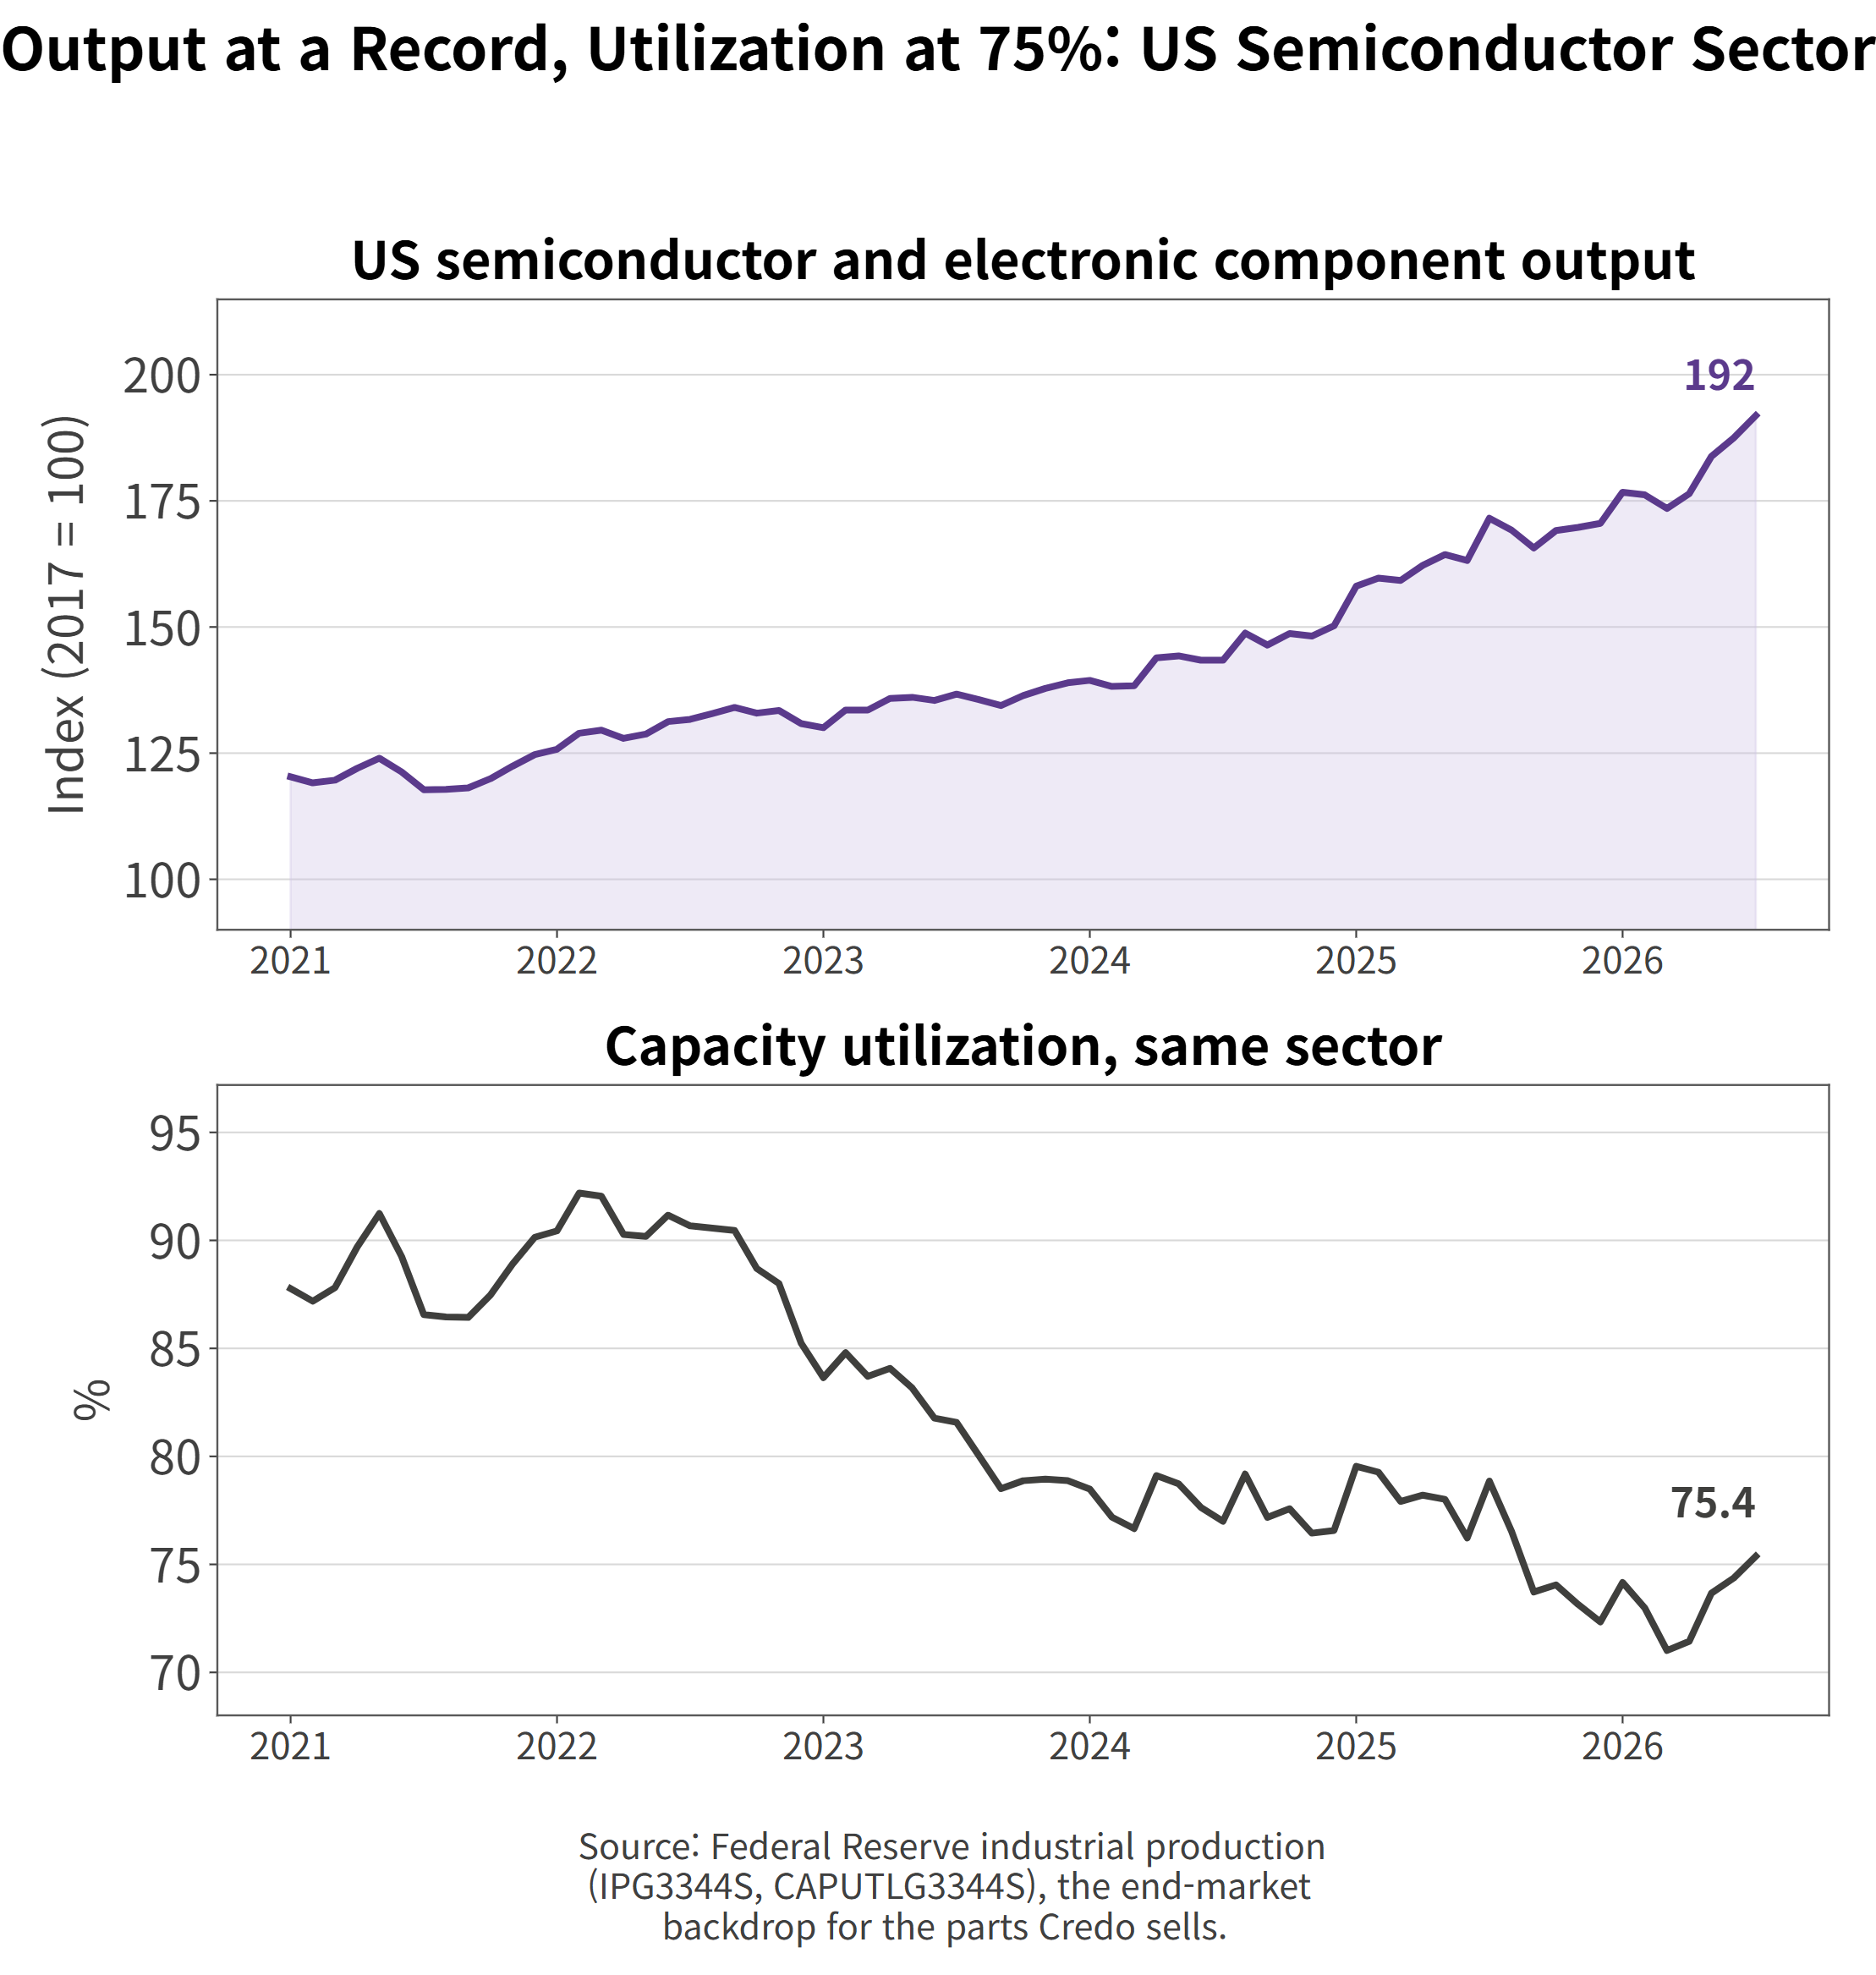
Demand for Credo's parts rides on data-center capital spending. The Federal Reserve's industrial production index for semiconductors and electronic components hit 191.9 in July 2026, an all-time high. It sat near 120 at the start of 2021.
US semiconductor output and capacity utilization
Capacity utilization in the same sector reads 75.4%. It has fallen steadily from 92% in mid-2022. Output at a record with utilization near a decade low means the industry added capacity faster than it filled it.
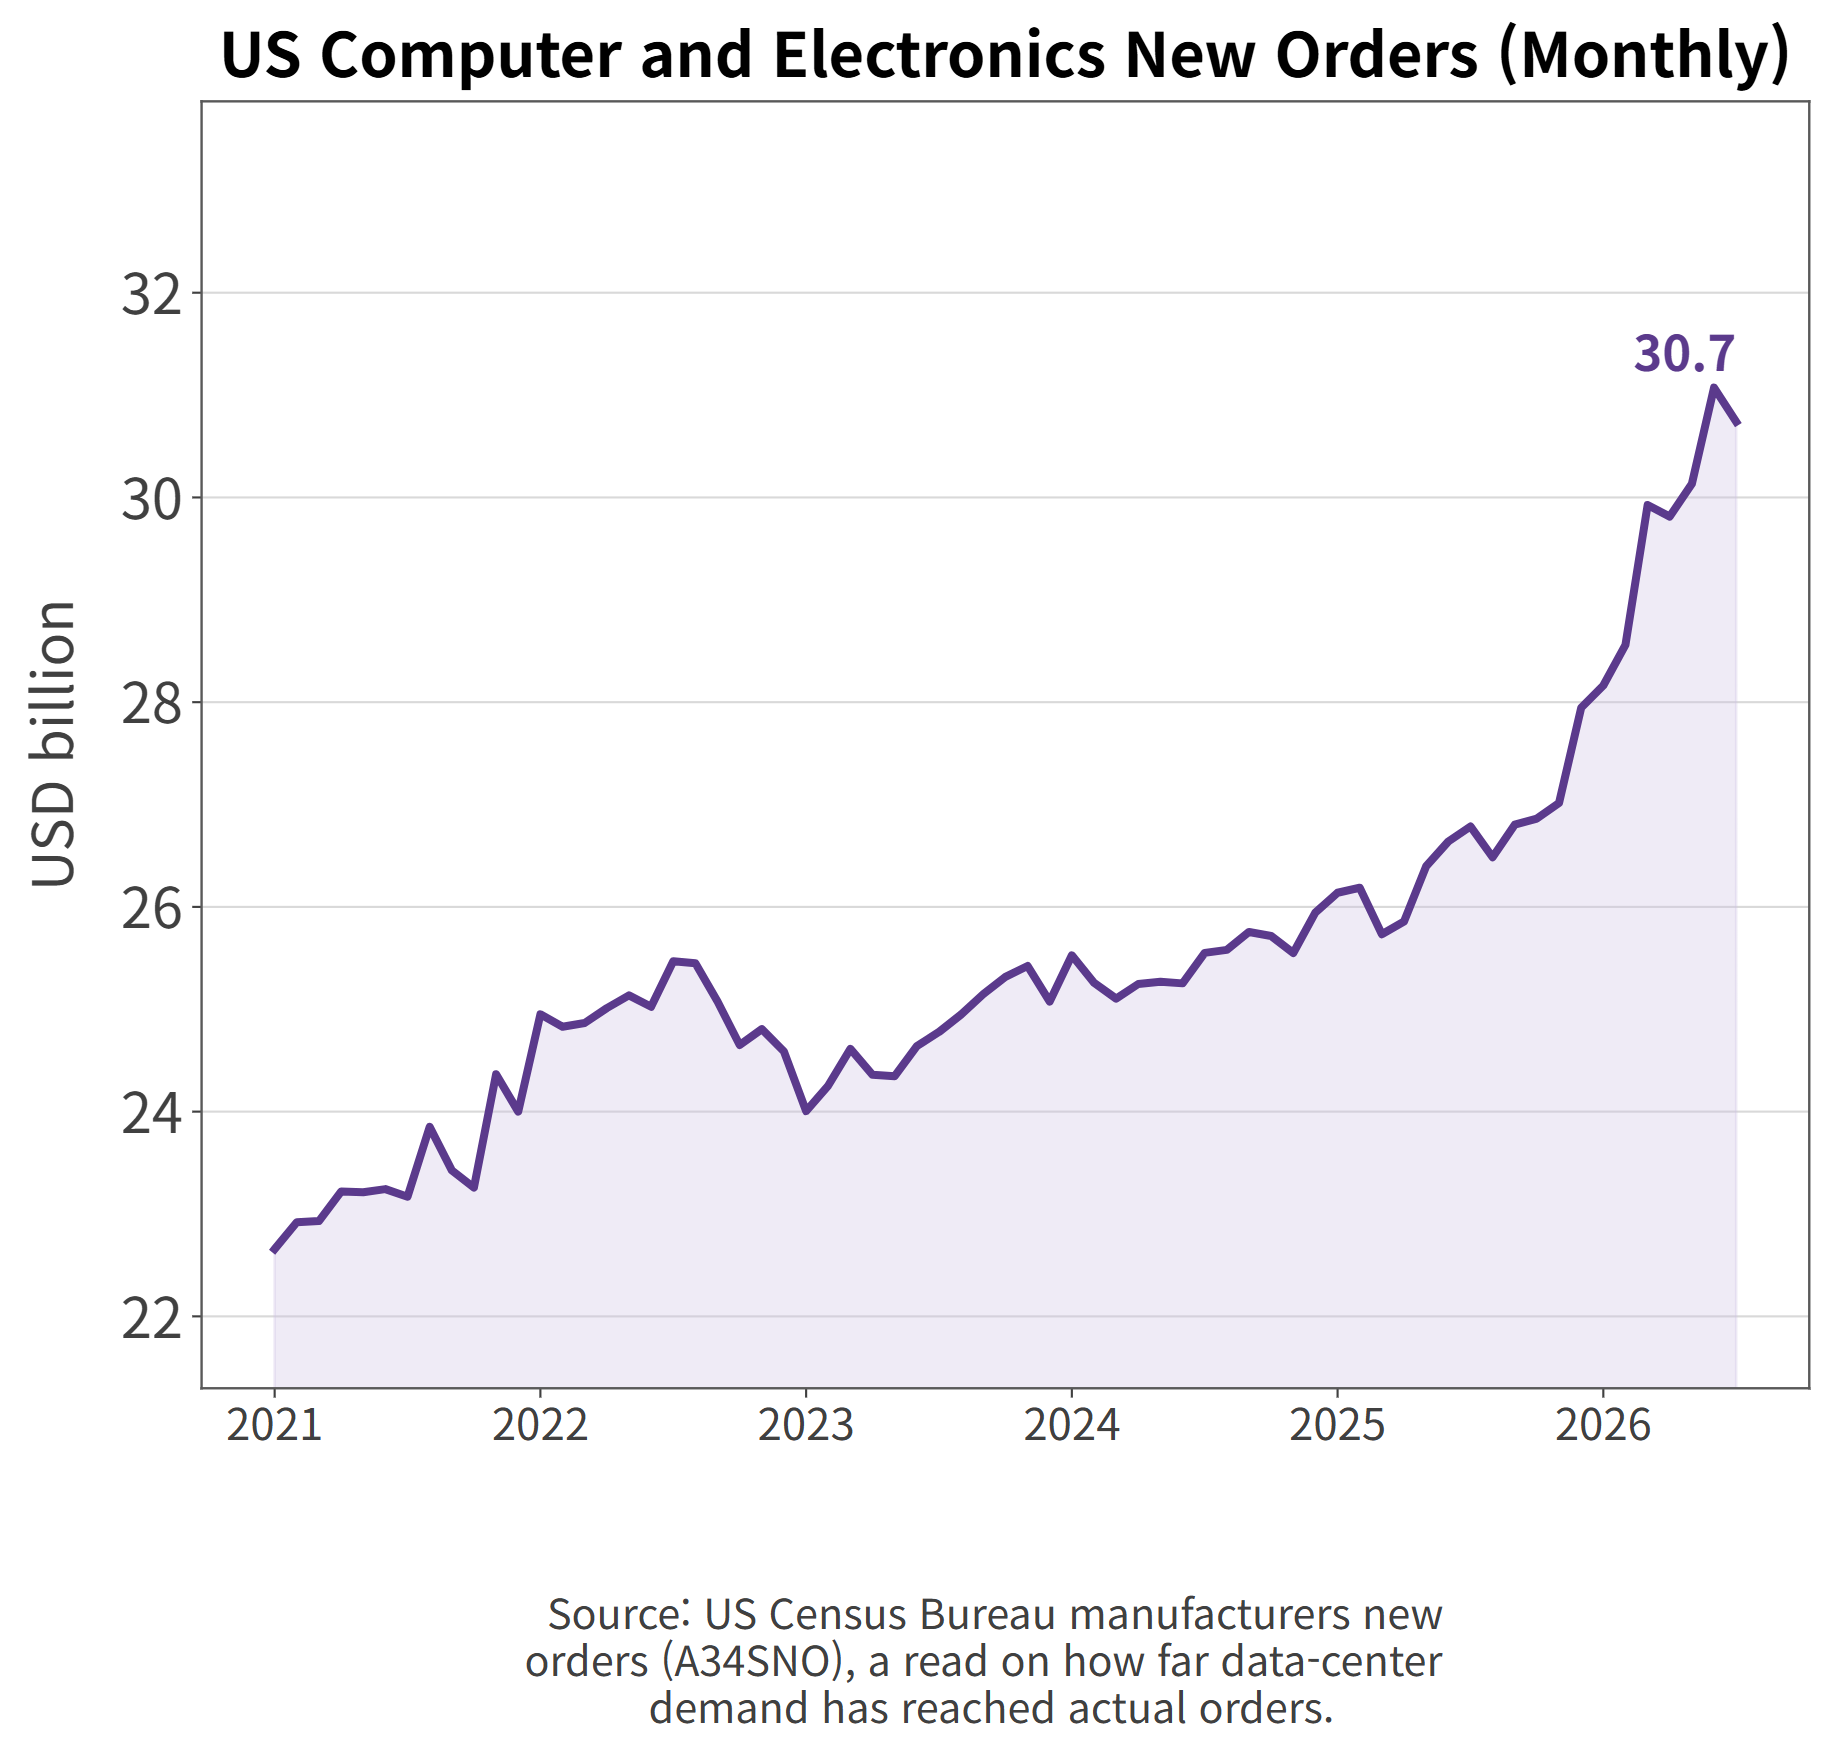
New orders tell a different story. The Census Bureau's series for computers and electronic products reached $30.7 billion in July 2026, climbing steeply from the $26 billion range in early 2025. Orders have not cooled.
US computer and electronics new orders, monthly
Put the two together and Credo's position gets clearer. The broad semiconductor sector is running with slack, while the data-center slice of it is not. Credo is levered to the slice, not the sector.
The intensity of that demand is also visible in Credo's recent patent disputes. Over the past year Credo settled active-electrical-cable disputes with TE Connectivity and with Molex, and signed a patent license with 3M. When materials and connector giants line up over one cable type, the cable has become worth litigating over.
CRDO Valuation vs. Astera Labs, Marvell, Broadcom and Arista
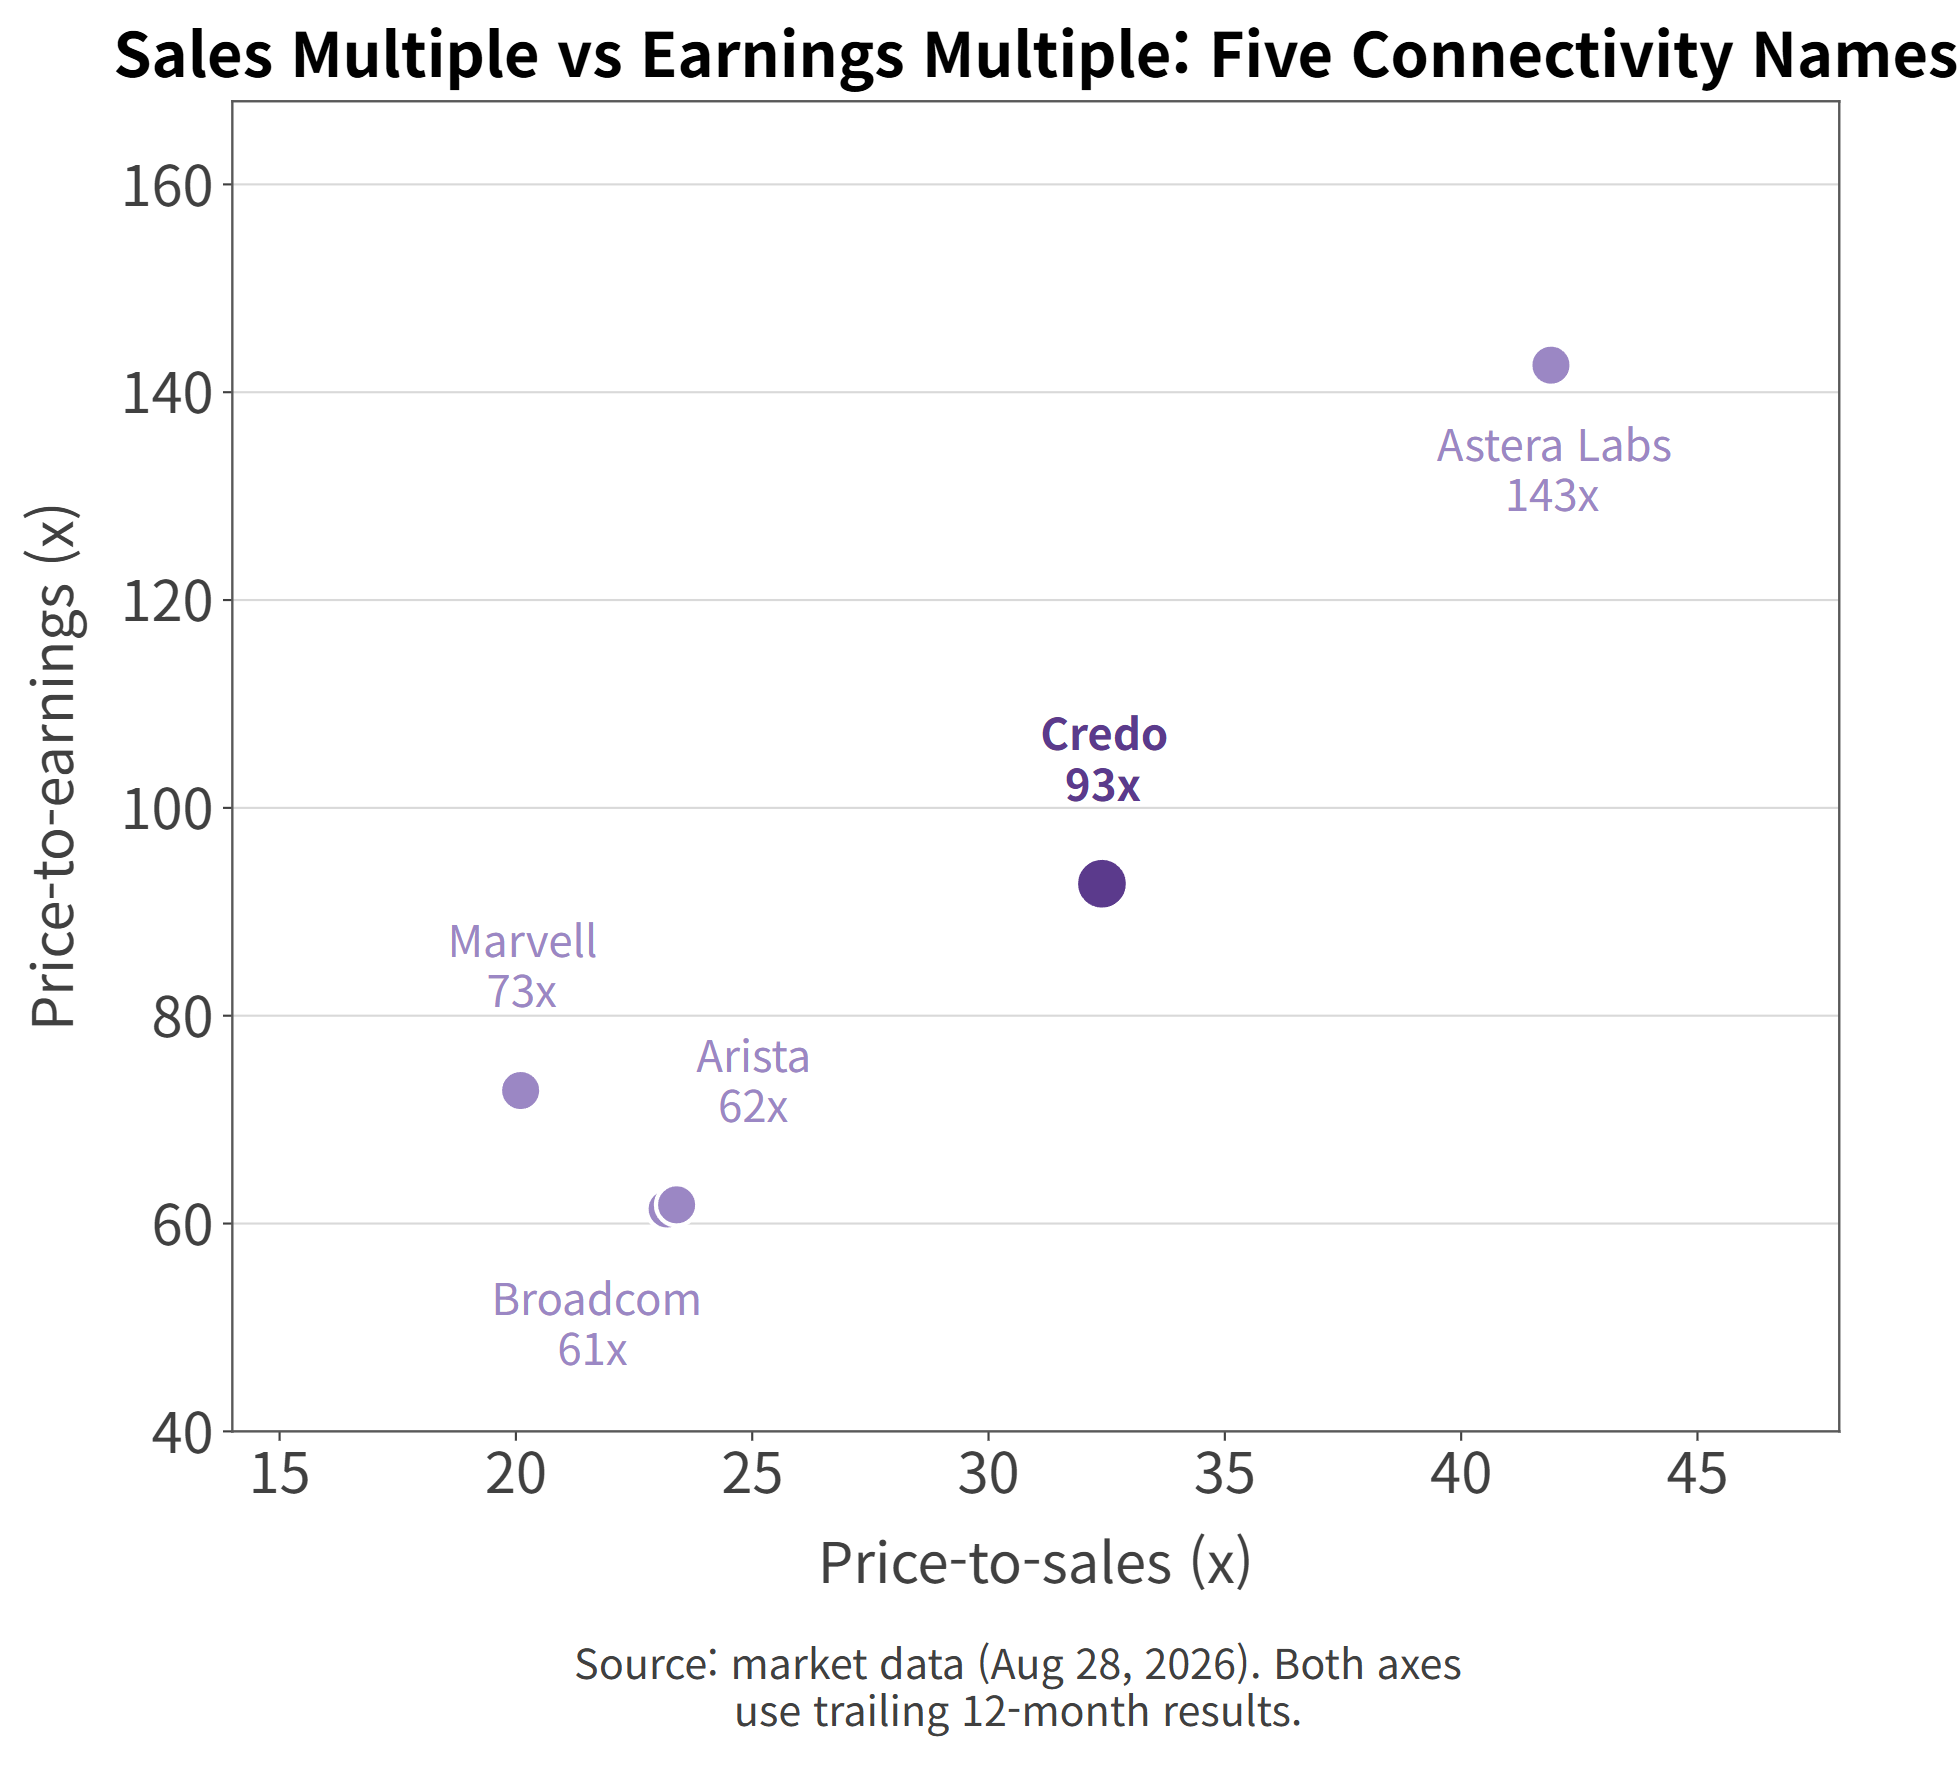
Credo trades at 32.4x trailing sales and 92.7x trailing earnings.
Company
Price-to-sales
Price-to-earnings
Credo
32.4x
92.7x
Astera Labs
41.9x
142.6x
Marvell
20.1x
72.8x
Broadcom
23.2x
61.4x
Arista
23.4x
61.8x
Credo sits below Astera Labs and above Marvell, Broadcom and Arista. It also grows fastest of the five, so the ordering of the multiples roughly tracks the ordering of growth.
Sales multiple versus earnings multiple across five connectivity names
The split runs deeper than the numbers. Marvell, Broadcom and Arista book revenue in the tens of billions across several businesses. Credo and Astera Labs live on AI connectivity alone and clear about a billion. A high multiple prices in growth that has not arrived yet, and it cuts the other way if the one business cools.
On size, Credo is the smallest of the five. Against Broadcom's $75.5 billion of trailing revenue it is one fifty-sixth; against Arista's $10.5 billion, about one eighth. What holds the multiple up is the slope, not the scale.
When Did Credo Actually Turn Profitable?
The Five-Quarter Gap
Back to the $189.2 million.
Credo reports GAAP results and adjusted results side by side every quarter. Plenty of US issuers do. The complication here is that the two crossed zero at different times.
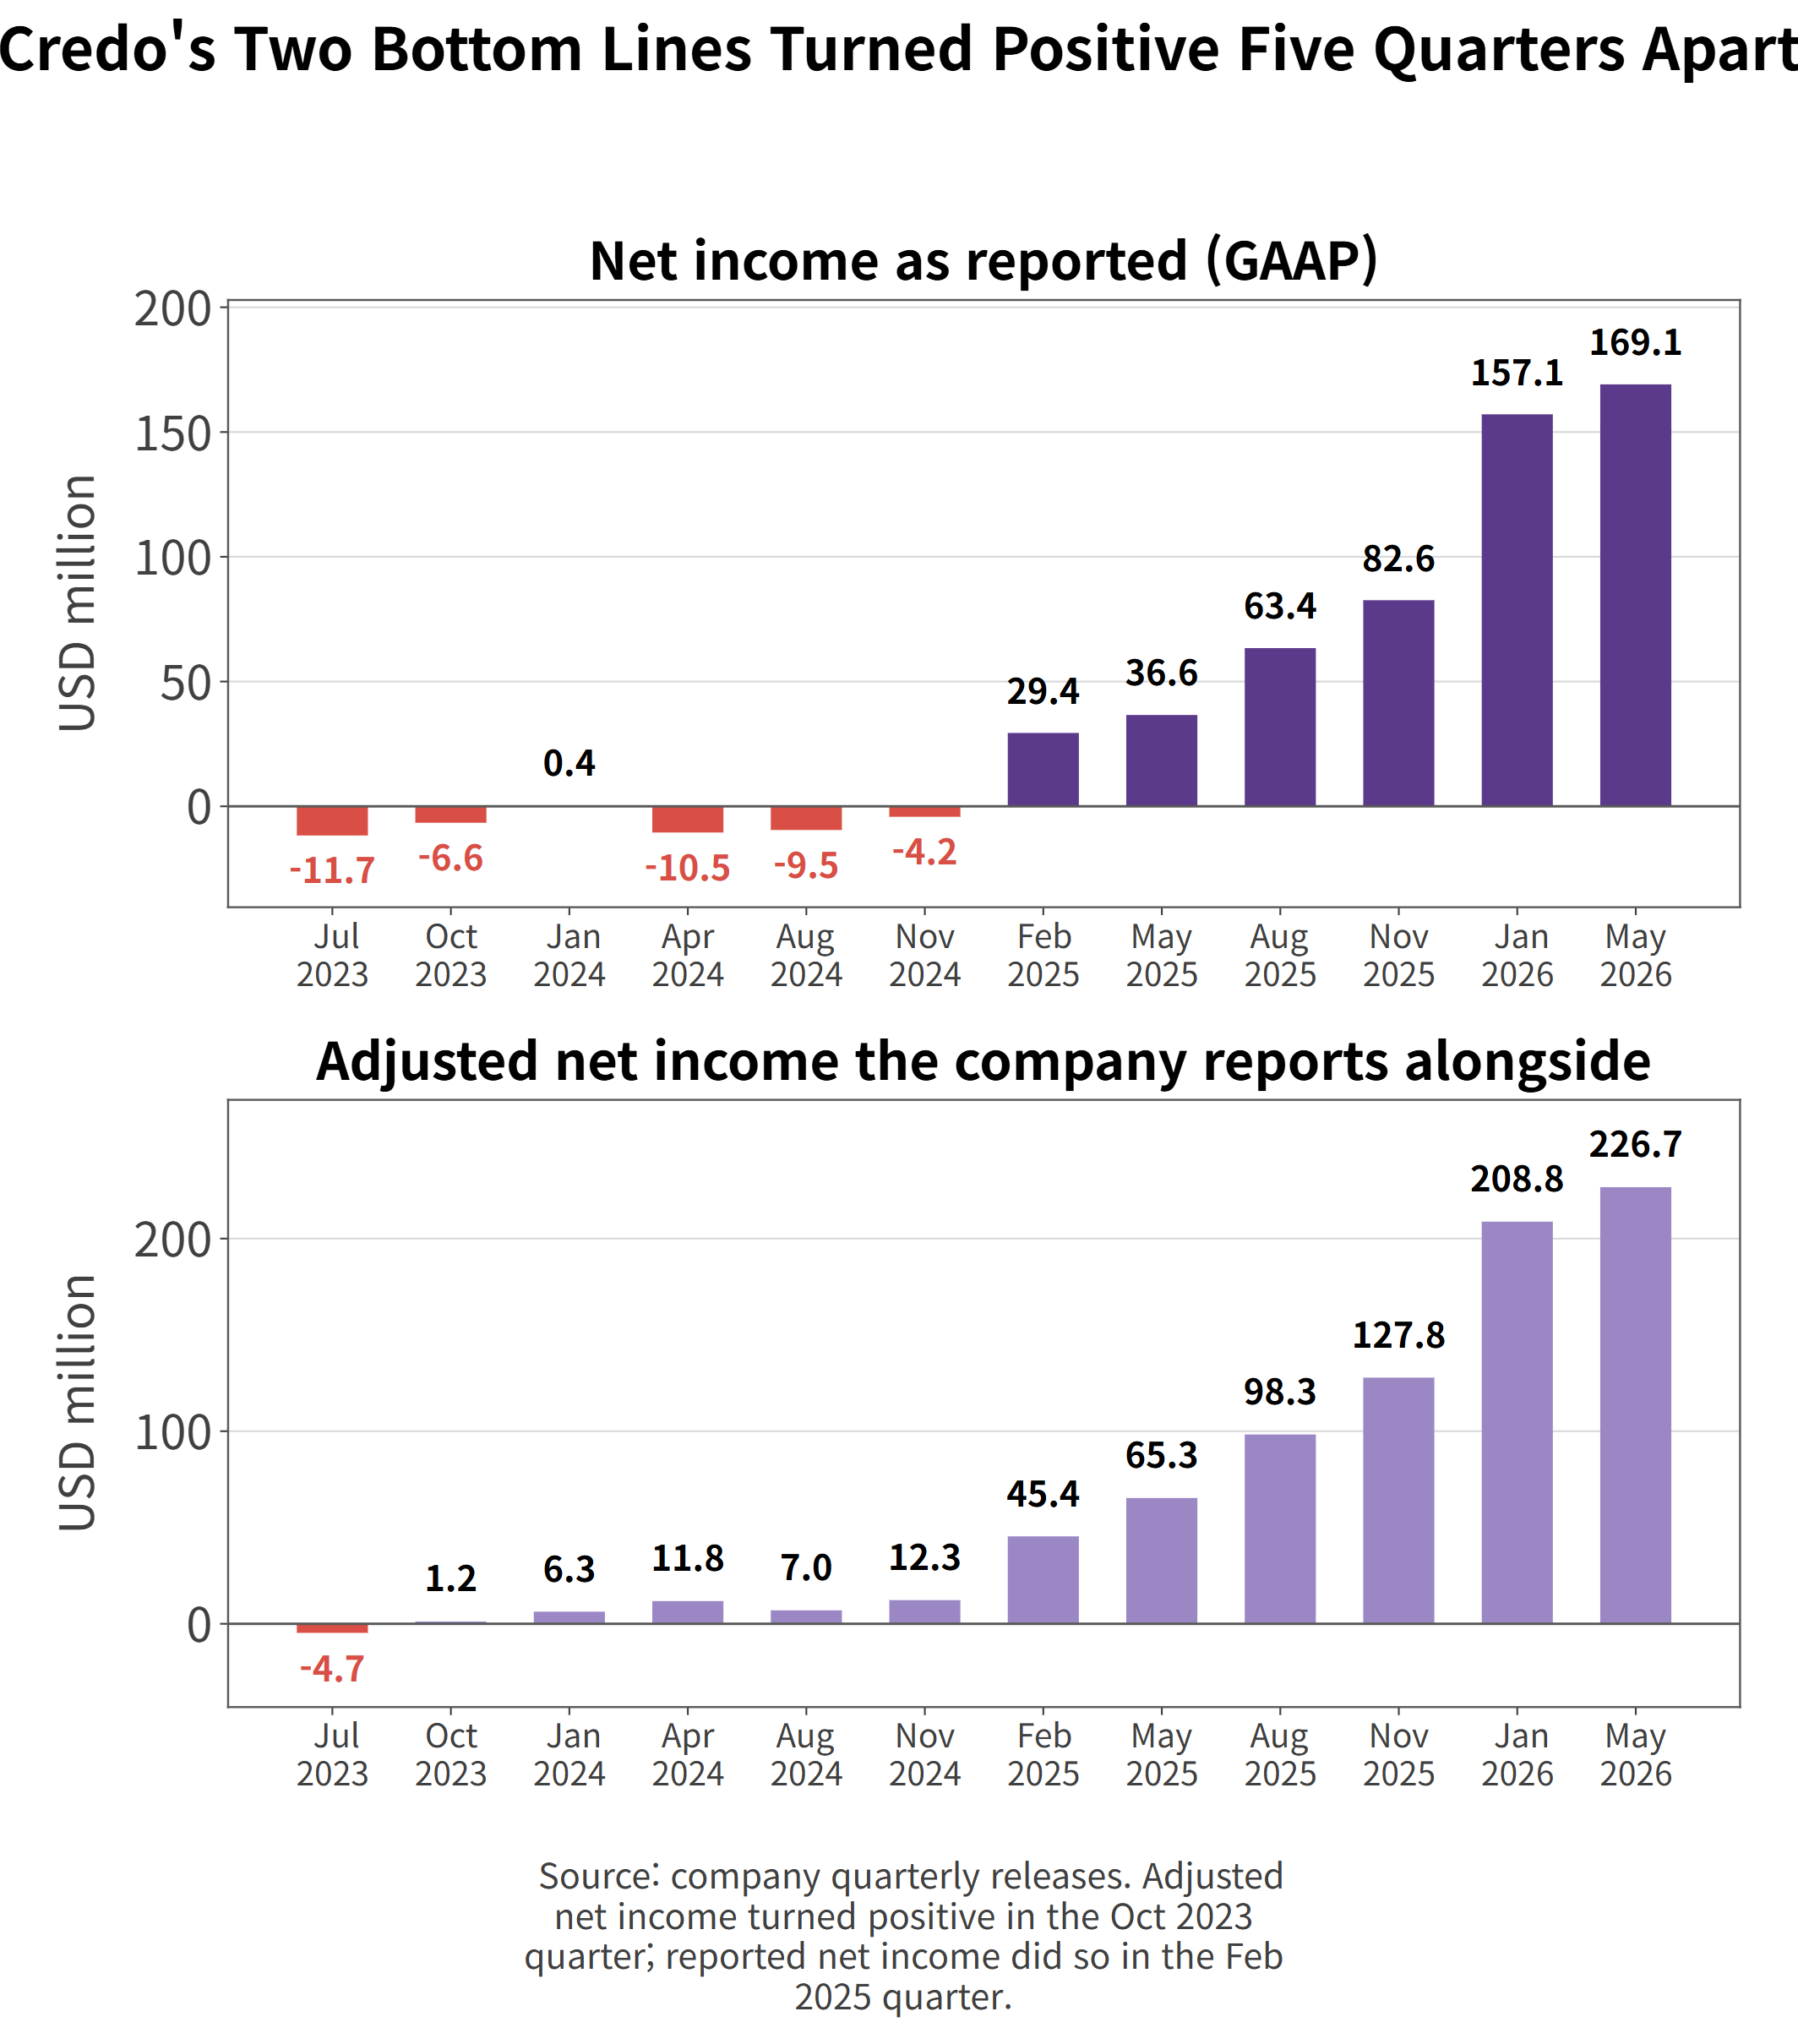
Credo's two bottom lines, quarterly
Adjusted net income first turned positive in the October 2023 quarter, reported on November 29, 2023, at $1.2 million. Reported net income turned decisively positive in the February 2025 quarter, reported on March 4, 2025, at $29.4 million.
For those five quarters, Credo was profitable on an adjusted basis and unprofitable under GAAP.
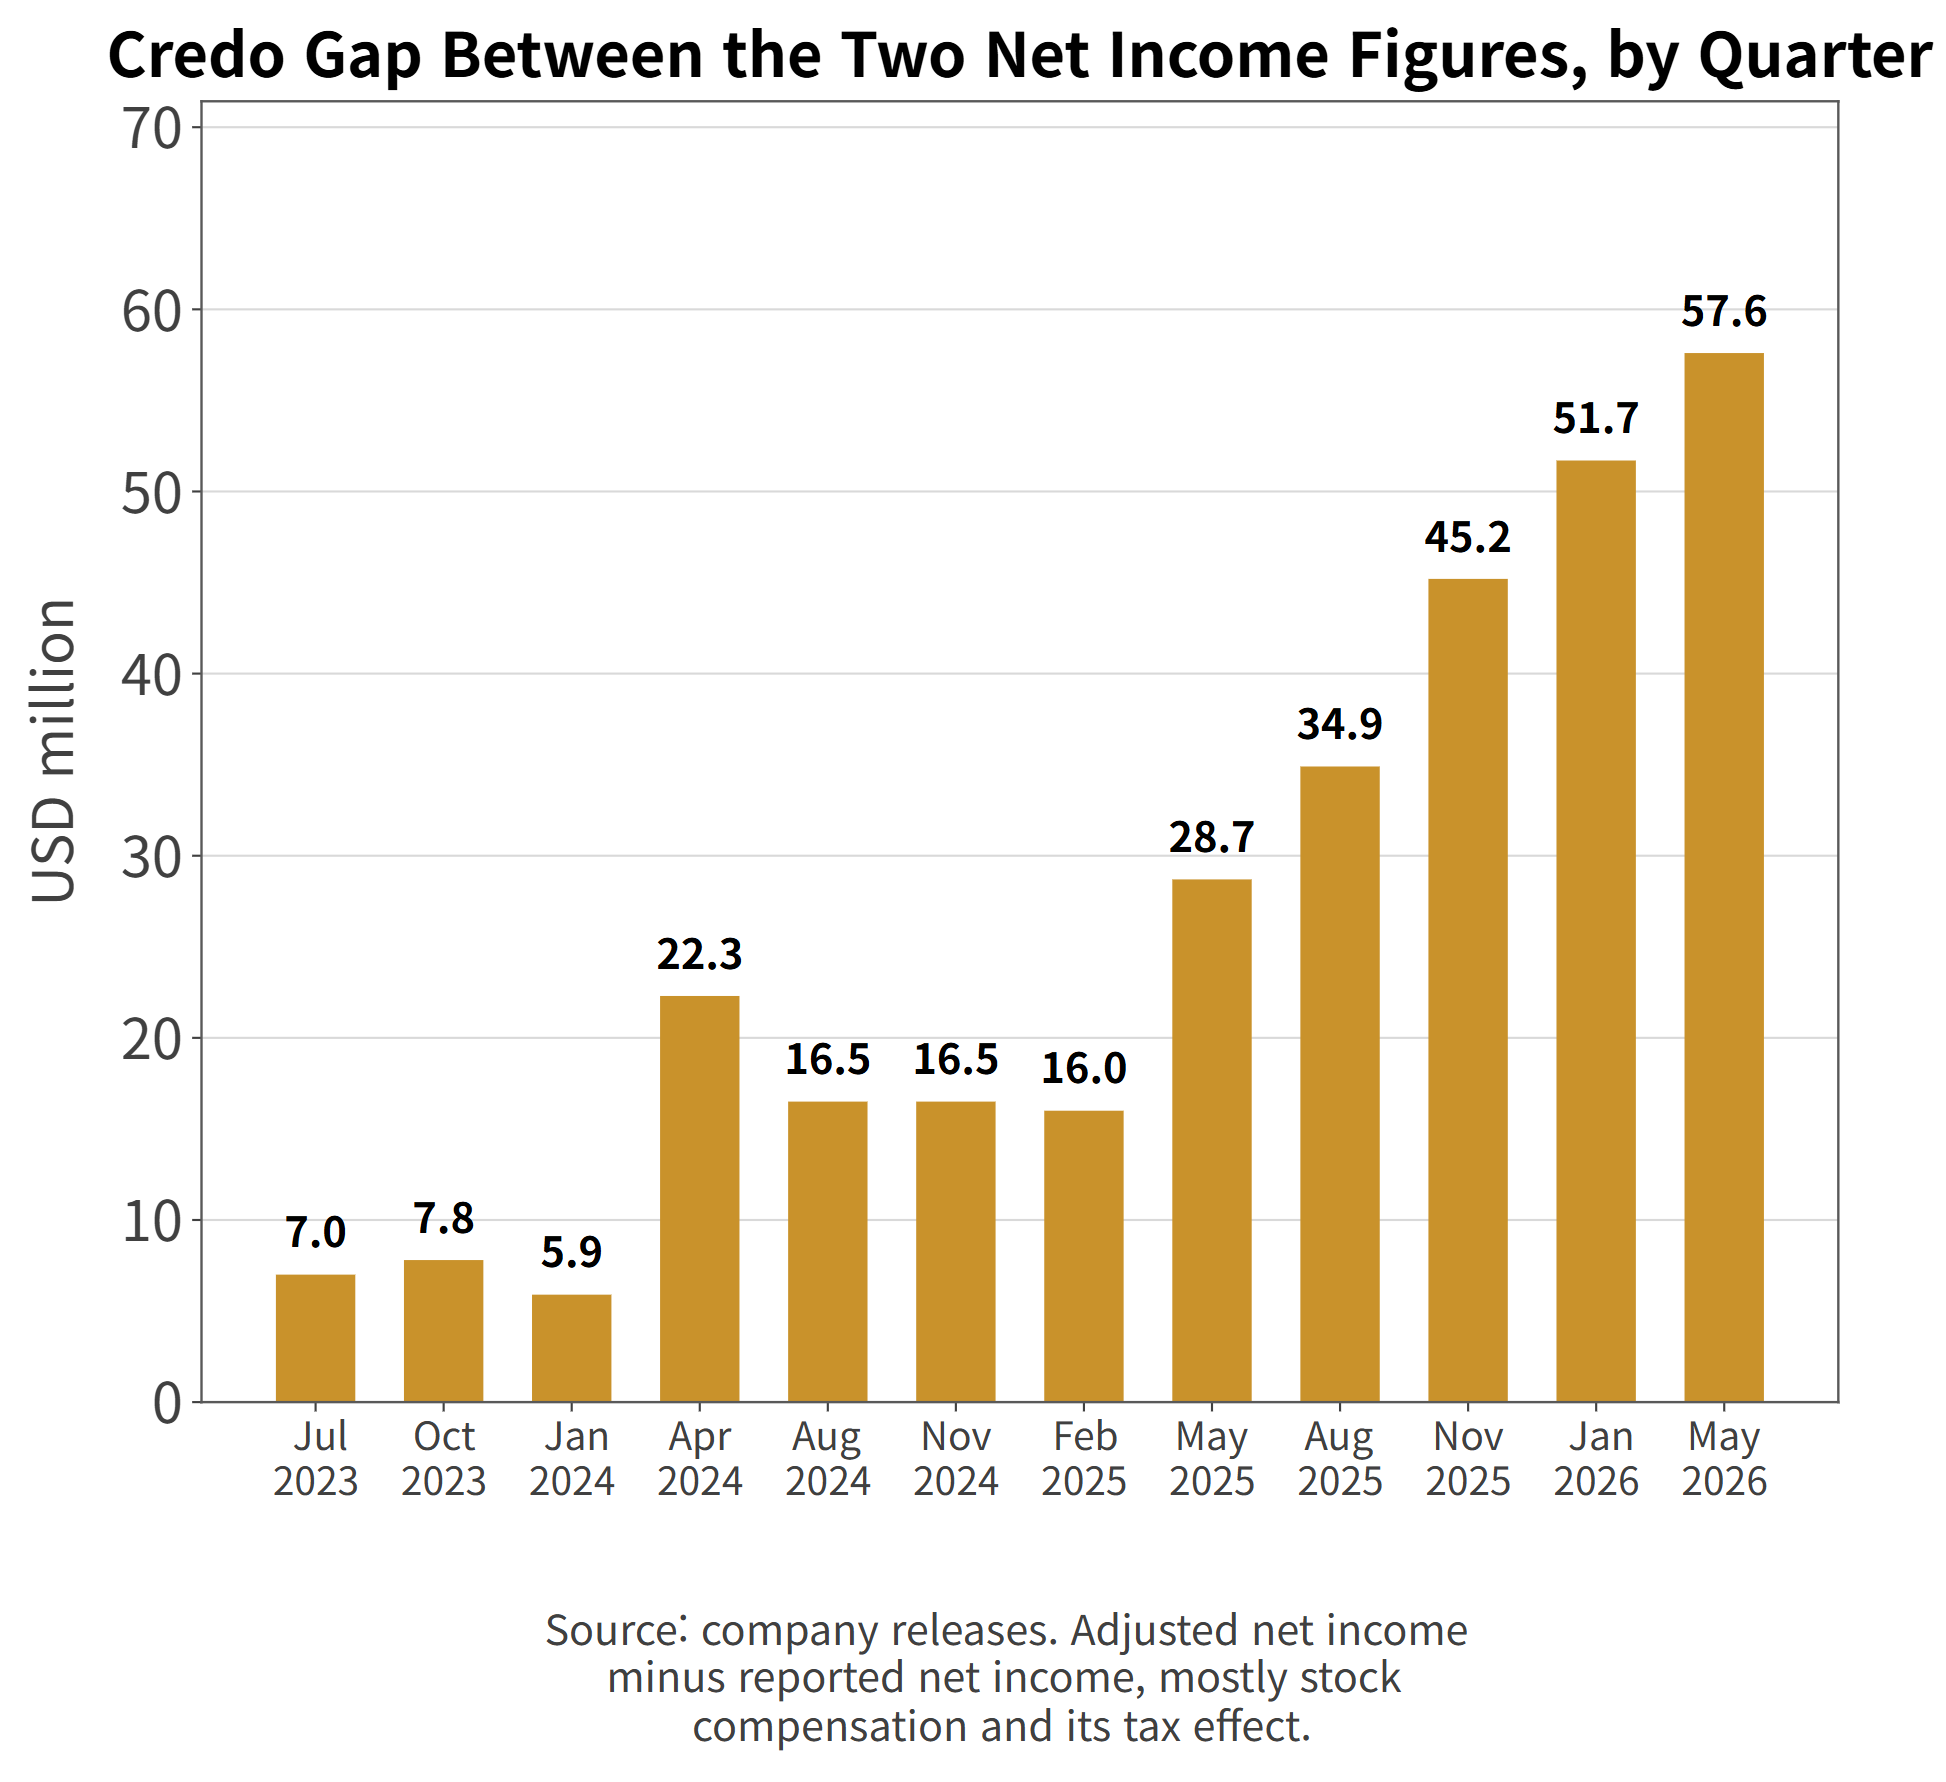
Credo gap between the two net income figures, by quarter
The April 2024 quarter shows it cleanly. Adjusted net income of $11.8 million. Reported net income of -$10.5 million. Same quarter, same company.
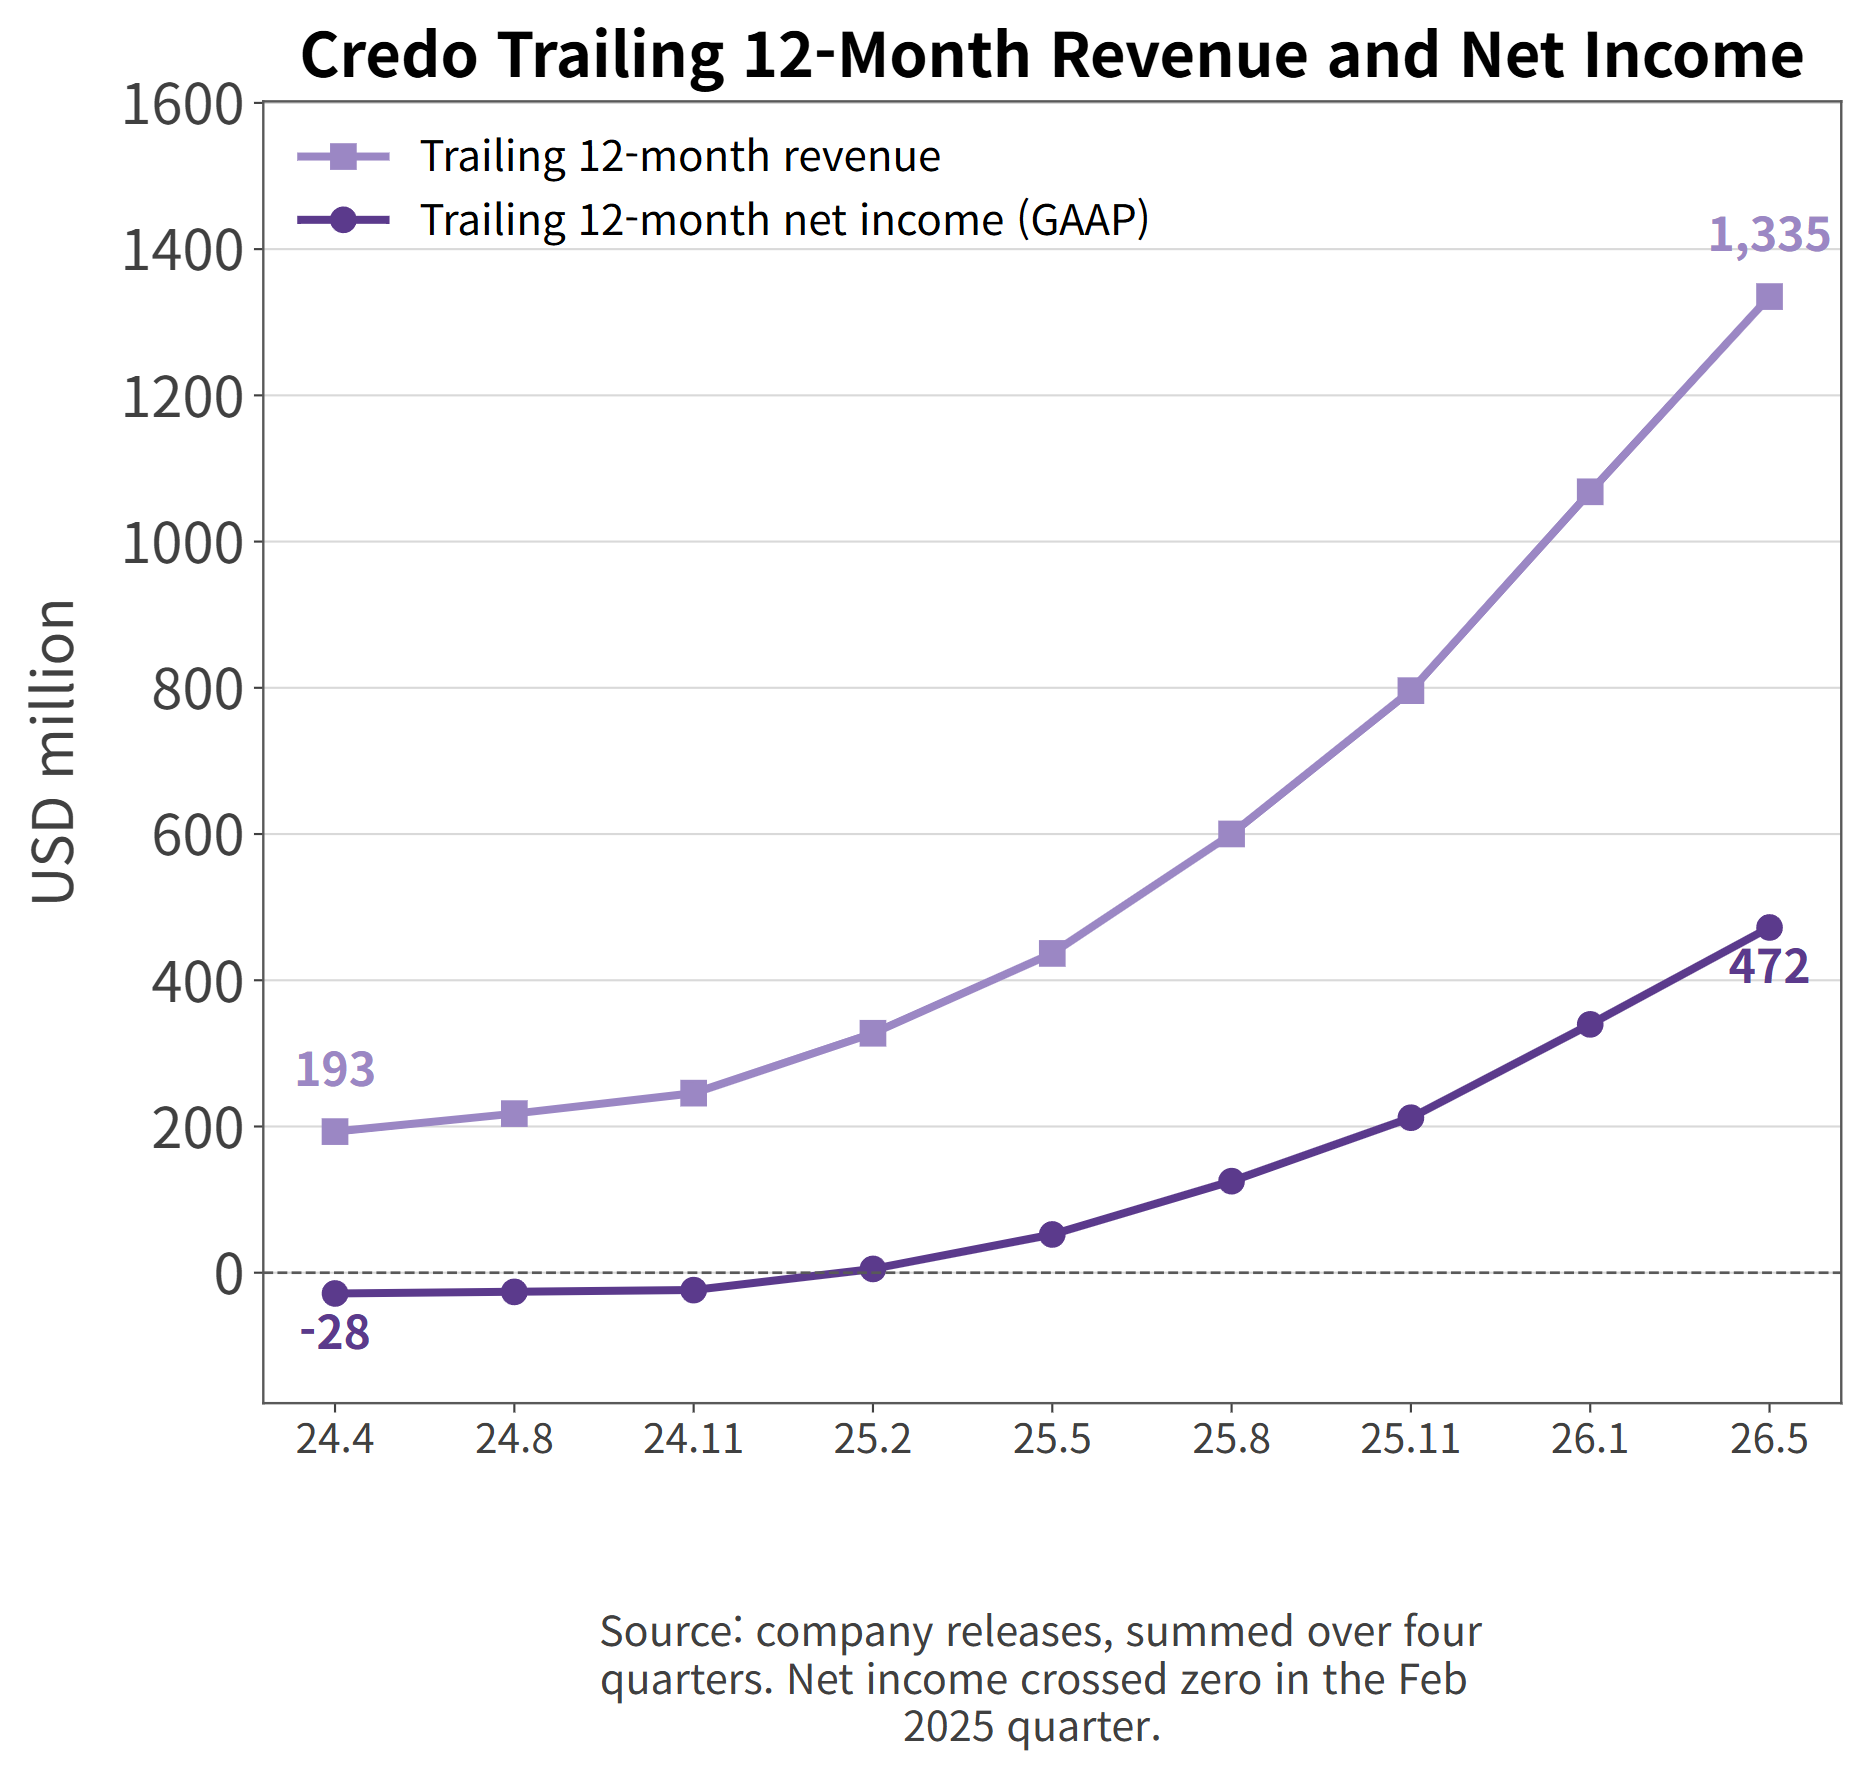
Both are positive now. Trailing 12-month reported net income is $472.3 million on revenue of $1,335.1 million, a net margin of 35.4%, with $1.4 billion in cash and short-term investments. By any yardstick, this is a company that makes money.
Credo trailing 12-month revenue and net income
Stock-Based Compensation: What Credo Asks You to Exclude
The company spells out the difference in its earnings release: share-based compensation, acquisition and integration costs, amortization of acquired intangibles, impairment, and the related tax effects.
Credo GAAP-to-non-GAAP reconciliation (source: company earnings release)
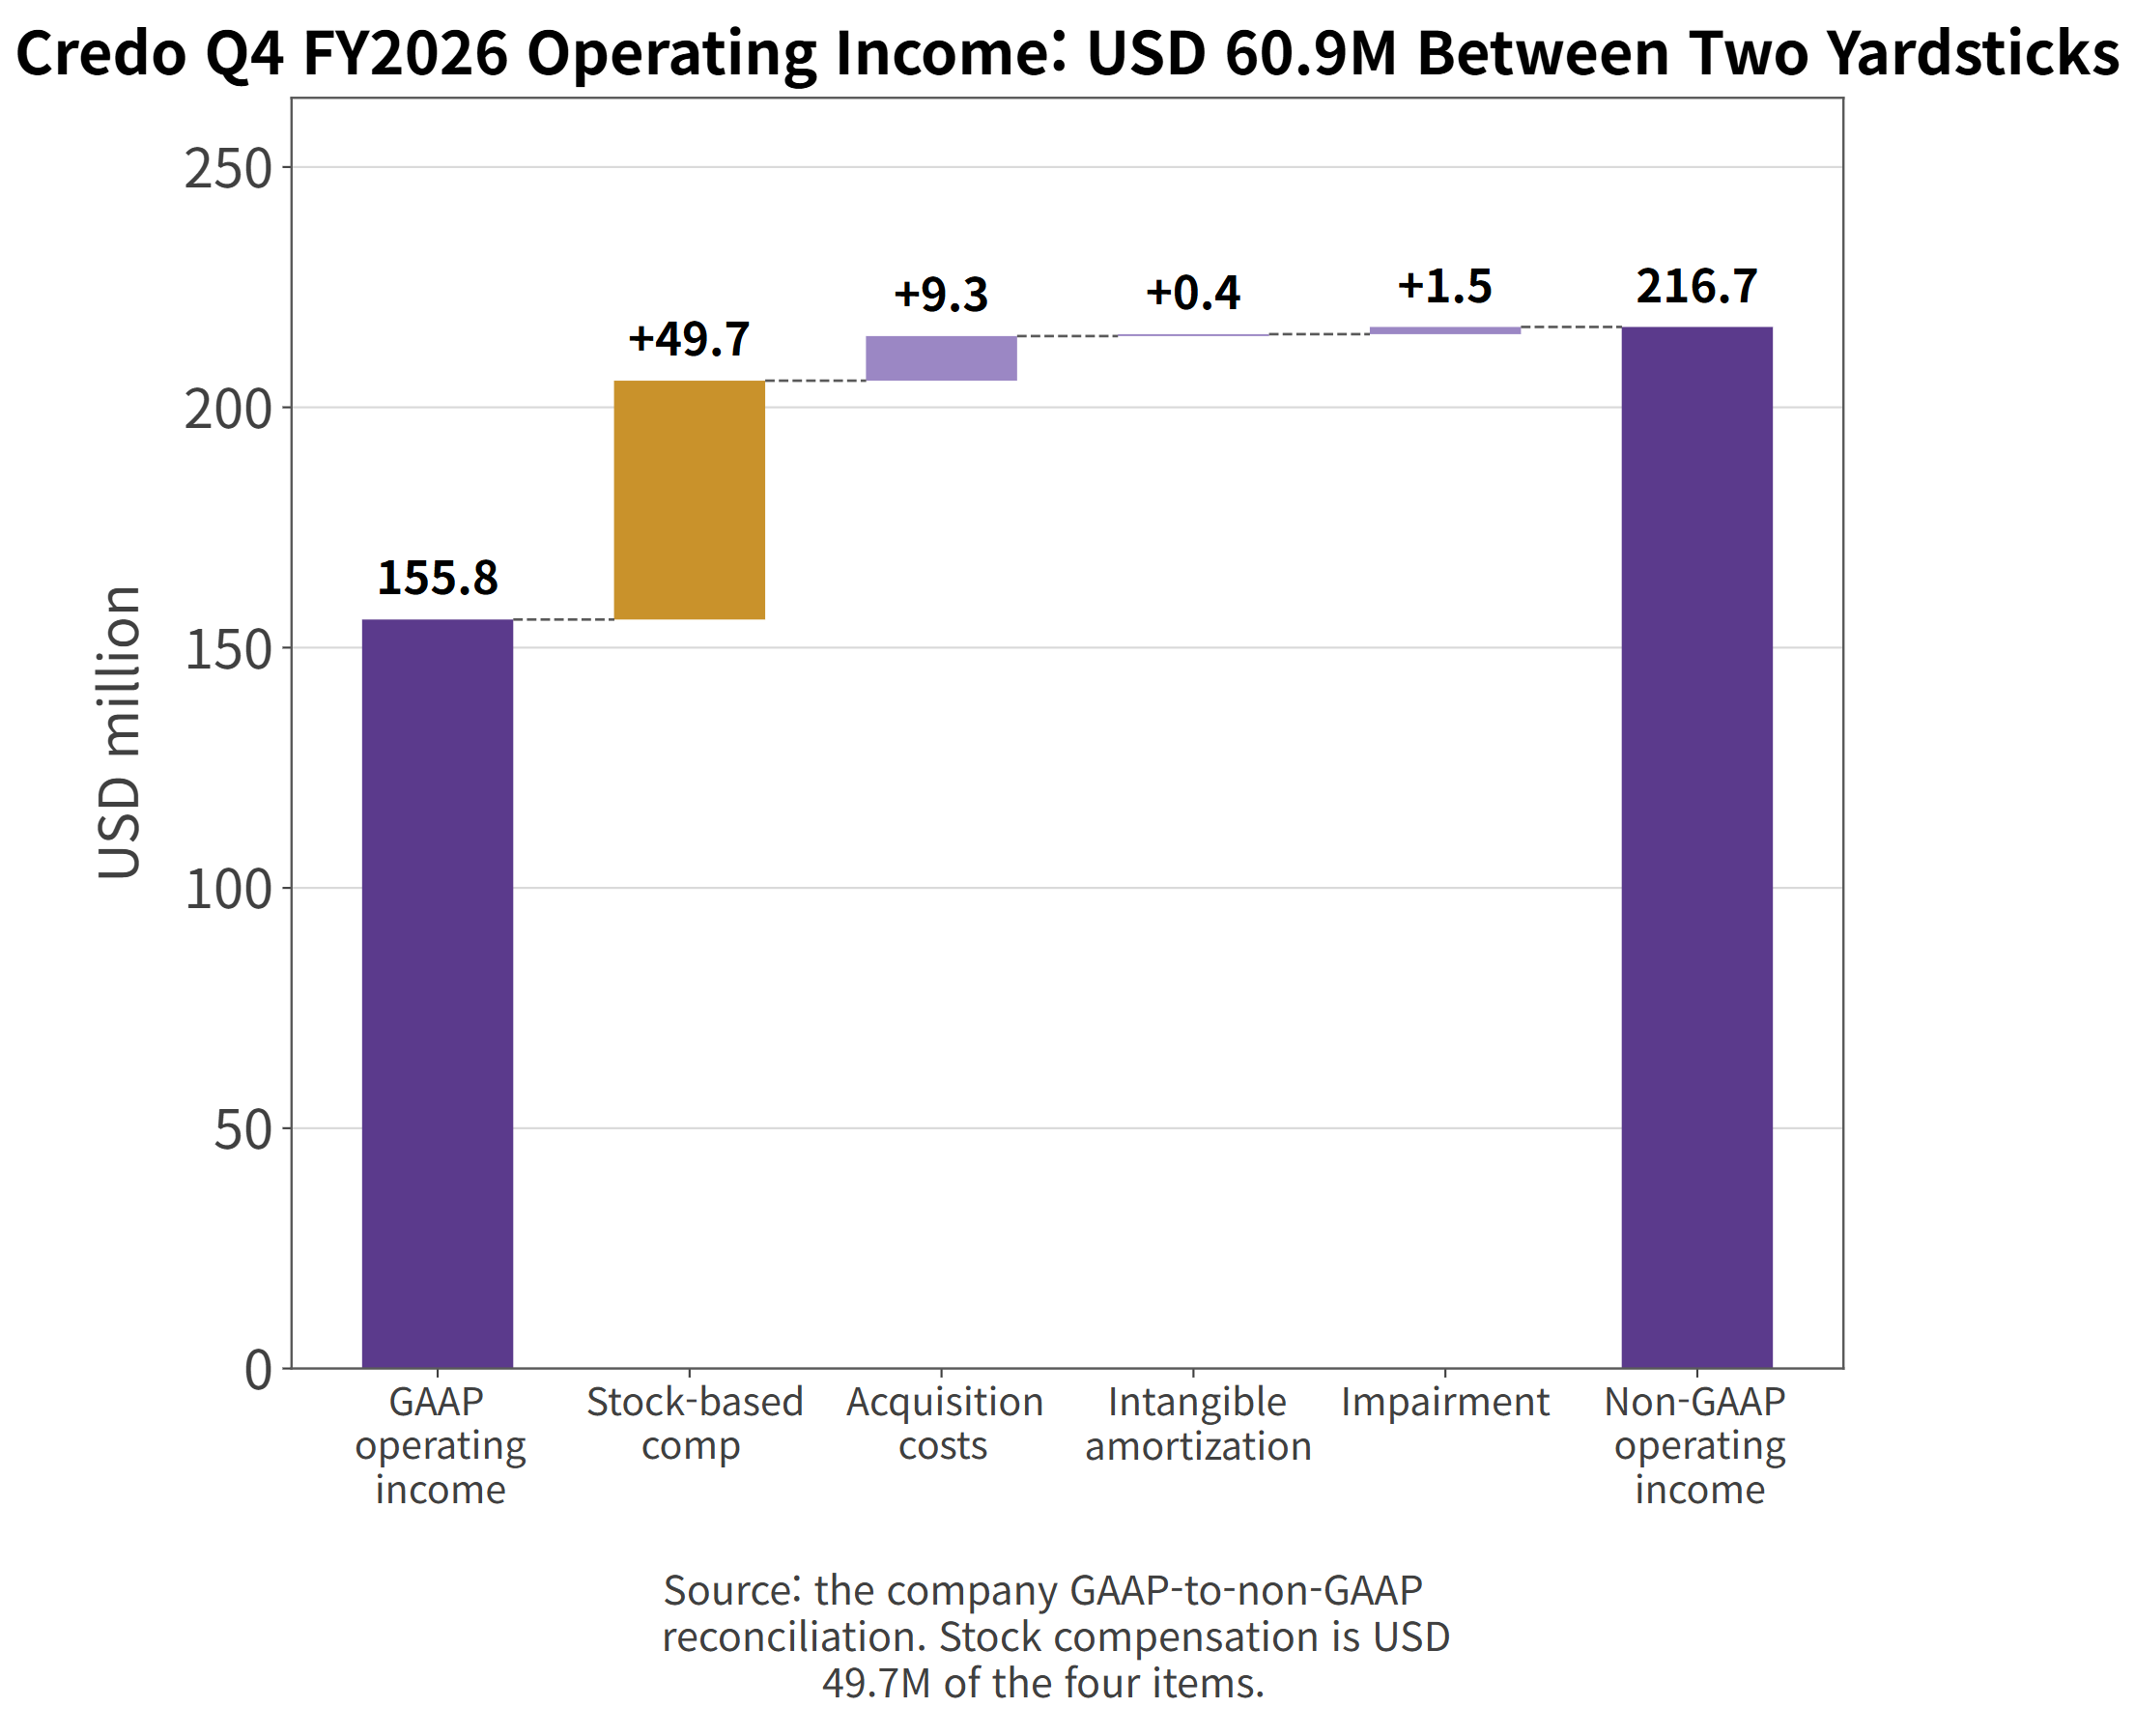
Revenue in the May 2026 quarter grew +157.0% year over year. In that same quarter, GAAP operating income of $155.8 million plus $60.9 million of those four items gives adjusted operating income of $216.7 million. Share-based compensation is $49.7 million of the $60.9 million.
Credo Q4 FY2026 operating income waterfall between the two yardsticks
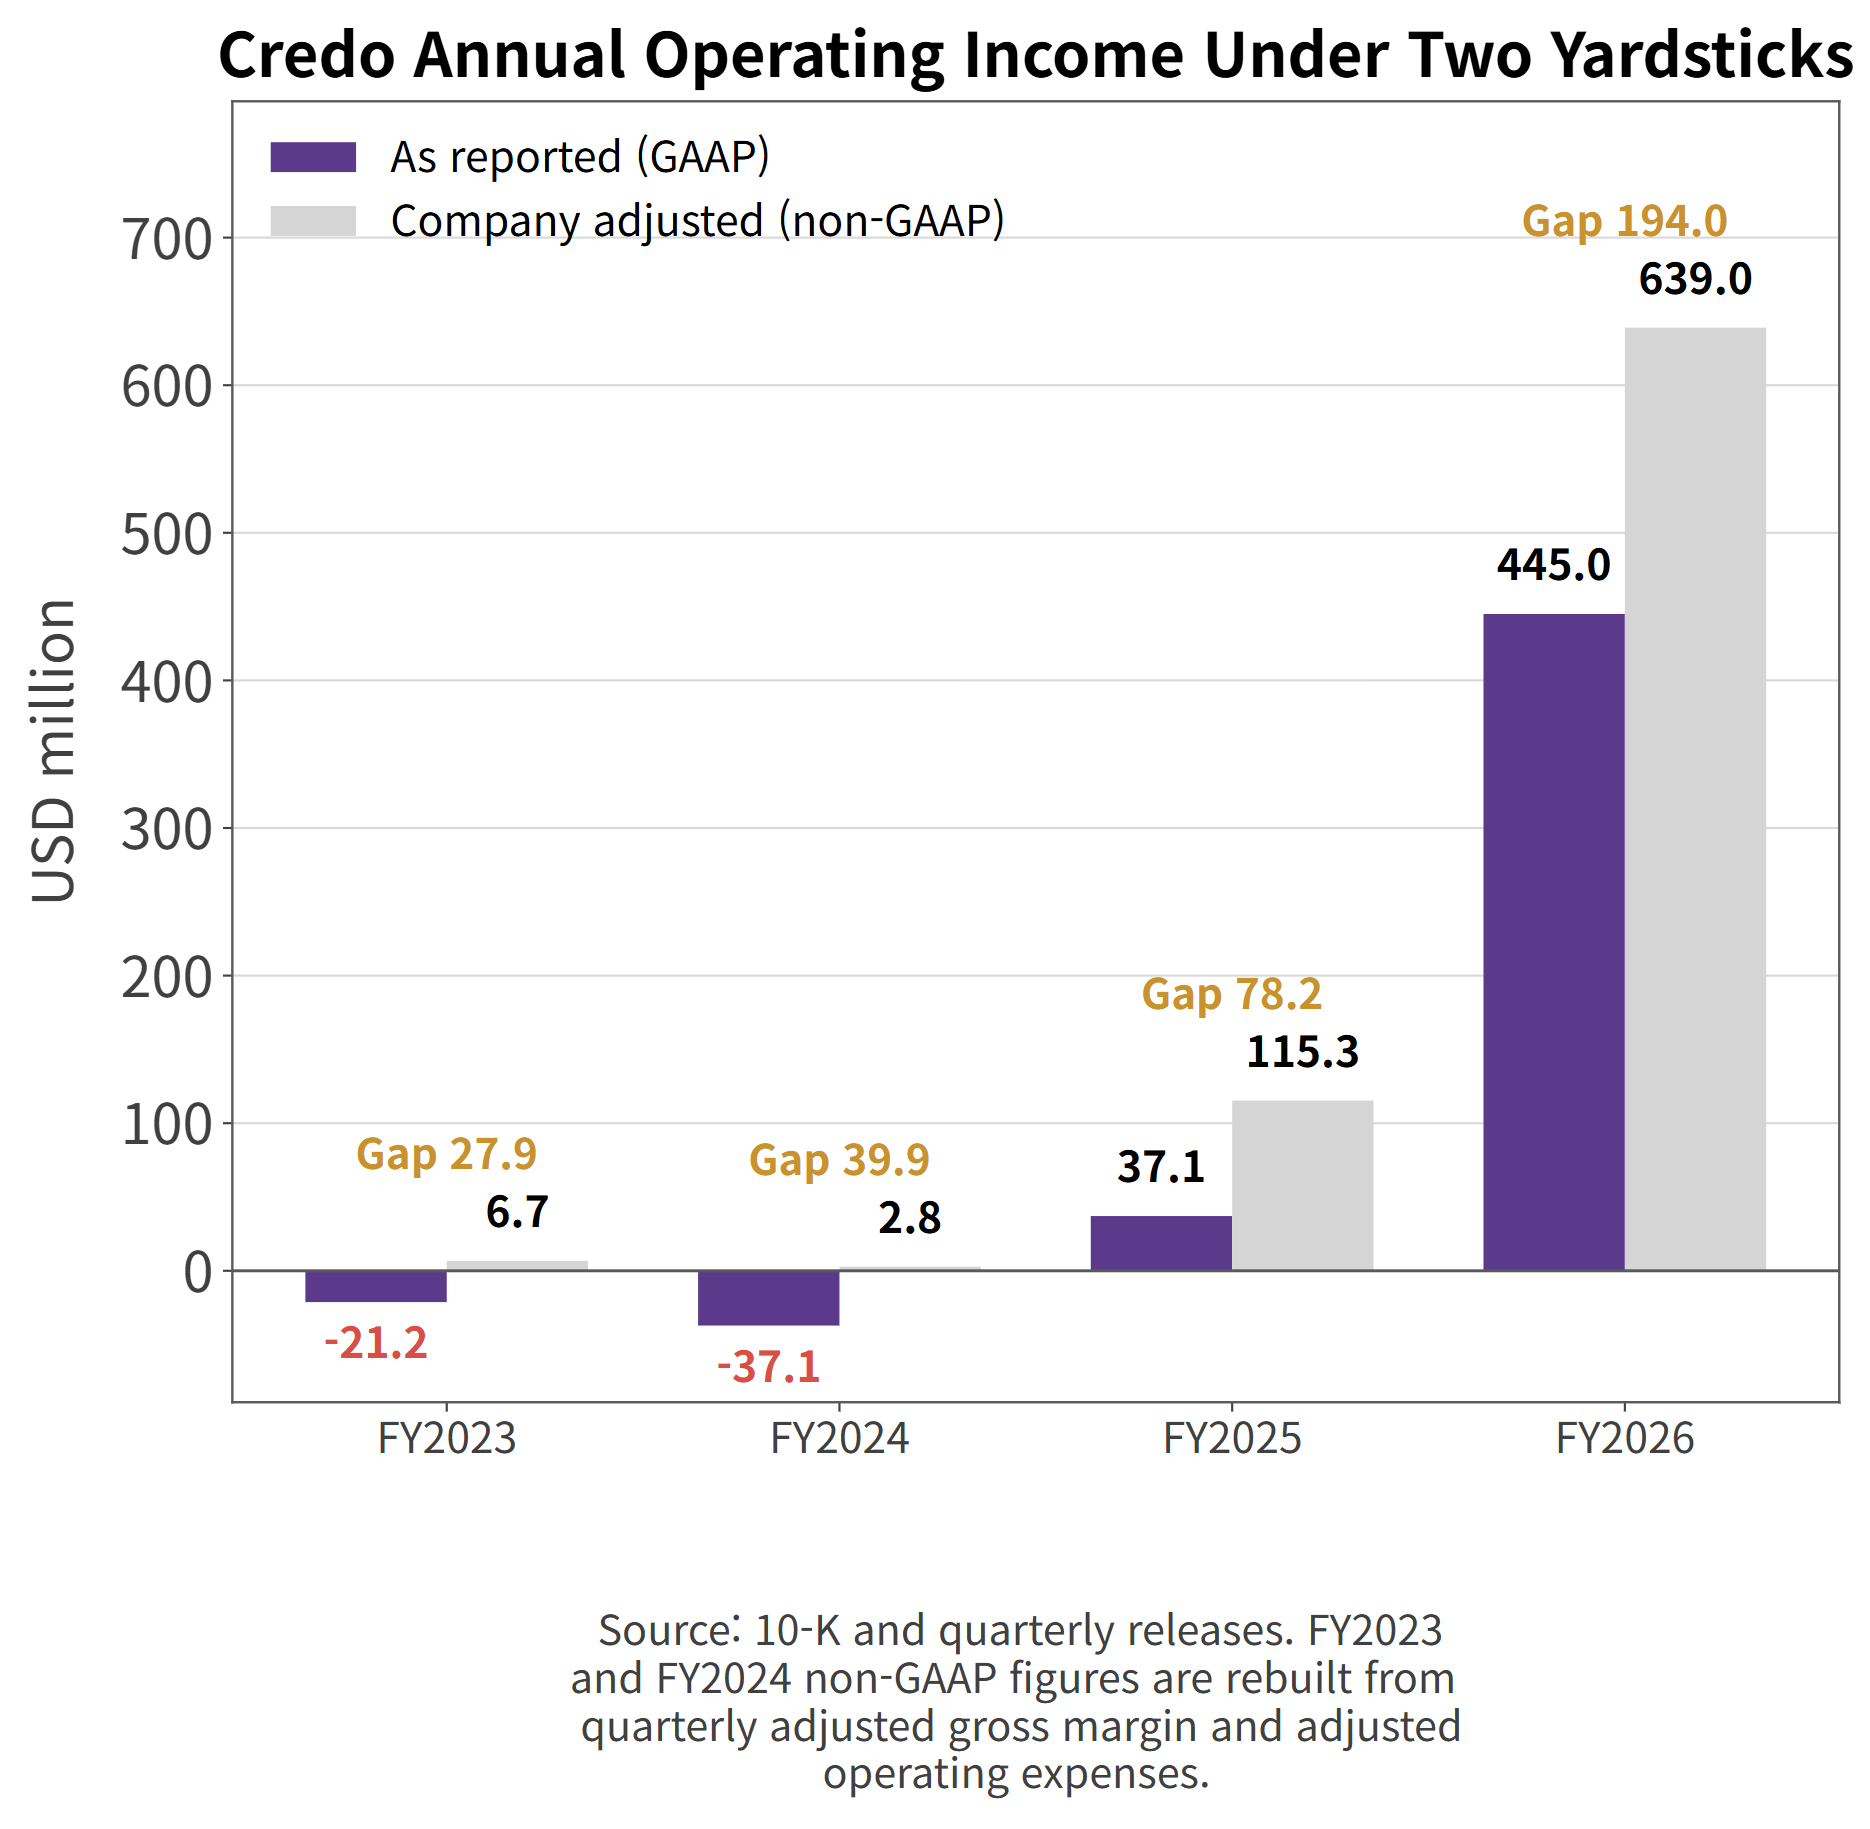
Stretch it across fiscal years and the trajectory shows.
Fiscal year
Revenue
Operating income (GAAP)
Operating income (adjusted)
Gap
FY2023
$184.3M
-$21.2M
$6.7M
$27.9M
FY2024
$193.0M
-$37.1M
$2.8M
$39.9M
FY2025
$436.7M
$37.1M
$115.3M
$78.2M
FY2026
$1,335.1M
$445.0M
$638.8M
$194.0M
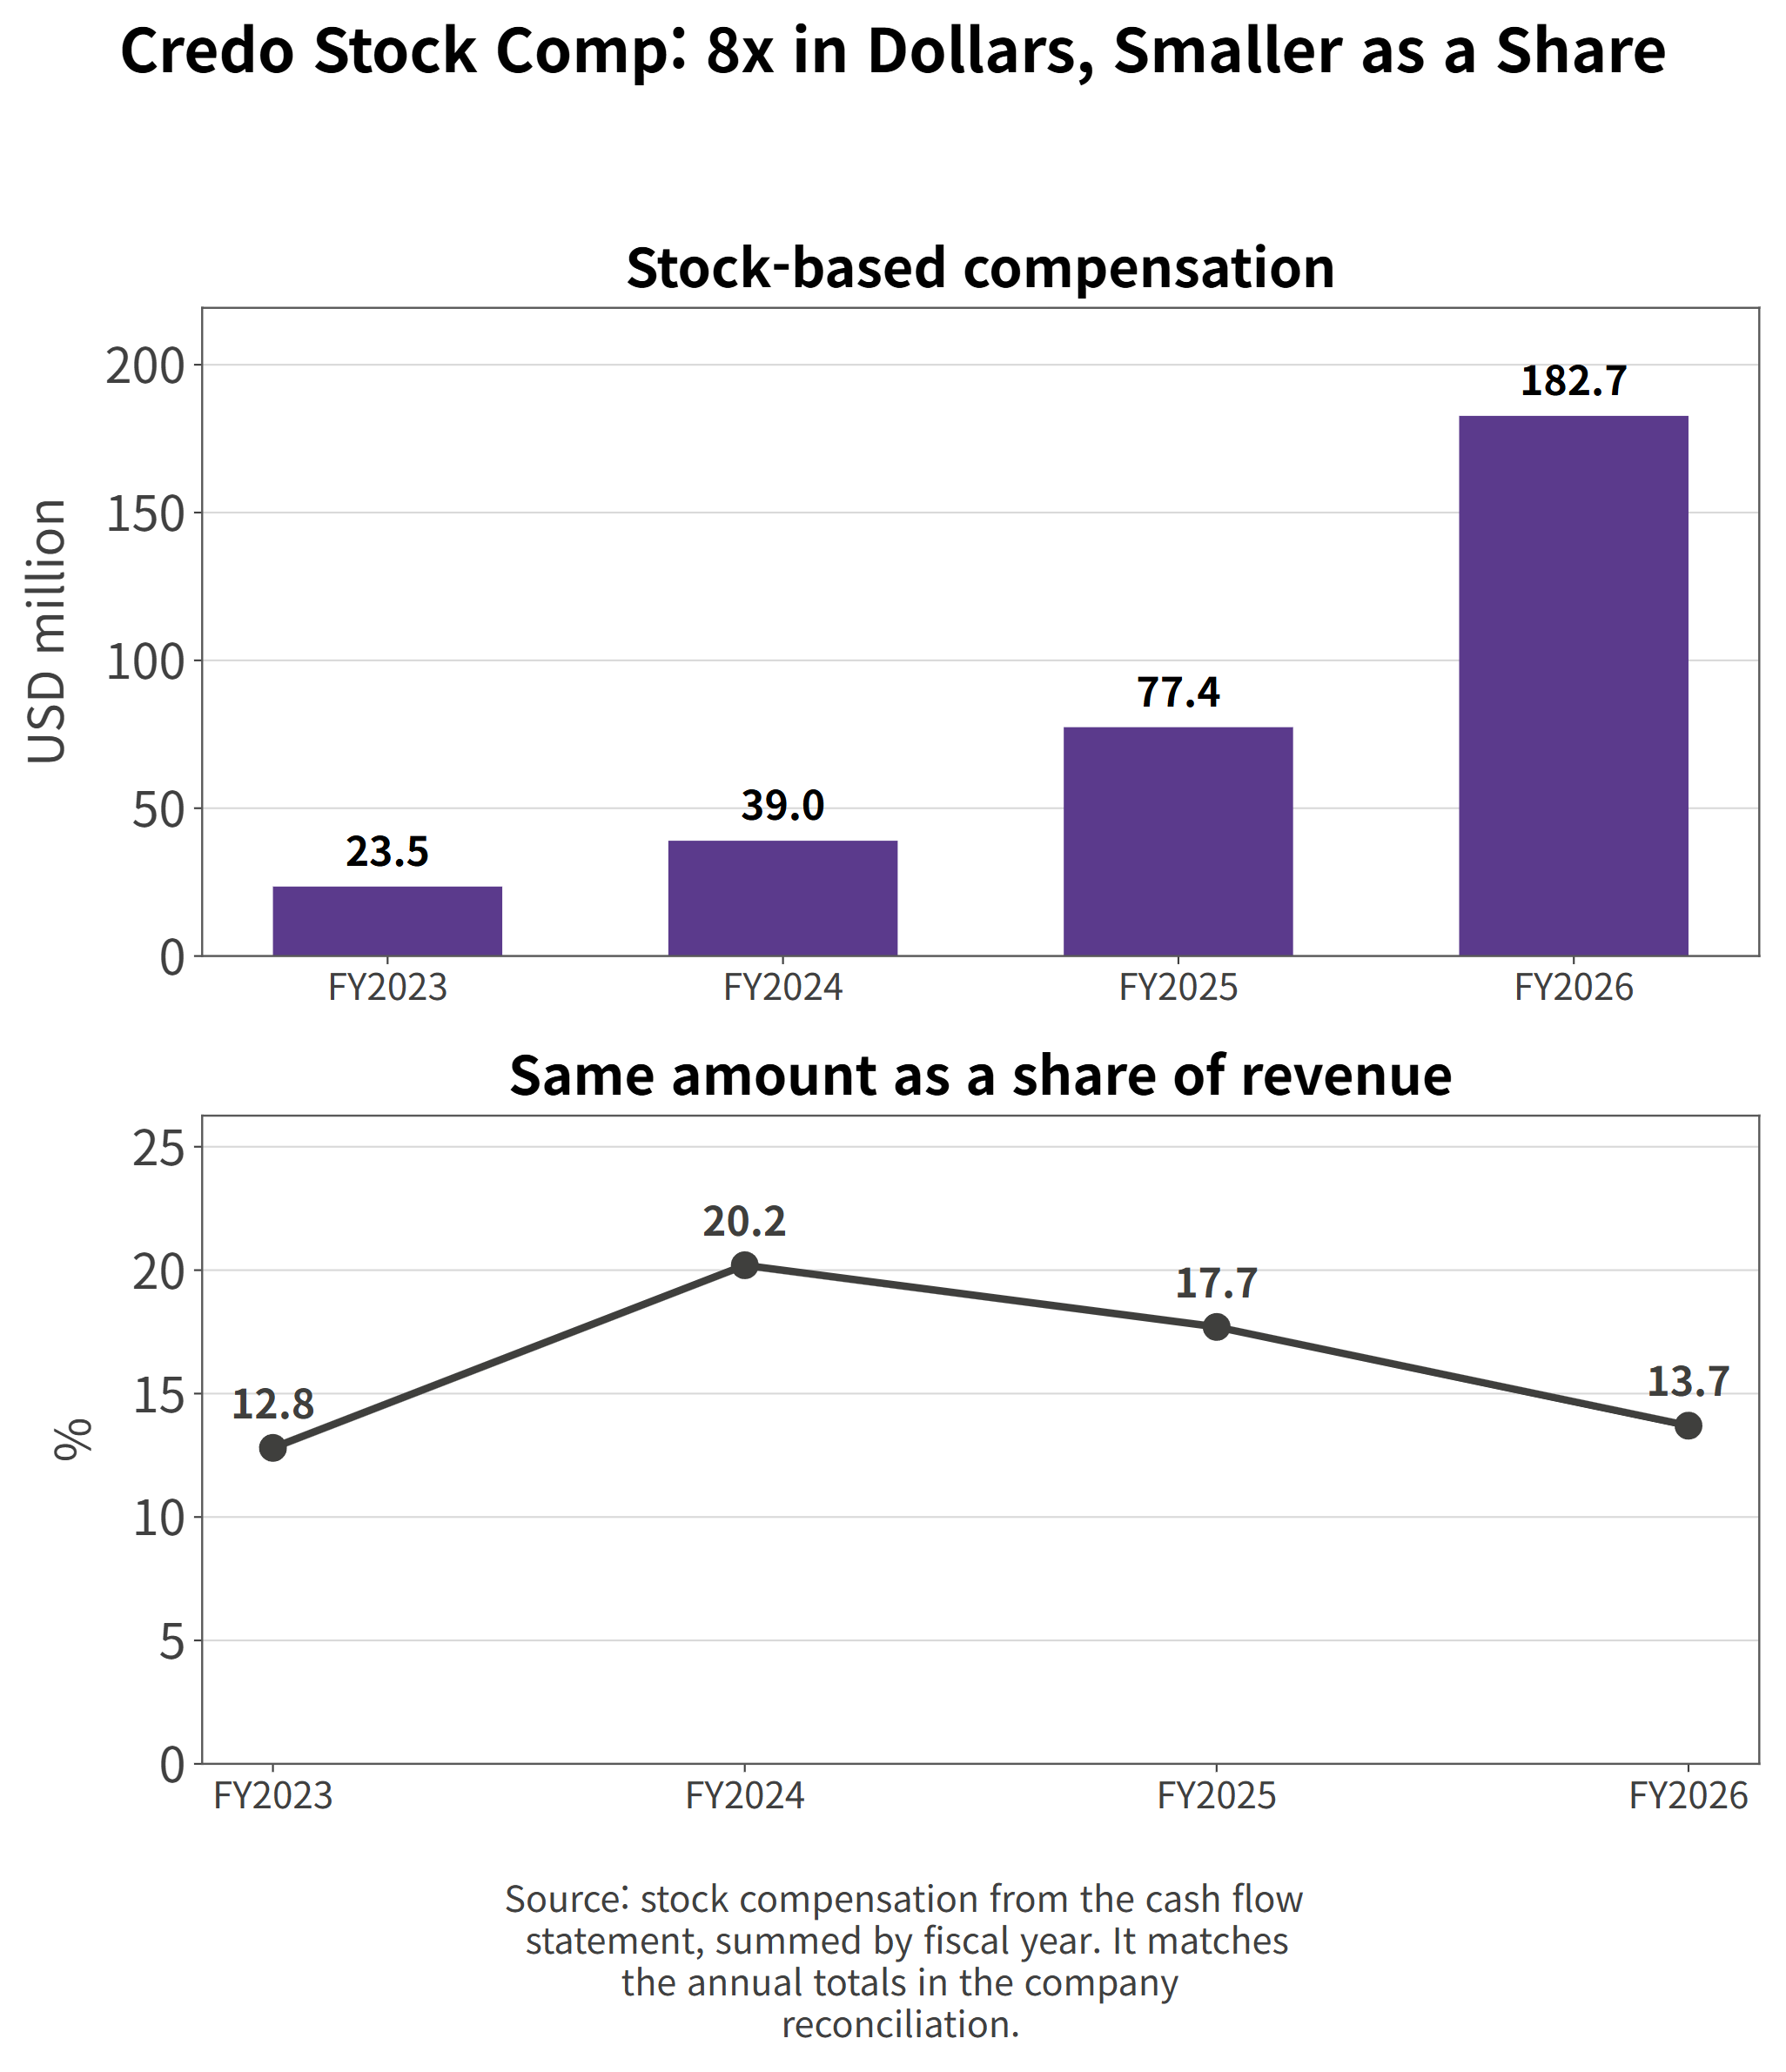
The gap went from $27.9 million to $194.0 million in four years. Revenue grew faster, though, so stock compensation as a share of revenue actually fell, from 20.2% in FY2024 to 13.7% in FY2026. The dollar cost rose while the burden eased.
Credo annual operating income under GAAP and adjusted definitions
So what happens next? The company's own guidance for the first quarter of fiscal 2027 answers that.
Credo stock-based compensation and its share of revenue
Item
Q4 FY2026 (actual)
Q1 FY2027 (guidance)
Revenue
$437.0M
$465.0M–$475.0M
Operating expenses (GAAP)
$142.2M
$167.6M–$171.6M
Operating expenses (adjusted)
$81.7M
$86.0M–$90.0M
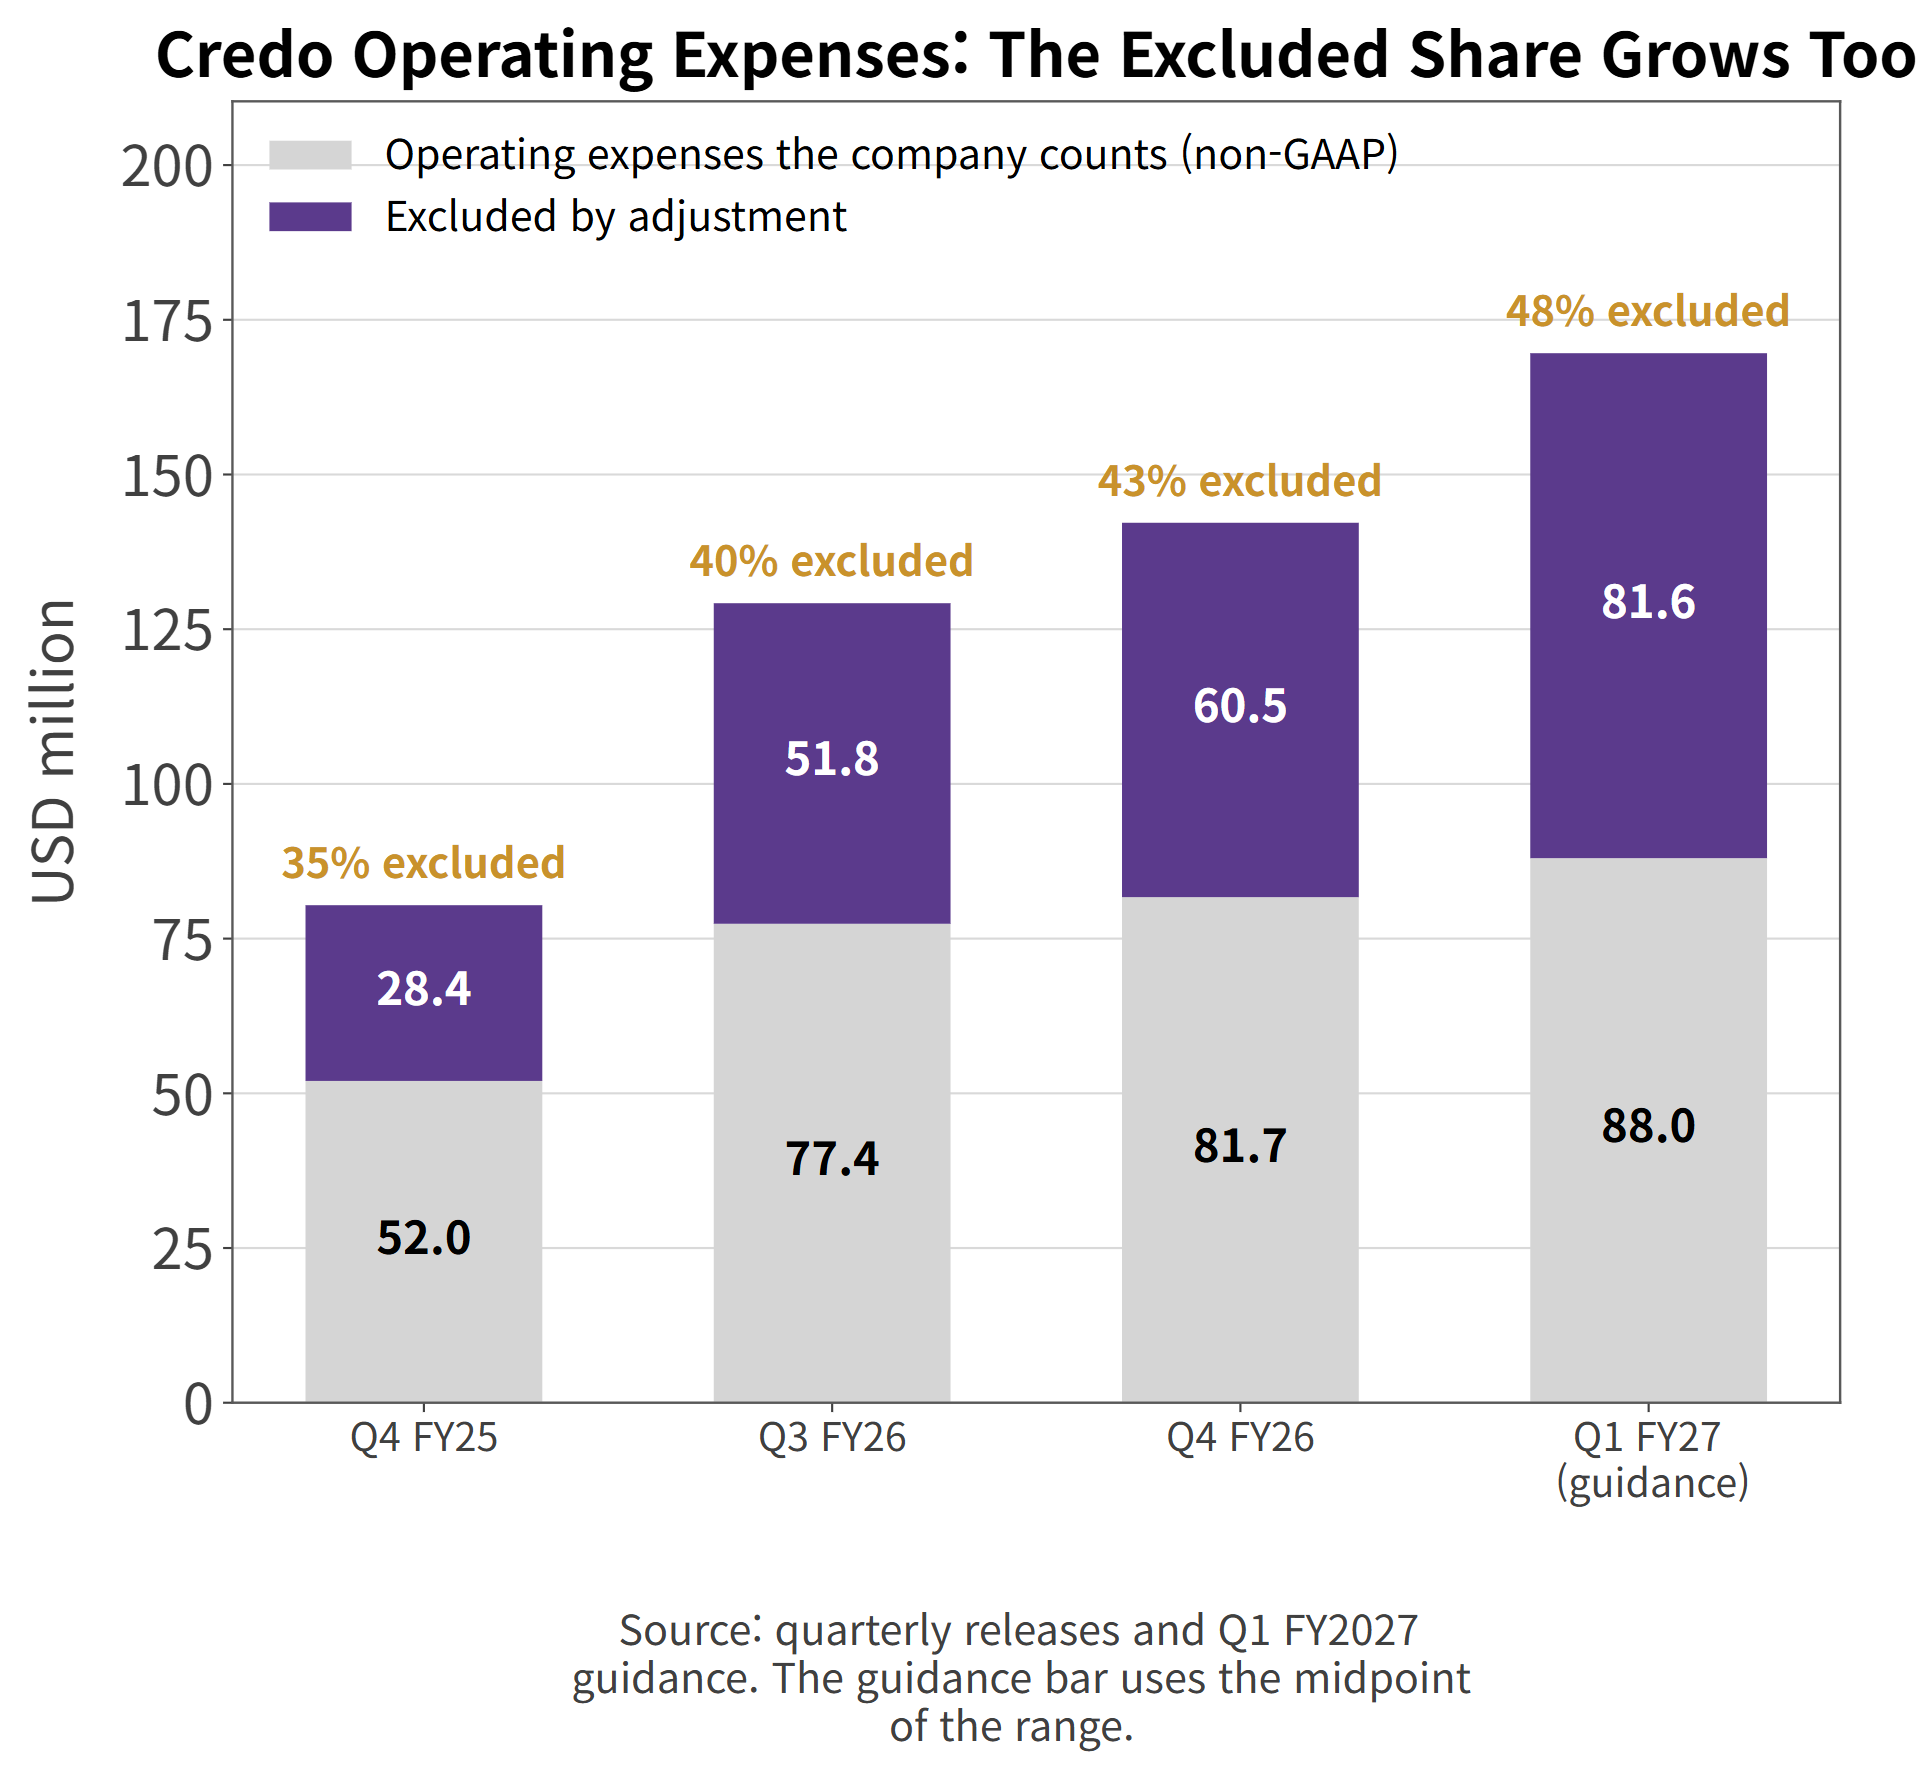
At the midpoint, adjusted operating expenses rise $6.3 million, from $81.7 million to $88.0 million. GAAP operating expenses rise $27.4 million, from $142.2 million to $169.6 million. The excluded portion goes from $60.5 million to $81.6 million — from 43% of operating expenses to 48%.
Credo operating expenses and the portion excluded by adjustment
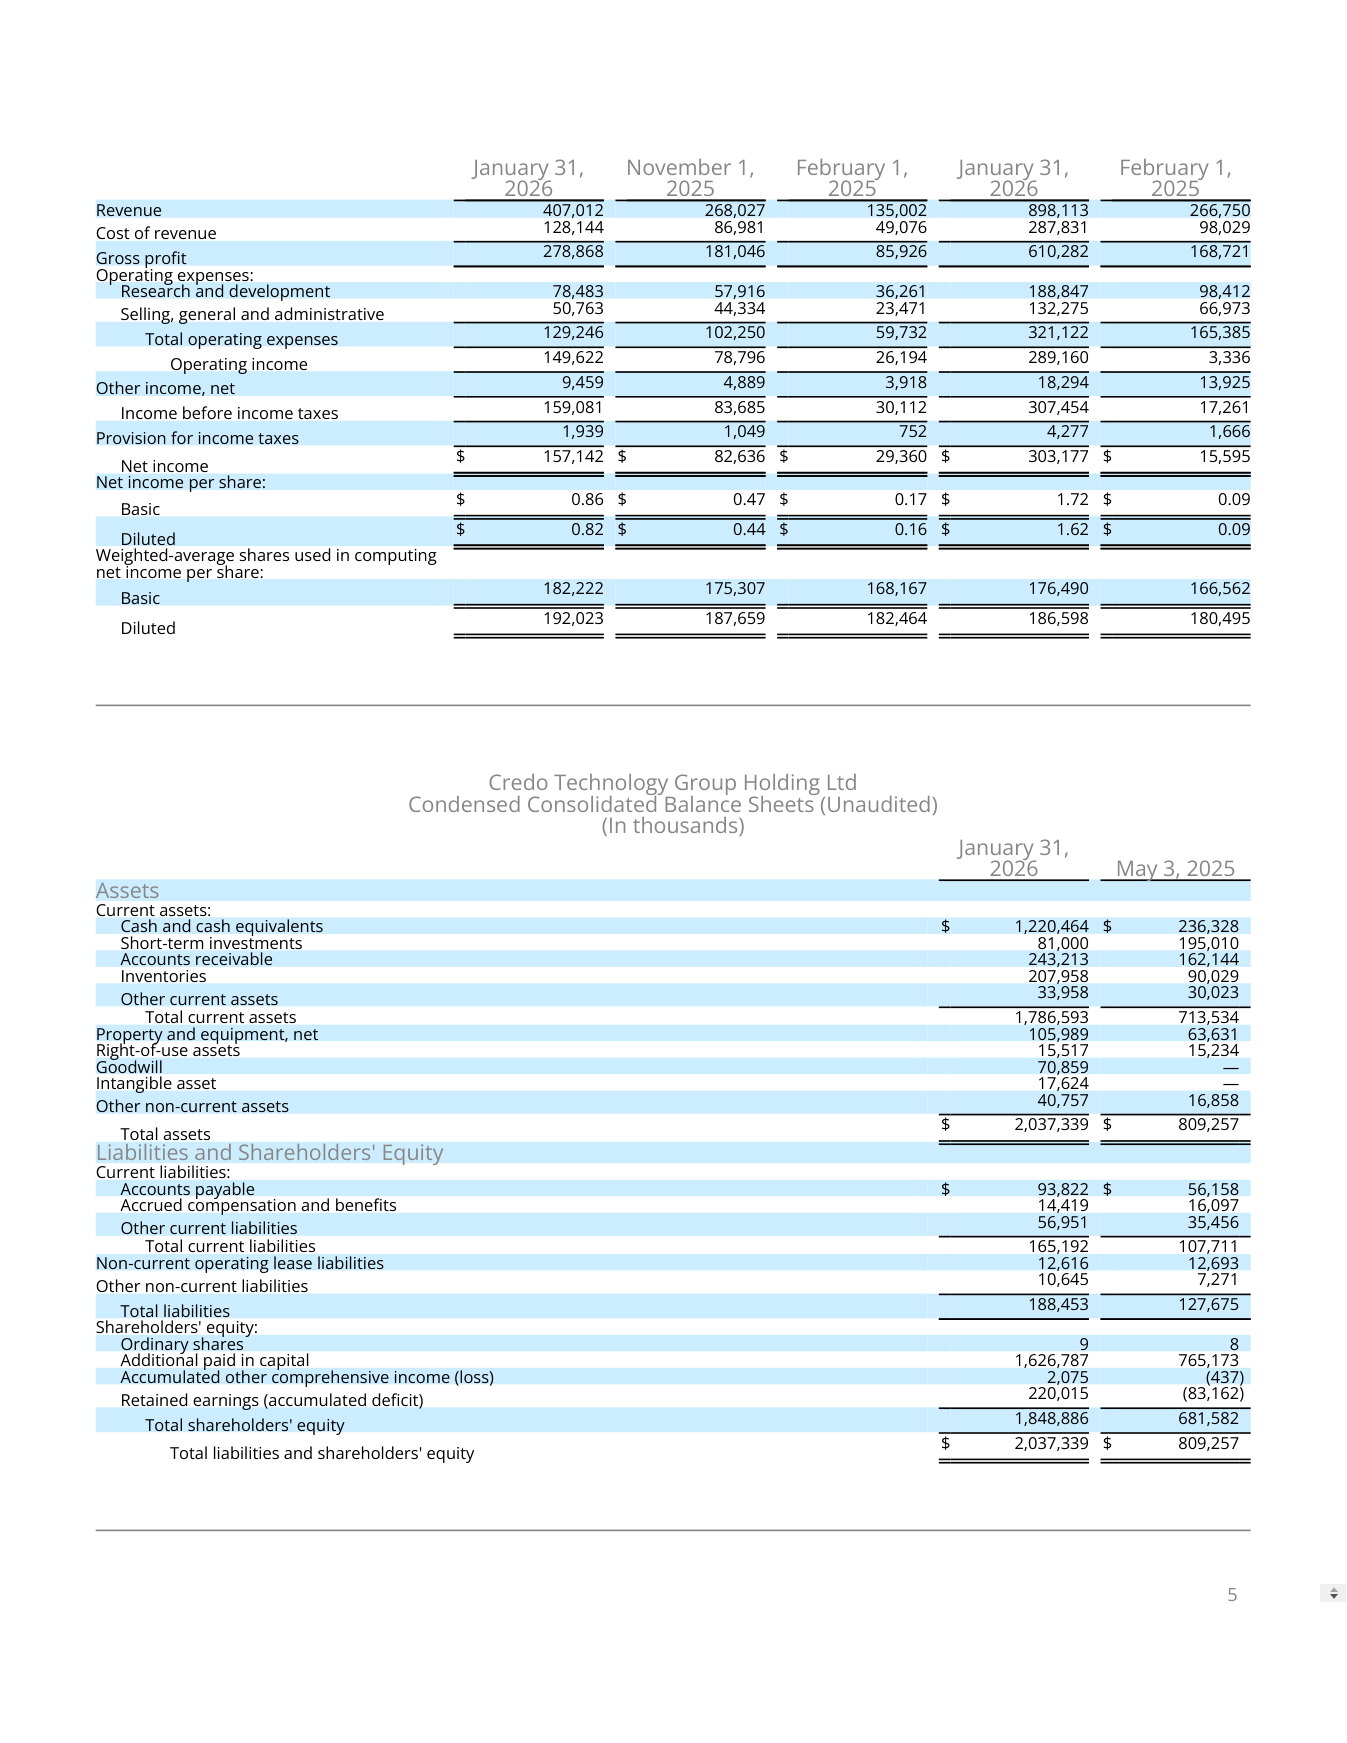
There is one more wrinkle. Credo also counts a different share base for adjusted earnings per share. The release states that the non-GAAP share adjustment removes the treasury-stock effect of stock compensation not yet recognized. In the January 2026 quarter that meant 192.0 million GAAP diluted shares against 194.9 million non-GAAP diluted shares. The numerator drops the expense and the denominator drops its dilution math.
Credo quarterly statement of operations (source: company earnings release)
Credo Reversed Its Own Guidance Mid-Quarter
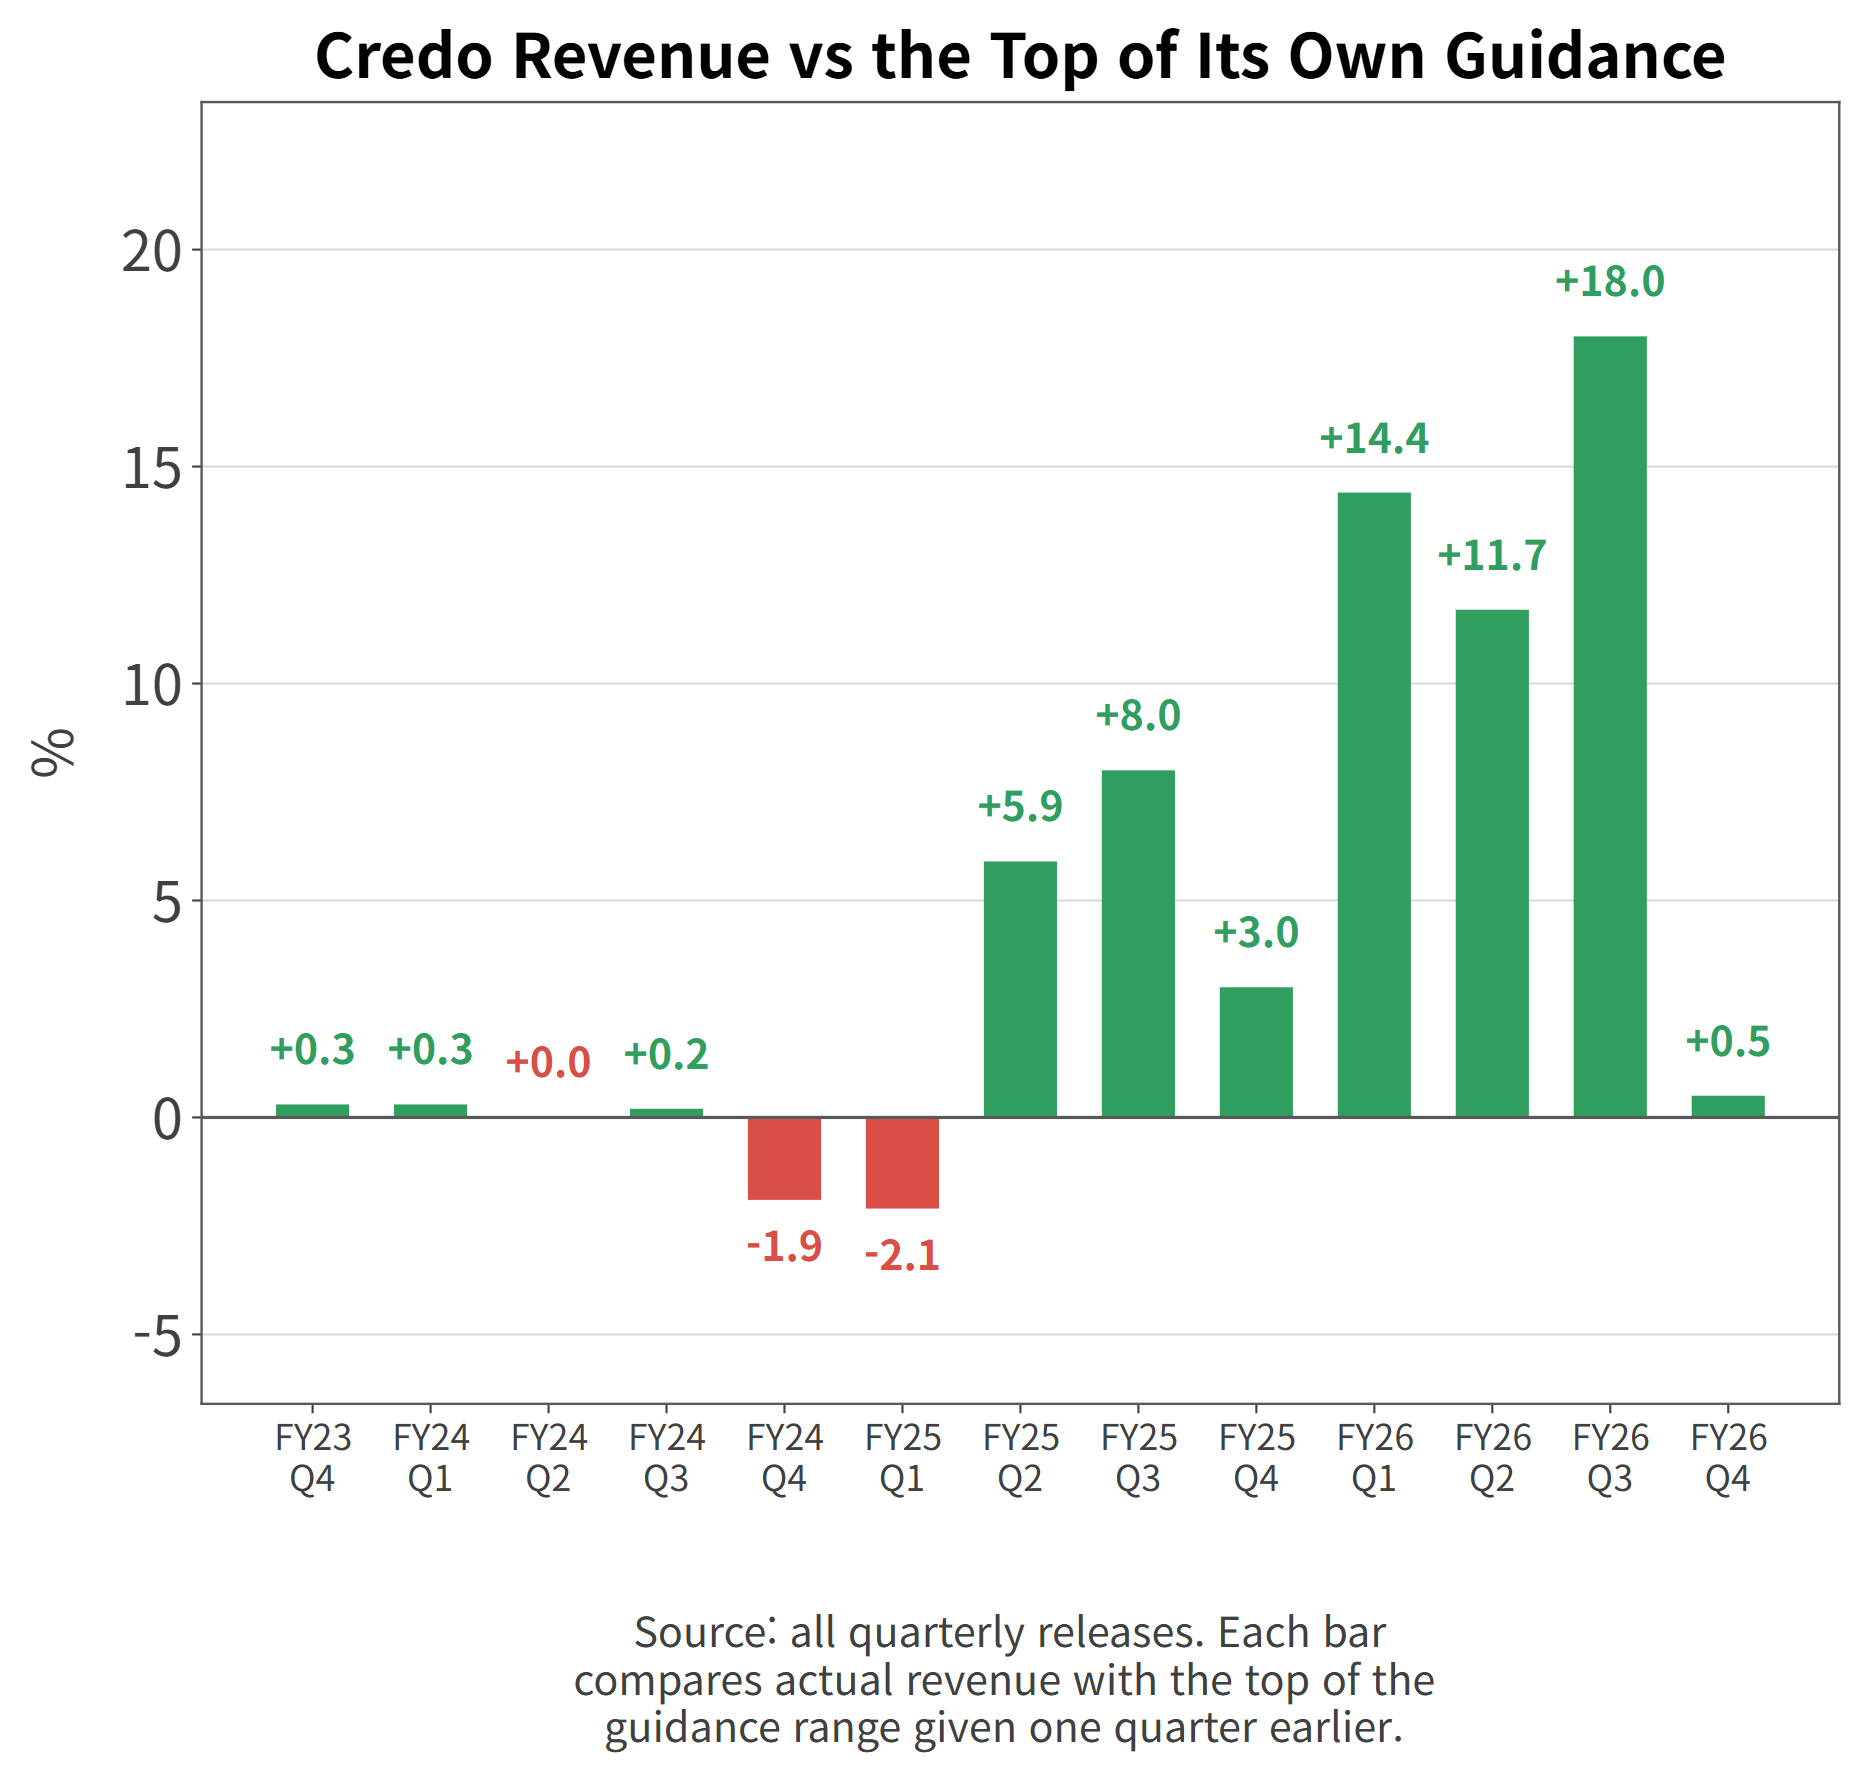
Credo publishes a revenue forecast for the coming quarter every time it reports. I paired each forecast with the result that followed.
Credo operating margin under four yardsticks
Through fiscal 2024 the company landed almost exactly on the top of its own range: +0.3%, +0.2%, -1.9%. Hitting a two-month forecast that precisely usually means the orders were already in hand.
Credo revenue versus the top of its own guidance
Then it broke. Starting with the second quarter of fiscal 2025 the beats ran +5.9%, +8.0%, +14.4%, +11.7%, and +18.0% in the January 2026 quarter. Five straight quarters of missing your own number to the upside is not conservatism. It is demand moving faster than the people selling into it.
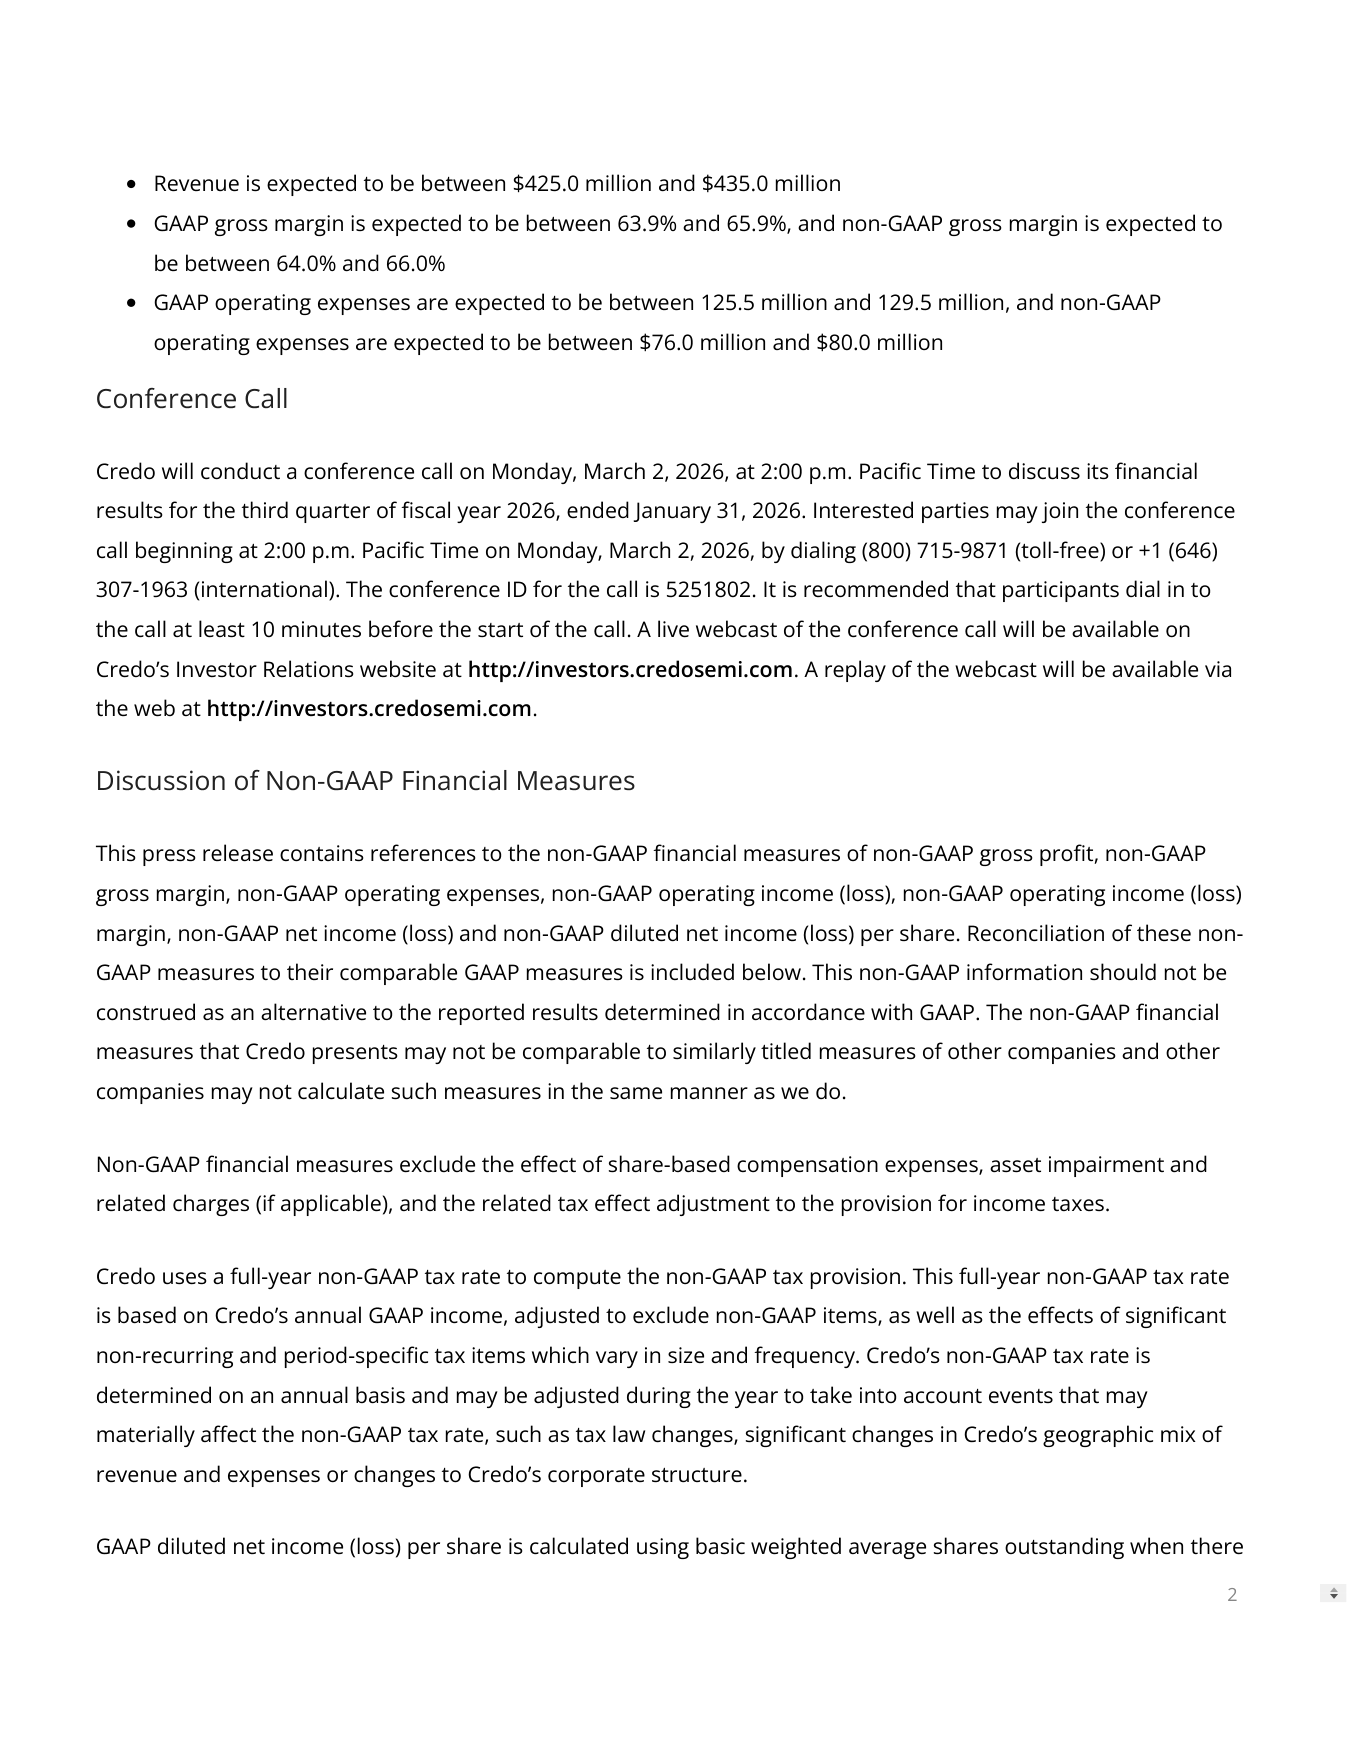
February 9, 2026 is the sharpest example. Before the quarter had even closed, Credo issued a separate releasesaying third-quarter revenue would land between $404.0 million and $408.0 million — well above the $335.0 million to $345.0 million it had guided two months earlier. The quarter came in at $407.0 million.
Credo forward guidance disclosure (source: company earnings release)
The most recent quarter reads differently. May 2026 revenue of $437.0 million cleared the $435.0 million top of guidance by +0.5%. The stretch where demand kept outrunning the company's own plan has, for now, settled down.
Credo is expected to report fiscal first-quarter results in the first days of September 2026. Whether the beat returns to double digits or stays near the guidance line is the near-term thing to watch.
Is Credo Stock Expensive? Two Bands, One Missing
Credo Price-to-Sales and Price-to-Book Bands
A price-to-earnings band does not work on this company. Reported net income only turned positive in 2025, so stringing the multiple across the full post-IPO history runs from 2,139x down to 53x — a fall, not a band.
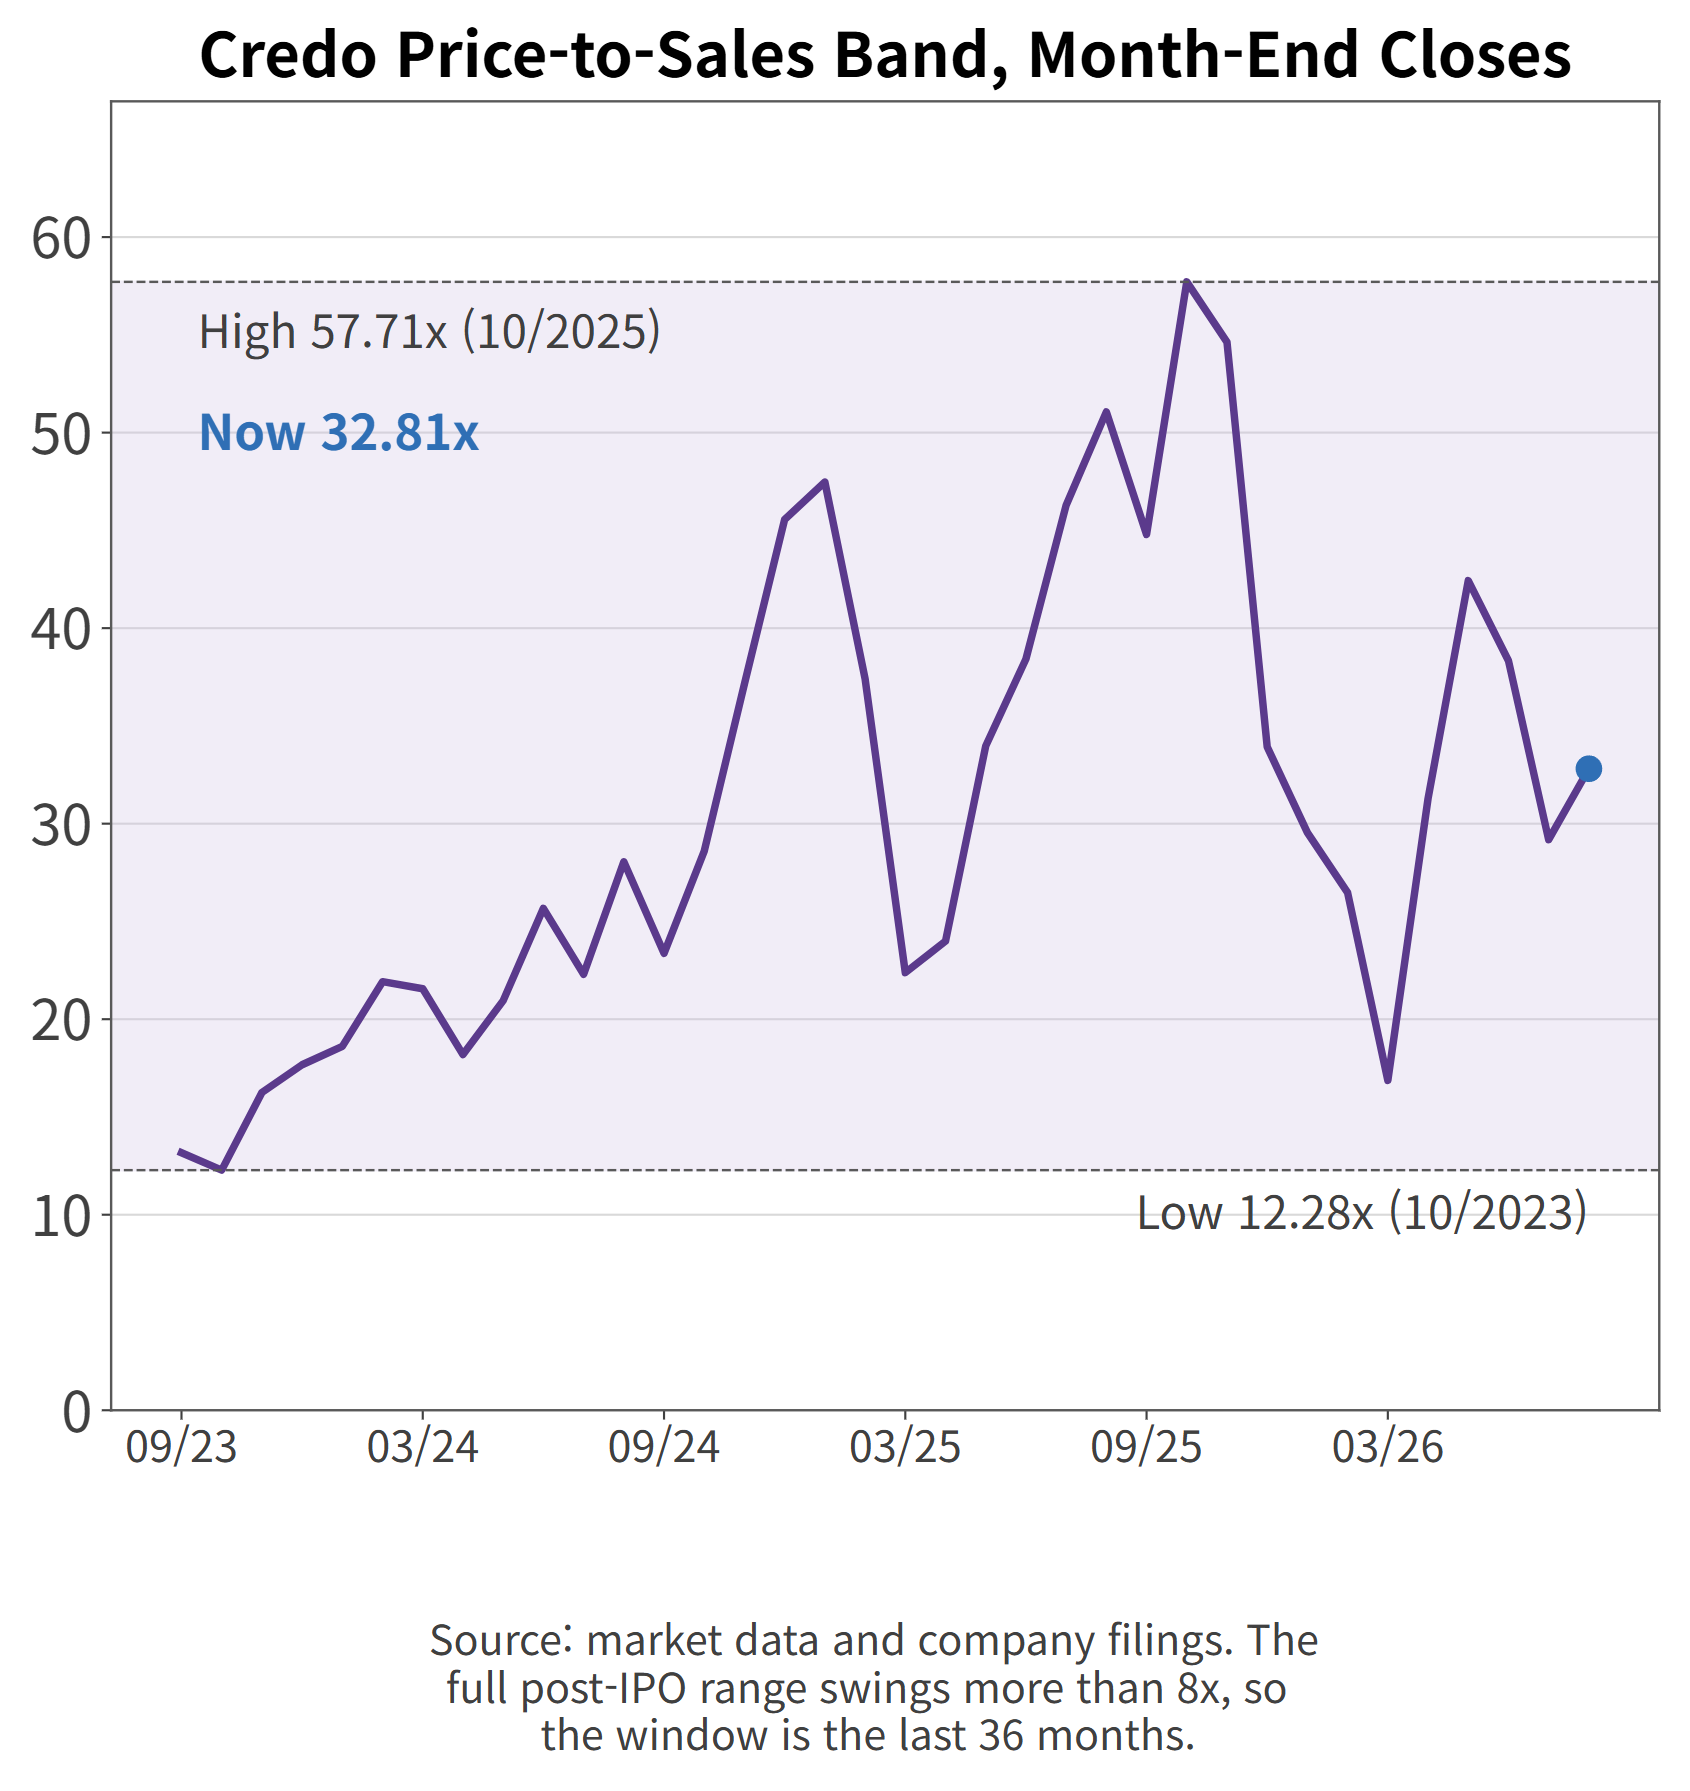
Credo price-to-sales band, last 36 month-end closes
So I measured two multiples over the last 36 month-end closes.
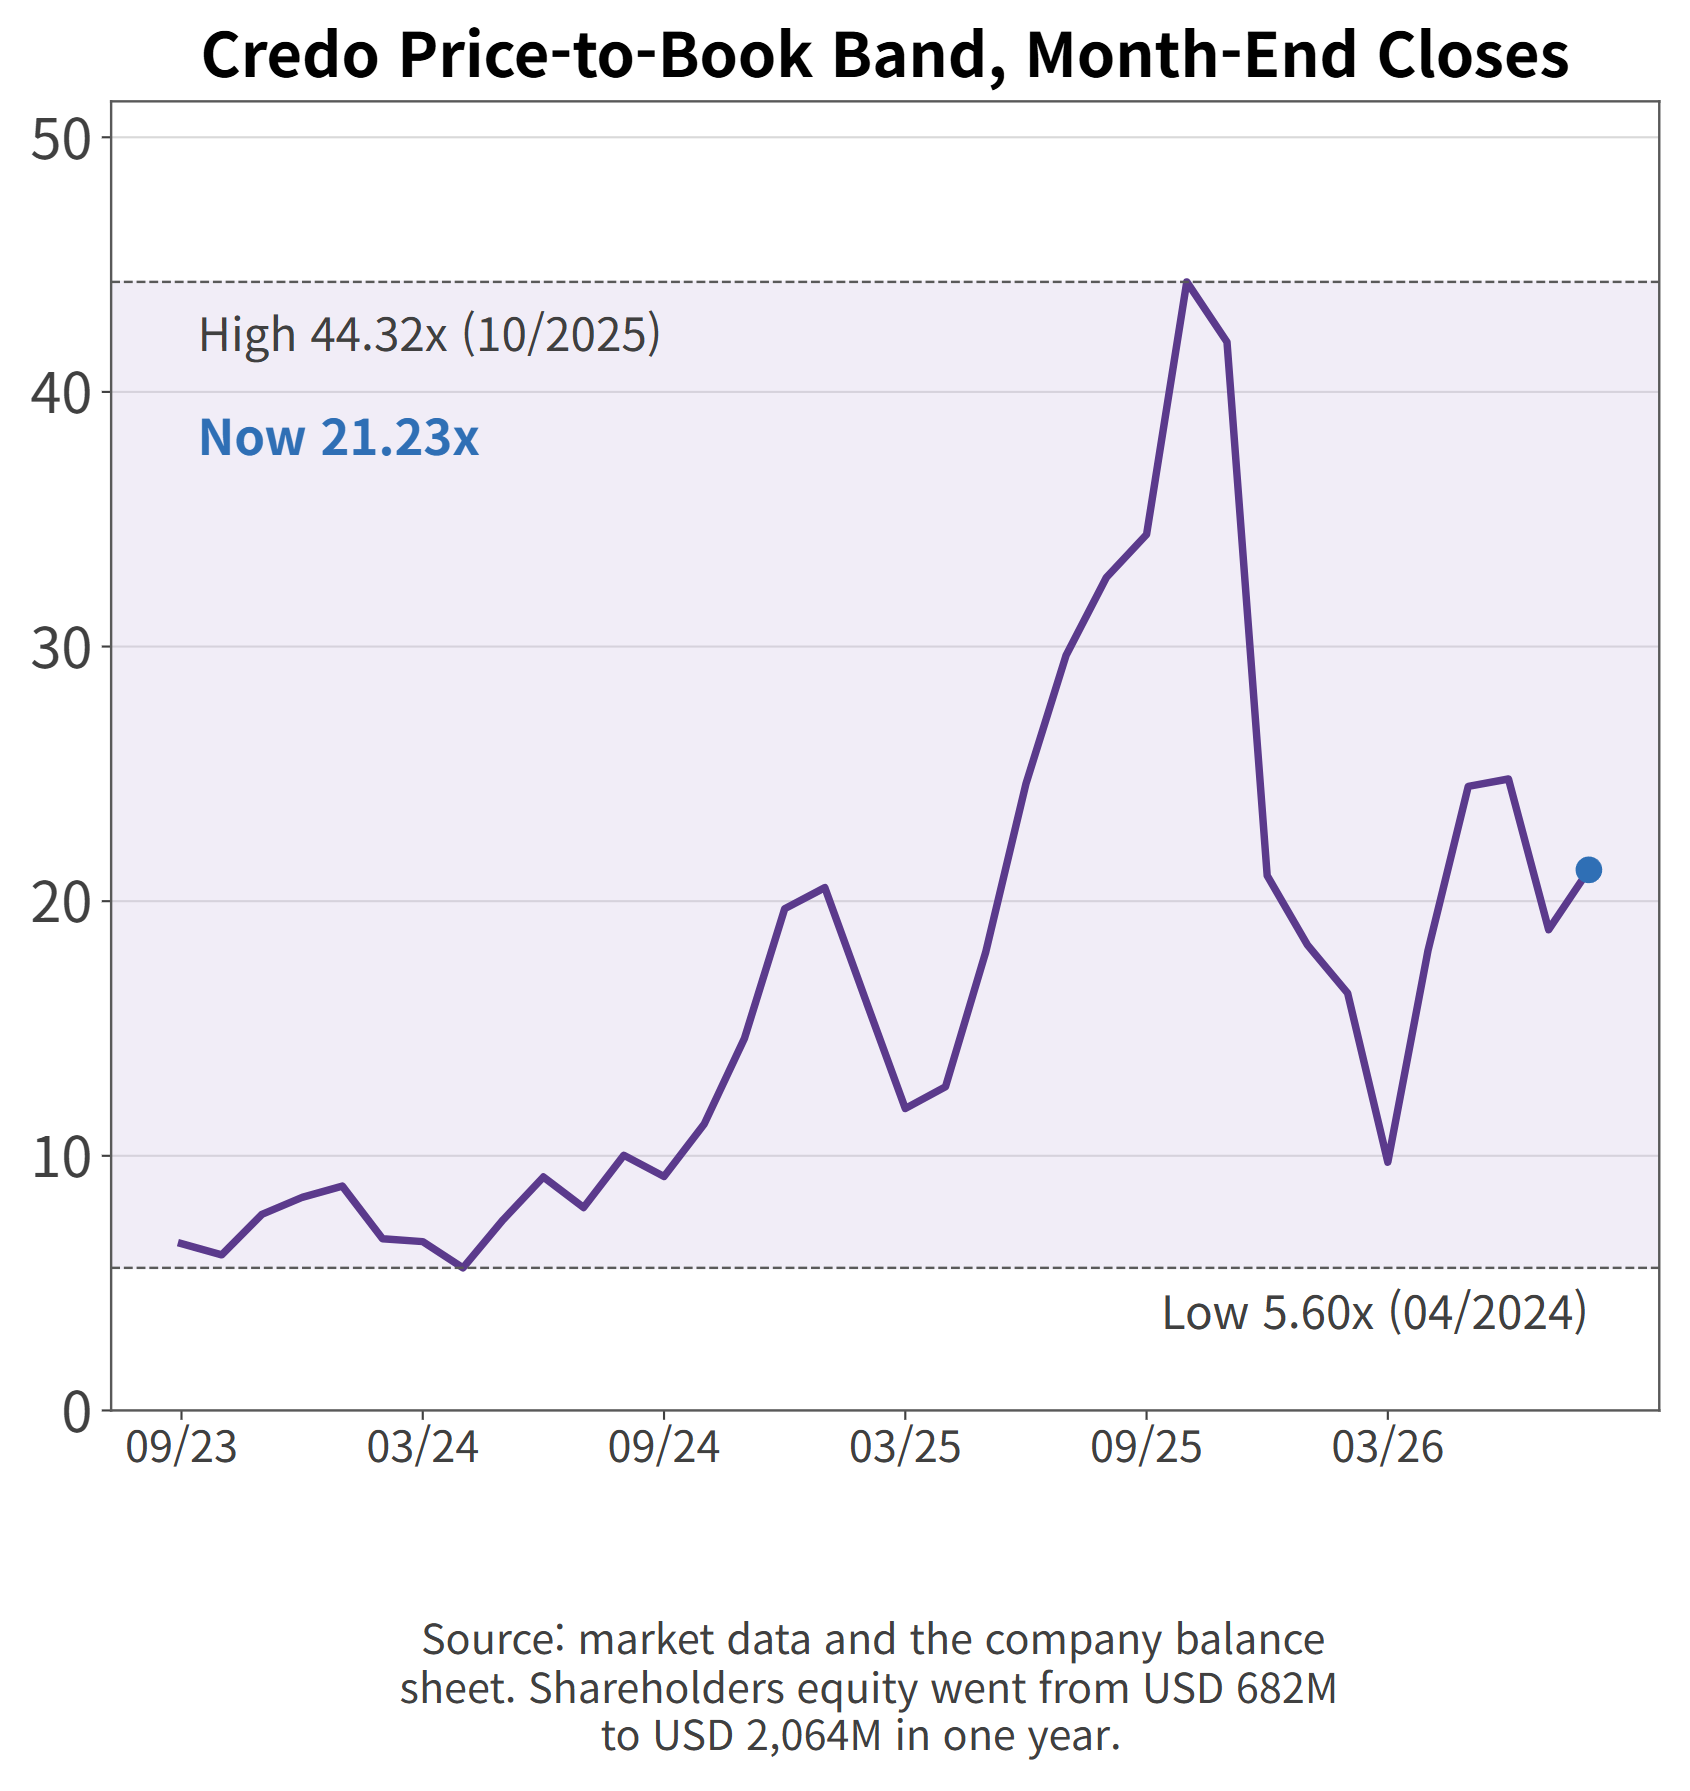
Price-to-sales ranged from 12.28x to 57.71x and sits at 32.81x, the 61st percentile of that window. Price-to-book ranged from 5.60x to 44.32x and sits at 21.23x, the 78th percentile. Both are above the middle, and book value is the higher of the two.
Credo price-to-book band, last 36 month-end closes
There is a reason for that split. Shareholders' equity tripled in one year, from $681.6 million to $2,063.6 million. Of the $1,382.0 million added, $472.3 million came from net income. The rest is paid-in capital — stock compensation and shares issued for acquisitions. A bigger denominator should have pushed the ratio down; sitting at the 78th percentile anyway means the price climbed faster than the equity did.
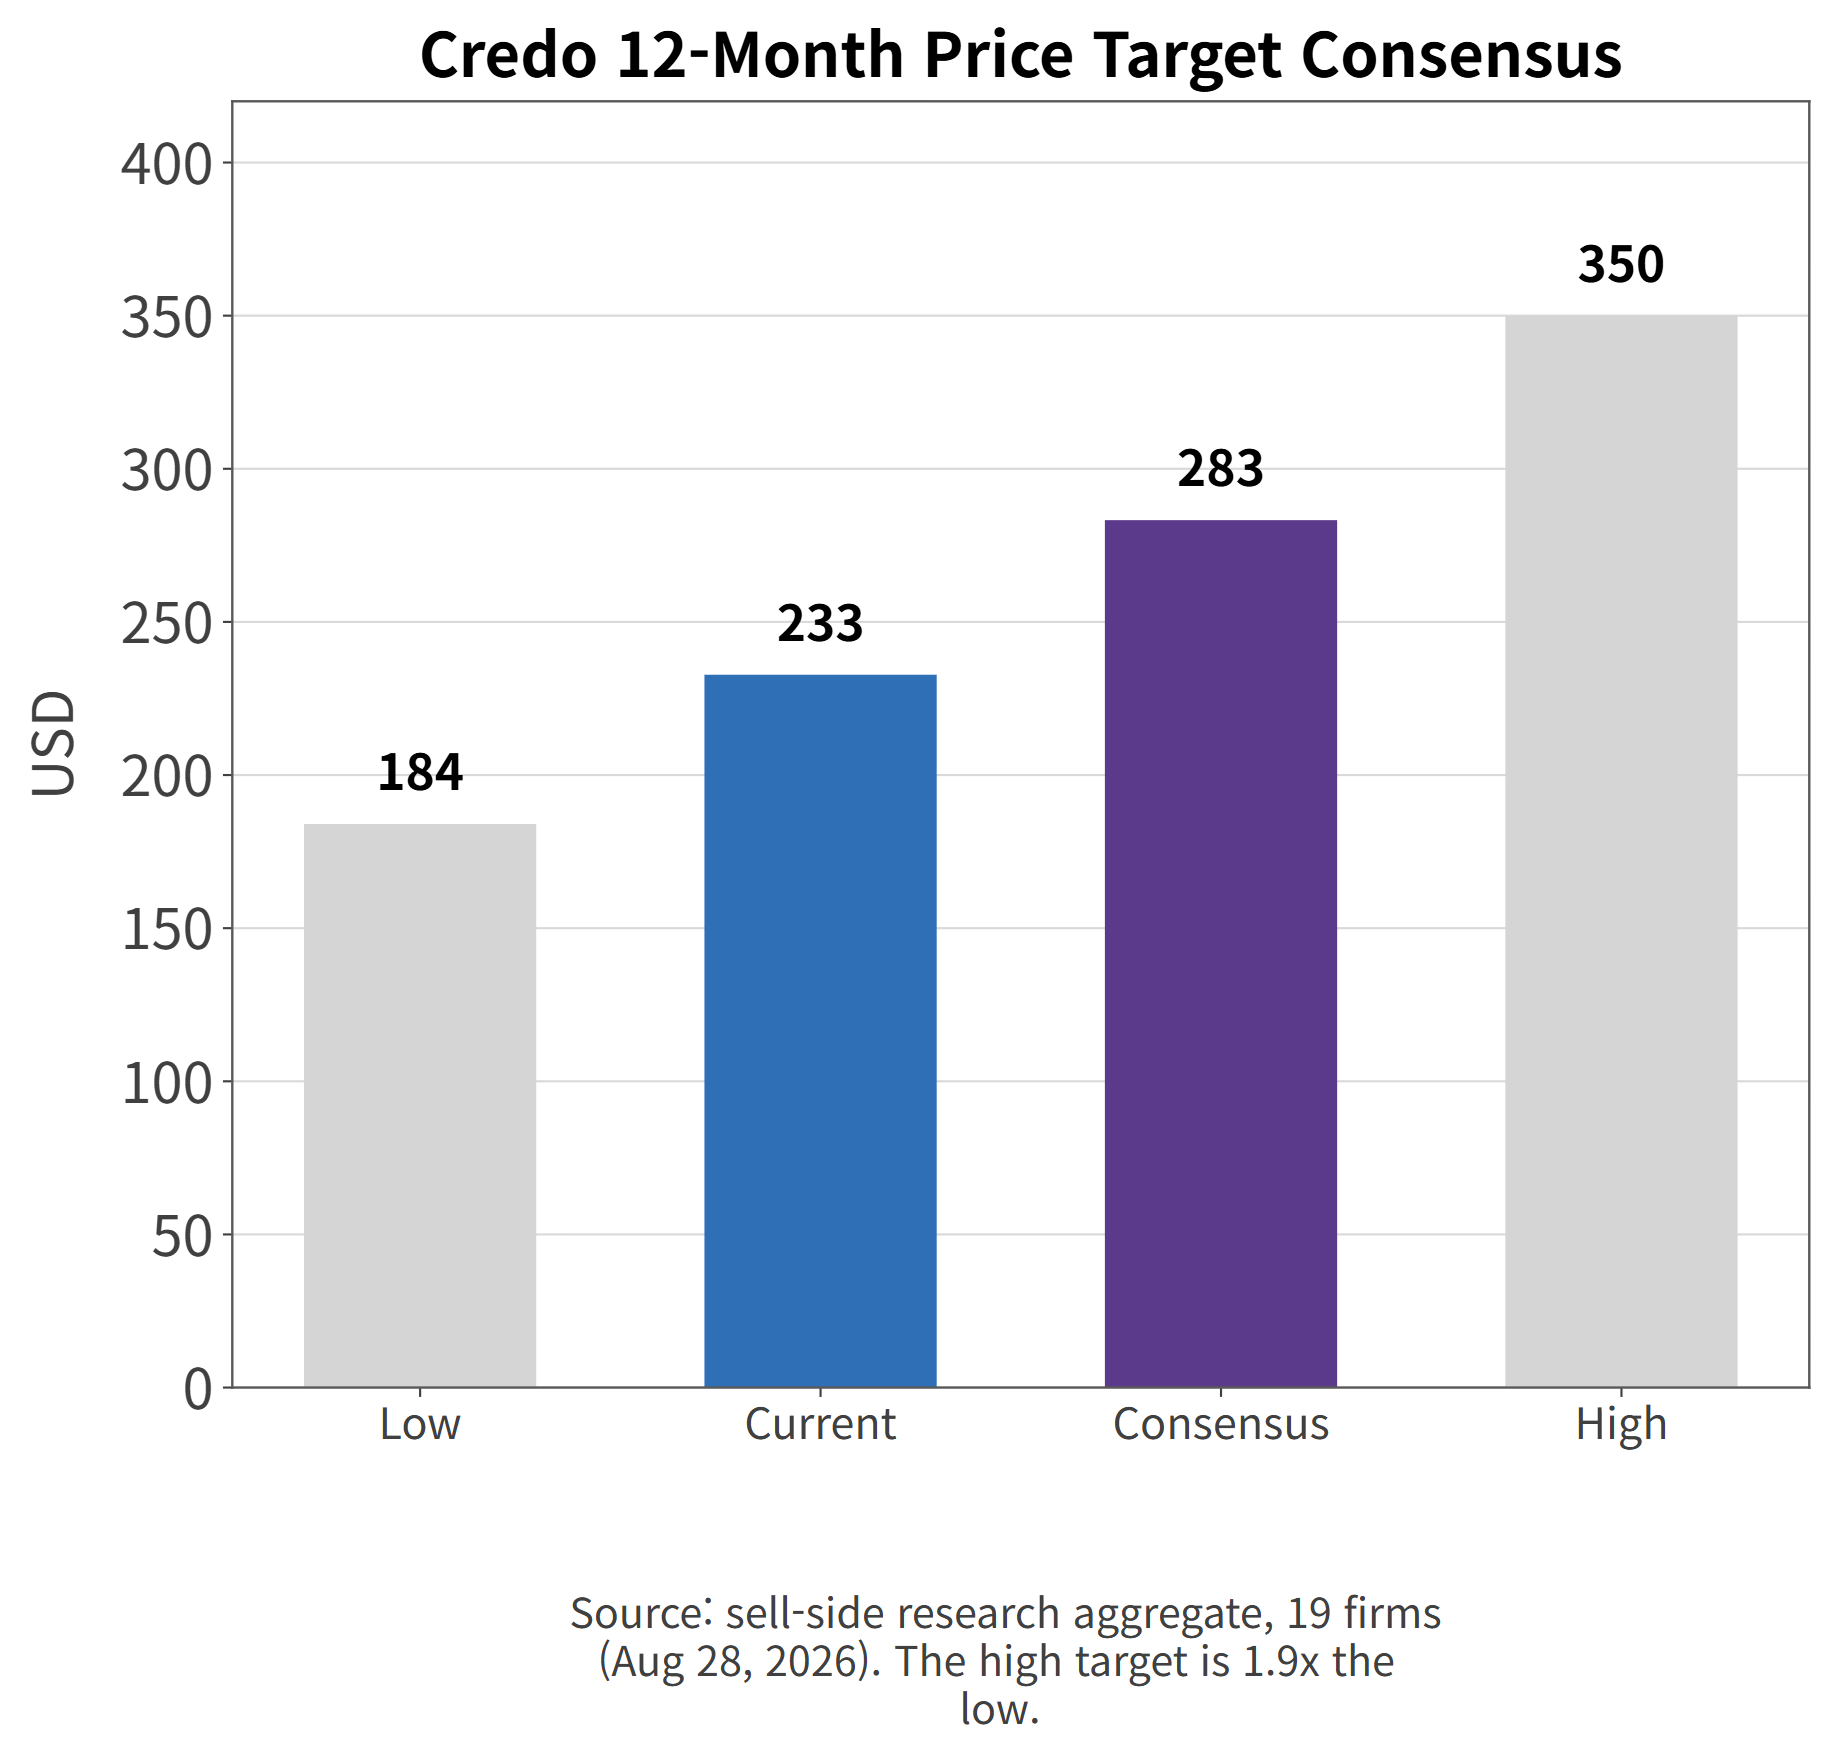
Sell-side consensus from 19 firms puts the 12-month price target at $283.23, with a low of $184 and a high of $350. The high is 1.9x the low. Growth estimates cluster; what analysts disagree about is how much multiple to grant them.
Credo 12-month price target consensus
Key Takeaways for CRDO Stock
The question that survives all of this is which profit number you are underwriting. Credo says it earned $661.5 million on an adjusted basis. The income statement says $472.3 million. Neither is wrong; the definitions differ.
What is new is the direction. The company has told you, in its own guidance, that it intends to widen that gap to $81.6 million next quarter. Choose the yardstick and you have chosen the price.
Methodology and Sources
The figures in this article come from Credo's SEC filings and all 17 of its quarterly earnings releases, cross-checked against the XBRL data filed with the SEC. Valuation bands use month-end closing prices and trailing twelve-month results as they were known at each date. This article is independent research, not investment advice.