lululemon (LULU) Stock Analysis: Margin Decline and Tariffs
by Global Stock Brief2026. 9. 3.
lululemon (LULU) : Sold More, Kept Lesslululemon (LULU) share price. Closed September 2, 2026 at $120.07
lululemon athletica (NASDAQ: LULU) grew revenue 4.3% last quarter and lost 36.9% of its operating income doing it. This LULU stock analysis works through where 730 basis points of operating margin went, why U.S. sales have now declined for three straight quarters while Mainland China grew 30%, when tariffs first entered the company's own earnings language, and why all three valuation multiples sit in the bottom 5% of their five-year range.
Two numbers from the same income statement point in opposite directions. Revenue rose to $2.47 billion. Operating income fell to $276.9 million from $438.6 million. Nothing about the quarter's unit volume explains that gap. What changed was the cost of putting product on the shelf and the cost of running the stores it sits in.
What the May Quarter Actually Reported
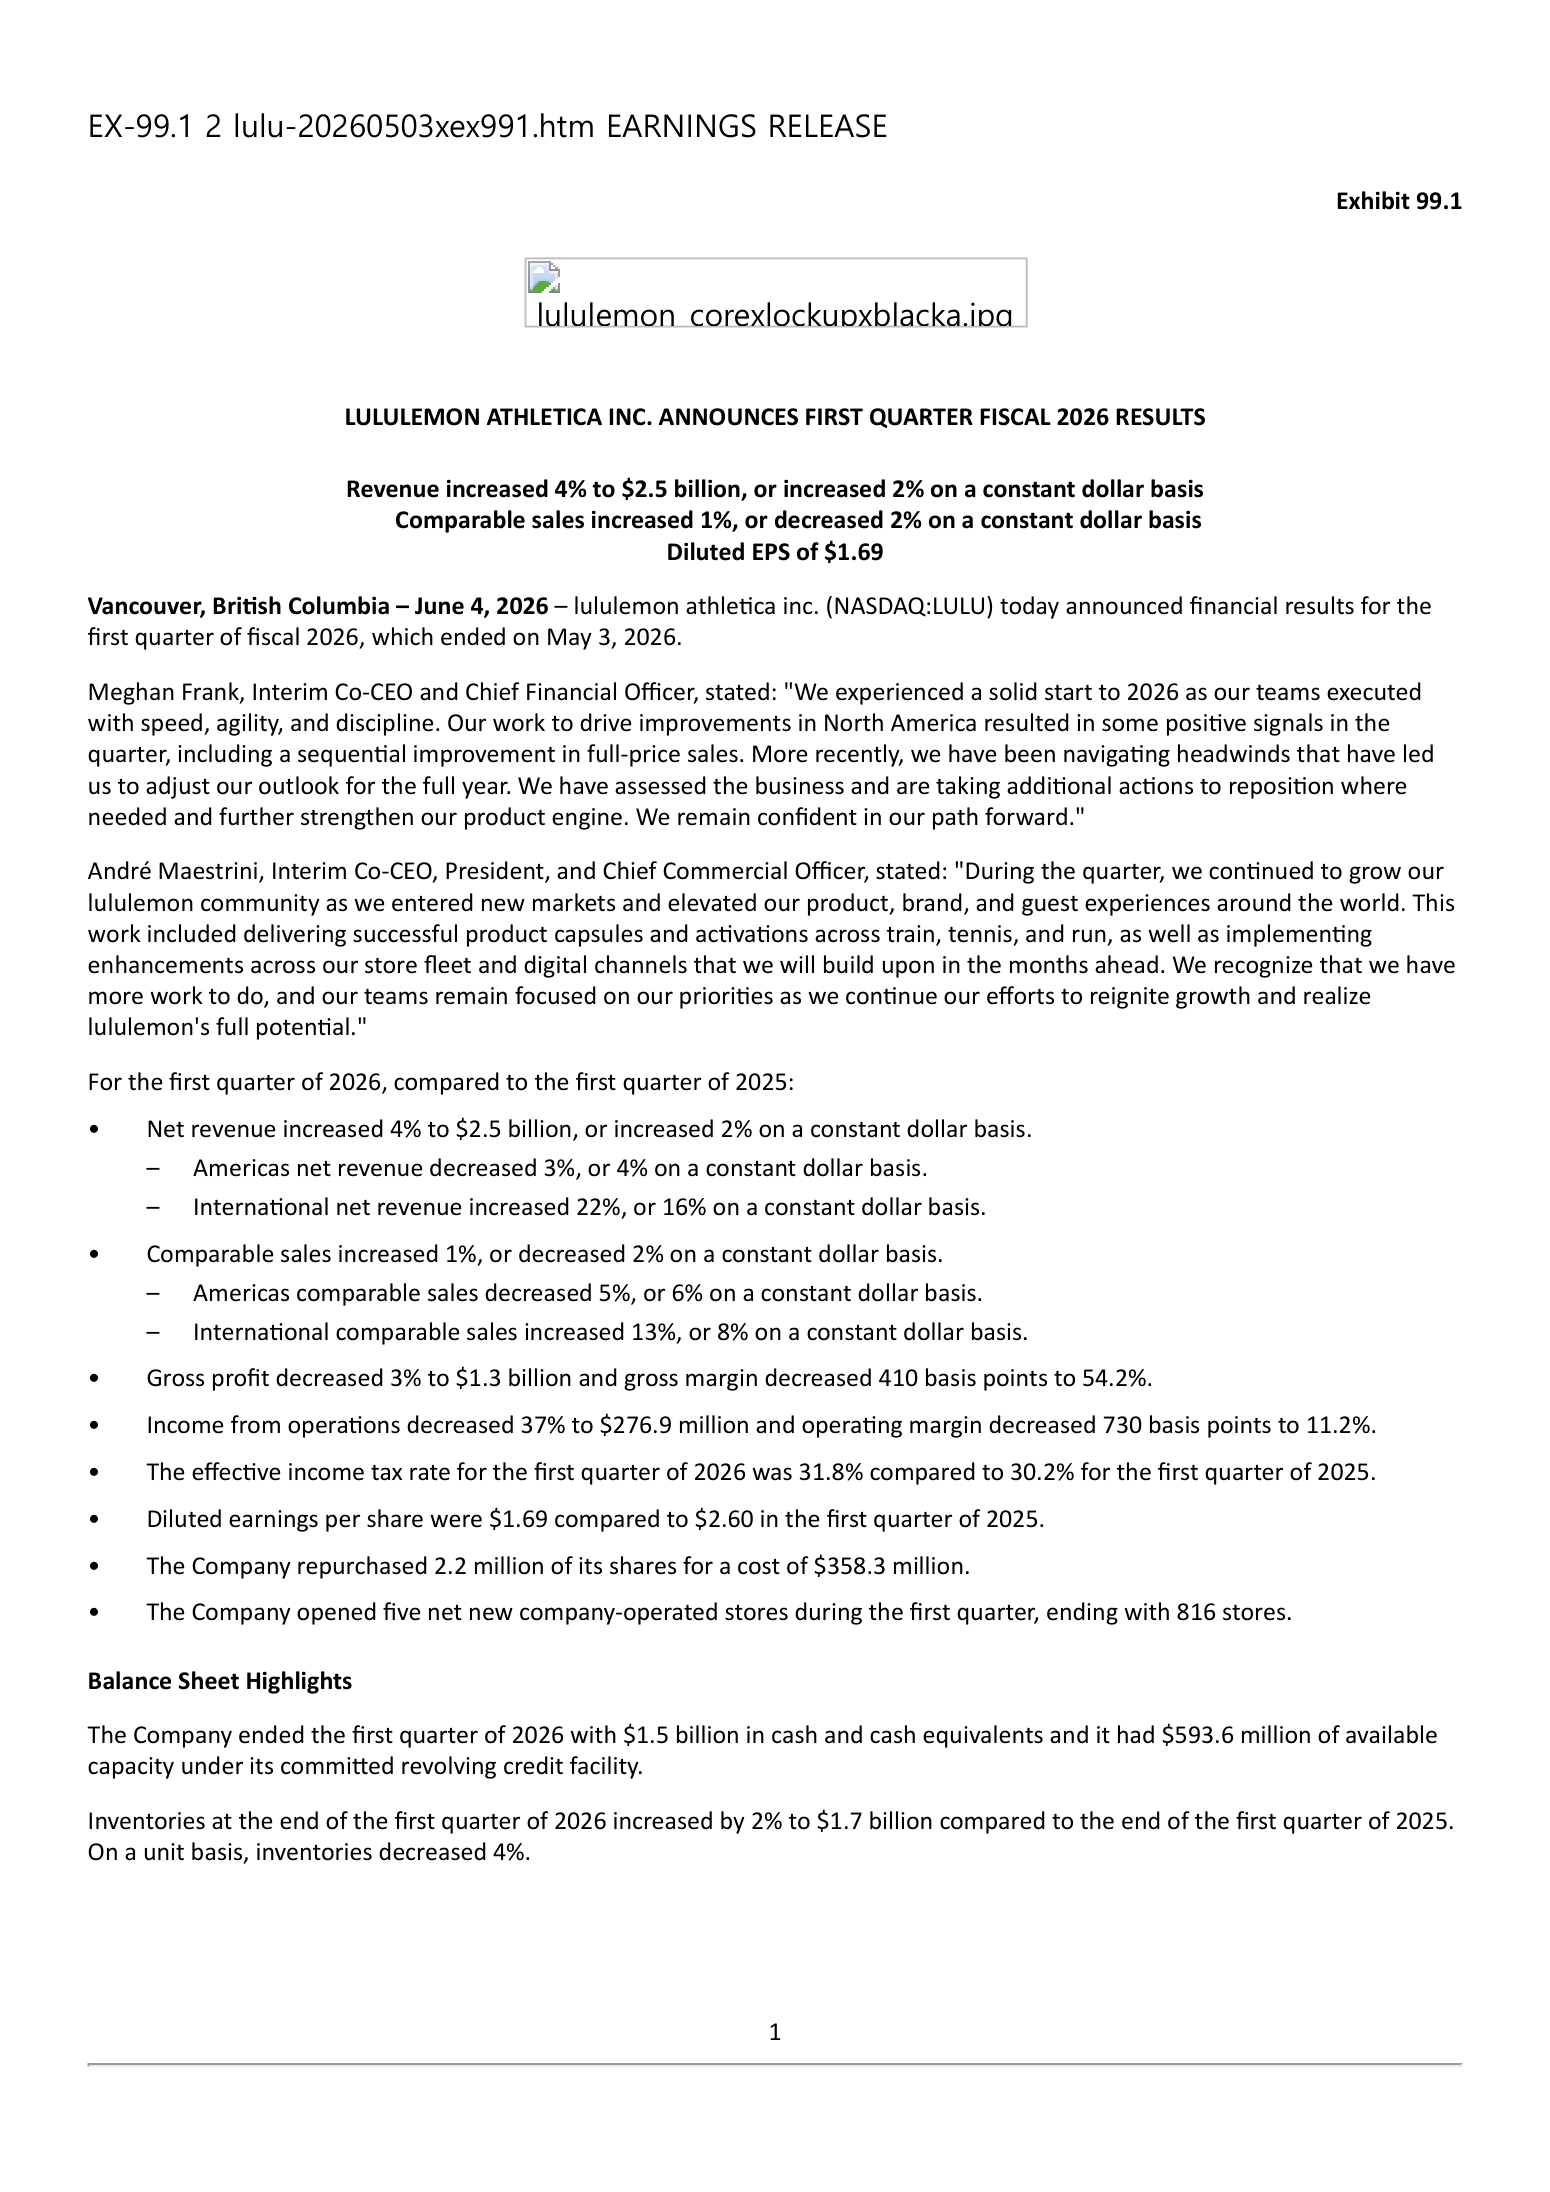
Meghan Frank, Interim Co-CEO and Chief Financial Officer, put it this way in the June 4 release: "More recently, we have been navigating headwinds that have led us to adjust our outlook for the full year."
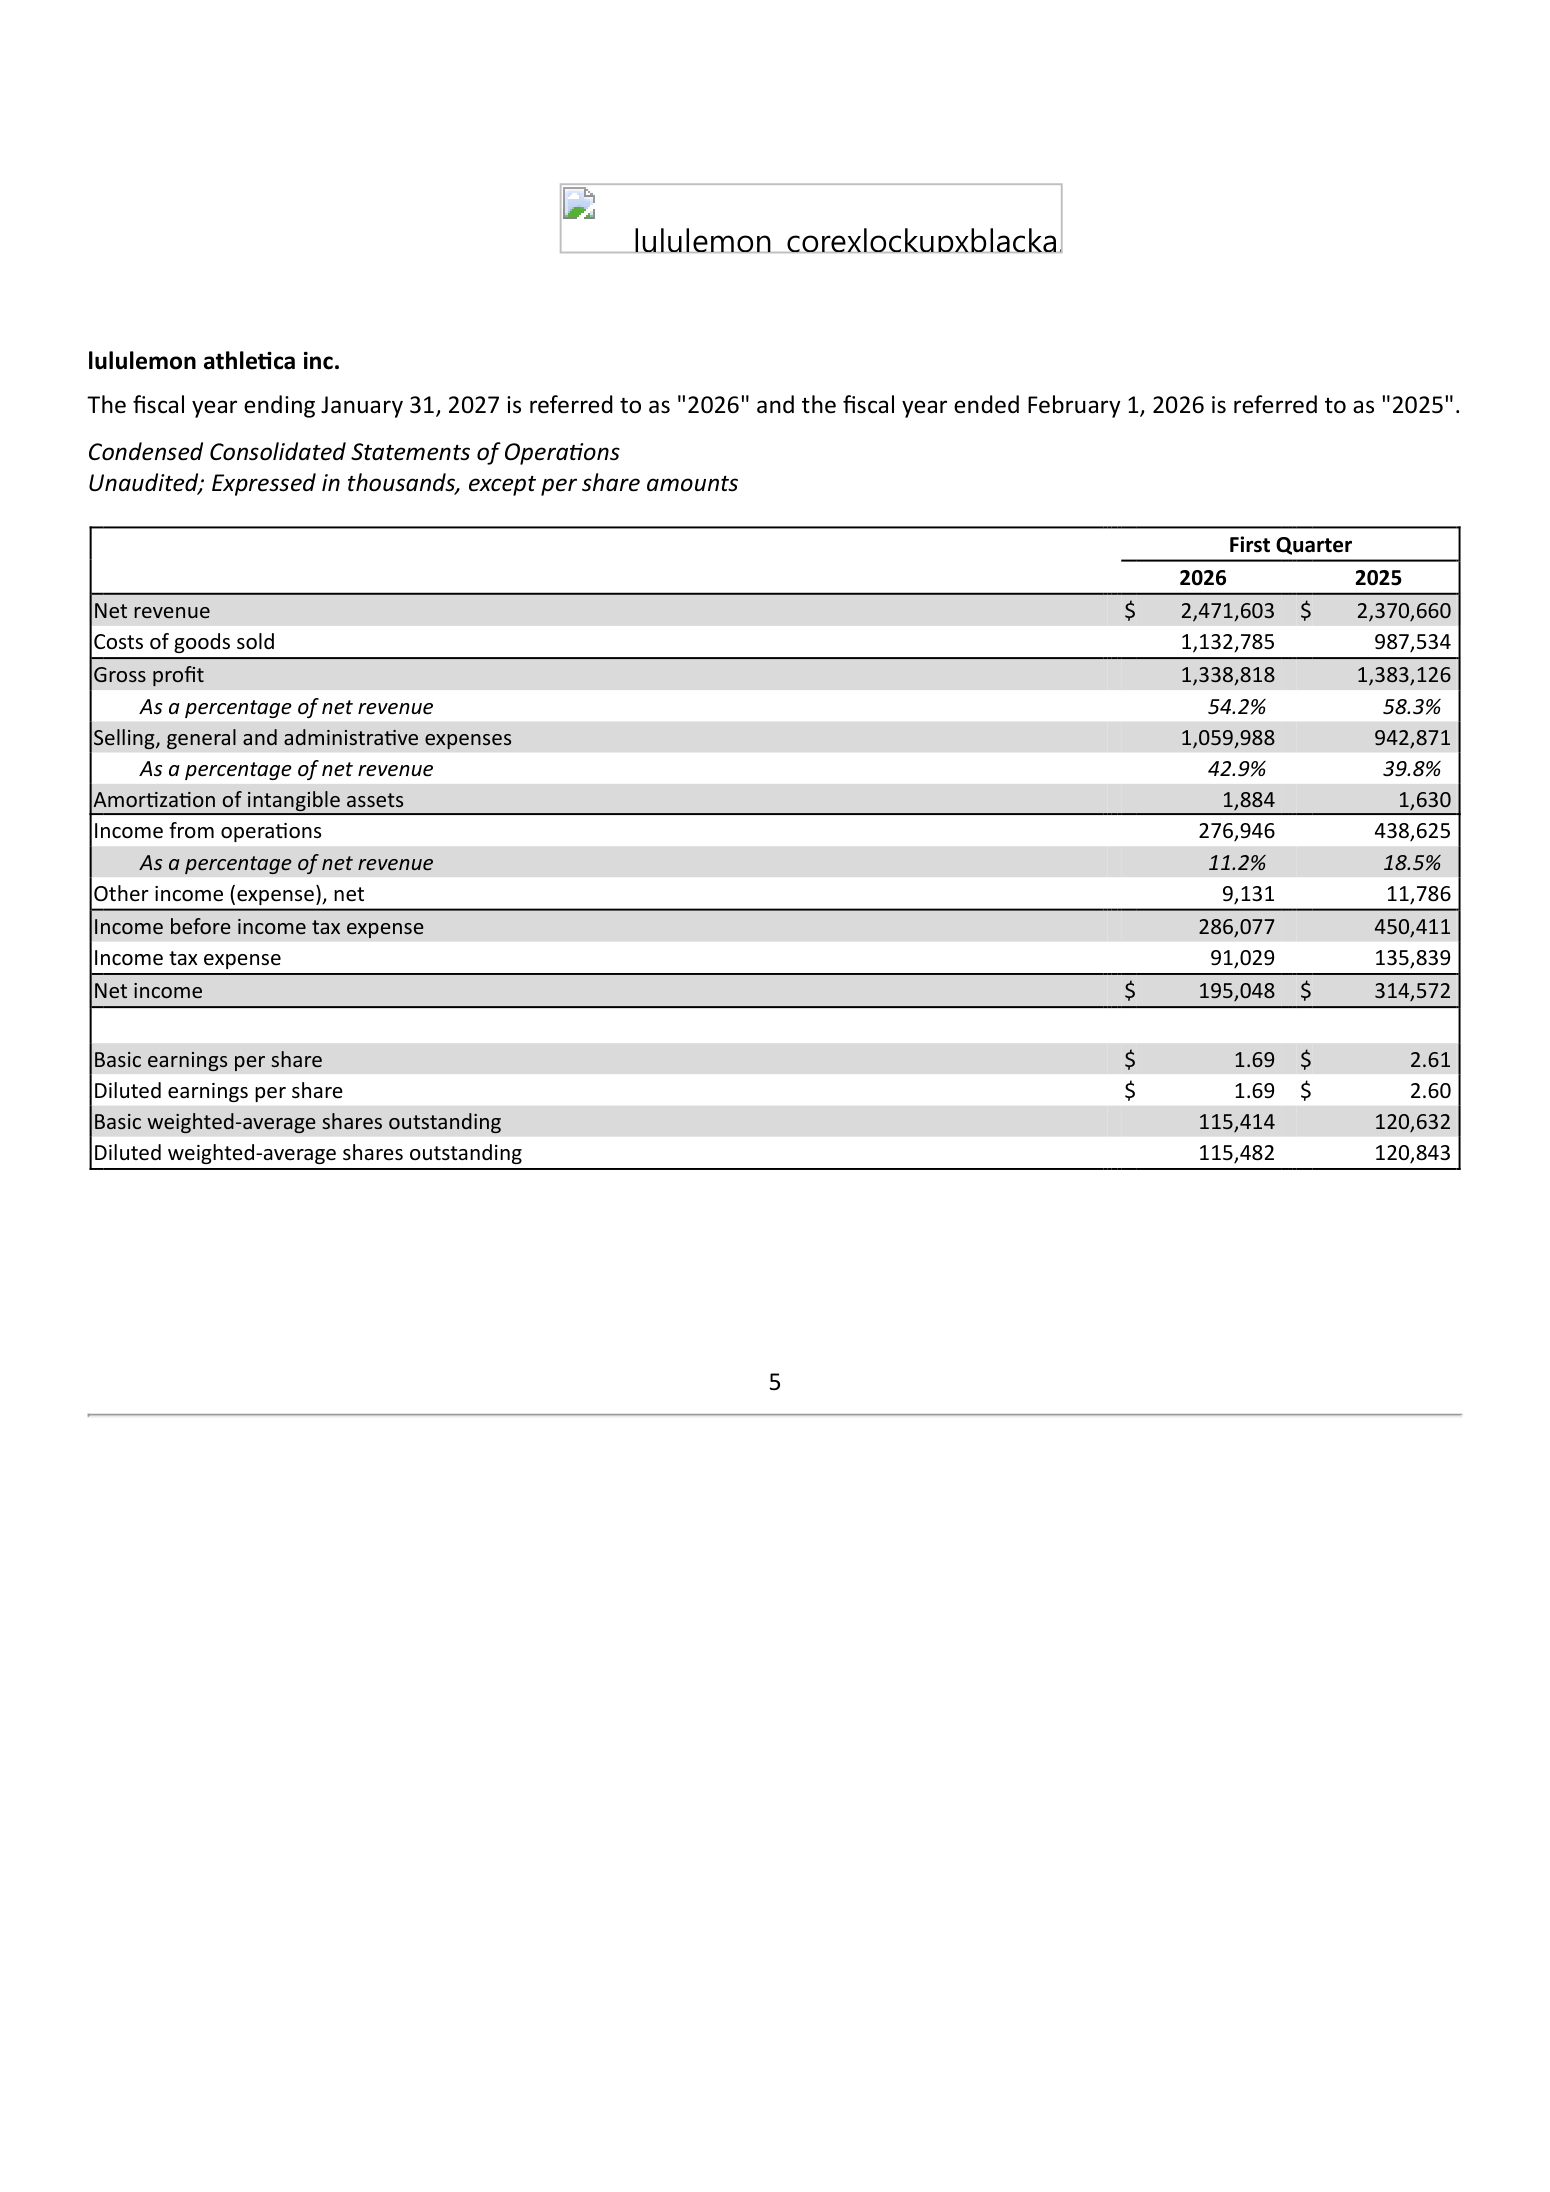
Here is the quarter she was describing. Net revenue of $2,471.6 million, up 4.3% from $2,370.7 million, or up 2% on a constant dollar basis. Cost of goods sold of $1,132.8 million, up 14.7%. That single line is the story: costs grew more than three times faster than sales.
Gross profit fell 3.2% and gross margin dropped 410 basis points to 54.2%. Selling, general and administrative expense rose 12.4% to $1,060.0 million, taking 42.9% of revenue against 39.8% a year earlier. Operating income landed at $276.9 million, down 36.9%, and diluted EPS came in at $1.69 against $2.60.
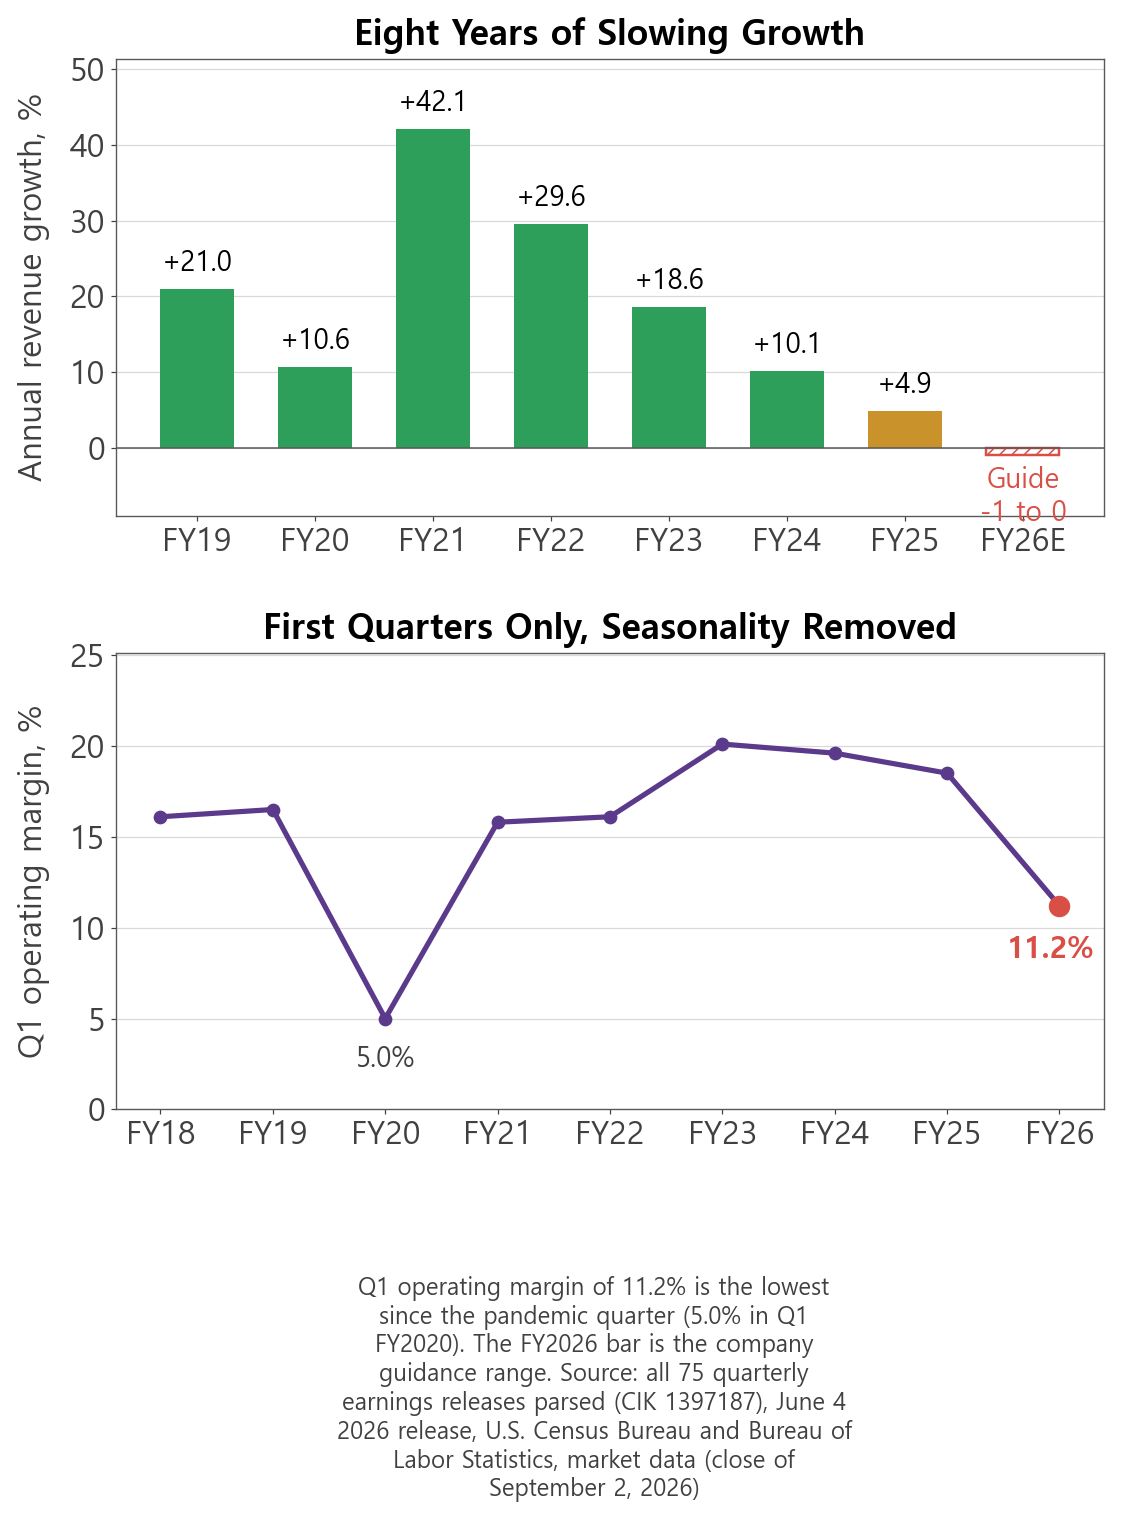
Quarterly margins at this company are seasonal. The fourth quarter carries holiday volume that absorbs fixed cost, so first quarters run lower by design. Line up first quarters only and the picture is cleaner: 20.1% in FY2023, 19.6% in FY2024, 18.5% in FY2025, and 11.2% now. The only first quarter below this one was FY2020, at 5.0%, when the stores were closed.
lululemon (LULU) annual revenue growth and first-quarter operating margin
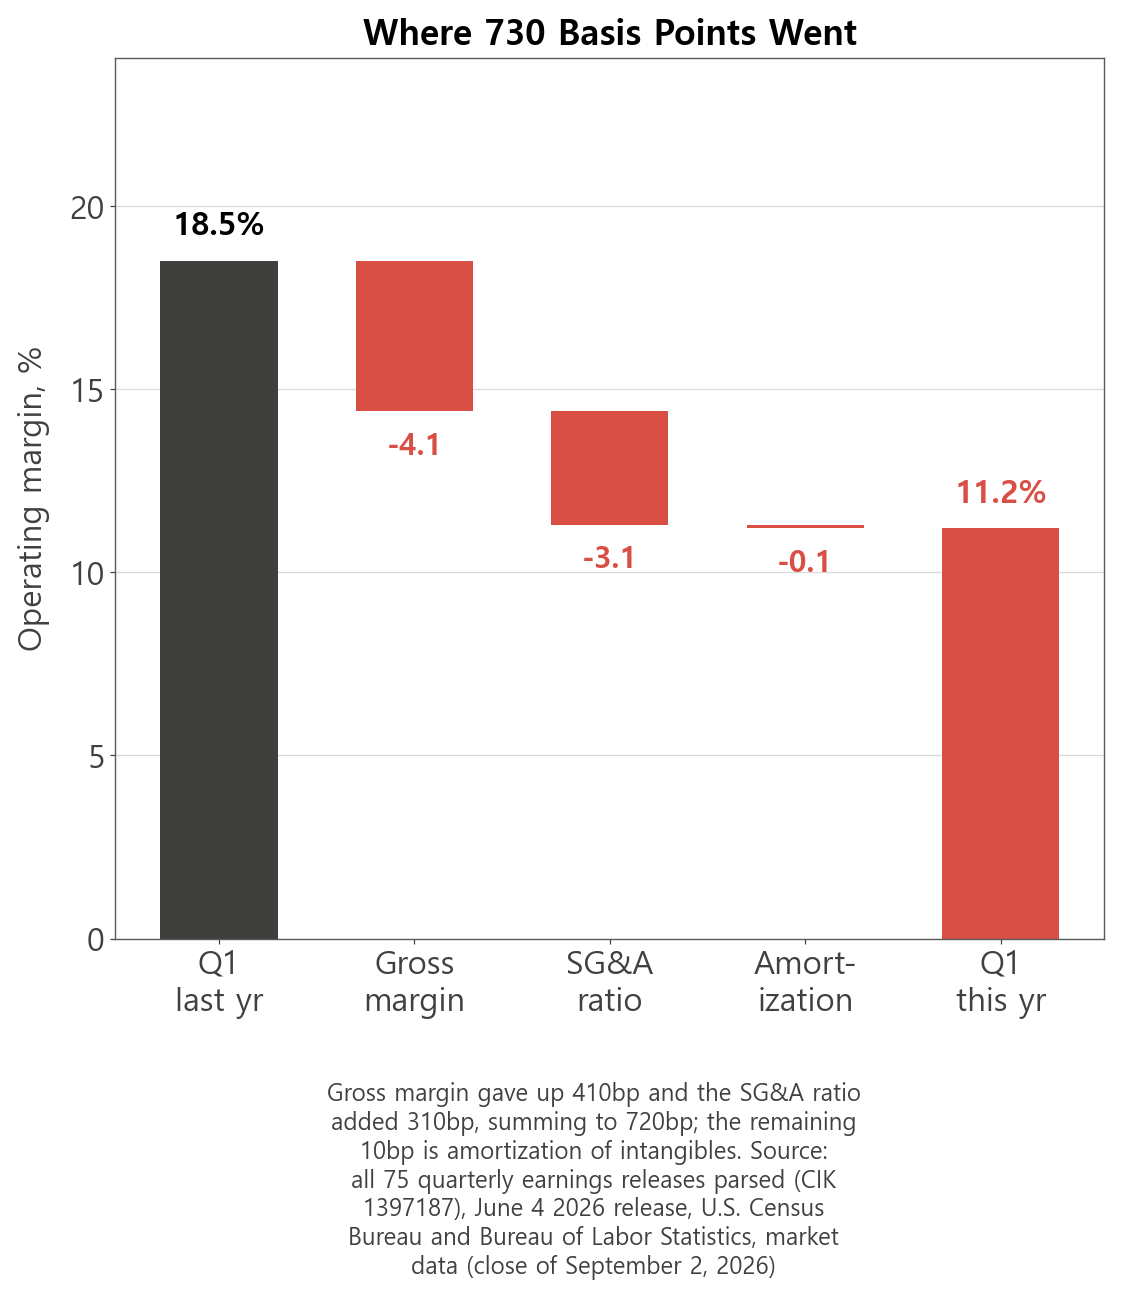
Where lululemon's 730 Basis Points of Operating Margin Went
The decline splits cleanly using nothing but the company's own income statement. Gross margin gave up 410 basis points. SG&A as a share of revenue added 310. Those two sum to 720, and the remaining 10 basis points are amortization of intangibles. Three pieces, exactly 730.
The two large pieces are not the same kind of cost. Gross margin is what it costs to make and import the product. SG&A is what it costs to run stores, employ people, and market to them. The first is set largely outside the company. The second is set inside it.
Start with the first. Revenue grew 4.3% while cost of goods sold grew 14.7%. Either the same goods cost more to bring in, or they sold for less, or both. The company gave one useful clue: inventory rose 2% in dollars but fell 4% in units. Fewer items carried at a higher book value means unit cost went up.
The second piece behaves differently. The $117.1 million increase in SG&A is money spent opening stores and entering markets. The company opened 11 stores and closed 6 in the quarter, ending at 816. International revenue grew 22% in the same period. Those two facts are the same decision seen from two sides.
lululemon designs technical apparel built around yoga and running and sells it through its own stores and its own website. Wholesale is a small share of the mix and permanent discount channels are essentially absent. That structure is the backbone of the company's economics. With no intermediary taking a cut, gross margin runs thick; in exchange, the company carries the full cost of opening and staffing every store itself. A gross margin in the high 50s and an SG&A ratio in the high 30s are two consequences of the same choice.
The product line started with women's leggings and tops and widened into men's, footwear, and sport-specific lines across running, tennis, and training. The company said it delivered product capsules and brand activations across those three categories during the quarter. The earnings release does not break out revenue by product line, so region and channel are as far as the disclosure goes.
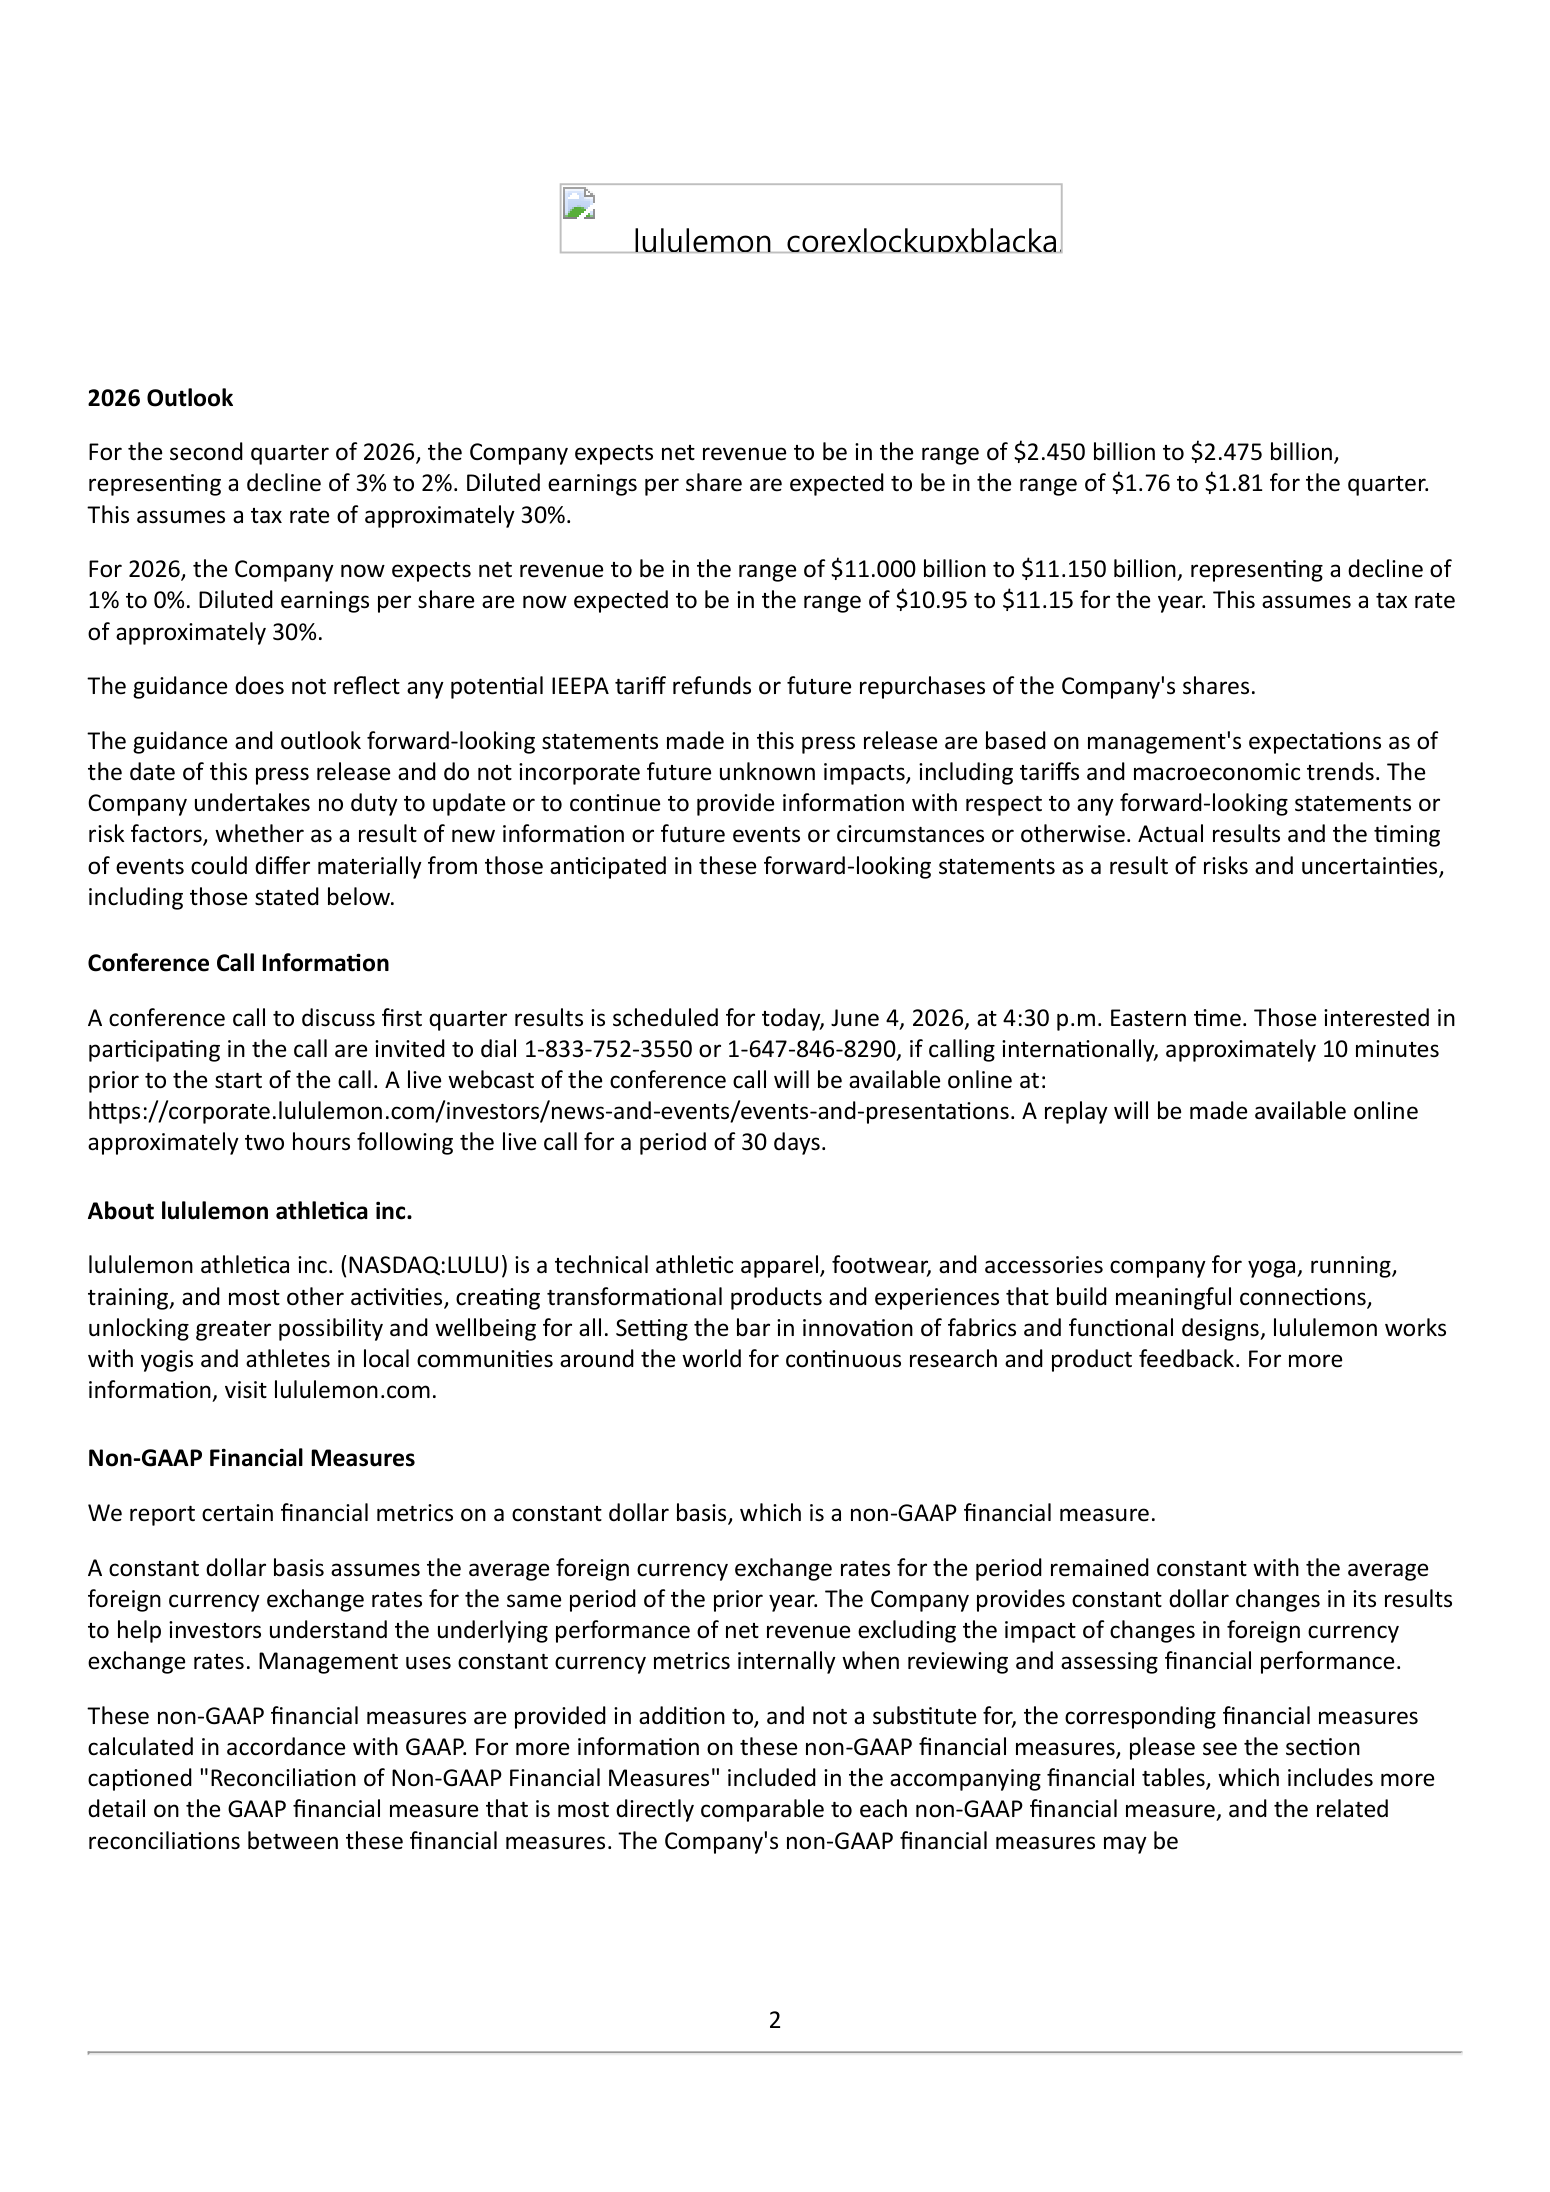
lululemon (LULU) Q1 fiscal 2026 earnings release, first page
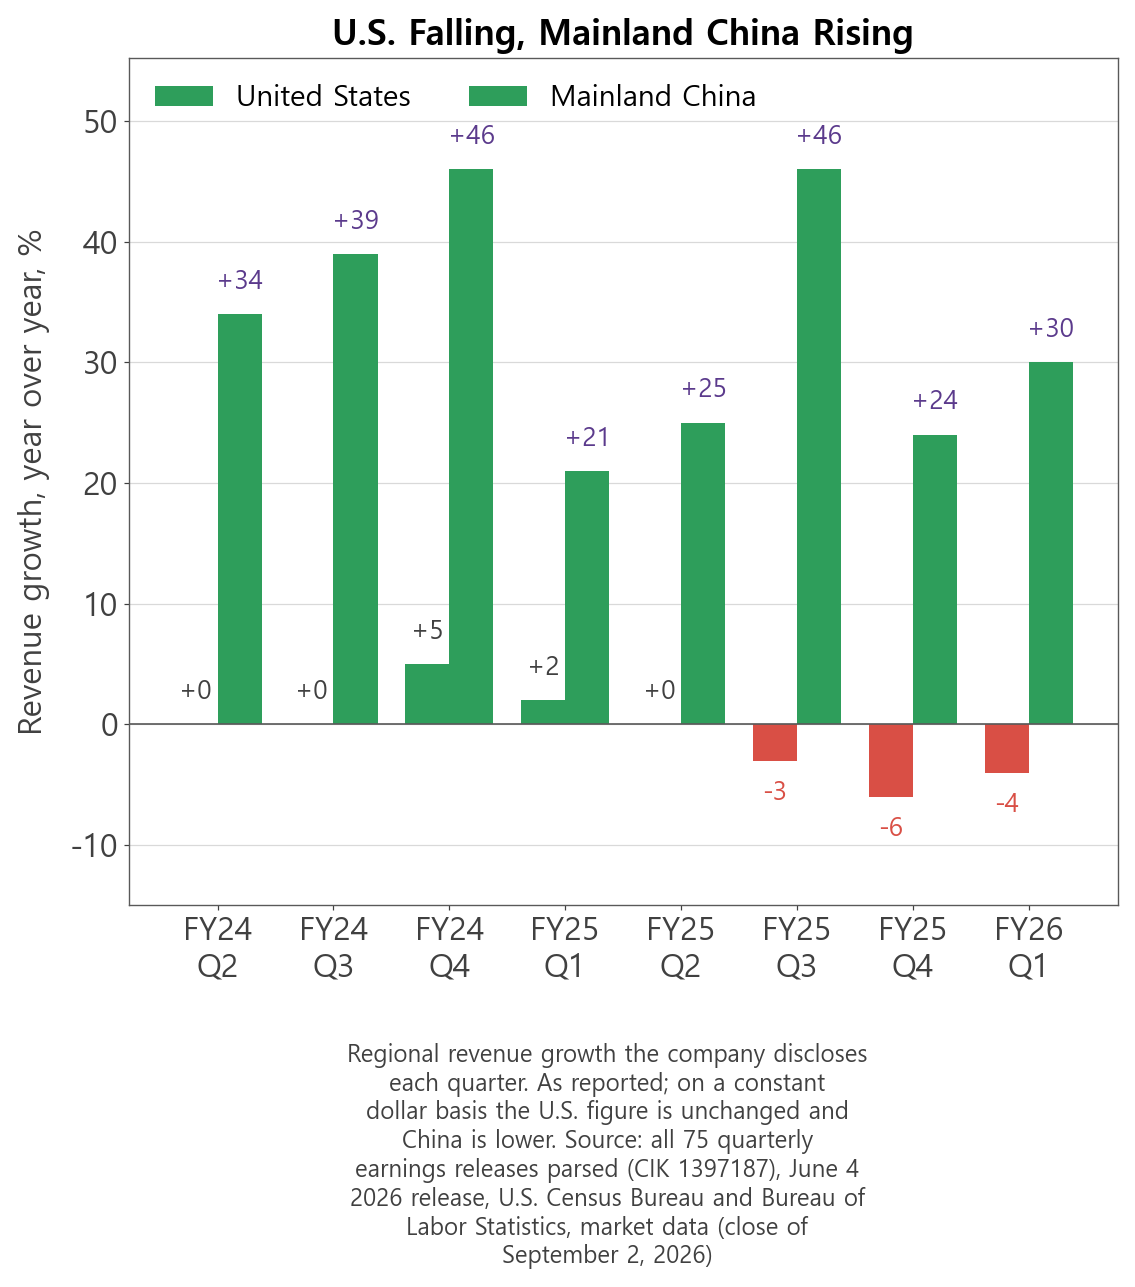
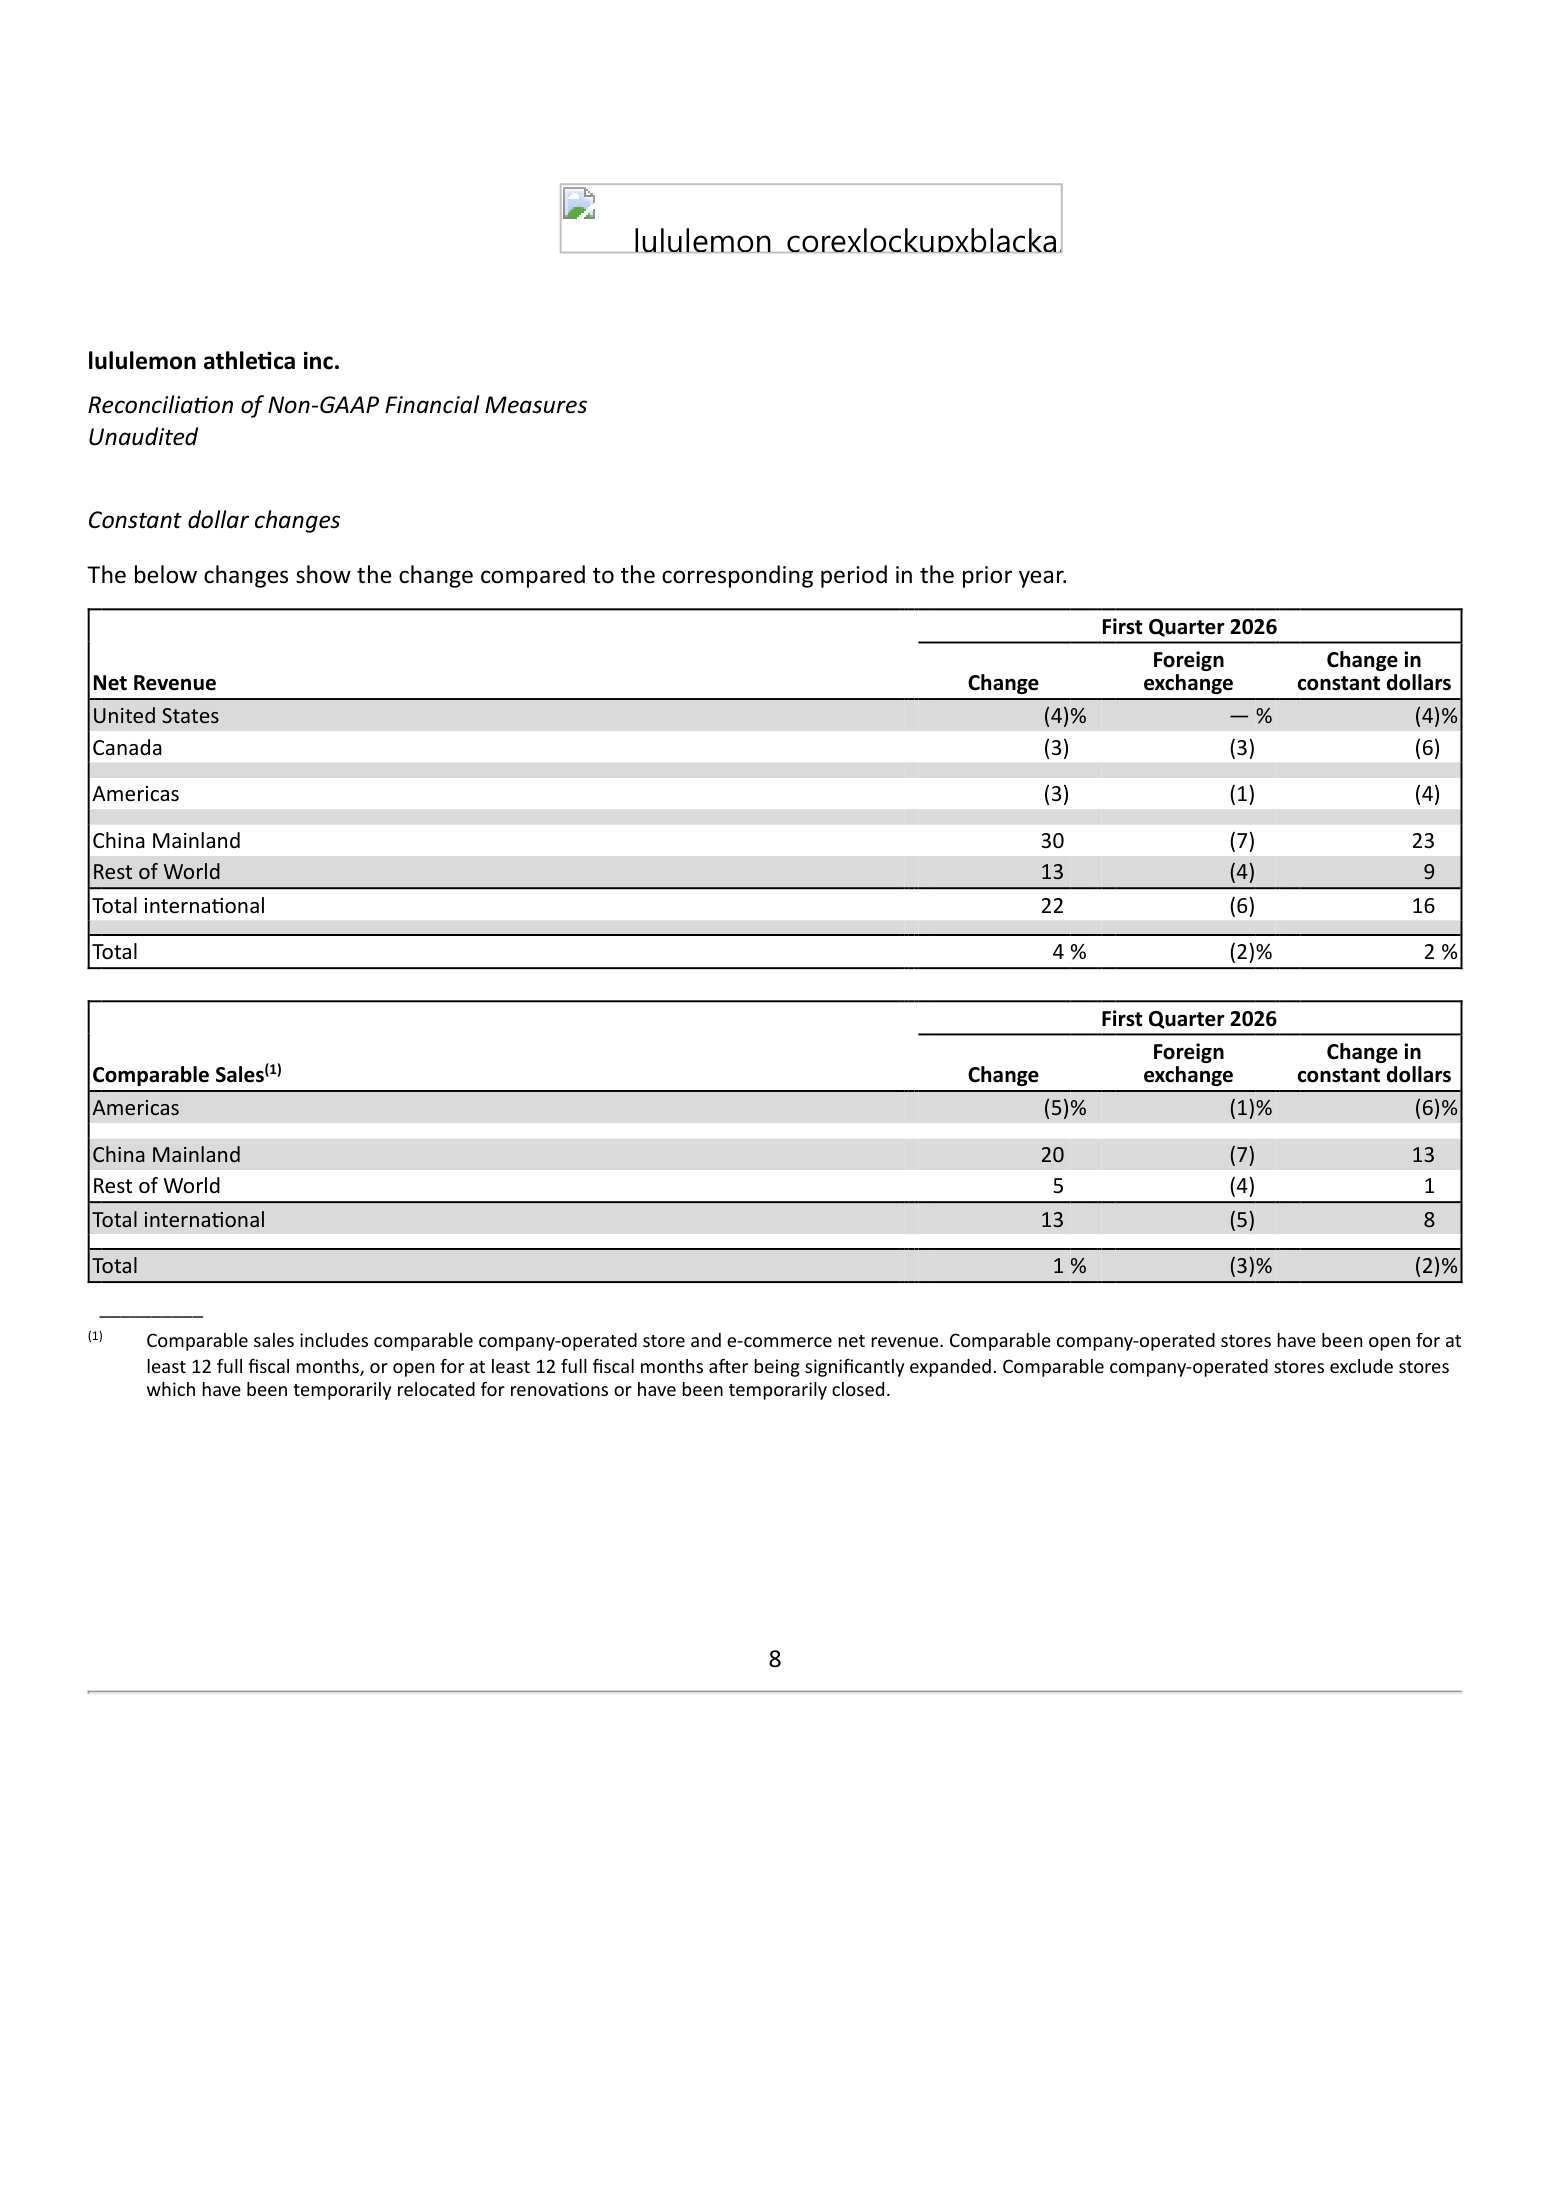
Regionally the split runs Americas and International, with International separating Mainland China from the rest. This quarter the United States fell 4%, Canada fell 3%, Mainland China grew 30%, and the rest of International grew 13%. Americas as a whole declined 3% while International grew 22%.
Region
Revenue change
FX effect
Constant dollar
United States
-4%
0pp
-4%
Canada
-3%
-3pp
-6%
Mainland China
+30%
-7pp
+23%
Rest of world
+13%
-4pp
+9%
Total
+4%
-2pp
+2%
Source: constant dollar supplement, Q1 fiscal 2026 earnings release. The company isolates the currency effect itself.
Strip out currency and Mainland China's growth falls from 30% to 23%, and the company total from 4% to 2%. That is why the supplement exists. A weaker dollar makes foreign revenue look larger in the accounts, and that effect is indistinguishable from the business actually improving. The U.S. business carries no such tailwind, which narrows the gap between the two regions somewhat. It does not change the direction of the U.S. number.
Store Count Tells You Something the Revenue Line Does Not
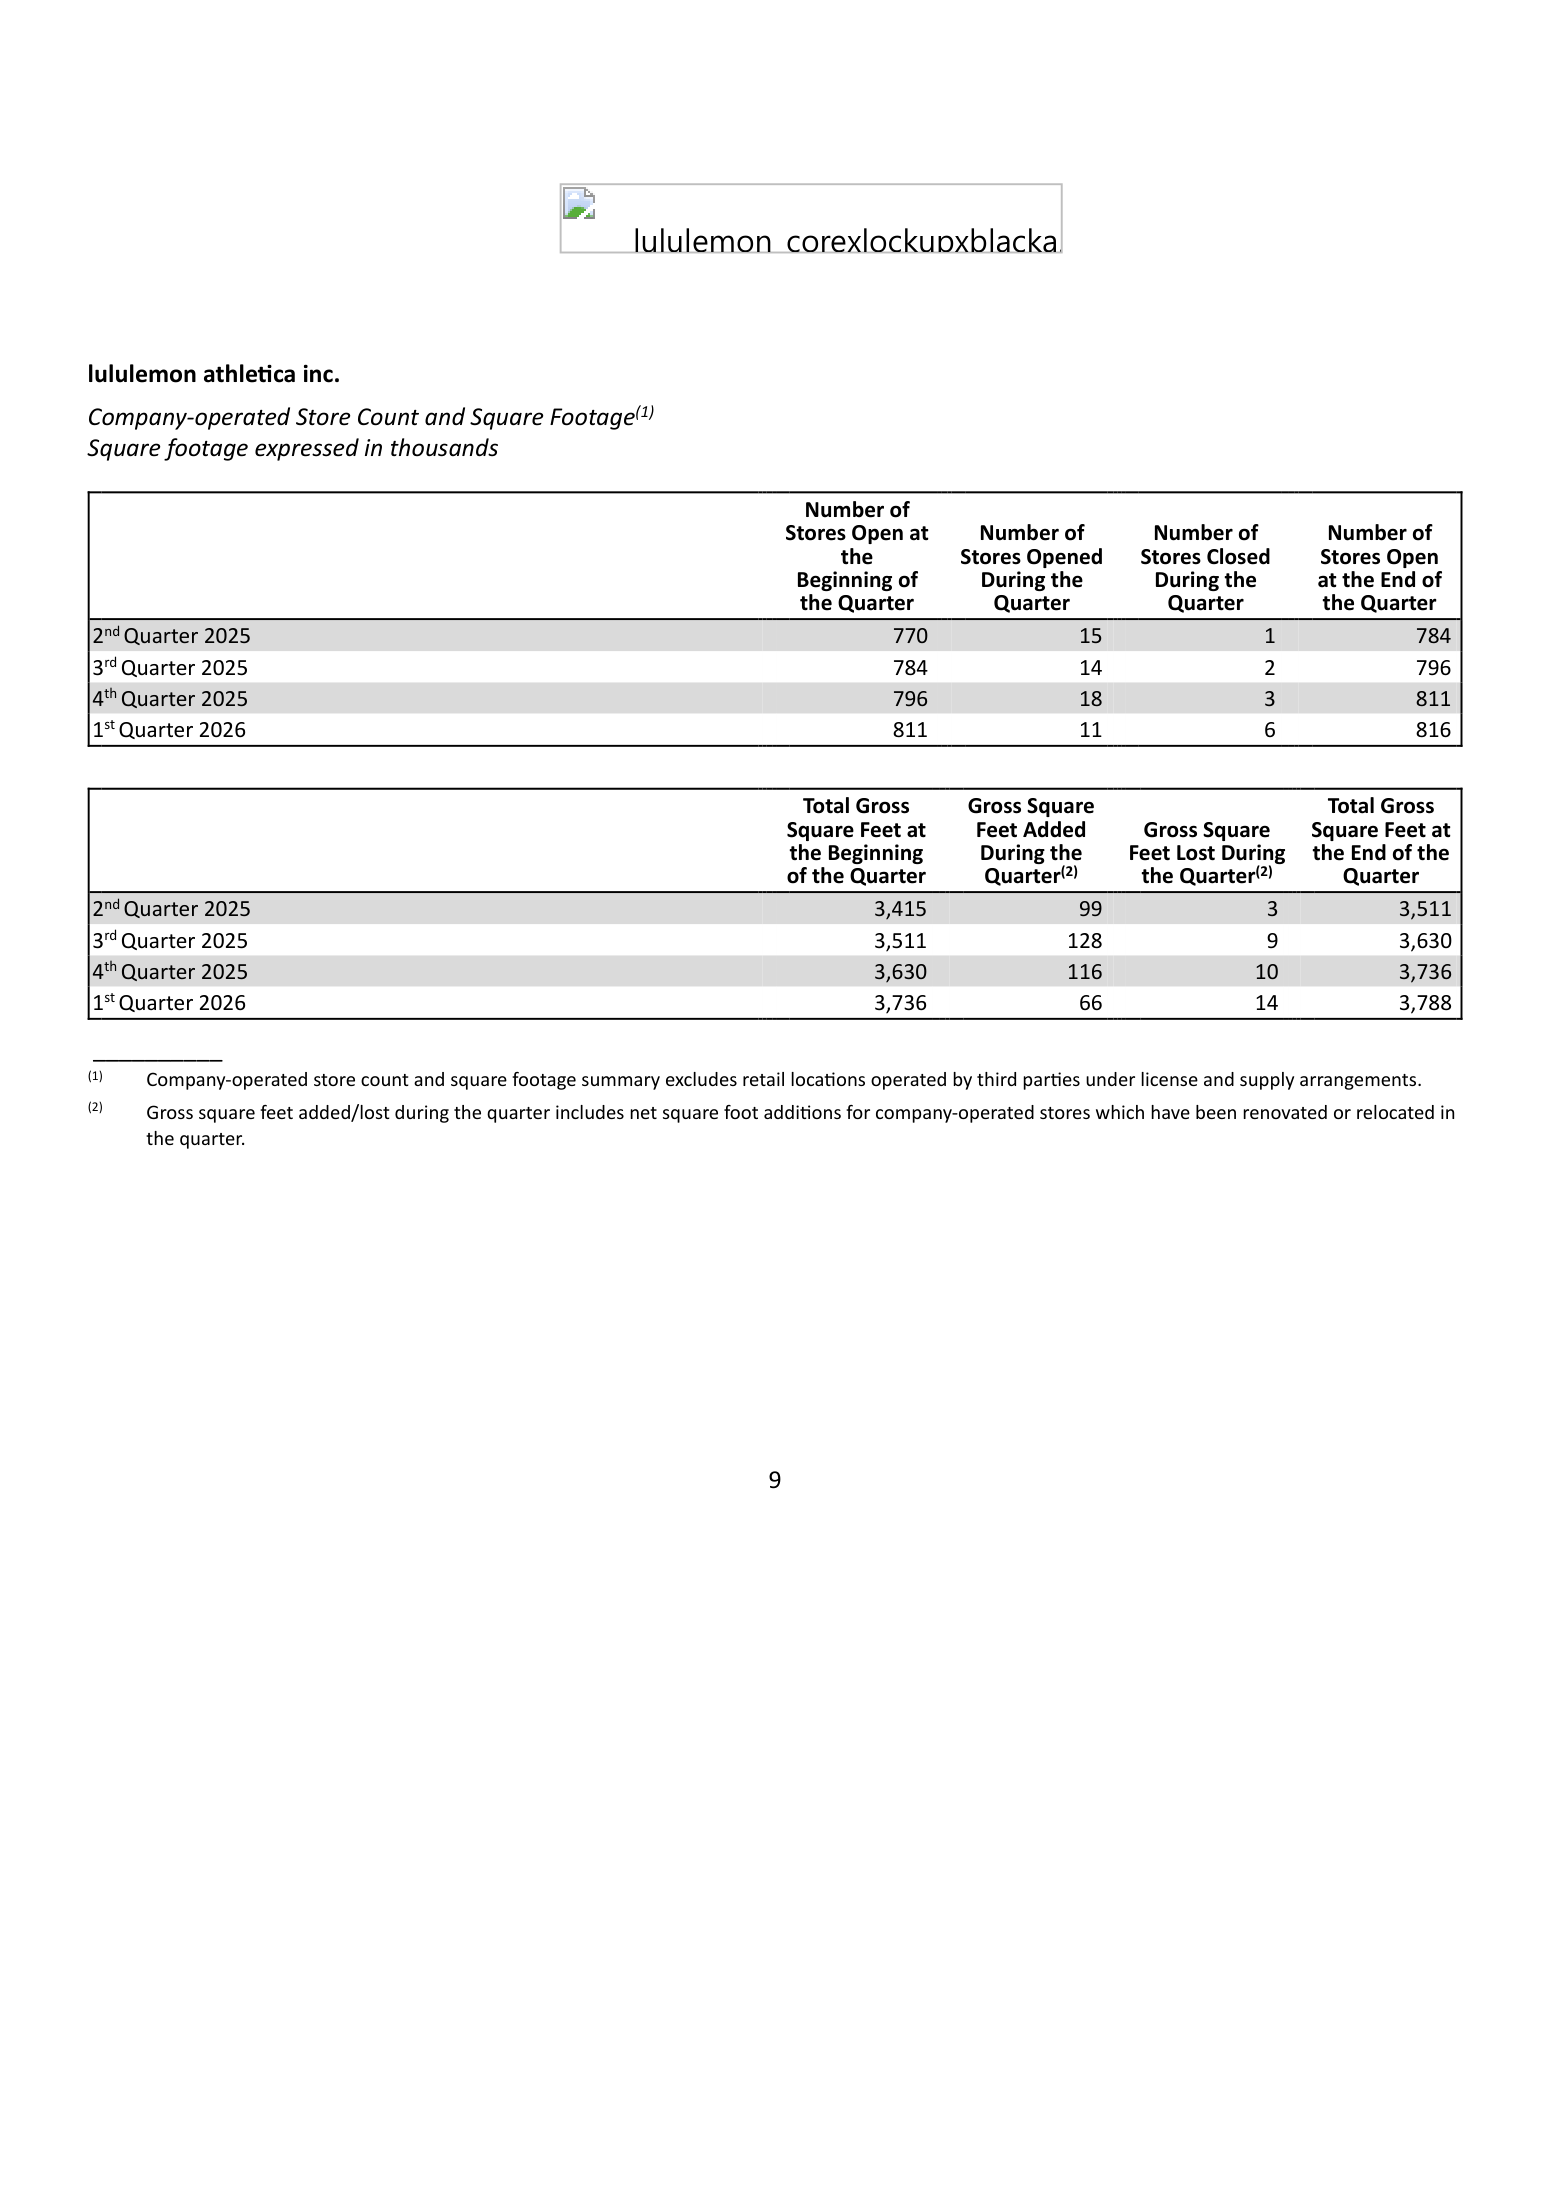
Store count went from 770 in Q2 FY2025 to 816 now, a gain of 46 across four quarters, with square footage rising alongside it. The pace held at 11 to 18 openings and 1 to 6 closures per quarter.
lululemon (LULU) quarterly store count and square footage (June 4, 2026 release)
The detail worth pausing on: this quarter had 6 closures, the most in four quarters, and 11 openings, the fewest. Net additions came to 5 against 15 in the prior quarter. This is not a company shrinking its fleet. It is a company that has started slowing how fast it grows one.
That matters because a new store adds to regional revenue immediately but stays out of comparable sales for twelve months. The gap between those two figures measures how much the established business has softened.
U.S. Sales Have Stalled While China Fills the Gap
Laid out across eight quarters the direction is unmistakable. U.S. revenue growth went +5% in Q4 FY2024, then +2%, 0%, -3%, -6%, and -4% now. Mainland China over the same stretch: +46%, +21%, +25%, +46%, +24%, +30%.
lululemon (LULU) revenue growth: United States versus Mainland China
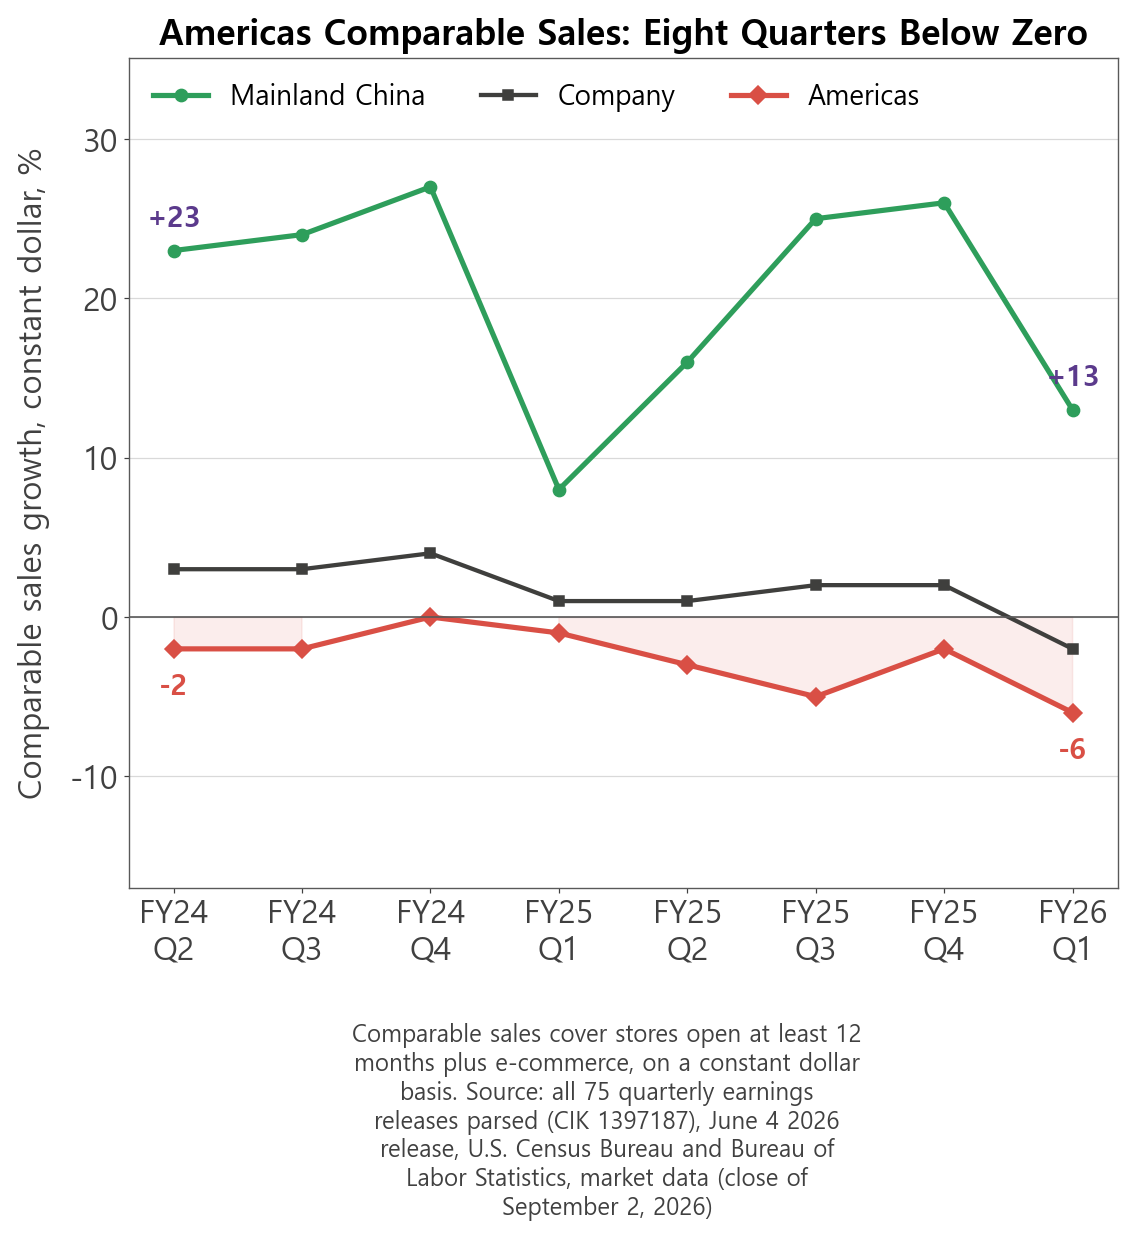
Comparable sales sharpen it further. On a constant dollar basis, Americas comparable sales have failed to clear zero for eight consecutive quarters and sit at -6% this quarter. New stores held regional revenue up. Inside the stores that were already open, nothing improved.
Mainland China absorbed the difference, with one caveat attached. China comparable sales came in at +20% as reported but +13% in constant dollars. Currency contributed seven percentage points, which makes the growth look larger than the underlying business delivered.
lululemon (LULU) comparable sales growth by region, constant dollar
When Tariffs Entered lululemon's Earnings Language
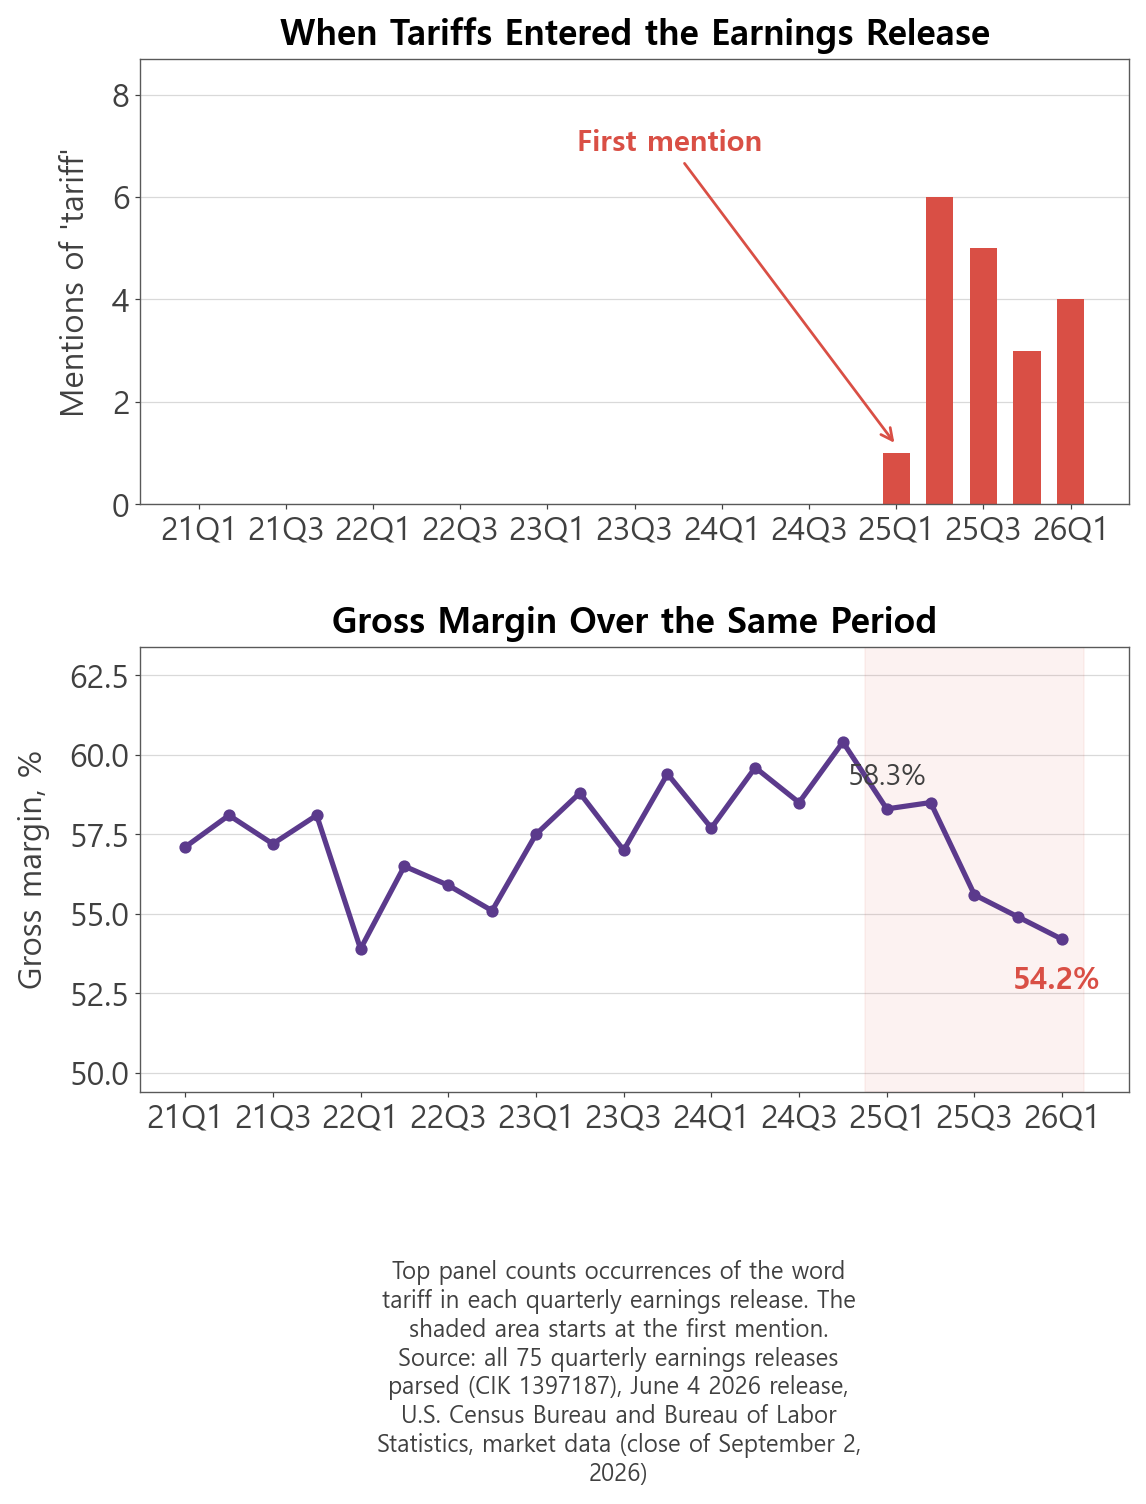
I downloaded all 75 quarterly earnings releases this company has filed since 2007 and counted words. "Tariff" first appears in the release dated June 5, 2025. Across the twenty quarters before it, spanning 2020 through early 2025, the word does not appear once.
Mentions of tariff in lululemon (LULU) earnings releases and gross margin over the same period
After that it keeps appearing: six times, five, three, and four. Gross margin over the same five quarters ran 58.3%, 58.5%, 55.6%, 54.9%, and 54.2%. The point at which the word entered and the point at which the margin turned are the same point.
Counting a word does not establish causation, so look at what the company wrote instead. The guidance paragraph carries this qualifier: the outlook "does not reflect any potential IEEPA tariff refunds or future repurchases of the Company's shares." A refund implies a payment already made, and management has separated the possibility of getting it back from everything else in the forecast.
lululemon (LULU) constant dollar revenue and comparable sales table (June 4, 2026 release)
Tariffs are not the whole of the margin decline. The 310 basis points of SG&A deterioration have nothing to do with them. What the company has not disclosed is how much of the 410 basis points on the gross margin line tariffs account for. That number stays unavailable.
Athletic Apparel Market Outlook
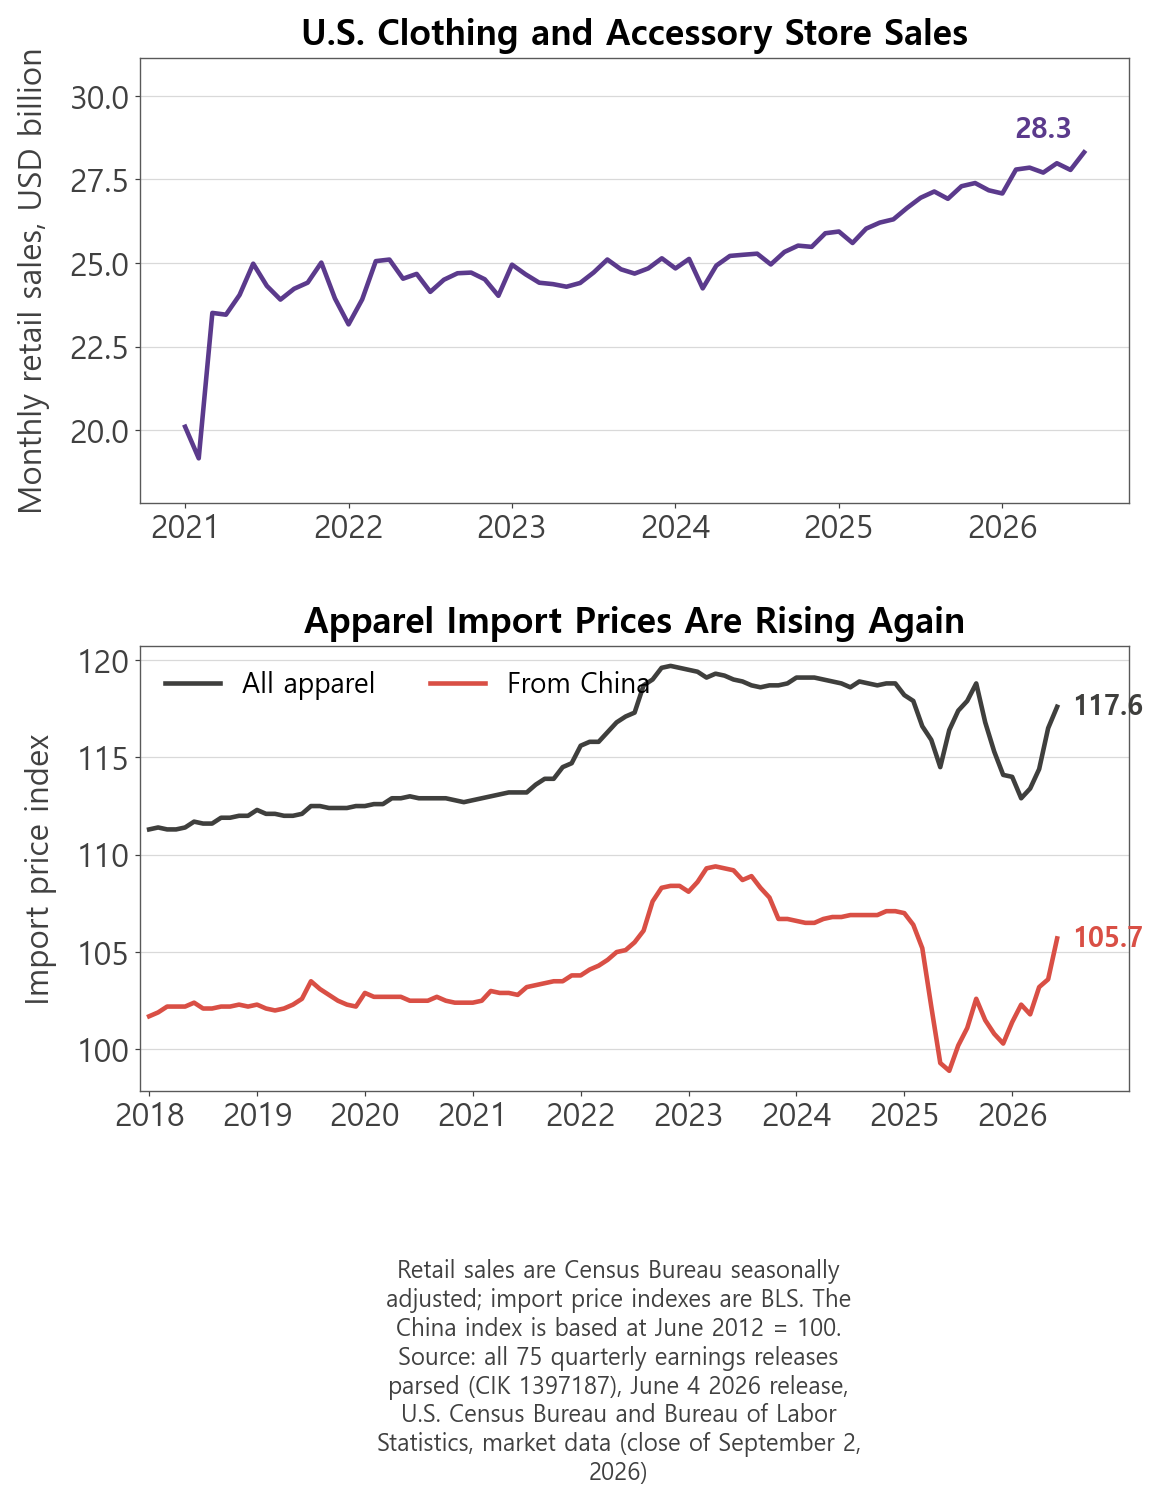
U.S. retail sales at clothing and accessory stores reached $28.31 billion in July 2026. The series has climbed steadily since 2021 with no meaningful break. Americans have not stopped spending on clothes.
U.S. apparel retail sales and apparel import price indexes
So lululemon's three quarters of U.S. decline are not a shrinking market. They are a shrinking share of a market that is still growing. When demand holds and one company moves backward, the explanation sits with the company.
Technical apparel as a category remains in expansion. Work-from-home habits around casual dress, the spread of running and pilates as individual sports, and athletic wear worn as everyday clothing all support demand. The category lululemon largely created is now densely populated with competitors.
Import Prices Are Rising Again
The Bureau of Labor Statistics apparel import price index bottomed in mid-2025 and has climbed to 117.6 as of July 2026. The index for apparel imported from China moved from below 99 to 105.7 over the same period. Rising import costs are an industry condition, not a lululemon condition.
This matters for a specific reason. Nearly all of this industry manufactures in Asia and imports into the United States. Higher import prices raise cost of goods, and a brand that cannot pass that through absorbs it in gross margin. A company like lululemon, which rarely discounts, actually has a harder time raising list prices. Holding full price is the brand asset, and moving that price is the thing customers notice first.
U.S. duties on apparel already sit at the high end of manufactured goods. Additional tariffs imposed under the International Emergency Economic Powers Act in 2025 changed the import cost structure again, and the legal challenges to that authority are why lululemon wrote a refund clause into its own outlook. For now, cost pressure in this industry is set more by policy than by any individual company's sourcing leverage.
LULU Valuation vs. Nike, Deckers, On Holding and Gap
Company
P/E
Revenue growth
1-year market cap
lululemon
9.7x
+4.2%
-41.2%
Nike
18.2x
+0.2%
-50.4%
On Holding
19.0x
+18.5%
-36.9%
Deckers
11.8x
+7.9%
-35.7%
Abercrombie & Fitch
11.8x
+4.7%
+36.2%
Gap
6.7x
+1.1%
-5.1%
Source: market data aggregation, September 2, 2026. Revenue is trailing twelve months.
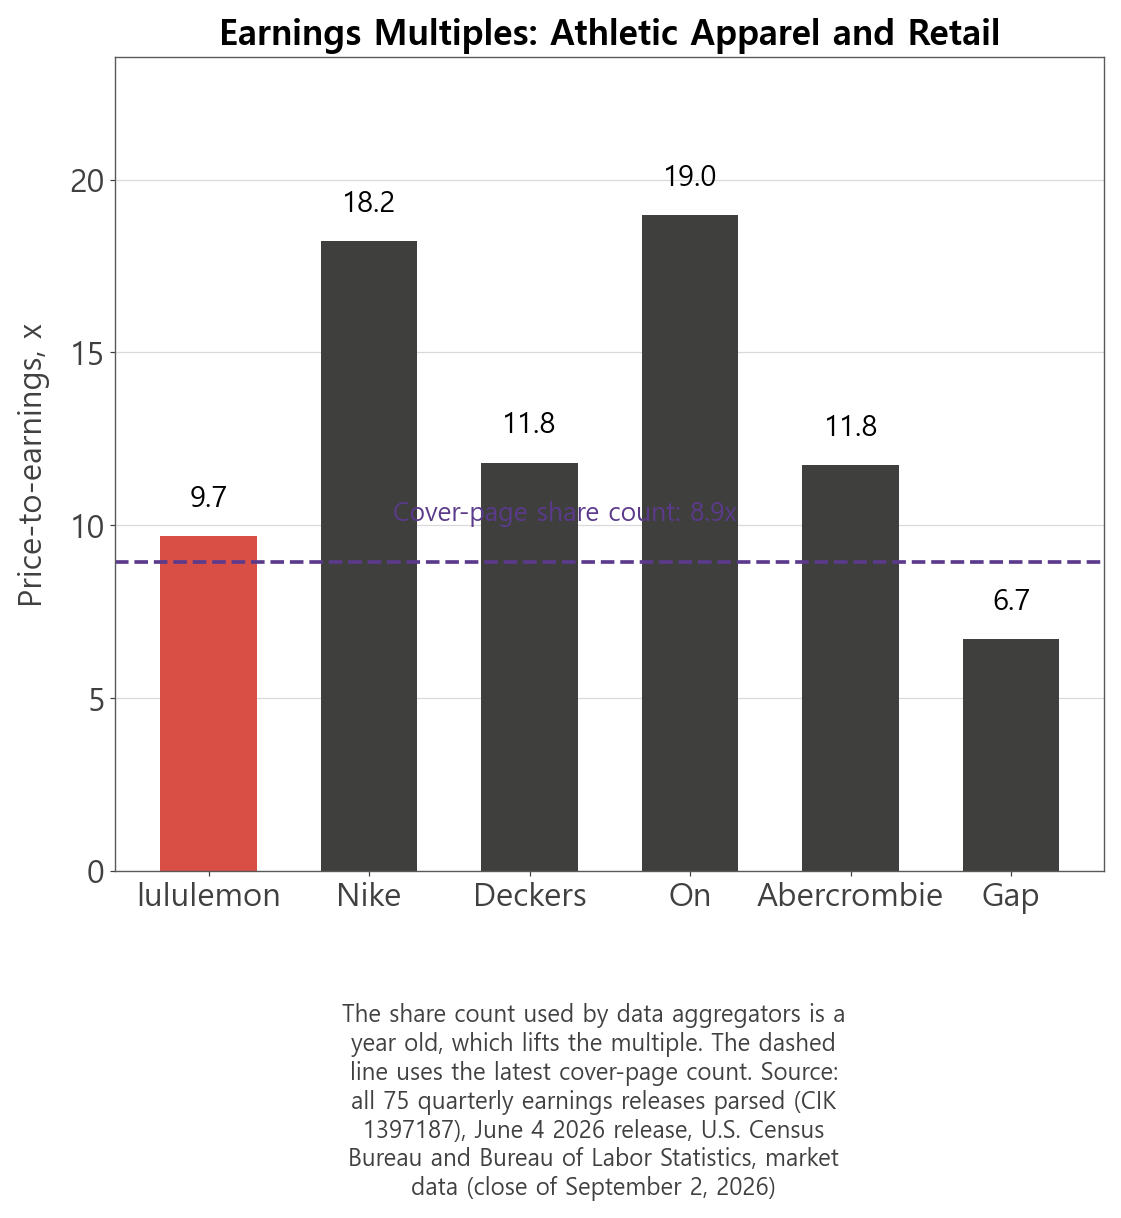
The competitive position is squeezed from both directions. Nike presses from above on scale. On Holding and Alo Yoga press from below into the premium studio-wear position lululemon opened. On Holding grew revenue 18.5% and holds a 19.0x multiple. In the same industry, the spread between a company that still grows and one that has stopped shows up directly in the multiple.
Price-to-earnings multiples across athletic apparel and apparel retail
Is LULU Stock Cheap? Three Multiples, One Answer
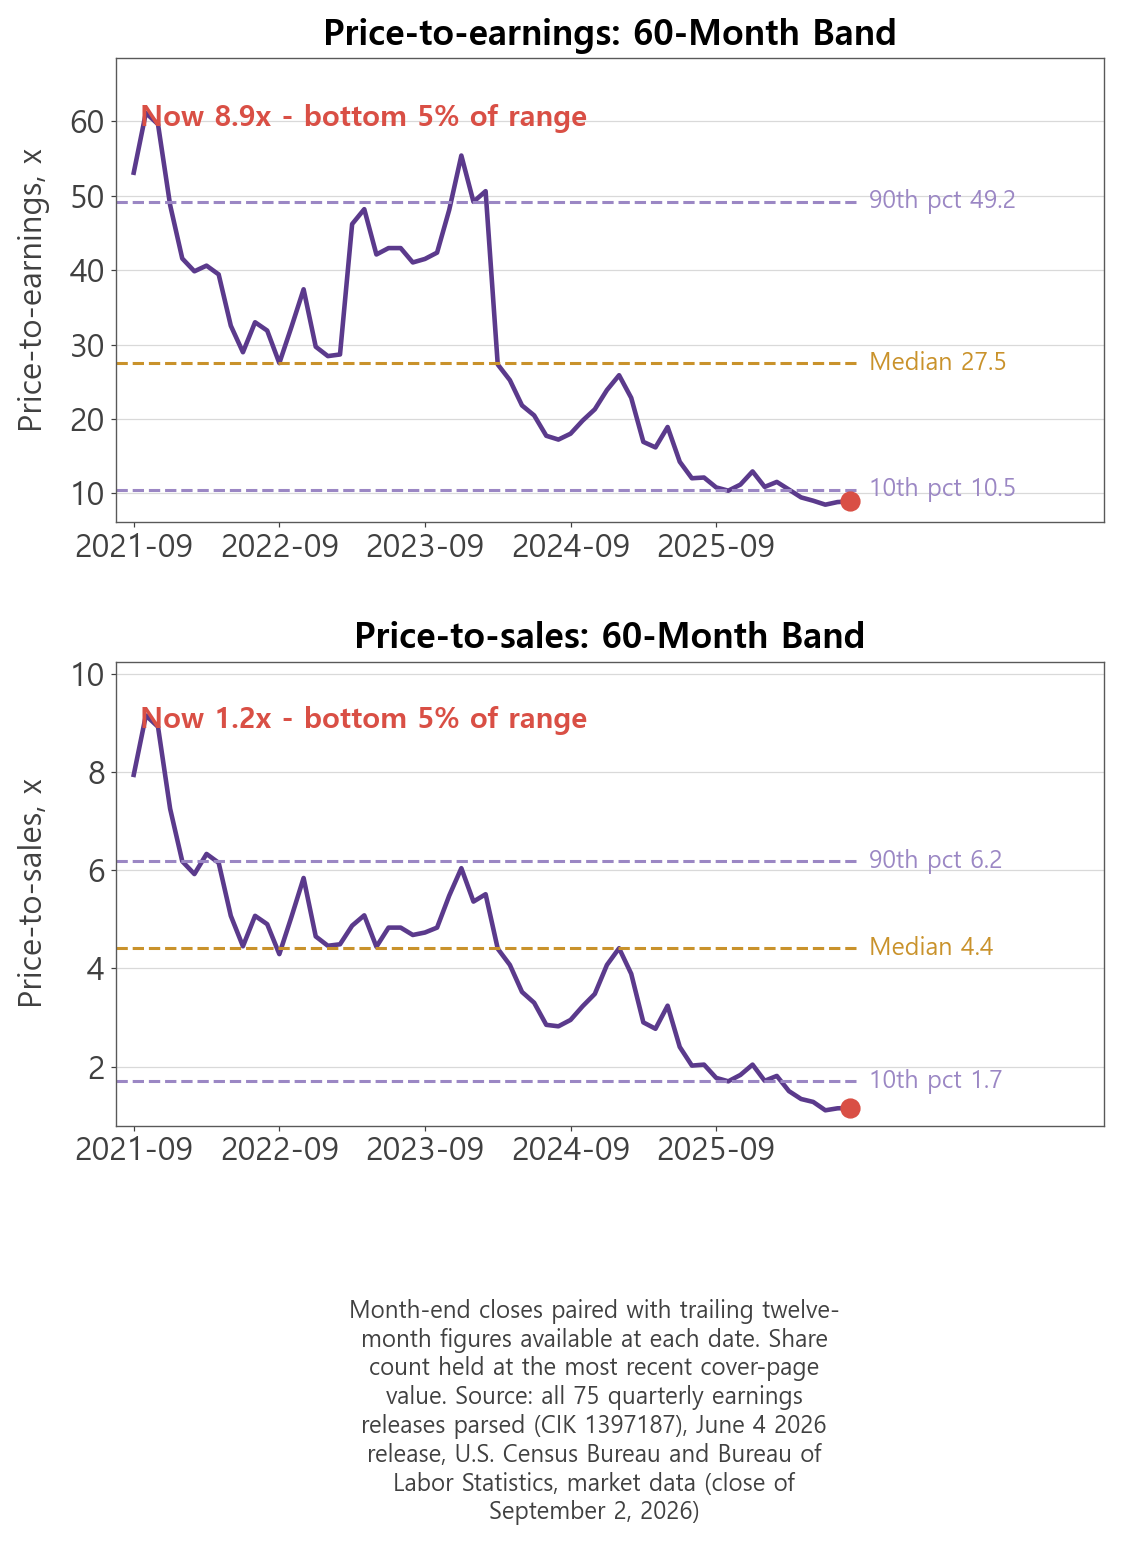
One number needs correcting before any of this means anything. The widely quoted 9.68x P/E uses a share count from a year ago. The company's most recent quarterly report lists 108,437,957 shares on its cover page. Recalculated on that figure the multiple is 8.9x, which sits in the bottom 5% of the last 60 months.
The gap exists because buybacks reduced the share count 5.6% over the year. lululemon repurchased 2.2 million shares for $358.3 million in this quarter alone, so the discrepancy widens from here. On the cover-page count, market capitalization is $13.02 billion.
Multiple
Current
60-month median
Position in range
Price to earnings
8.9x
27.5x
bottom 5%
Price to sales
1.2x
4.4x
bottom 5%
Price to book
2.7x
10.9x
bottom 5%
Based on the September 2, 2026 close of $120.07.
All three land in the bottom 5% of the five-year range. Widen the window to ten years and they fall to the bottom 2.5%. The market has withdrawn the growth multiple it once applied to this company.
lululemon (LULU) price-to-earnings and price-to-sales 60-month bands
The judgment splits here. If the margin decline is tariffs and early-stage expansion cost, today's multiple is too low, because the denominator recovers. If eight quarters of negative Americas comparable sales reflect something about the brand itself, then 8.9x is not cheap. It is a multiple applied to earnings that have not finished falling.
Thirty-four analysts carry an average price target of $127.35 and a consensus rating of Hold. The low sits at $88 and the high at $280. A spread of more than three times is what a market looks like when it has not settled the question.
What to Watch in the Next Filing
Second quarter revenue guidance is $2.450 billion to $2.475 billion, a decline of 3% to 2%. Full-year guidance is $11.000 billion to $11.150 billion, which the company described as a decline of 1% to flat. Divided against last year's $11.103 billion the arithmetic gives -0.9% to +0.4%, so the company rounded its upper bound to zero.
Across eight years the revenue growth line steps down without interruption: +21.0% in FY2019, +42.1% in FY2021, +18.6% in FY2023, +10.1% in FY2024, +4.9% in FY2025. This guidance is the first time a decline has entered the range. Full-year EPS guidance of $10.95 to $11.15 follows $14.70 in FY2024 and $13.30 in FY2025, a second consecutive year moving backward.
lululemon (LULU) second quarter and full year fiscal 2026 outlook (June 4, 2026 release)
Three indicators decide which reading of the multiple turns out right.
First, whether Americas comparable sales clear zero. Growth built by opening stores is not the same as growth from stores already open, and only the second one counts as a recovery.
Second, whether gross margin stabilizes in the 54% range or continues down. If tariffs are part of the cause, the next quarter shows the level at which the cost settles.
Third, when the interim leadership arrangement resolves. Meghan Frank and André Maestrini currently serve as Interim Co-CEOs. On August 13 the Chief AI and Technology Officer departed, and in June the board expanded from nine to eleven members under a cooperation agreement with founder Chip Wilson. André Maestrini's own framing was that "we have more work to do." Numbers produced during a leadership transition tend to get re-based by whoever arrives next.
Second quarter results are expected in the first days of September. The company has not confirmed a date in a filing, so the three indicators above matter more than the calendar.
Financial figures come from lululemon athletica's SEC filings under CIK 1397187. I parsed all 75 quarterly earnings releases the company has filed as 8-K exhibits since 2007, which produced the margin series across 69 quarters, the regional and comparable sales series across 8 quarters, and the tariff word count across 24 quarters. Balance sheet and share count figures come from XBRL company facts and the cover page of the most recent Form 10-Q.
Trailing twelve month revenue and net income were assembled from consecutive quarterly releases and cross-checked against aggregated market data, matching at $11.20 billion and $1.46 billion. Valuation multiples use 119 month-end closes paired with the trailing figures publicly available at each date, with share count held at the cover-page value of 108,437,957. Industry series are from the U.S. Census Bureau and the Bureau of Labor Statistics.
This is analysis of public disclosures, not investment advice. Last updated: September 3, 2026.