
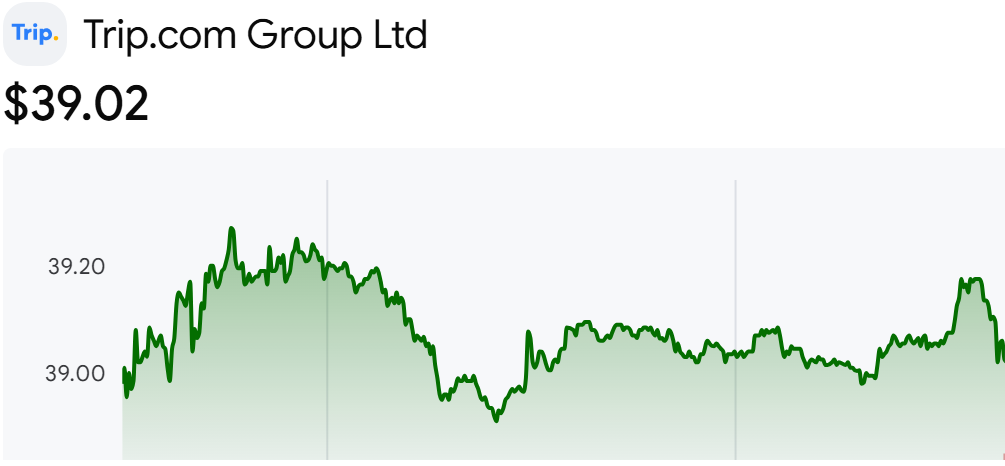
- Trip.com Group Limited (NASDAQ: TCOM, HKEX: 9961) runs Ctrip, Qunar, Trip.com and Skyscanner, and earns commissions on hotel, flight, rail, package tour and corporate travel bookings. Net revenue was RMB 62.41 billion in 2025, each ADS equals one Hong Kong ordinary share, and at $39.02 the company is worth about $24.57 billion. This TCOM stock analysis covers the Chinese antitrust penalty and what it found, the stake sale buried in trailing earnings, net cash against market cap, the cut to the Q2 revenue outlook, P/E and P/B bands, analyst price targets, peers, and the conditions that would move the shares.
- Here is the puzzle. On July 25 China's State Administration for Market Regulation (SAMR) ordered Trip.com to refund RMB 122 million of hotel deposits, confiscated RMB 1.66 billion of gains and imposed a RMB 3.52 billion fine. The RMB 5.30 billion total is 3.4% of the roughly $23.1 billion of market value lost since the investigation was announced in January. The stock rose when the penalty filing came out (+2.6%), then kept sliding, and it now sits -48.4% below the $75.68 close of January 13, the last session before the probe was disclosed.
- Two limits up front. Trip.com reports in renminbi and trades in dollars, so I converted every multiple at month-end USD/CNY rates. As a foreign private issuer it files quarterly 6-K earnings releases rather than 10-Qs, and I parsed all 24 of them. Trailing GAAP net income includes a large gain from selling part of the MakeMyTrip stake in the third quarter of 2025, and the share count of 629.7 million is an aggregator figure that I cross-checked against the ownership percentages in the 20-F.
- The shares are -14.4% over one month, -17.7% over three months and -46.2% over one year. The latest reported quarter is Q1 2026, released June 24, and the investor relations calendar lists the Q2 2026 earnings call for September 15 (U.S. Eastern Time).
What Does Trip.com Group (TCOM) Do?

- Trip.com is a Chinese travel booking company that listed on Nasdaq in 2003 and grew by bolting on global platforms. The "About" paragraph in every release names four brands: Ctrip, Qunar, Trip.com and Skyscanner. Earnings releases carried a Shanghai dateline through February 2024 and have carried a Singapore dateline since May 2024.
- 2021 changed the listing structure. Trip.com completed a secondary listing in Hong Kong in April, and on March 18 it subdivided each ordinary share into eight so that one ADS equals one share. Releases before that date show per-share figures on the old basis, so the bands in this article scale those share counts by eight.
- Through 2022 the business lived under pandemic controls. Three of the four quarters of 2022 posted operating losses and full-year operating income was RMB 88 million. Once China reopened, Q1 2023 revenue reached RMB 9.21 billion, 2.2 times the year-earlier quarter, and 2023 operating income jumped to RMB 11.32 billion.
- The events since then came from capital allocation and regulators. In July 2025 Trip.com sold 34.37 million MakeMyTrip shares back to that company for about $3.0 billion, and in August it authorized a $5 billion buyback. On January 14, 2026 it disclosed the antitrust investigation, and on July 25 it received the penalty decision.
| Year | What happened | Source |
| 2003 | Listed on Nasdaq | 6-K release boilerplate |
| 2021 | Listed in Hong Kong and split each share into eight | 6-K (Apr), release note (effective Mar 18) |
| 2022 | Posted operating losses in three of four quarters | 6-K earnings releases |
| 2023 | Q1 revenue reached 2.2 times the prior year | 6-K (Jun) |
| 2024 | Authorized a $300 million buyback under a regular capital return policy | 20-F Item 16E |
| 2025 | Sold part of the MakeMyTrip stake for about $3.0 billion and approved a $5 billion buyback | 20-F, 6-K (Aug) |
| 2026 | Received an antitrust penalty including a RMB 3.52 billion fine | 6-K (Jan, Jul) |
- The five-year financials below come straight from 20-F XBRL data, in millions of renminbi. Debt ratio is total liabilities divided by equity.
| Fiscal year-end | Revenue | Operating income | Net income | Operating margin | Net margin | Debt ratio | ROE |
| Dec 2021 | 20,023.0 | -1,411.0 | -550.0 | -7.0% | -2.7% | 74.2% | -0.5% |
| Dec 2022 | 20,039.0 | 88.0 | 1,403.0 | 0.4% | 7.0% | 70.1% | 1.2% |
| Dec 2023 | 44,510.0 | 11,324.0 | 9,918.0 | 25.4% | 22.3% | 78.7% | 8.1% |
| Dec 2024 | 53,294.0 | 14,177.0 | 17,067.0 | 26.6% | 32.0% | 69.9% | 12.0% |
| Dec 2025 | 62,409.0 | 15,773.0 | 33,294.0 | 25.3% | 53.3% | 55.5% | 19.5% |
- The 53.3% net margin in 2025 is more than twice the 25.3% operating margin. The difference came from outside operations, while the operating margin stayed between 25% and 27% for three straight years.
The Five Biggest Daily Moves in TCOM Stock
- Over the past three years, about 750 trading days, TCOM moved more than 5% in a single session on 37 days. Four of the five largest moves came within a day of a company filing.
| Date | Move | Close ($) | Company filings within a day | Note |
| 2024-09-26 | +11.0% | 51.08 to 56.68 | Baidu ownership amendment (13D/A) the next day | No company release found |
| 2025-02-25 | -11.4% | 64.66 to 57.30 | Q4 2024 results (6-K) | Day after results |
| 2025-08-28 | +14.9% | 65.29 to 75.03 | Q2 2025 results and $5 billion buyback (6-K) | Day after results |
| 2026-01-14 | -17.0% | 75.68 to 62.78 | Antitrust investigation disclosed (6-K) | Same day |
| 2026-06-25 | -12.5% | 46.30 to 40.49 | Q1 2026 results and Q2 outlook (6-K) | Day after results |
- The worst day was January 14. The announcement ran three sentences, ending with "Its business operations remain normal." The second-worst day was June 25, the session after the Q1 release.
- The penalty 6-K on July 27 is not on the list. The stock went from $43.64 to $44.77 that day (+2.6%) and reached $46.00 two sessions later. Investors bid the shares up when the fine was set and sold them hard when the revenue outlook came down.
How Trip.com Makes Money From Hotels and Transport
- Trip.com connects travelers with hotels, airlines and railways and keeps a commission, so revenue captures only its cut, while the full booking value is counted separately as gross bookings. Here is 2025 revenue by segment and Q1 2026 growth.
| Segment | 2025 revenue (RMB m) | Share | Q1 2026 YoY |
| Accommodation reservation | 26,100 | 41.8% | +17.5% |
| Transportation ticketing | 22,489 | 36.0% | +11.7% |
| Packaged tours | 4,688 | 7.5% | +19.3% |
| Corporate travel | 2,829 | 4.5% | +20.4% |
| Others | 6,404 | 10.2% | +33.3% |
- Shares use the RMB 62.51 billion segment total before sales tax. Transportation ticketing was the slowest segment in Q1, and it is the segment tied to rail and air add-on products, where new rules bite first.
- Company disclosure (Q1 2026 earnings call, June 24, 2026): CFO Cindy Wang said Trip.com supports the latest guidance on train ticketing practices, that domestic train ticketing now contributes much less to revenue and profit than it did years ago, and that the near-term effect of optimizing certain rail products and add-on services is partly reflected in the Q2 outlook.
- The international business runs at a different speed. On the same call, management said gross bookings on the international OTA platform grew about +65% and inbound travel bookings about +90% from a year earlier. Trip.com served about 20 million inbound travelers in 2025 and set a goal of 200 million over five years.
- China is still the bulk of the business. Backing into the fine calculation gives a China revenue share of 75.2% in 2025, and in a quarter when international bookings rose about 65%, total revenue grew +17.2%.
Revenue Divided by Gross Bookings
- Trip.com does not report gross bookings every quarter. Management gives an annual or quarterly figure on some earnings calls, and I divided release revenue by those figures.
| Period | Revenue (RMB m) | Gross bookings stated on the call | Revenue / bookings |
| Full year 2024 | 53,294 | over RMB 1.2 trillion | 4.44% or less |
| Full year 2025 | 62,409 | about RMB 1.1 trillion | 5.67% |
| Accommodation 2025 | 26,100 | about RMB 280 billion | 9.32% |
| Transportation 2025 (air bookings) | 22,489 | about RMB 550 billion | 4.09% |
| Q1 2026 | 16,208 | about RMB 300 billion | 5.40% |
- Own calculation (Q4 2024, Q4 2025 and Q1 2026 call transcripts; 6-K revenue): On the Q4 2024 call management said "In 2024, our core OTA businesses achieved a GMV of over RMB1.2 trillion or $169 billion." On the Q4 2025 call it said "For the full year 2025, our core OTA business recorded gross bookings of approximately RMB 1.1 trillion with accommodation and air ticketing contributing around RMB 280 billion and RMB 550 billion, respectively." Revenue over the same period went from RMB 53.29 billion to RMB 62.41 billion.
- Why the stated bookings figure got smaller while revenue grew +17.1% is not explained in any filing. The 2024 wording covers "businesses" and the 2025 wording a single "business," so the scope may have changed, and revenue includes items such as Skyscanner advertising that sit outside bookings. The transportation line also overstates the ratio, because revenue includes rail and bus while the bookings figure covers air tickets only.
- This matters because the second violation in the penalty decision was imposing unreasonable terms. The 20-F says that in September 2025 the Zhengzhou market regulator found Trip.com had been "imposing unreasonable restrictions on the transactions and transaction prices of business operators on the platform through service agreements, transaction rules, and technical means," and required changes to contract terms and its price adjustment tool. If the 9.32% hotel ratio was earned under those terms, the open question is whether it survives the fix.
Is TCOM Stock Cheap at 5.8 Times Earnings?

- On year-end prices, the P/E was lowest at the end of 2025. P/E and P/B are the December values from the monthly calculation, and the dividend yield uses the dividend declared that year.
| Year-end | Year-end price | P/E | P/B | Dividend yield | FCF (RMB m) |
| 2021 | $24.51 | 73.3x | 0.92x | None | 1,905.0 |
| 2022 | $34.25 | Not meaningful (trailing loss) | 1.41x | None | 2,144.0 |
| 2023 | $35.85 | 16.1x | 1.36x | None | 21,398.0 |
| 2024 | $67.30 | 21.0x | 2.36x | None | 19,034.0 |
| 2025 | $74.49 | 11.2x | 1.96x | 0.40% | 13,582.0 |
- The 2022 P/E is blank because the four quarters released by the end of December 2022, Q4 2021 through Q3 2022, added up to a loss. The full-year 2022 profit of RMB 1.40 billion only entered the calculation after the Q4 release in March 2023.
- Own calculation (60 month-end closes, month-end USD/CNY and 24 quarterly 6-K releases): For each month from September 2021 to August 2026 I used the last four quarters of net income attributable to shareholders from releases filed by that month-end, plus that quarter's equity. Share counts before March 2021 were scaled for the eight-for-one subdivision.
- The trailing P/E is 5.77x, below 5.97x at the end of June 2026, the lowest of the 48 profitable months. The median is 20.17x, and the peak was 122.7x in March 2023 just after reopening. P/B is 1.03x, in the 13th percentile of 60 months, against a 1.42x median and a 0.86x low in March 2022.
- Aggregator check (two sell-side research aggregators): One shows a trailing P/E of 5.79x and P/B of 1.04x, within 0.02x of my figures. The other shows 5.93x and 1.07x, a five-year P/E median of 19.90x and a next-twelve-month P/E of 10.31x.
- P/B in the 13th percentile puts the stock back near its 2022 pandemic range. Operating income was close to zero then and the Q1 2026 operating margin is 24.3%, so the denominator is healthier, but equity includes RMB 62.22 billion of goodwill. The P/E needs its denominator explained first.
The Stake Sale Inside Trailing Earnings
- Of trailing twelve-month (TTM) GAAP net income attributable to shareholders of RMB 31.52 billion, a single quarter, Q3 2025, contributed RMB 19.89 billion, or 63.1%. Operating income that quarter was RMB 5.57 billion, and net income the quarter before was RMB 4.85 billion.
- Filing note (Q3 2025 6-K release, November 17, 2025): Trip.com attributed the jump in net income "primarily" to "the partial disposal of certain investment," and said income tax expense rose to RMB 3.3 billion from RMB 721 million a year earlier because of higher taxable income from that disposal and local indirect transfer tax rules.
- Filing note (2025 Form 20-F, Item 4, April 28, 2026): In June 2025 Trip.com agreed "to sell 34,372,221 Class B ordinary shares that we held to MakeMyTrip for an aggregate consideration of approximately US$3.0 billion for cancellation," and the deal closed in July 2025.
- The gain stayed in non-GAAP profit too. Trip.com's non-GAAP adjustments remove share-based compensation and fair value changes on equity securities only, so Q3 2025 non-GAAP net income was also RMB 19.16 billion and TTM non-GAAP net income of RMB 31.56 billion gives almost the same multiple.
- TTM operating income over the same twelve months was RMB 16.16 billion, and market cap divided by that is 10.2x. Dividing the price by the average 2026 EPS estimate of RMB 24.38 gives a forward P/E of 10.7x, so the 5.8x headline rests on a once-off gain.
- Q1 2026 had one-offs in the opposite direction. Equity in loss of affiliates was RMB 1.15 billion, eleven times the RMB 102 million a year earlier, and a RMB 876 million fair value loss cut other income to RMB 176 million. Q1 net income attributable to shareholders of RMB 2.50 billion was smaller than operating income of RMB 3.95 billion.
| Number | Value | Why it matters |
| Total penalty (refund, confiscation, fine) | RMB 5.30 billion | 3.2% of market cap and 3.4% of value lost since January |
| China revenue share implied by the fine | 75.2% | Three quarters of revenue comes from the market that was sanctioned |
| Q2 revenue growth outlook (Q1 was 17.2%) | 3% to 8% | First quarter to show the compliance adjustments in numbers |
| Net cash / market cap | 44.4% | 20.8% after customer advances and payables |
| Q3 2025 share of trailing net income | 63.1% | Most of the 5.8x P/E denominator is a stake sale gain |
What the SAMR Antitrust Penalty Found
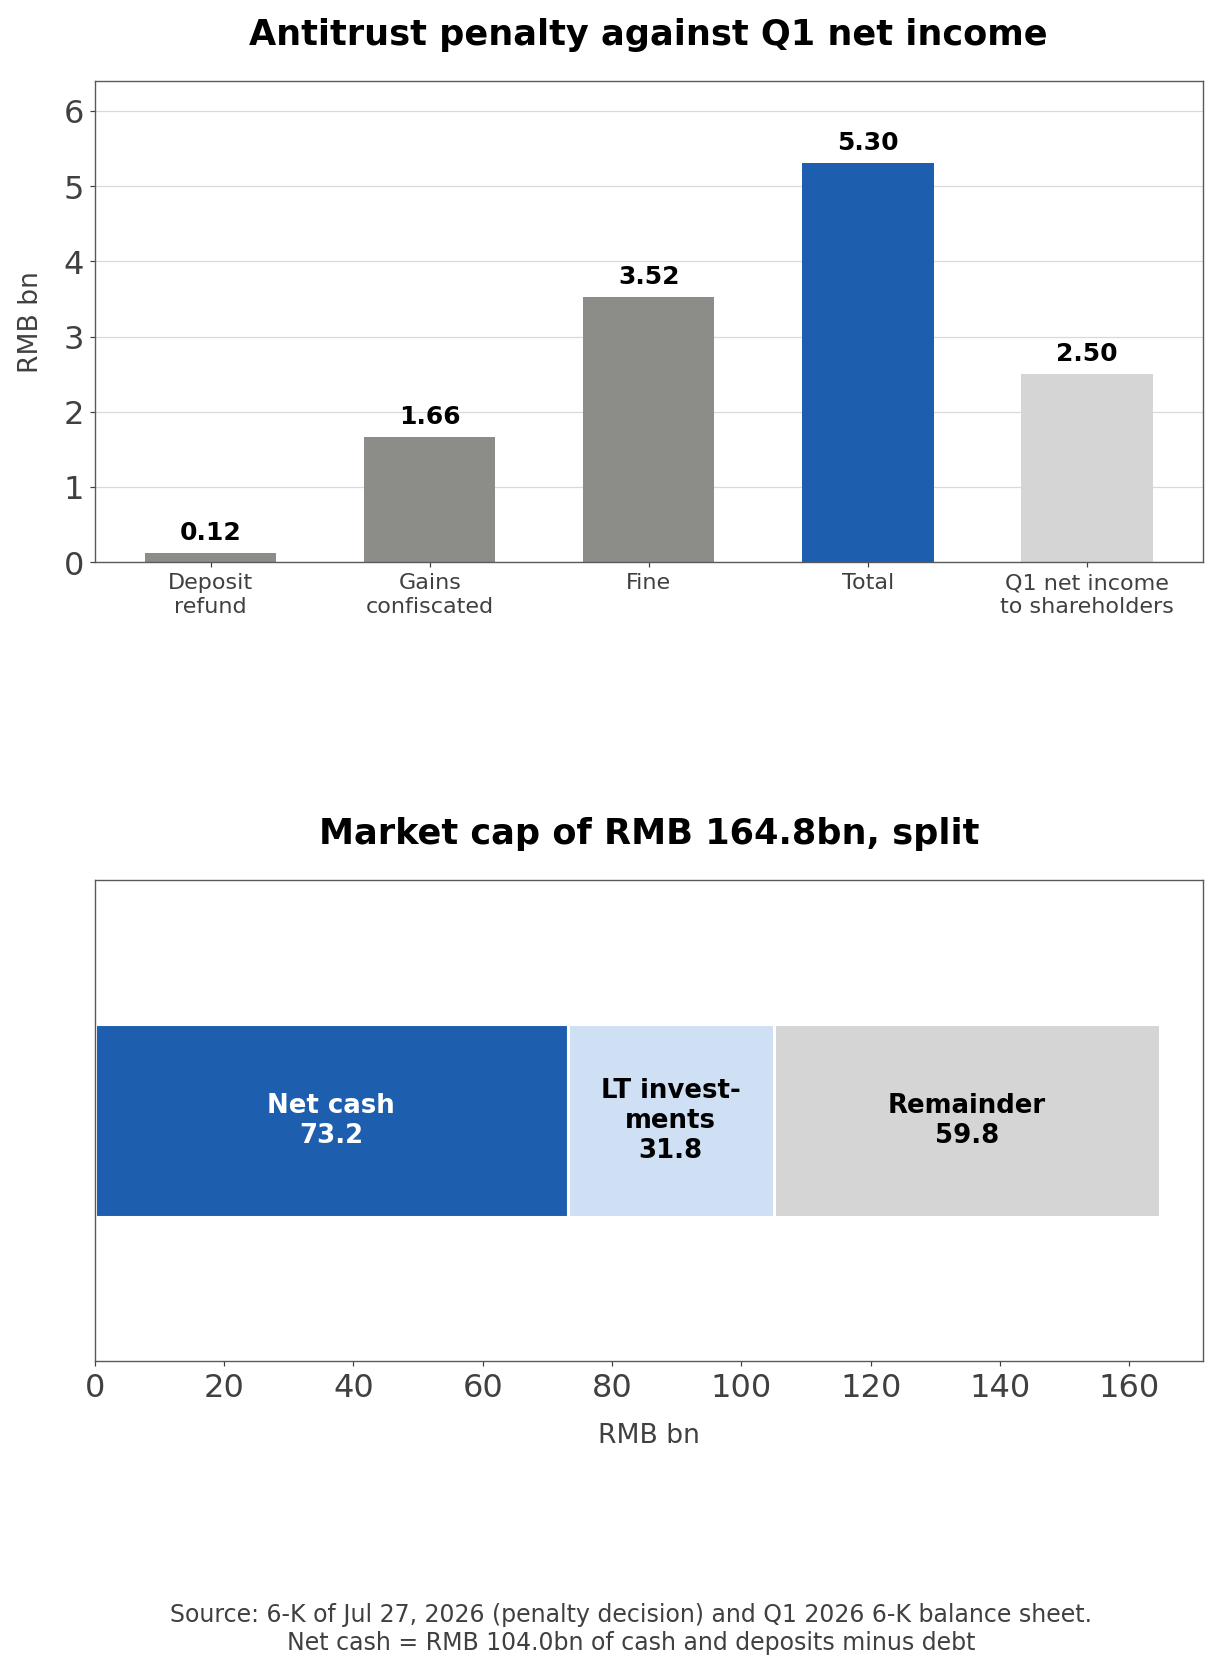
- Filing note (6-K on the administrative penalty decision, filed July 27, 2026): SAMR found that Trip.com violated Article 22(4) and (5) of the Anti-Monopoly Law, which bar a company with a dominant market position "from restricting business counterparties through exclusive arrangements without justifiable cause and from imposing unreasonable terms on transactions without justifiable cause." It ordered Trip.com to stop, to fully refund RMB 122 million of hotel order security deposits deducted from hotel operators, confiscated RMB 1,658 million of gains and imposed a RMB 3,521 million fine, "representing 7.5% of the Company's sales revenue generated from its operations in the People's Republic of China in 2025."
- Working backwards from that line, 2025 China revenue was RMB 46.95 billion, 75.2% of total revenue of RMB 62.41 billion. Trip.com does not break out China revenue anywhere else, so this ratio comes only from the penalty decision.
- Filing note (2025 Form 20-F risk factors): Under the Anti-Monopoly Law a violator can be ordered to stop, have illegal gains confiscated and be fined up to 10% of the prior year's sales, and the fine can be two to five times that amount in especially serious cases. 7.5% is inside the 10% cap but high as a ratio, and the industry section below puts it next to earlier cases.
- The warning signs were in the 20-F before the decision. In August 2025 the Guizhou provincial regulator met five travel platforms about pricing and antitrust compliance. In September the Zhengzhou regulator issued a rectification notice and the Guiyang regulator an inquiry. In December the Yunnan homestay association was reported to have named Trip.com in an antitrust campaign, and in March 2026 Beijing regulators called in twelve platforms over unreasonable platform rules.
- In dollar terms the bill is manageable. RMB 5.30 billion is 2.12 times Q1 net income attributable to shareholders and 5.1% of the RMB 104.0 billion of cash, short-term investments and held-to-maturity deposits at the end of March.
- Company disclosure (6-K, July 27, 2026): "The Company sincerely accepts the Decision and will adopt rectification measures in accordance with applicable laws and regulations to implement the Decision's requirements." The 6-K did not attach the decision or describe the rectification measures.
- The accounting is still open. The decision came after the June 30 quarter-end, but the investigation had been running since January, and the Q1 release said Trip.com could not estimate the possible loss. Whether the charge lands in the Q2 statements, and whether the RMB 1.66 billion confiscation is booked against revenue or as a non-operating expense, is what to look for in the September 15 release.
Net Cash and Investments Inside the Market Cap
- Own calculation (Q1 2026 6-K balance sheet): Cash, short-term investments and held-to-maturity deposits totaled RMB 104.0 billion at the end of March, and debt was RMB 30.83 billion, leaving net cash of RMB 73.17 billion. Investments of RMB 54.79 billion include RMB 22.95 billion of held-to-maturity deposits that are already in the cash figure, so long-term investments are RMB 31.84 billion.
- Of a market cap of about RMB 164.8 billion, net cash is 44.4% and long-term investments 19.3%. The RMB 59.77 billion left over is what the market is paying for the travel business, 3.07 times TTM adjusted EBITDA of RMB 19.47 billion.
- That math needs a haircut. Online travel agents collect cash from customers before paying hotels and airlines, and the balance sheet carries RMB 18.92 billion of advances from customers and RMB 19.99 billion of accounts payable. Taking both out leaves RMB 34.27 billion, 20.8% of market cap.
- The question is what Trip.com does with it. Item 16E of the 20-F shows 10,016,014 shares repurchased in 2025 at an average of $61.25, about $613 million. The $5 billion program authorized in August still had $5.07 billion of capacity at December 31, so about $210 million of it was used in November and December.
- A $0.30 per ADS dividend, about $200 million, was declared once in 2025. Weighted basic shares went from 660.2 million in Q1 2025 to 649.0 million in Q1 2026 (-1.7%). With the stock under $40, the roughly $5 billion of remaining capacity equals 20.6% of market cap.
Why Trip.com Cut Its Q2 Revenue Outlook
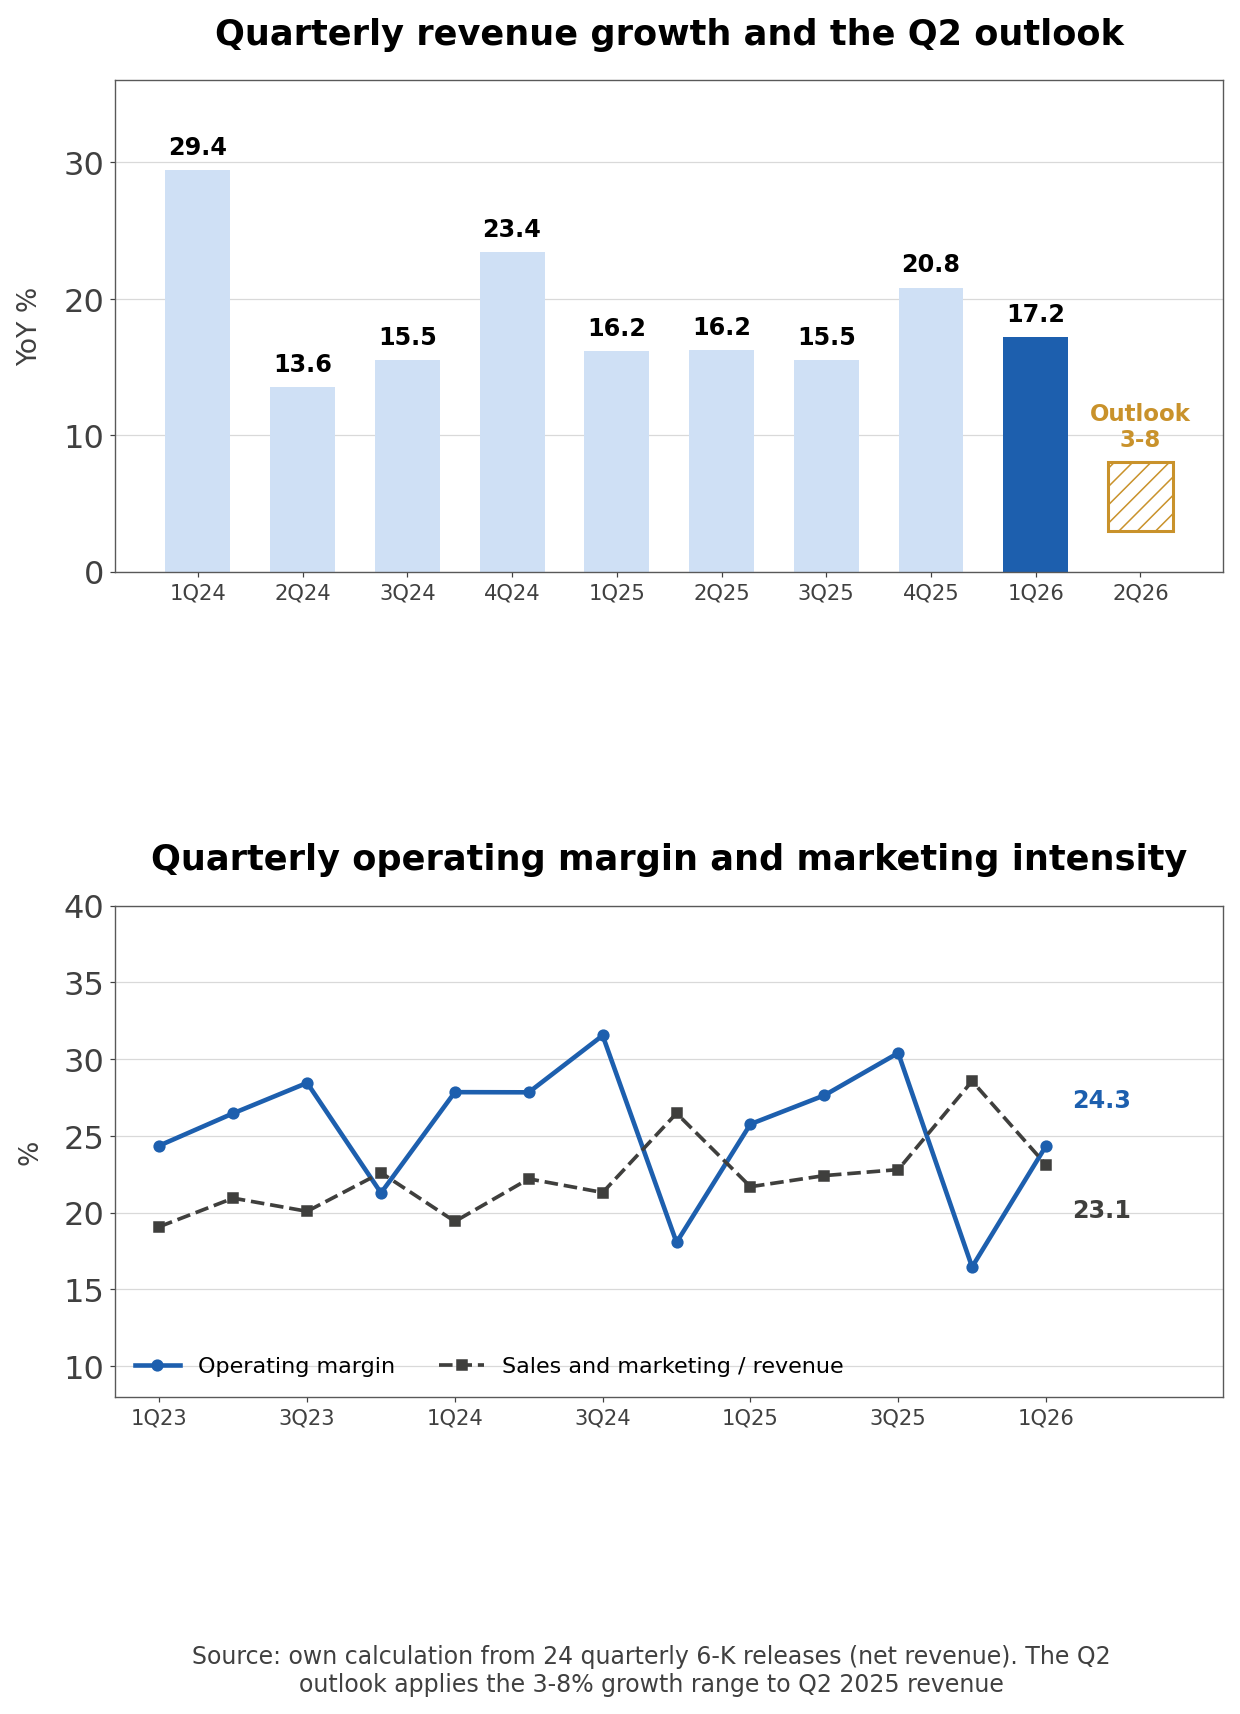
- Q1 2026 net revenue was RMB 16.21 billion (+17.2%), and the operating margin was 24.3% against 25.8% a year earlier. Sales and marketing expense was RMB 3.75 billion, 23.1% of revenue against 21.7%.
- Company disclosure (Q1 2026 6-K release, June 24, 2026): Trip.com expects Q2 net revenue to grow by approximately 3% to 8% year over year, with a corresponding impact on margins and bottom-line results. It cited "macro headwinds such as elevated energy pricing and geopolitical volatility, alongside operational adjustments the Company implemented to align with evolving industry standards and compliance frameworks."
- Applied to Q2 2025 revenue of RMB 14.84 billion, that range means RMB 15.29 billion to RMB 16.03 billion. Even the 8% top end is more than five points below the slowest year-over-year growth of the past nine quarters, 13.6% in Q2 2024.
- Company disclosure (Q1 2026 earnings call): CEO Jane Sun said: "That said, over the past several months, we have proactively reviewed and refined certain business practices to further strengthen our internal compliance and governance framework." Management said the domestic market competes on service quality rather than aggressive price wars, and that short booking windows limit visibility into the second half.
- The timing was different too. Q1 2025 results came out on May 19, but Q1 2026 results came out on June 24, five weeks later, and the release added a new paragraph saying the investigation could result in a significant fine or changes to business practices. The stock fell -12.5% the next day.
- The Q4 2025 operating margin of 16.5% belongs in the picture. Sales and marketing was 28.6% of revenue that quarter, the highest in 13 quarters, before easing to 23.1% in Q1. If marketing rises again in a slower quarter like Q2, the margin can step down again, which fits the release's warning about margins.
What the Street Believes vs What the Filings Show
- The bull case for TCOM starts with the penalty being over and ends with a low multiple and a pile of cash. I broke the argument in broker notes and investor commentary into ten links and checked each against the 6-Ks, the 20-F and the earnings call.
| # | The thesis | Evidence | Verdict |
| 1 | The antitrust case ended with a one-time fine | Total penalty RMB 5.30 billion, 3.2% of market cap; rectification measures not disclosed | Partly holds |
| 2 | Two quarters of profit cover the penalty | 2.12 times Q1 net income; 5.1% of cash and deposits | Holds |
| 3 | Growth returns to the teens soon | Q2 outlook 3% to 8%; limited second-half visibility | Unverifiable |
| 4 | Take rates survive the penalty | 2025 revenue / bookings 5.67%; SAMR found unreasonable terms | Unverifiable |
| 5 | International and inbound growth offsets China | International bookings about +65%; implied China share 75.2% | Partly holds |
| 6 | Net cash near half of market cap limits downside | Net cash 44.4%; 20.8% after customer advances and payables | Overstated |
| 7 | A 60-month low P/E of 5.8x makes it cheap | Q3 2025 is 63.1% of trailing income; forward P/E 10.7x | Overstated |
| 8 | The $5 billion buyback supports the stock | About $210 million of the new program used by year-end 2025 | Conditional |
| 9 | Brokers see big upside to their average target | All 4 target changes after Q1 were cuts; 2026 EPS estimate -12.7% in 90 days | Conditional |
| 10 | Regulatory risk ended with this penalty | 20-F cites homestay association complaint, private lawsuits, train ticketing guidance | Wrong |
- One link holds, two partly hold, two are conditional, two cannot be verified, two are overstated and one is wrong. The link that matters most is number 4. If the exclusive arrangements and unreasonable terms SAMR ruled against were what held the take rate up, then links 1 and 2 can be right about the dollars while the 10.7x forward P/E in link 7 sits on earnings that are about to shrink, and link 4 cannot be judged until Q2 and Q3 margins are reported.
TCOM Price Targets and EPS Revisions
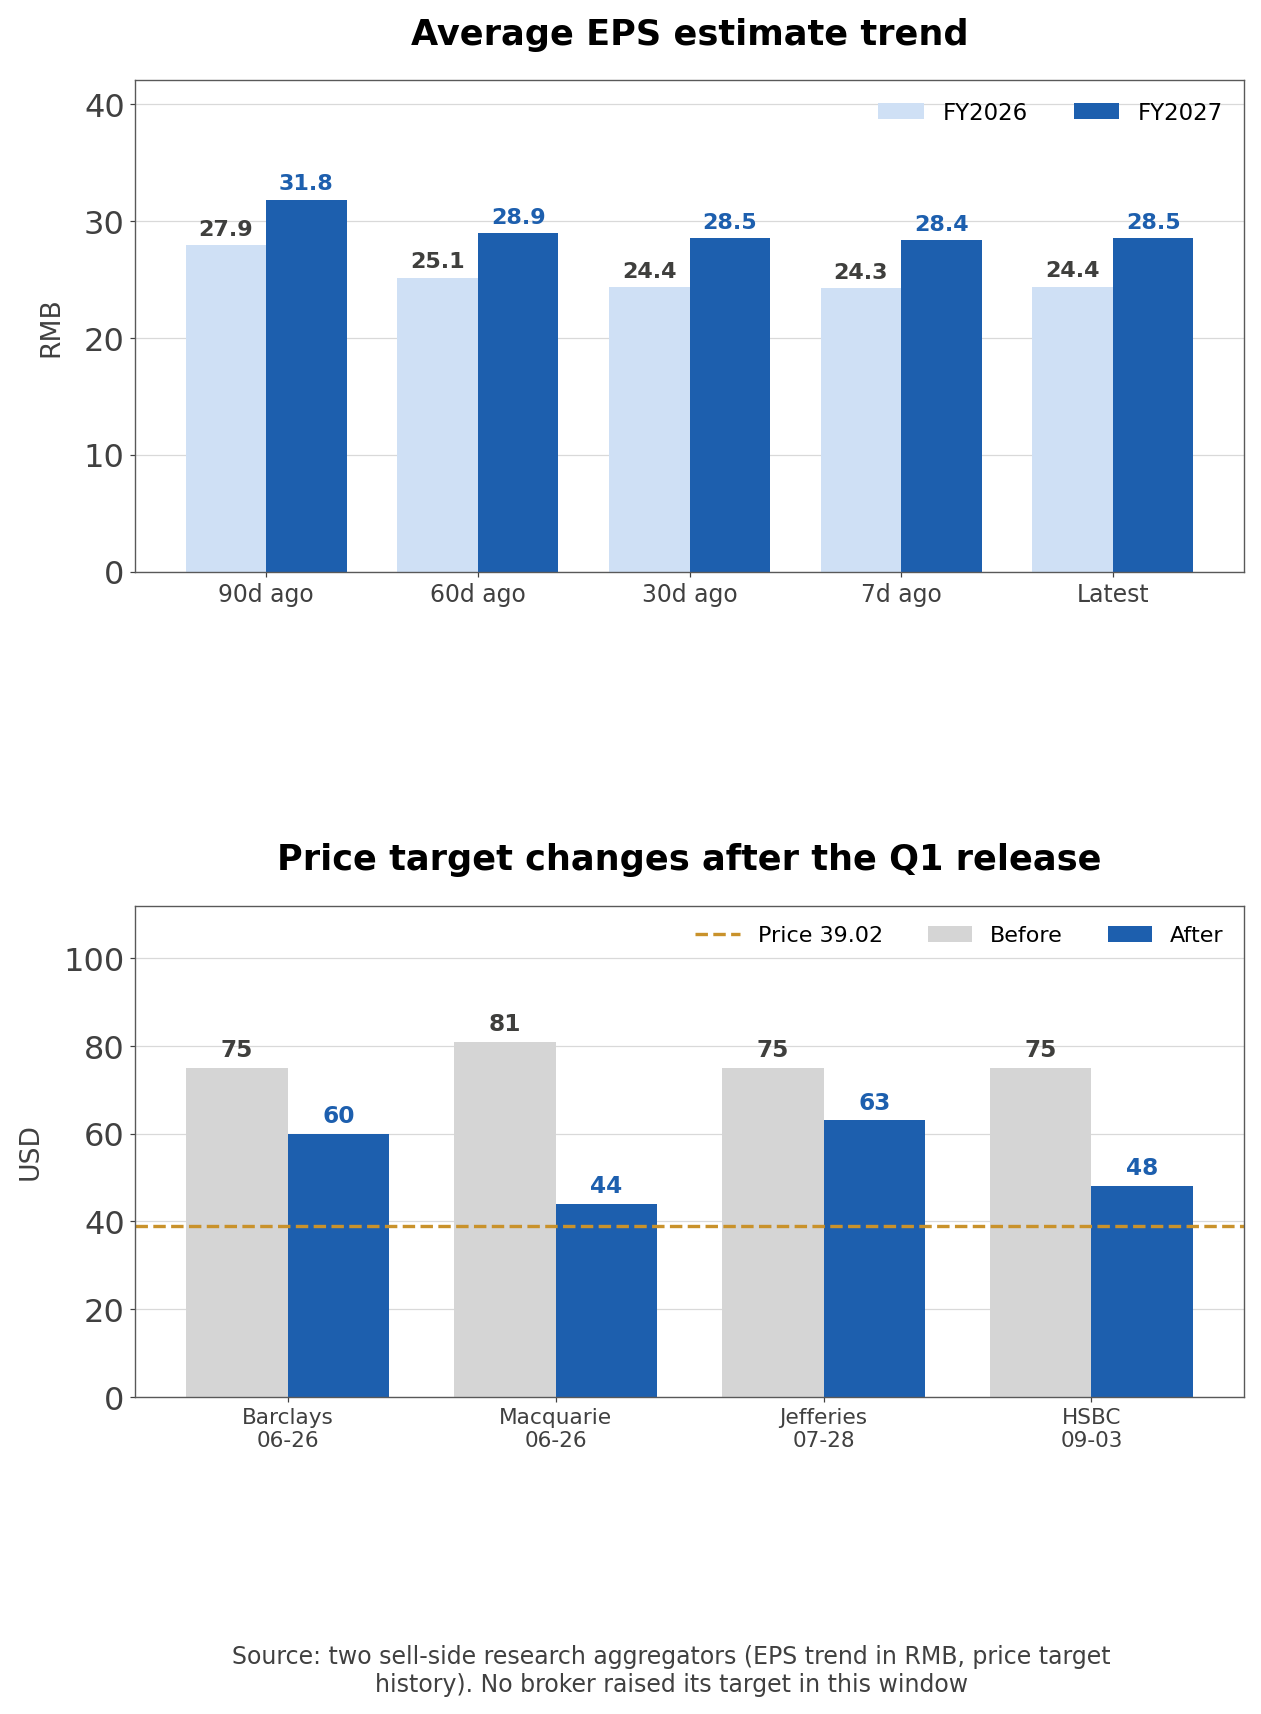
- Aggregated sell-side research (28 target prices; about 30 revenue and EPS estimates): The average 12-month target is $60.07, with a low of $42 and a high of $78. A second aggregator shows 43 analysts at 29 Buy, 12 Hold and 2 Sell. Average 2026 revenue is estimated at RMB 67.43 billion, 8.0% above 2025, and average EBIT at RMB 17.77 billion.
| Date | Broker | Rating | Target ($) |
| 2026-09-03 | HSBC | Hold, reiterated | 75 to 48 |
| 2026-07-29 | Bank of America Securities | Buy, reiterated | Not given |
| 2026-07-28 | Benchmark | Buy, reiterated | Not given |
| 2026-07-28 | Jefferies | Buy, reiterated | 75 to 63 |
| 2026-06-26 | Barclays | Not shown | 75 to 60 |
| 2026-06-26 | Macquarie | Outperform to Neutral | 81 to 44 |
| 2026-06-25 | Citigroup | Buy, reiterated | Not given |
| 2026-06-25 | Benchmark | Buy, reiterated | Not given |
- All four brokers that changed targets after the Q1 release cut them, and the new targets average $53.75. Macquarie made the biggest cut and downgraded to Neutral, and HSBC's $48, the most recent, came after the penalty decision.
- EPS estimates moved around the Q1 release rather than the penalty. The 2026 EPS estimate fell from RMB 27.94 ninety days ago to RMB 24.38 (-12.7%) and the 2027 estimate from RMB 31.82 to RMB 28.49 (-10.5%), with little change over the last thirty days. Seven analysts cut 2027 estimates in the last thirty days.
- The average Q2 EPS estimate fell from RMB 6.99 ninety days ago to RMB 5.74. The aggregators do not say whether estimates include the penalty, so it will be hard to compare that figure directly with what Trip.com reports on September 15.
- Outside view (investment site contributor, September 2026): A preview of Q2 results expected revenue growth in the high teens and argued the regulatory penalty creates a buying opportunity. That revenue assumption is well above Trip.com's own 3% to 8% outlook and is not supported by the filings.
Who Owns Trip.com Group
| Holder | Shares | Stake | Source |
| Capital World Investors | 55,777,883 | 8.9% | 20-F (citing 13G/A as of Sep 30, 2025) |
| Baidu | 45,953,524 | 7.3% | 20-F (citing 13D/A of Sep 2024) |
| BlackRock | 32,685,688 | 5.2% | 20-F (citing 13G at end of 2025) |
| Directors and officers as a group | 63,766,293 | 9.4% | 20-F (includes options) |
- Filings after the 20-F point lower. Capital World Investors reported 6.7% in a May 2026 13G/A, BlackRock 4.8% in July, and Executive Chairman James Liang 3.0% in April. The 20-F figure for Liang includes 34.08 million shares underlying options exercisable within 60 days, so it overstates actual common shares.
- Among well-known funds in 13F information tables, only Tudor Investment held TCOM at the end of June: 167,727 common shares, excluding option lines, up from March. The same June table also shows a put option line on 203,800 shares. Berkshire Hathaway, Bridgewater, Tiger Global and 21 other funds on my list hold nothing.
- No Korean company or institution has filed a stake. On the Q1 call Trip.com only mentioned Korean creators in its program inviting overseas content creators to China.
- Filing note (6-K on the 2026 annual general meeting, June 30, 2026): Trip.com said all resolutions were adopted at the meeting in Singapore but did not disclose vote percentages. The board is Executive Chairman James Liang, CEO Jane Sun and director Rong Luo, plus five independent directors: Neil Shen, Gabriel Li, JP Gan, May Wu and Iris Xiao.
- The new fact for management's record is the penalty itself. The July 27 6-K promised stronger long-term governance, but the board is unchanged from the 20-F and no officer or committee responsible for the rectification has been named.
How Trip.com Compares With Booking and Expedia
- The peers are Booking Holdings, Expedia and Airbnb, the large U.S.-listed online travel companies, plus MakeMyTrip in India, in which Trip.com holds a stake, and Tongcheng Travel, a competitor inside China. I classed Trip.com as a mature large cap, with revenue growth in the mid-teens and margins in the twenties, and chose margin stability, net cash and multiple history as the yardsticks.
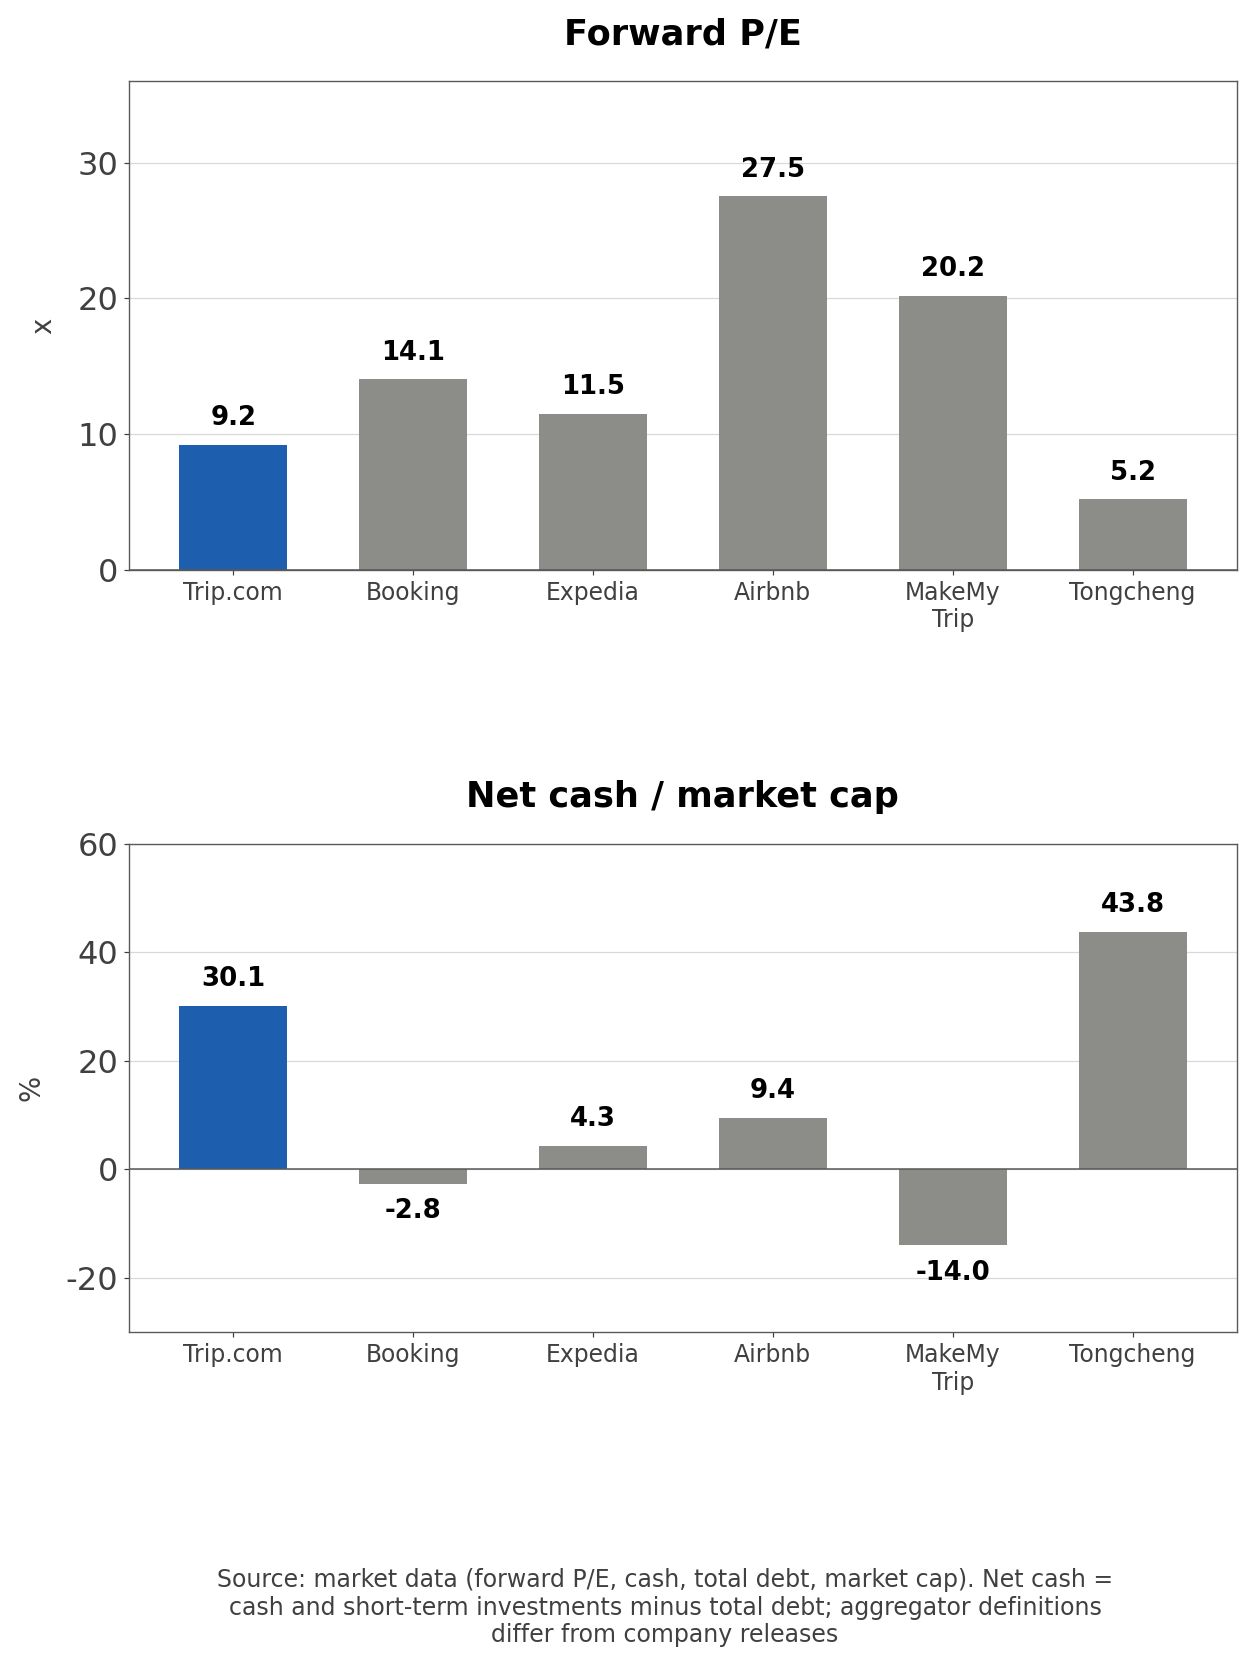
| Company | Market cap ($bn) | Revenue growth | Operating margin | Forward P/E | Trailing P/E |
| Trip.com | 24.6 | +17.2% | 24.3% | 9.2x | 5.8x |
| Booking Holdings | 134.8 | +8.1% | 34.4% | 14.1x | 19.3x |
| Expedia | 33.7 | +14.0% | 19.0% | 11.5x | 17.7x |
| Airbnb | 101.9 | +16.5% | 21.0% | 27.5x | 38.9x |
| MakeMyTrip | 4.7 | +6.2% | 15.3% | 20.2x | 217.8x |
| Tongcheng Travel | 3.2 | +6.8% | 16.4% | 5.2x | 8.7x |
- Aggregator check (market data, latest quarter): The operating margins and forward P/Es in this table use aggregator definitions, which is why Trip.com shows a 9.2x forward P/E here against the 10.7x I get from the average EPS estimate.
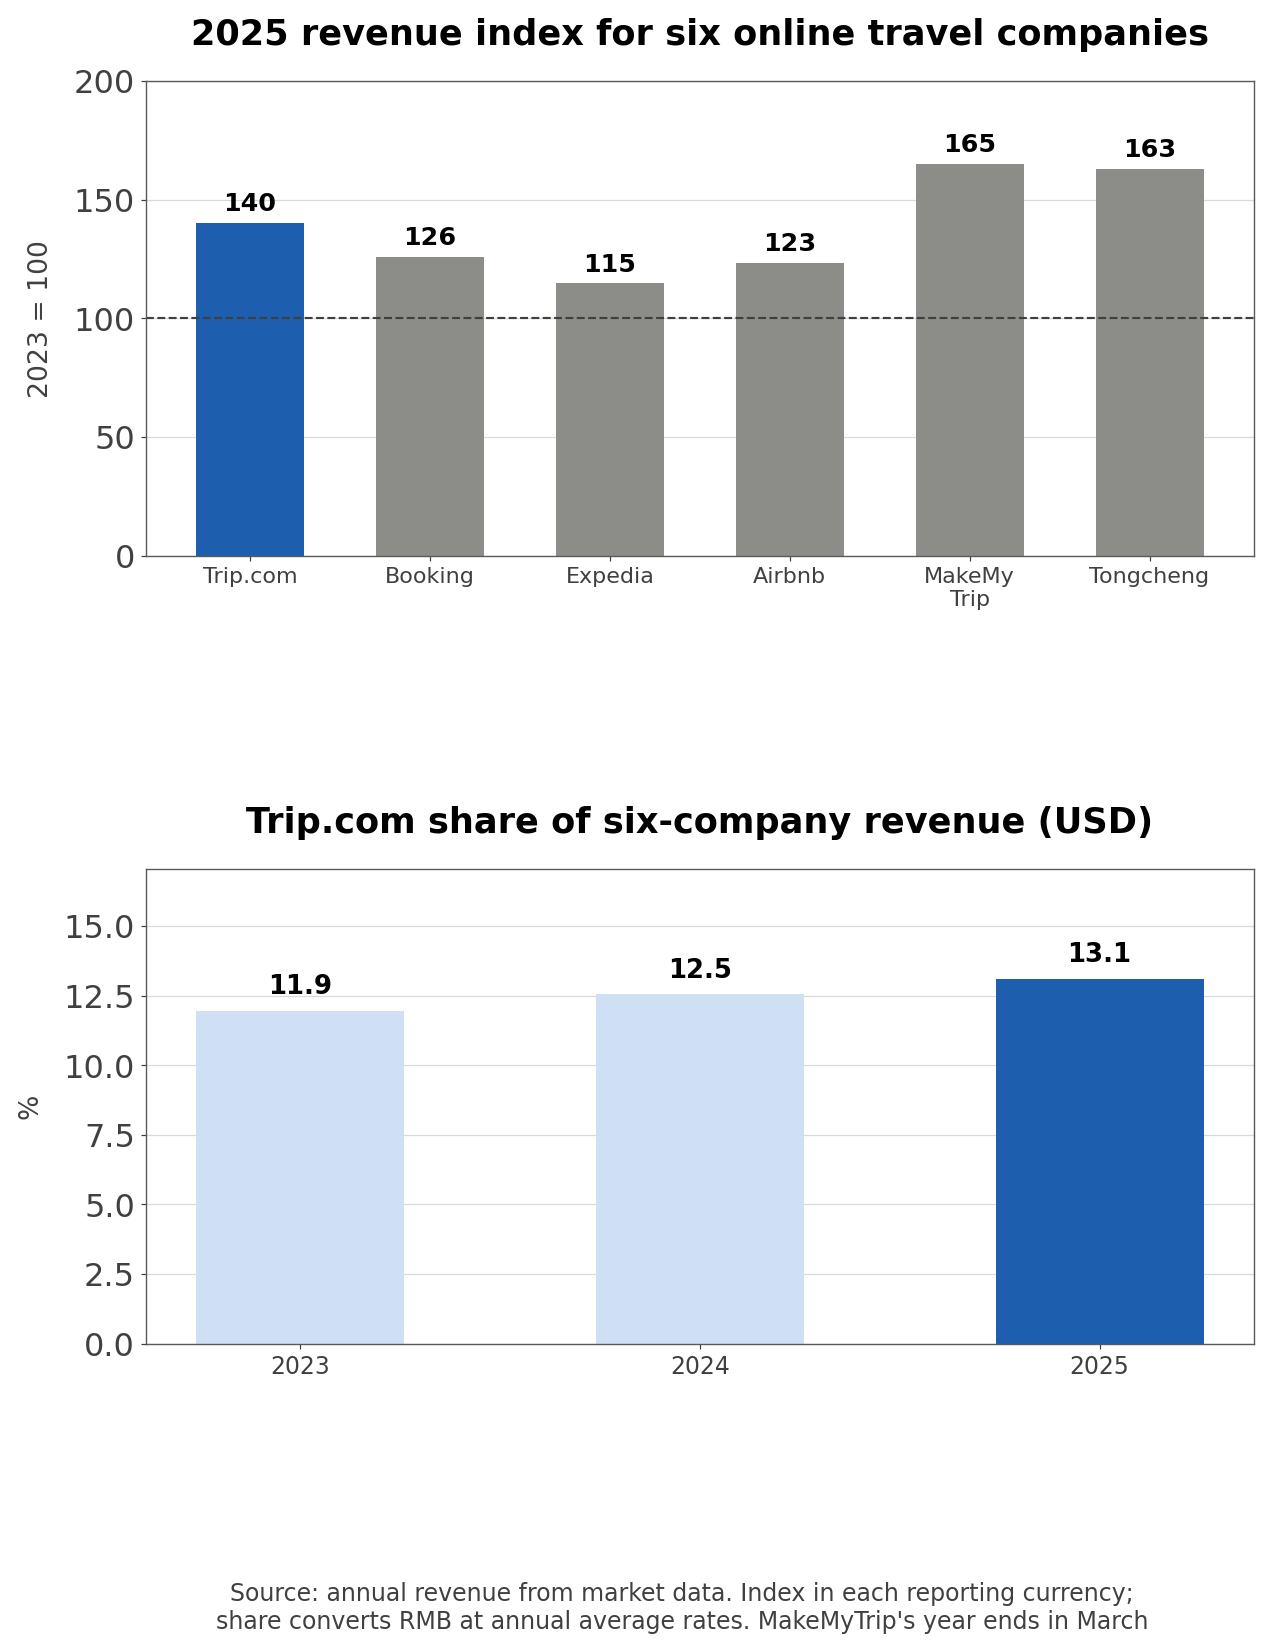
- Trip.com grew revenue 1.40 times between 2023 and 2025, faster than the three U.S. companies, and its share of combined dollar revenue across the six companies rose over the period. On latest revenue growth it is the fastest of the six at 17.2%; on forward P/E only Tongcheng is lower.
| Company | Net cash / market cap | Operating margin 2023 · 2024 · 2025 | 2025 revenue index (2023 = 100) |
| Trip.com | 30.1% | 25.4% · 26.6% · 25.3% | 140 |
| Booking Holdings | -2.8% | 27.3% · 31.8% · 34.5% | 126 |
| Expedia | 4.3% | 11.9% · 12.2% · 14.7% | 115 |
| Airbnb | 9.4% | 15.3% · 23.0% · 20.8% | 123 |
| MakeMyTrip | -14.0% | 3.6% · 9.7% · 12.4% | 165 |
| Tongcheng Travel | 43.8% | 15.5% · 13.7% · 17.4% | 163 |
- Own calculation (aggregator cash, total debt and market caps): The two companies with the most net cash relative to market cap are both Chinese, and they also carry the lowest forward P/Es. Trip.com's 30.1% here uses the aggregator's cash definition and is lower than the 44.4% I calculated from the company's release.
- The table cannot explain why the two Chinese names hold the most cash and trade at the lowest multiples. Booking has negative net cash yet trades at 14.1 times forward earnings with a margin that rose three years in a row, while Trip.com's margin held at 25% to 27% and its discount widened after the investigation.
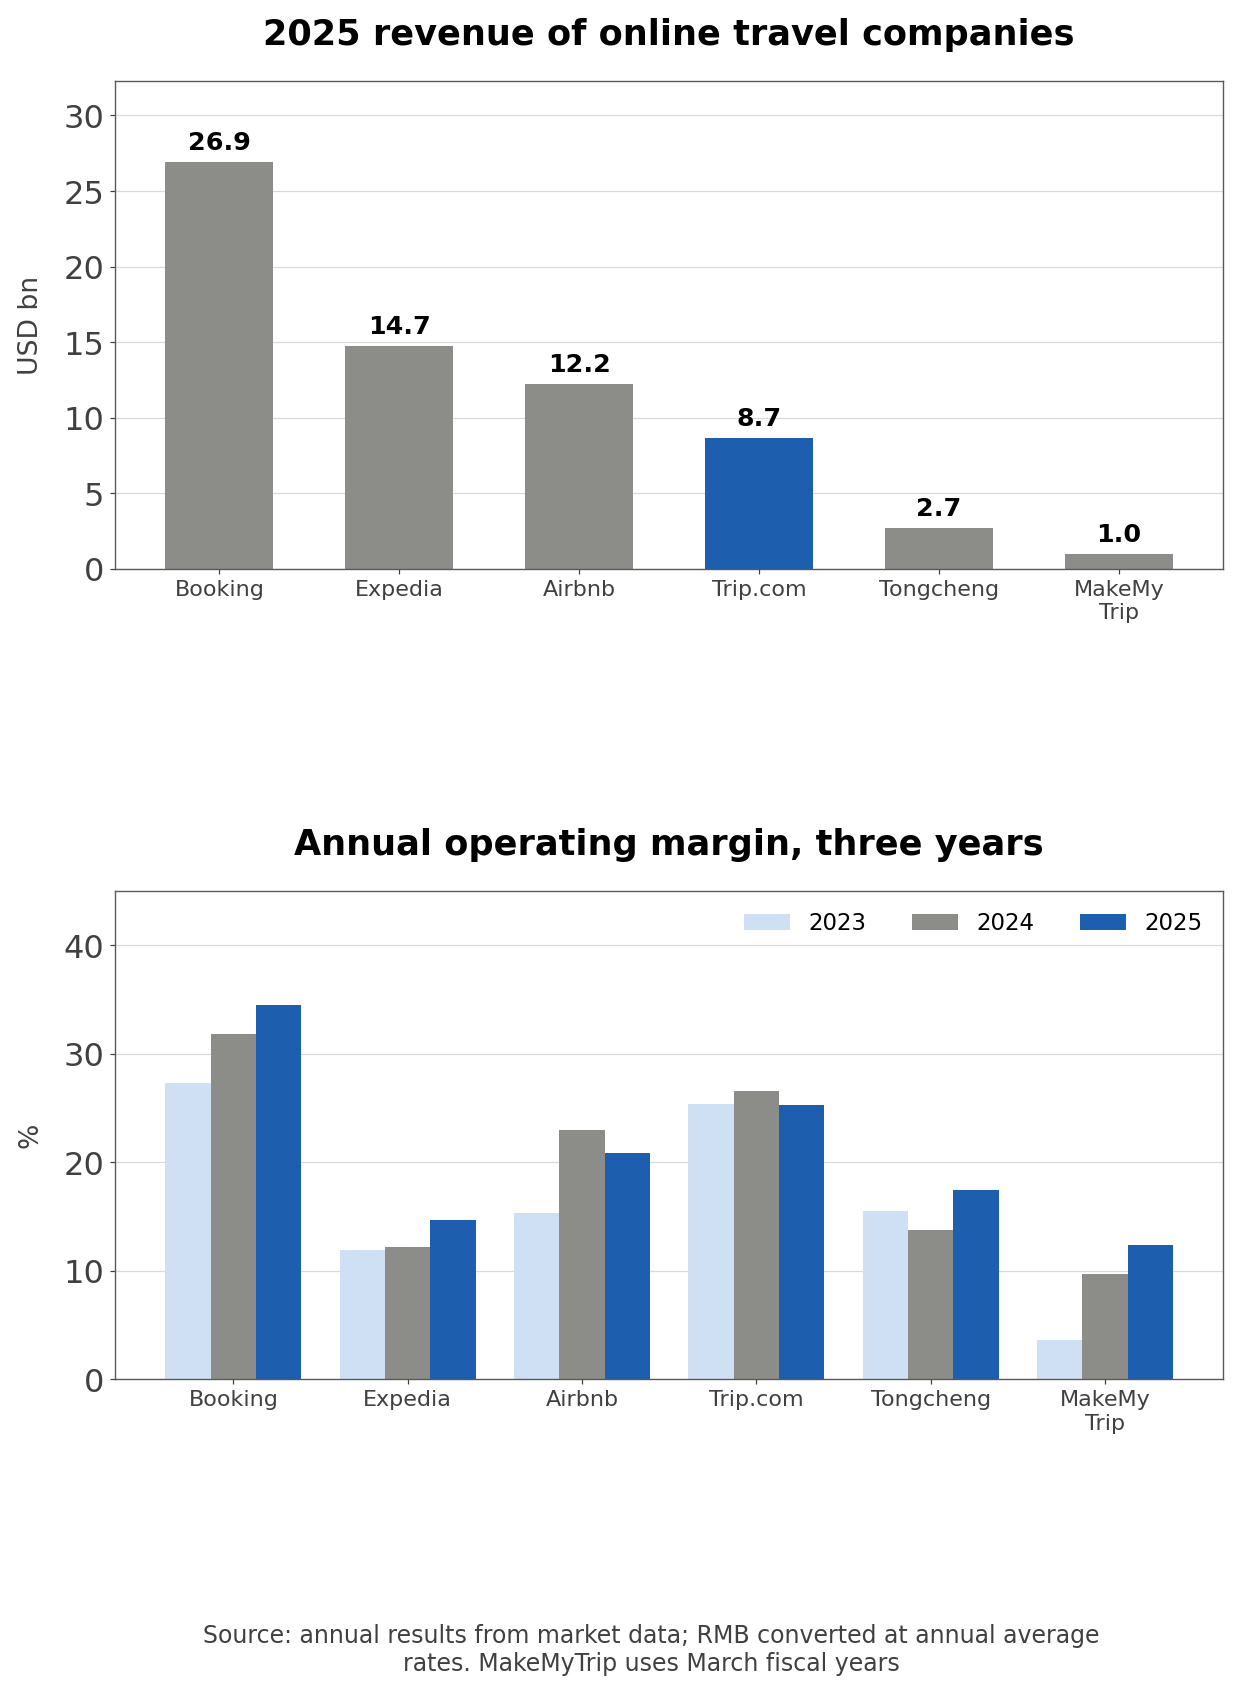
- By size, Booking's revenue is about three times Trip.com's, and Expedia and Airbnb are also larger. In the three-year margin table only Booking is above Trip.com, and MakeMyTrip improved the most, from 3.6% to 12.4%.
- The number of competitors and market share cannot be verified. Trip.com names competitors in the 20-F but gives no share data, and the penalty 6-K states only that SAMR found a dominant market position, without share figures or a market definition.
China Platform Antitrust Fines Compared
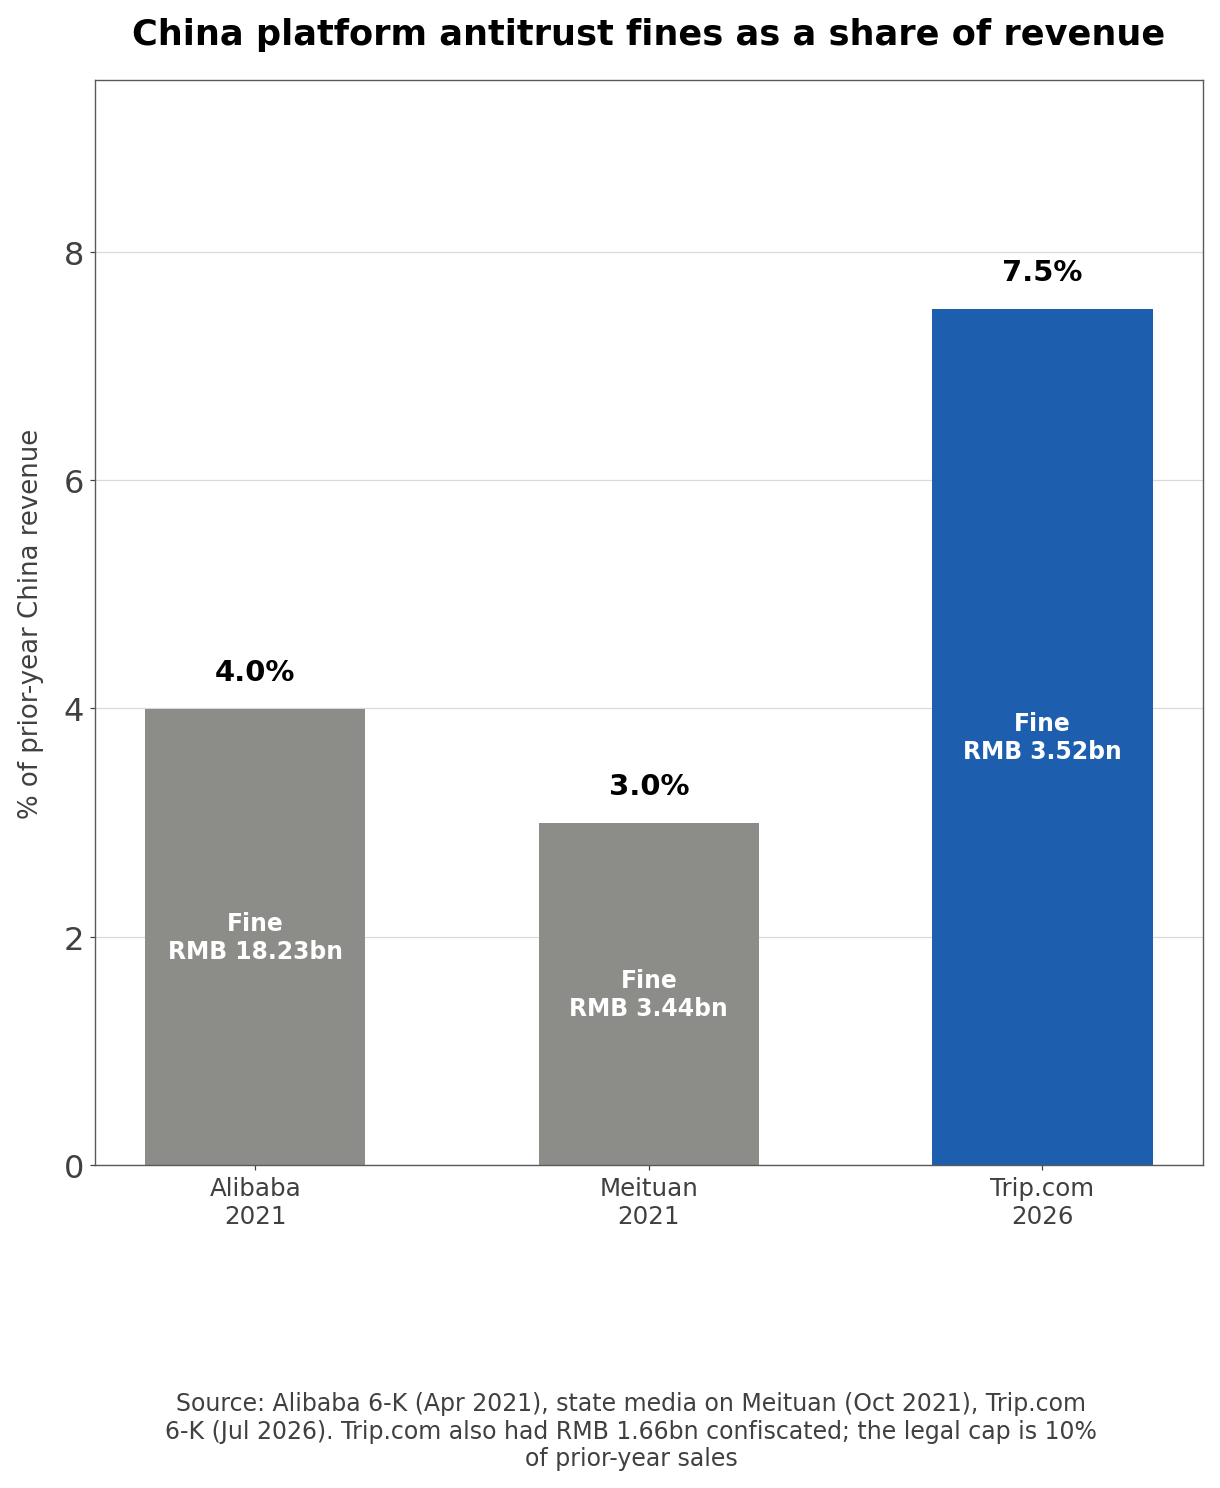
- Filing note (Alibaba 6-K, April 12, 2021): SAMR found Alibaba violated Article 17(4) of the Anti-Monopoly Law by restricting counterparties through exclusive arrangements, and fined it "RMB18.228 billion (approximately US$2.8 billion), or 4% of" RMB 455.712 billion of 2019 China revenue, with three years of self-assessment and compliance reports required.
- Outside view (Chinese state media, October 2021): Meituan was reported to have been fined RMB 3.442 billion, 3% of 2020 domestic sales of RMB 114.748 billion, for forcing merchants into exclusive "choose one of two" arrangements, and ordered to refund RMB 1.289 billion of exclusive cooperation deposits.
- All three cases targeted locking suppliers into one platform. Only Trip.com also had gains confiscated, and its 7.5% rate is about 1.9 times Alibaba's and 2.5 times Meituan's. The case also came after the Anti-Monopoly Law was amended in 2022, which moved the relevant clause from Article 17 to Article 22.
- Demand runs the other way. On the Q1 call Jane Sun said more than 80 countries now have visa-free entry to China, and Trip.com served about 20 million inbound travelers in 2025 and about 7 million in Q1 2026.
- Outside view (U.S. financial daily, September 2026): China's latest five-year plan sets the goal of becoming a tourism power, and policymakers see tourism as a way to lift consumption and service exports.
- The same government that wants more travel spending gave the largest travel platform a 7.5% fine rate. As policy pushes travel demand, rules protecting hotel and homestay operators may tighten alongside it, and the 20-F lists the homestay association campaign and possible private lawsuits as separate risks. I could not find a continuous official statistic for online travel market growth, so the industry growth rate is marked unverifiable.
Conditions That Would Move TCOM Stock
| Scenario | Condition | Indicator to check | When · Source |
| Upside | Q2 revenue growth at or above the 8% top end | Year-over-year revenue growth | Q2 results on September 15 · 6-K release |
| Downside | Q2 revenue growth below 3% | Year-over-year revenue growth | Q2 results · 6-K release |
| Downside | Operating margin excluding the penalty falls below 20% | Operating margin ex one-offs | Q2 results · reconciliation table |
| Downside | Full-year revenue / bookings drops below 5% | Take rate | Q4 earnings call |
| Upside | International platform bookings keep growing above 50% | International gross bookings | Quarterly earnings calls |
| Downside | New local penalties or private antitrust suits | Regulatory filings | 6-K · 20-F |
- The line that matters most is the margin excluding the penalty. If the RMB 5.30 billion is booked in Q2, GAAP profit will fall, but that is a one-off. If the margin still drops below 20% after stripping it out, the compliance changes will have reset the commission and marketing structure, and the denominator under the 10.7x forward P/E comes down again.
What to Check Next in the Penalty Decision
- The 6-K gives the confiscated gains as RMB 1,658 million but not the period or the transactions they were calculated on. If they were measured on extra commissions from exclusive hotel arrangements, the figure is a guide to revenue that will disappear. If they were measured on one-time items such as the deducted deposits, the ongoing effect is small.
- The filing also does not say whether the promised rectification changes hotel contract terms, the price adjustment tool or search ranking rules. Shouldn't the first check be the calculation basis and period for the confiscated gains in the full text of SAMR's decision?
Related Analysis
- Shopify (SHOP) Stock Analysis: Net Income vs. Equity Gains
- Dell (DELL) Stock Analysis: Q2 FY2027 Earnings and Guidance
Methodology and Sources
- The share price is $39.02, converted at RMB 6.7061 per dollar, and the share count of 629.7 million is an aggregator figure that matches the 20-F ownership table (Capital World at 8.9% and Baidu at 7.3%) within 2%.
- Financials come from the 6-K on the SAMR penalty decision, the Q1 2026 earnings 6-K, the 2025 Form 20-F, and the releases and call transcripts in Trip.com's quarterly results library. The Alibaba case comes from Alibaba's 6-K and the Meituan case from Chinese state media reports.
- I parsed all 24 earnings releases from Q2 2020 to Q1 2026 in code and checked segment totals, the operating income identity from 2022 onward, and annual revenue, operating income and net income for 2021 through 2025. The bands use 60 month-end closes plus the latest price. Trip.com does not publish slide decks; its investor relations site has webcasts, releases, transcripts and 6-K filings only. Consensus figures are aggregated sell-side research, and quotes are taken verbatim from filings and call transcripts.
#TripCom #TCOM #TCOMStock #TCOMStockAnalysis #ChinaTravel #OnlineTravel #Antitrust #USStocks #StockAnalysis #EquityResearch #GlobalStockBrief
'US Stock Analysis' 카테고리의 다른 글
| Lennar (LEN) Stock: 12.9% Incentives and a 0.89x P/B (0) | 2026.09.15 |
|---|---|
| Plug Power (PLUG) Stock Analysis: GAAP vs Operating Loss (0) | 2026.09.15 |
| Bitmine (BMNR) Stock Analysis: mNAV Below 1 and Dilution (0) | 2026.09.14 |
| Sumitomo Electric (5802) Stock Analysis: Data Center Optics (0) | 2026.09.13 |
| Oracle (ORCL) Stock Analysis: Cash Flow and Capex Gap (0) | 2026.09.12 |


