
- Sumitomo Electric Industries (TSE: 5802) is Japan's largest wire and cable maker, with ¥5.11 trillion of revenue in the fiscal year ended March 2026 and a market capitalization of about ¥6.48 trillion ($42.1 billion). This 5802 stock analysis works through the company's shift from automotive wiring harnesses toward data center optics, the June-quarter drop in info-communications sales, a sum-of-the-parts check against Fujikura, the Mid-Term Management Plan 2028, P/E and P/B bands, analyst price targets, and the conditions that would move the shares.
- Here is the puzzle. The info-communications segment is only 6.5% of sales, yet it earned 28.1% of group operating profit in the June quarter, and management raised its full-year operating profit forecast from ¥425.0 billion to ¥450.0 billion. The stock still sits -40.5% below its June 3 closing high of ¥3,491.25, while Fujikura, the purest optical play among Japan's cable makers, is -0.4% over the same stretch.
- Two limits up front. Per-share figures use the post-split average share count of 3.12 billion (treasury shares excluded) and June-quarter equity. Peer multiples use each company's latest fiscal-year operating profit, so the three Japanese names (March 2026 year-end) and Corning, Prysmian and Nexans (December 2025 year-end) are three months apart. Sumitomo Electric does not file periodic reports with the SEC; the primary sources are the company's fact books, earnings releases and supplementary sheets under Japanese GAAP.
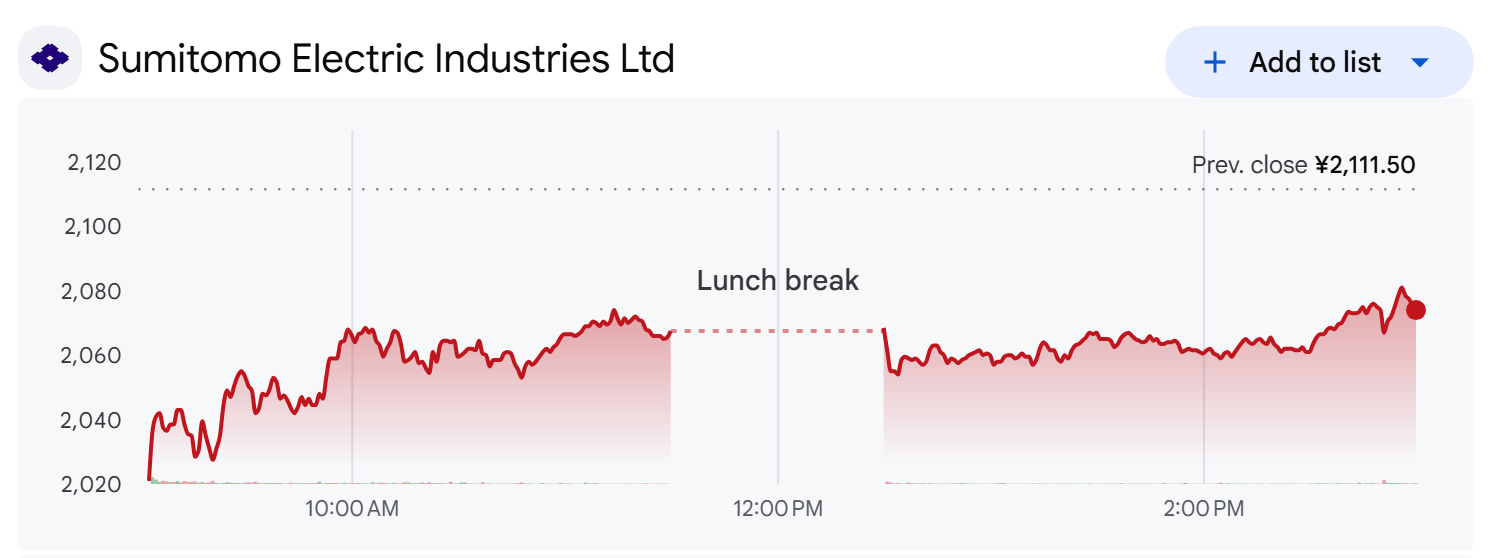
- At ¥2,077.5 the shares are +96.2% over one year and 3.37 times the March 2025 month-end close. The latest results are for fiscal Q1 2026 (April to June 2026), released July 31. All per-share figures reflect the 4-for-1 stock split that took effect on July 1.
What Does Sumitomo Electric Industries (5802) Do?
- Sumitomo Electric started as a Sumitomo copper-processing works in 1897 and grew into the world's leading supplier of automotive wiring harnesses, the bundles of wire that run through every car. In fiscal 2019 automotive made ¥68.2 billion of the group's ¥127.2 billion operating profit, and info-communications made ¥17.8 billion. Harnesses are built to each car program, so the revenue is large and the margin is thin.
- The early 2020s shook that model. COVID pushed the June 2020 quarter to a ¥41.5 billion net loss. In fiscal 2021 chip shortages and materials costs cut automotive operating profit to ¥12.3 billion. In fiscal 2023 info-communications posted an operating loss of ¥11.6 billion. The segment now closing in on the top profit spot was loss-making three years ago.
- The group then cleaned up its structure. In February 2023 it launched tender offers for listed subsidiaries Nissin Electric and Techno Associe. On October 30, 2025 it announced a tender offer for Sumitomo Riko, the anti-vibration rubber maker, on the same day it agreed to exit Sumitomo Densetsu, its electrical-construction affiliate. Sumitomo Riko became wholly owned on March 1, 2026, and the Sumitomo Densetsu stake went to Daiwa House's acquisition process on March 24, 2026. The fact books and releases sit in the company IR library.
- Filing footnote (fiscal 2025 fact book, consolidated income statement): A ¥79.2 billion gain on the sale of affiliates' shares went through extraordinary income, and non-controlling interests fell from ¥240.0 billion to ¥91.6 billion.
- The effect shows up right away. Profit attributable to minority holders dropped from ¥5.8 billion to ¥2.6 billion in the June quarter, so more of each yen of operating profit now reaches Sumitomo Electric shareholders. The other side is that the Environment and Energy segment loses about ¥228.4 billion of annual sales with Sumitomo Densetsu gone.
| Fiscal year | What happened | Source |
| 2019 (ended Mar 2020) | ¥3.11 trillion revenue at a 4.1% operating margin; autos made 54% of operating profit | Fact book |
| 2020 (ended Mar 2021) | COVID quarter with a ¥41.5 billion net loss; full-year net income ¥56.3 billion | Fact book |
| 2021 (ended Mar 2022) | Chip shortage cut auto operating profit to ¥12.3 billion; free cash flow ¥-89.4 billion | Fact book |
| 2022 (ended Mar 2023) | Revenue passed ¥4 trillion; tender offers for Nissin Electric and Techno Associe | Fact book and release |
| 2023 (ended Mar 2024) | Info-communications lost ¥11.6 billion; autos recovered to ¥144.7 billion | Fact book |
| 2024 (ended Mar 2025) | Operating profit ¥320.7 billion; info-communications back to a ¥19.9 billion profit | Fact book |
| 2025 (ended Mar 2026) | Record ¥418.2 billion operating profit; Sumitomo Riko buyout and Sumitomo Densetsu exit | Fact book and release |
| 2026 (in progress) | 4-for-1 split, Mid-Term Plan 2028, ¥27.2 billion info-communications profit in Q1 | Earnings release |
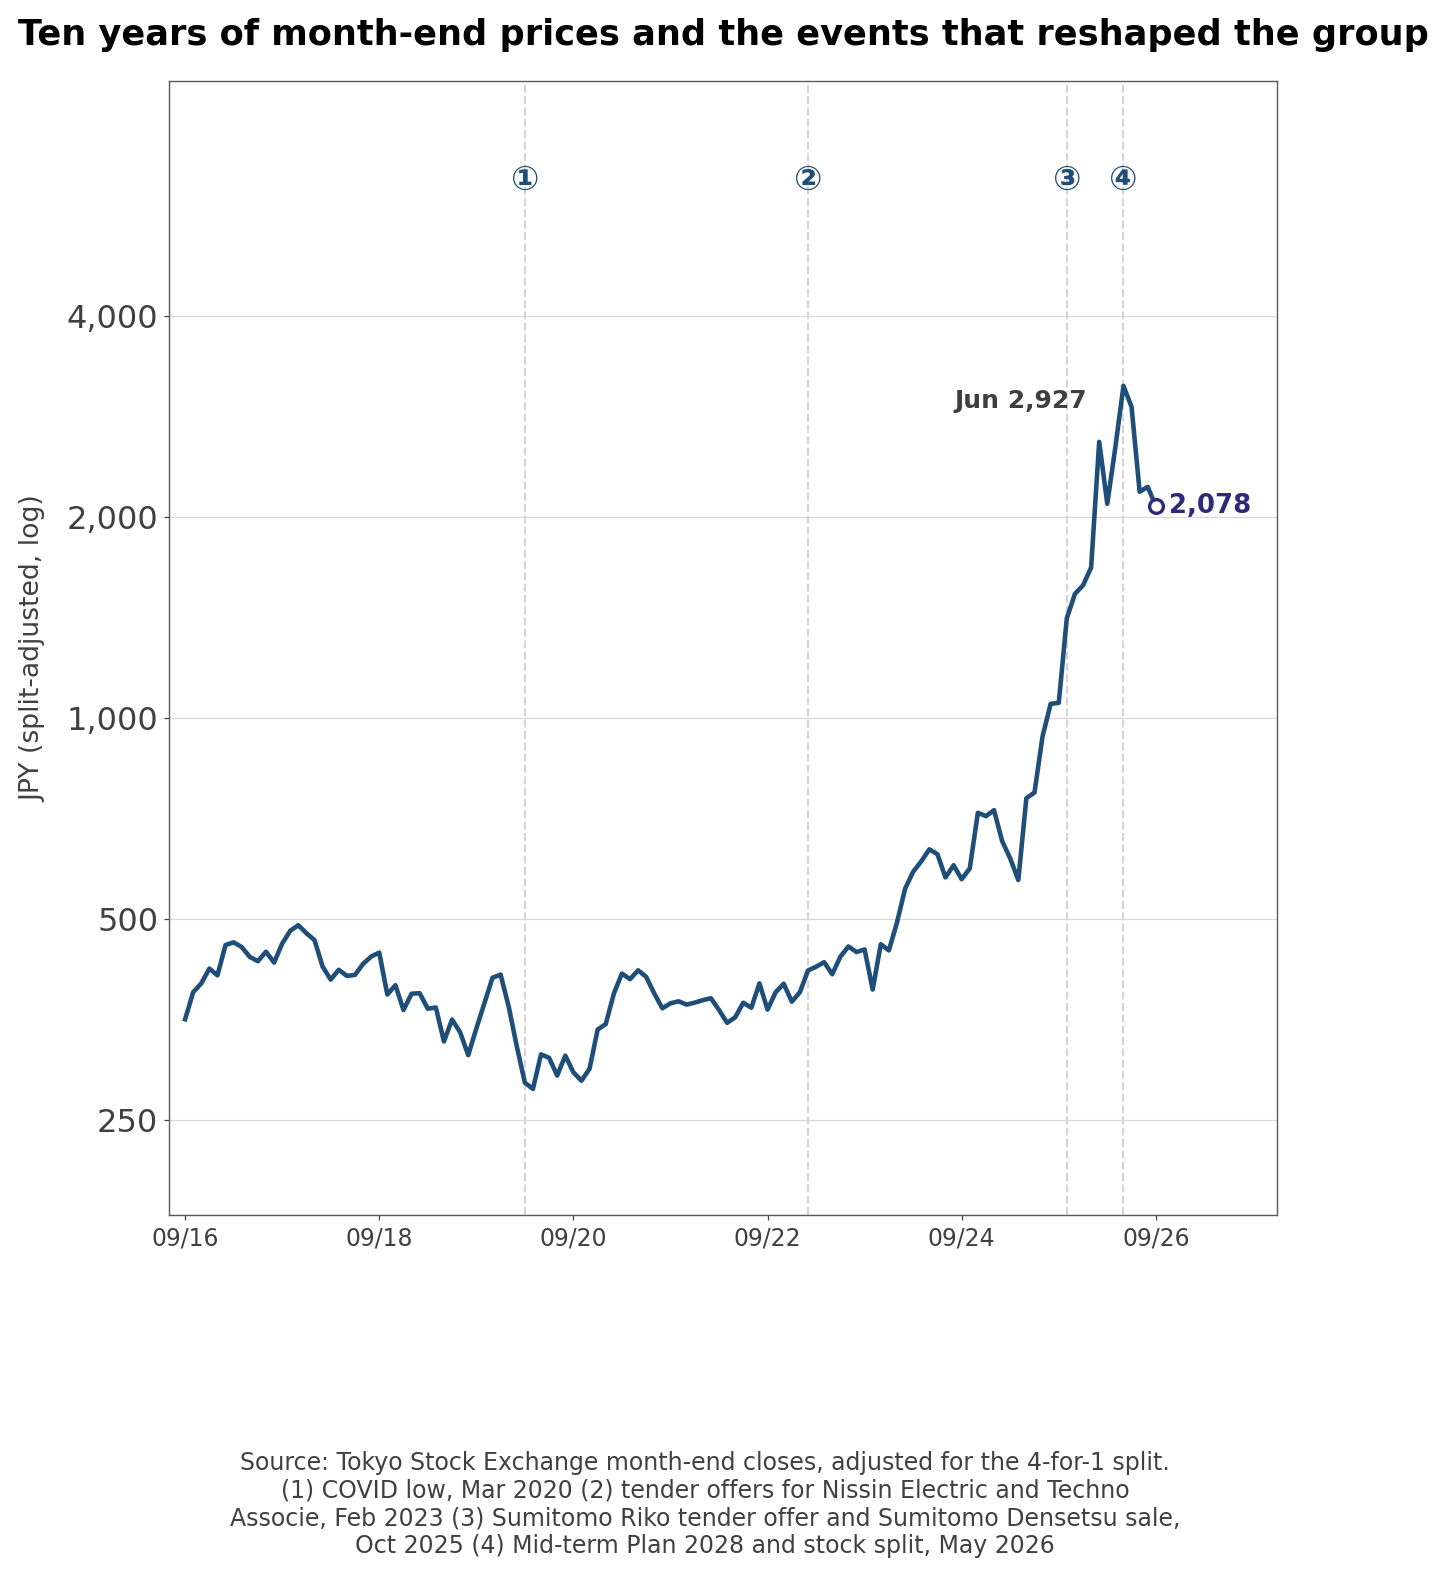
- Own calculation (ten years of split-adjusted daily closes): From the COVID low of ¥246.2 on March 17, 2020 to the June 3, 2026 closing high of ¥3,491.25 the stock rose 14.2 times. Giving back 40.5% of that took a little over three months.
- Five fiscal years of results show the margin climbing every year. Revenue, operating profit and net income come from the consolidated income statement; the debt ratio is total liabilities divided by equity attributable to owners, and ROE is the company's reported figure.
| Fiscal year | Revenue (¥bn) | Operating profit (¥bn) | Net income (¥bn) | Operating margin | Net margin | Debt ratio | ROE |
| 2021 | 3,367.9 | 122.2 | 96.3 | 3.6% | 2.9% | 99.1% | 5.7% |
| 2022 | 4,005.6 | 177.4 | 112.7 | 4.4% | 2.8% | 100.1% | 6.1% |
| 2023 | 4,402.8 | 226.6 | 149.7 | 5.1% | 3.4% | 87.6% | 7.3% |
| 2024 | 4,679.8 | 320.7 | 193.8 | 6.9% | 4.1% | 83.4% | 8.6% |
| 2025 | 5,110.2 | 418.2 | 369.5 | 8.2% | 7.2% | 72.5% | 14.7% |
- The last row includes the Sumitomo Densetsu gain. Excluding it, the company puts fiscal 2025 ROE at 11.9%.
The Five Biggest Daily Moves and What Moved Them
- Across 733 trading days in three years, the shares moved more than 5% on 84 days. The five largest moves all came on days when the Nikkei 225 also moved more than 5% in the same direction.
| Date | Move | Close (split-adjusted, ¥) | Company filings within a day | What the market did |
| 2024-08-05 | -15.85% | 551.3 to 463.9 | None found | Nikkei -12.4% · Fujikura -18.5% |
| 2025-04-07 | -16.17% | 521.9 to 437.5 | None found | Nikkei -7.8% · Fujikura -16.3% |
| 2025-04-08 | +14.74% | 437.5 to 502.0 | None found | Nikkei +6.0% · Fujikura +19.5% |
| 2025-04-10 | +15.07% | 467.0 to 537.4 | None found | Nikkei +9.1% · Fujikura +17.5% |
| 2026-05-07 | +14.60% | 2,475.0 to 2,836.3 | None found (results came May 12) | Nikkei +5.6% · Fujikura +11.9% |
- August 5, 2024 was the yen-carry unwind, with the Nikkei -12.4% in a day, and April 7 to 10, 2025 spanned the U.S. reciprocal-tariff announcement and the 90-day pause. On its biggest days this stock traded with the market and with Japan's AI cable names, not on company news.
- The sell-off right after the peak looked the same. On June 10, five sessions after the high, Sumitomo Electric fell -11.7%, Furukawa Electric -11.7%, and Fujikura -6.8%, while the Nikkei slipped -1.9%. By July 29 the shares closed at ¥2,072, and they finished July 31, results day, at ¥2,184.
- Outside view (Nikkei, June 10, 2026): The day's market report headlined a sharp fall in Fujikura and loss-cutting sales across AI and semiconductor stocks. Sumitomo Electric published nothing that day, and I found no company-specific reason for its drop in the company's materials.
Sumitomo Electric Operating Profit by Segment
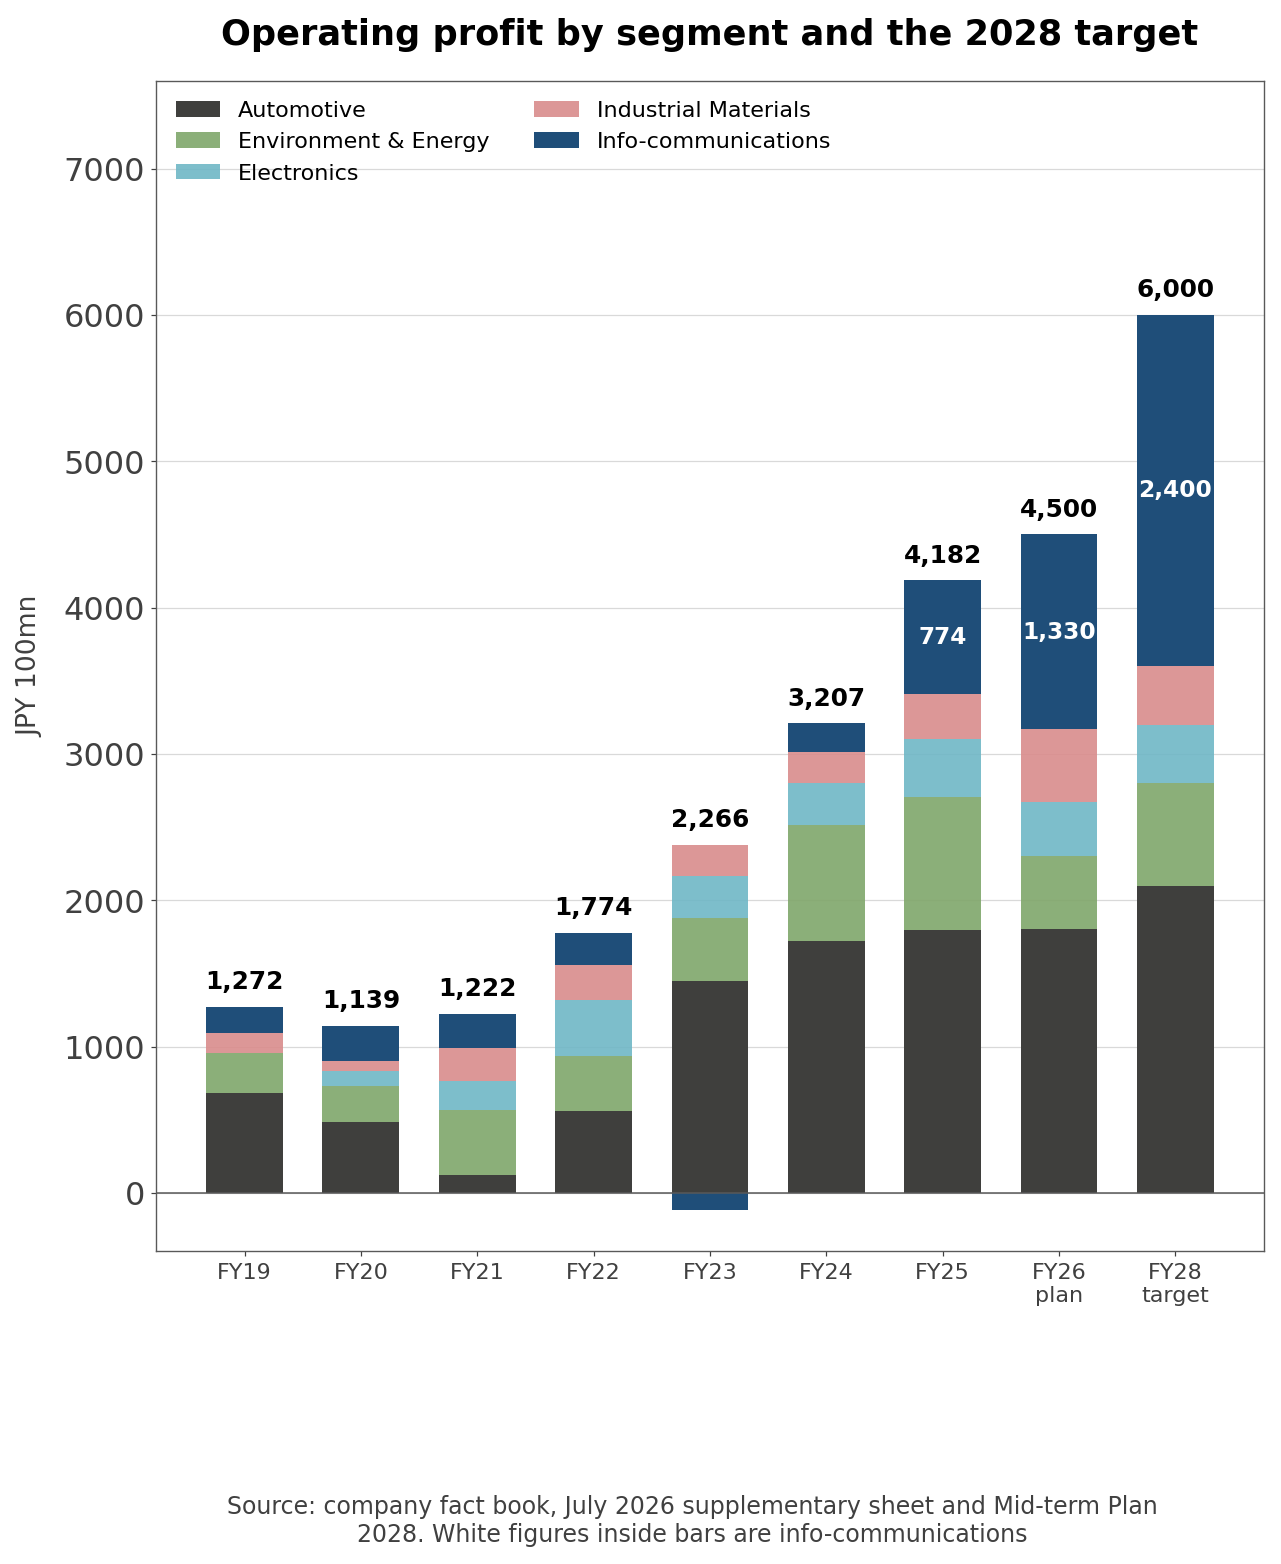
- Fiscal 2025 segment sales ran Automotive ¥2.94 trillion, Environment and Energy ¥1.18 trillion, Electronics ¥409.1 billion, Industrial Materials ¥388.4 billion and Info-communications ¥326.6 billion. Operating profit ranks differently: Automotive ¥179.7 billion, Environment and Energy ¥90.6 billion, Info-communications ¥77.4 billion, Electronics ¥39.5 billion and Industrial Materials ¥31.4 billion. Info-communications earned a 23.7% margin; Automotive earned 6.1%.
- The product lines behind those numbers: harnesses and auto electrical parts (¥2.28 trillion) and Sumitomo Riko's rubber and hoses (¥653.2 billion) in Automotive; power cables, equipment and installation (¥338.5 billion), rectangular magnet wire for EV drive motors (¥194.2 billion), copper wire rod (¥177.9 billion) and Nissin Electric (¥174.1 billion) in Environment and Energy; flexible printed circuits (¥121.6 billion) in Electronics; and cemented carbide tools (¥129.9 billion) in Industrial Materials.
- The June quarter split the segments apart. Automotive sales were +19.7% but operating profit went from ¥26.6 billion to ¥26.0 billion, -2.1%. Industrial Materials profit tripled to ¥17.0 billion, Electronics profit was +86.4%, and Info-communications profit grew 3.35 times. The company blamed lower volumes and higher costs from the Middle East situation, plus copper prices, for the auto shortfall.
- Company disclosure (fiscal 2025 results briefing Q&A summary, June 2026): Management said, "Since taking office as President, I have aimed to expand businesses outside the Automotive segment and reduce its share to below 50%." It added that under the new plan the info-communications profit share will exceed automotive and reach 40%.
Info-Communications Sales by Product
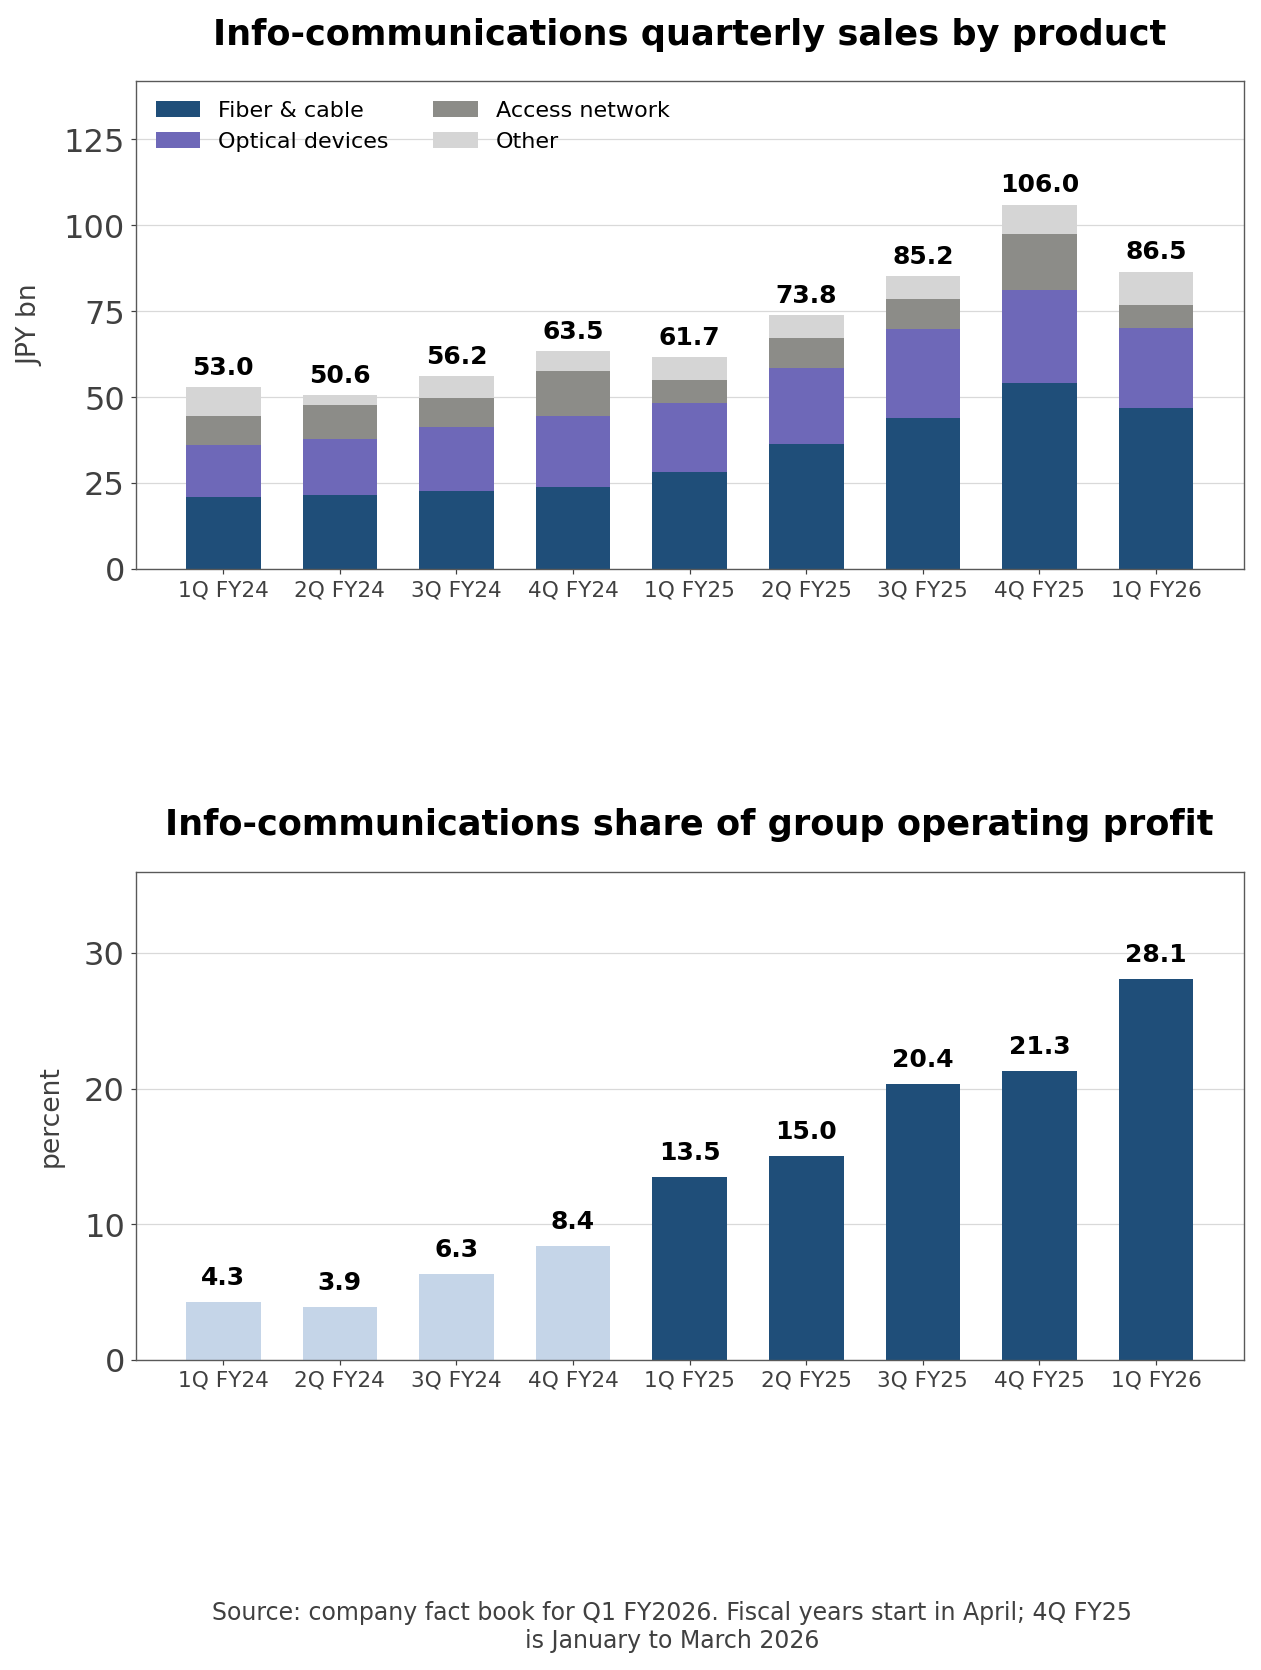
- Info-communications earned ¥27.2 billion in the June quarter, 28.1% of group operating profit. Two years earlier the same quarter produced ¥2.3 billion, or 4.3%. Sales were ¥86.5 billion, just 6.5% of the group, at a 31.5% margin.
- The segment reports four product lines. Optical fiber, cable, connectors and fusion splicers were the largest at ¥46.7 billion; optical and electronic devices, which include the EML and CW-LD laser chips inside data center transceivers, were ¥23.3 billion; access network equipment for telecom carriers was ¥6.9 billion. Against the June 2024 quarter, the fiber line is 2.2 times larger and the devices line 1.6 times larger.
- Company disclosure (data center business strategy slides, November 2025): The company maps its products across the data center: ultra-high-fiber-count cable between buildings, high-density connectors between racks, EML and CW-LD chips in transceivers, and the InP wafers those chips are grown on.
- The segment margin rose from 23.7% in fiscal 2025 to 31.5% in the June quarter. The revised fiscal 2026 plan implies 26.6%, and the fiscal 2028 target is 24.7%. The plan assumes margins well below what the segment is already earning, and management's stated reason is outsourcing, covered below.
Is Sumitomo Electric Stock Expensive?
- Fiscal year-end multiples jumped in fiscal 2025. Prices are split-adjusted, the dividend yield uses that year's dividend, and free cash flow is operating plus investing cash flow from the fact book.
| Fiscal year-end | Year-end price (¥) | P/E | P/B | Dividend yield | FCF (¥bn) |
| Mar 2022 | 365.5 | 11.8x | 0.64x | 3.4% | -89.4 |
| Mar 2023 | 424.3 | 11.7x | 0.70x | 2.9% | 117.4 |
| Mar 2024 | 588.6 | 12.3x | 0.83x | 3.3% | 269.7 |
| Mar 2025 | 616.5 | 9.9x | 0.84x | 3.9% | 178.3 |
| Mar 2026 | 2,095.0 | 17.7x | 2.38x | 1.8% | 250.3 |
- The March 2026 P/E includes the Sumitomo Densetsu gain; excluding it, the multiple was 21.8x.
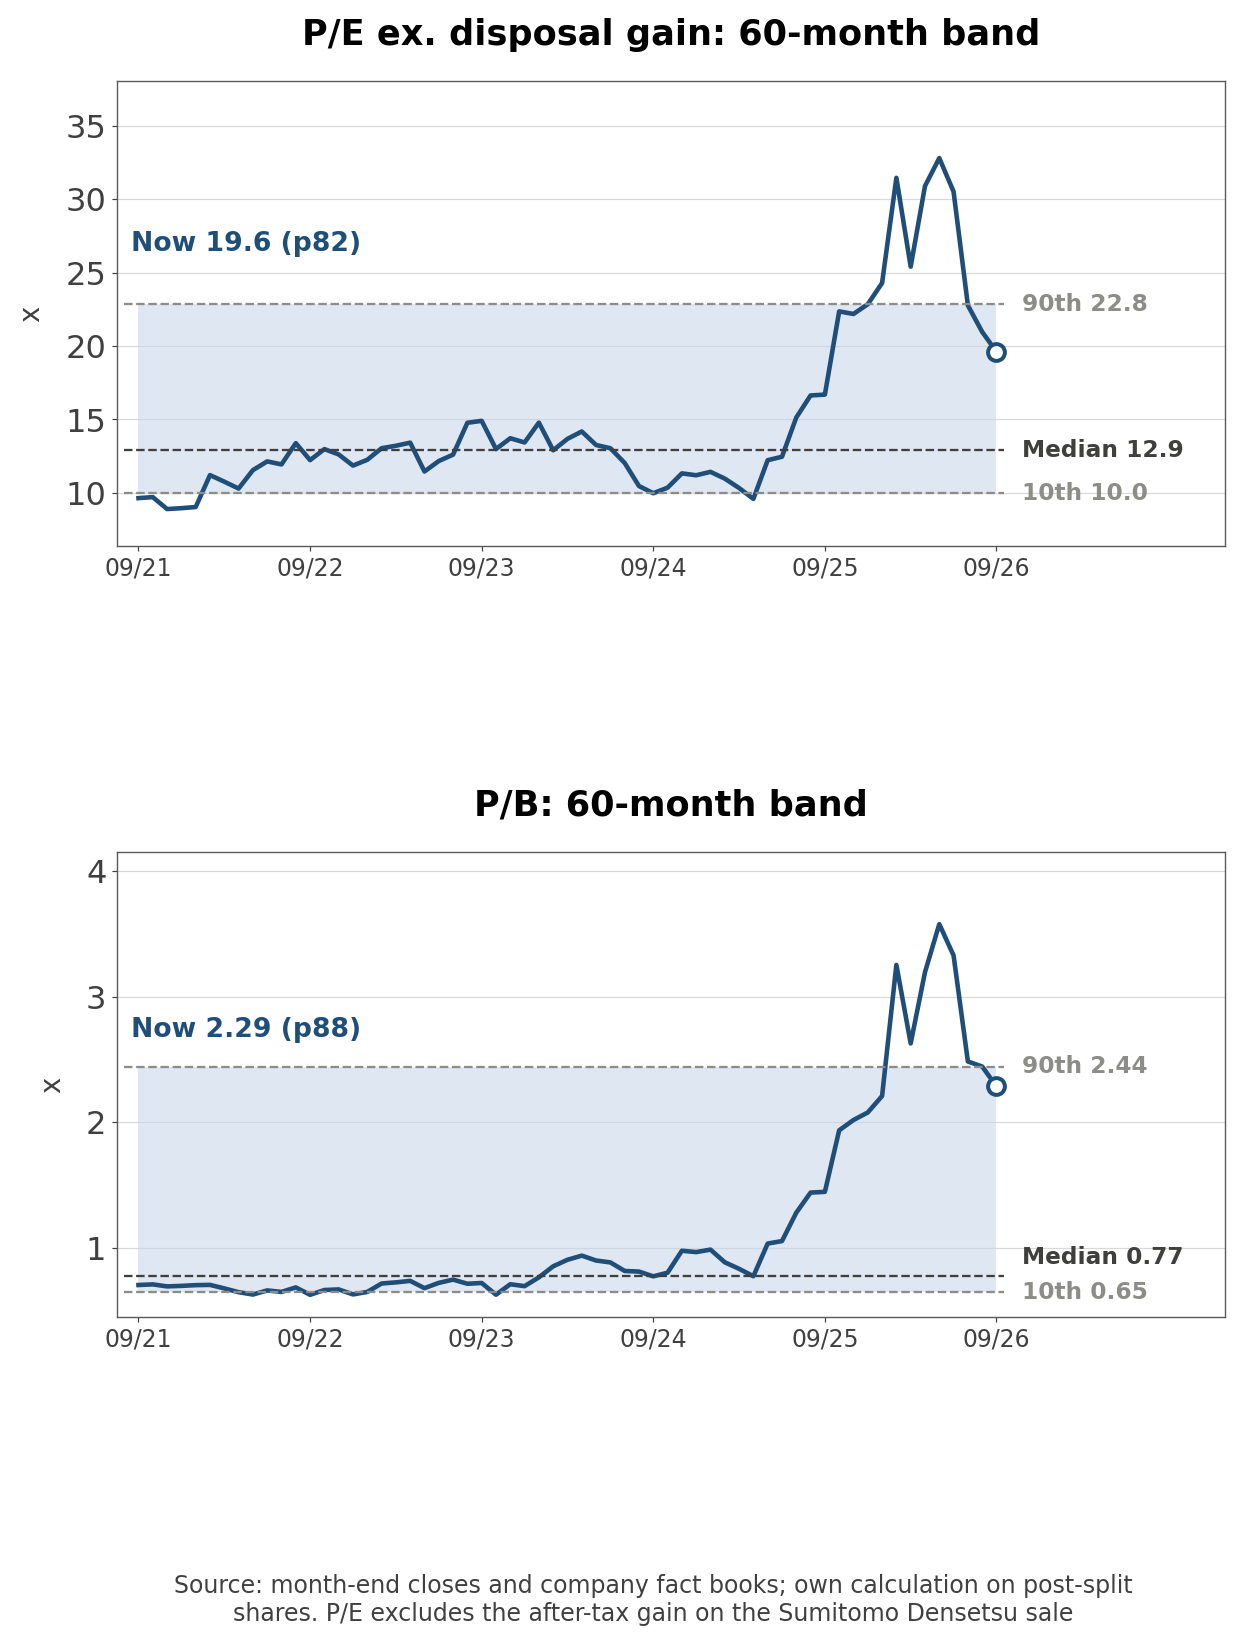
- Own calculation (60 month-end closes plus fact book quarterly profit and equity): For each month from September 2021 to August 2026 I used the latest quarter published by that month-end, took trailing-twelve-month (TTM) net income and quarter-end equity, and rebuilt both multiples. The share count is held at the post-split average; dividing net income by EPS gives the same share count within 0.2% in all seven fiscal years, so holding it constant barely moves the ratios.
- P/B is 2.29x, 2.95 times its 60-month median of 0.77x and above 88% of the observations; the range ran from 0.63x in September 2022 to 3.58x in May 2026. TTM P/E excluding the disposal gain is 19.6x against a 12.9x median and a 22.8x 90th percentile. On reported earnings it is 16.17x, and on the company's full-year EPS forecast of ¥108.99 it is 19.1x.
- Aggregator cross-check (two data aggregators): One aggregator shows a trailing P/E of 16.17x and P/B of 2.29x, matching the reported-basis calculation to two decimals, and a five-year median P/B of 0.76x.
- P/B nearly tripled while ROE roughly doubled, from 5.7% in fiscal 2021 to 11.9% ex-gain. The rest of the rerating is expectation, and the next calculation asks which business it belongs to.
What Is Info-Communications Worth at Fujikura's Multiple?
- Fujikura earned ¥188.7 billion of operating profit on ¥1.18 trillion of revenue in the year to March 2026 and is worth ¥8.25 trillion. A company with 23.1% of Sumitomo Electric's revenue carries a market value ¥1.77 trillion higher.
- Own calculation (market caps and latest fiscal-year operating profit): Fujikura trades at 43.7 times operating profit. Applied to Sumitomo Electric's ¥77.4 billion of info-communications profit, that multiple gives ¥3.38 trillion, 52.2% of the group's market cap. The remaining ¥3.10 trillion over the other four segments' ¥340.7 billion of profit works out to 9.1x. On the same yardstick Furukawa Electric is 43.9x, Corning 62.8x, Prysmian 25.3x, Nexans 14.3x, and Sumitomo Electric as a whole 15.5x.
- This ignores net debt, the ¥848.9 billion of investment securities and tax differences, so treat it as a rough frame. It still points one way. If the market pays Fujikura's multiple for info-communications, it values autos, energy, electronics and materials at about 9 times profit. If instead the other segments earn a Nexans-like 14.3x, info-communications is being valued at 20.8x, 48% of Fujikura's multiple.
- Which reading is closer depends on whether segment profit grows on plan. Put the revised fiscal 2026 info-communications target of ¥133.0 billion through the same 43.7x and the segment alone equals 89.7% of the market cap.
Why Info-Communications Sales Fell Quarter on Quarter
- Info-communications sales were ¥86.5 billion in the June quarter, ¥19.5 billion or -18.4% below the March quarter's ¥106.0 billion. Year on year they were +40.2%, and the company only explains the year-on-year change, so nothing in the results package addresses the sequential drop.
- By product, access network equipment fell from ¥16.5 billion to ¥6.9 billion, fiber and cable from ¥54.0 billion to ¥46.7 billion, and devices from ¥27.0 billion to ¥23.3 billion, while other items rose ¥1.1 billion. Access equipment peaks in the March quarter; the same seam a year earlier also lost ¥6.5 billion there, but total segment sales then moved only -2.8%.
- Strip out access equipment and the two data center lines still lost ¥11.0 billion. Segment operating profit fell from ¥31.3 billion to ¥27.2 billion, -13.1%.
- Company disclosure (fiscal Q1 2026 supplementary sheet, pages 9 and 11): The company raised its full-year operating profit forecast to ¥450.0 billion, saying "we revised earnings forecast upward because Q1 results exceeded expectations," and built in a Middle East hit of ¥14.0 billion for the first half and ¥23.0 billion for the year.
- The revised first-half plan leaves info-communications sales at ¥200.0 billion and lifts segment profit from ¥51.0 billion to ¥54.0 billion. Subtract the June quarter and the September quarter needs ¥113.5 billion of sales, +31.2% sequentially, and ¥26.8 billion of profit. Hitting the full-year ¥500.0 billion and ¥133.0 billion then requires ¥300.0 billion and ¥79.0 billion in the second half.
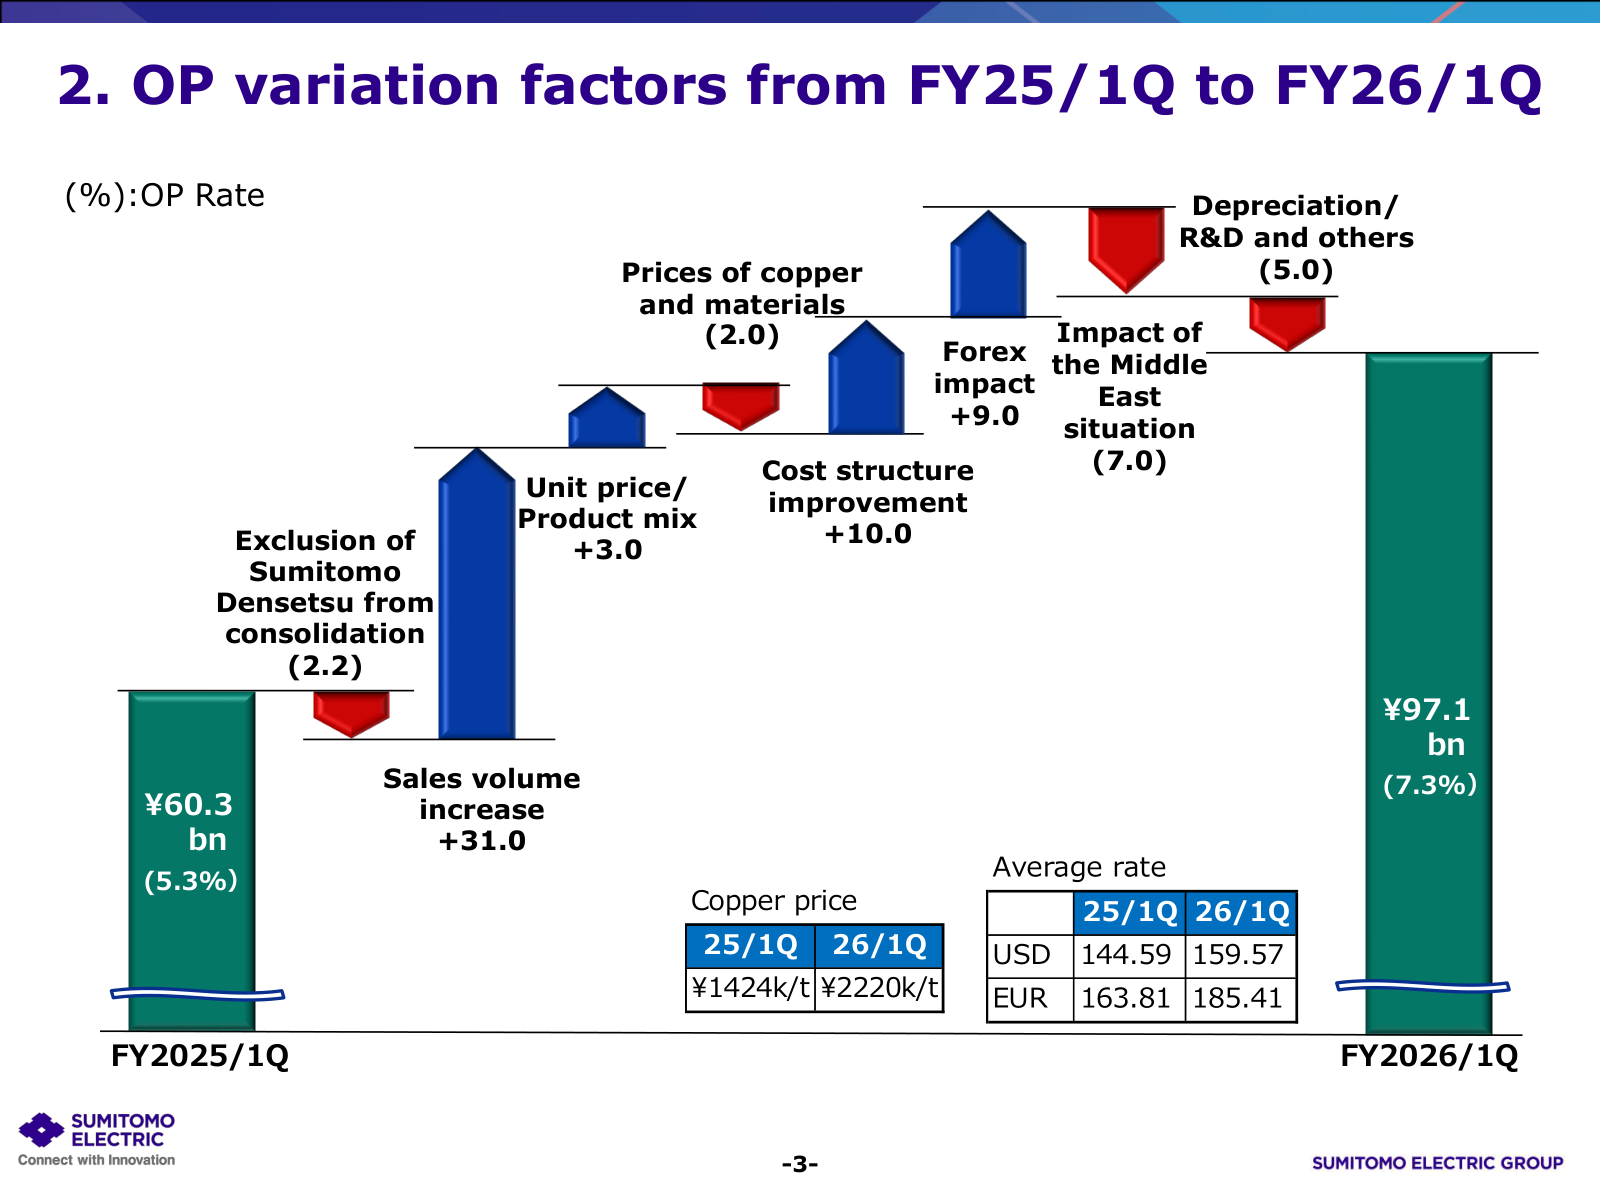
- Company disclosure (fiscal Q1 2026 supplementary sheet, page 3): Operating profit rose from ¥60.3 billion to ¥97.1 billion. The company attributes ¥31.0 billion to volume, ¥10.0 billion to cost structure, ¥9.0 billion to foreign exchange and ¥3.0 billion to price and mix, offset by ¥7.0 billion from the Middle East situation, ¥5.0 billion of depreciation and R&D, ¥2.2 billion from deconsolidating Sumitomo Densetsu and ¥2.0 billion from copper and materials.
- Currency supplied 24.5% of the increase. The dollar averaged ¥159.57 in the quarter against ¥144.59 a year earlier, and the plan assumes ¥150 from the second quarter. A yen that stays weak adds profit the plan does not count; a move back to ¥150 removes it.
| Number | Value | Why it matters |
| Info-communications share of Q1 operating profit | 28.1% | The rerating case rests on it; it was 4.3% two years earlier |
| Info-communications sales vs the March quarter | -18.4% | First test of whether capacity turns into quarterly revenue |
| P/B (60-month median 0.77x) | 2.29x | A near threefold rerating is already in the price |
| Info-communications value at Fujikura's multiple | 52.2% | Leaves only 9.1x for the other four segments |
| Currency effect in the Q1 profit increase | ¥9.0 billion | 24.5% of the ¥36.8 billion gain came from the weak yen |
Segment Profit Targets in the 2028 Mid-Term Plan
- Company disclosure (Mid-Term Management Plan 2028, May 2026): For fiscal 2028 the company targets ¥6.0 trillion of revenue, ¥600.0 billion of operating profit, pre-tax ROIC above 15% and ROE above 13%. The plan assumes ¥150 per dollar, ¥170 per euro and copper at ¥1.9 million per tonne, with ¥1.0 trillion of cumulative capex, ¥540.0 billion of R&D and a 35% to 40% payout ratio.
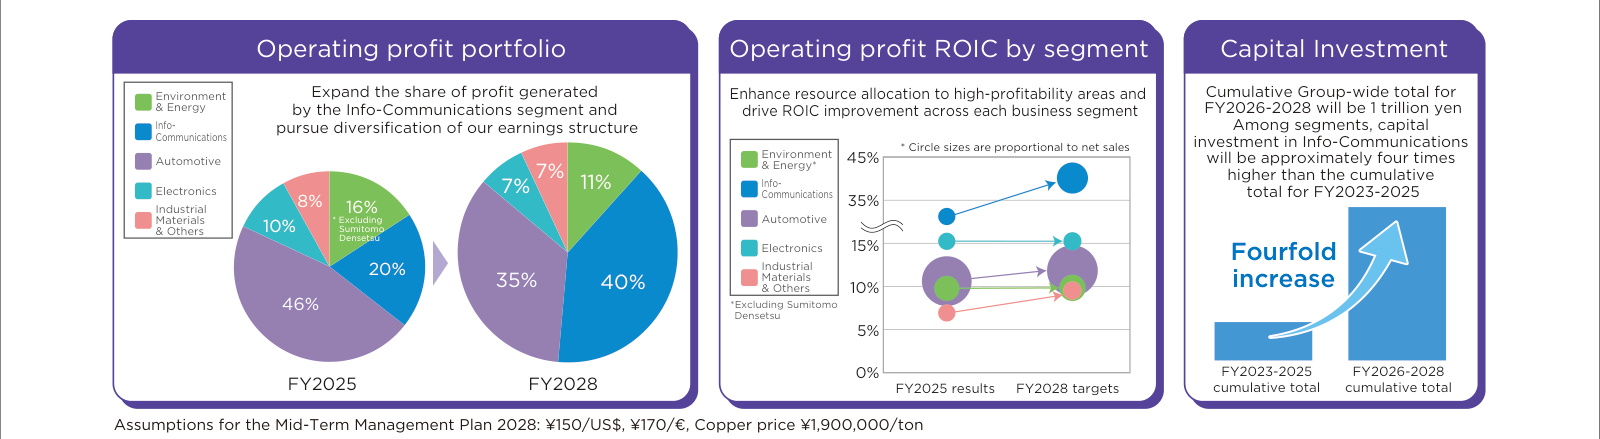
- Info-communications carries the plan. Revenue goes from ¥326.6 billion to ¥970.0 billion (2.97 times) and operating profit from ¥77.4 billion to ¥240.0 billion (3.1 times). The slide's profit portfolio moves the segment from 20% to 40% of group profit, with Automotive going from 46% to 35% and Environment and Energy from 16% to 11%. Its stated aim is to "expand the share of profit generated by the Info-Communications segment and pursue diversification of our earnings structure." In the Q&A the company said about 25% of the ¥1.0 trillion capex goes to info-communications and about 40% to Automotive.
- Checked against the filings, the margin target stands out. The segment earned 23.7% in fiscal 2025 and 31.5% in the June quarter, yet the fiscal 2028 target is 24.7%, 6.8 points below the latest quarter while revenue triples.
- Company disclosure (fiscal 2025 results briefing Q&A summary, June 2026): Asked why profit grows more slowly than sales, the company said "we plan to partially utilize external manufacturers for certain processes in optical connector products; however, this is more costly than in-house production," and that it intends to raise the in-house ratio over time. It also said "the primary driver of the net sales increase in the mid-term plan is volume growth."
- Outsourcing was the only reason given. Getting from the revised fiscal 2026 segment profit of ¥133.0 billion to ¥240.0 billion in fiscal 2028 needs +34.3% a year. If the June-quarter margin holds, the profit target arrives before the revenue target; if outsourcing costs run higher, that quarter's margin may prove the high-water mark for the year.
- Company disclosure (fiscal 2025 fact book, capex and depreciation tables): The fiscal 2026 plan lifts group capex from ¥243.2 billion to ¥350.0 billion and info-communications capex from ¥23.7 billion to ¥72.0 billion, while segment depreciation goes from ¥16.0 billion to ¥19.0 billion.
- Segment capex triples in a single year, yet depreciation grows only +18.8%. Depreciation trails new equipment, so the margin once all the new lines run exists only as a plan number. Pre-tax ROIC follows a dip-then-rise path too: 14.7% in fiscal 2025 (12.5% ex-gain), 11.9% planned for fiscal 2026, above 15% by fiscal 2028.
- Management told analysts that "all hyperscalers are continuing to maintain robust investment plans," and that customers' outlooks through 2030 would require at least doubling optical device capacity beyond the fiscal 2028 level. It also expects segment ROIC near 40%, lifting the group toward its 15% target. The plan's broader bucket of green and digital products goes from ¥2.0 trillion in fiscal 2025 to ¥3.5 trillion in fiscal 2028, and info-communications, needing +43.7% a year from ¥326.6 billion to reach ¥970.0 billion, is the fastest line in it.
Optical Connector and Device Capacity: How the Plan Changed
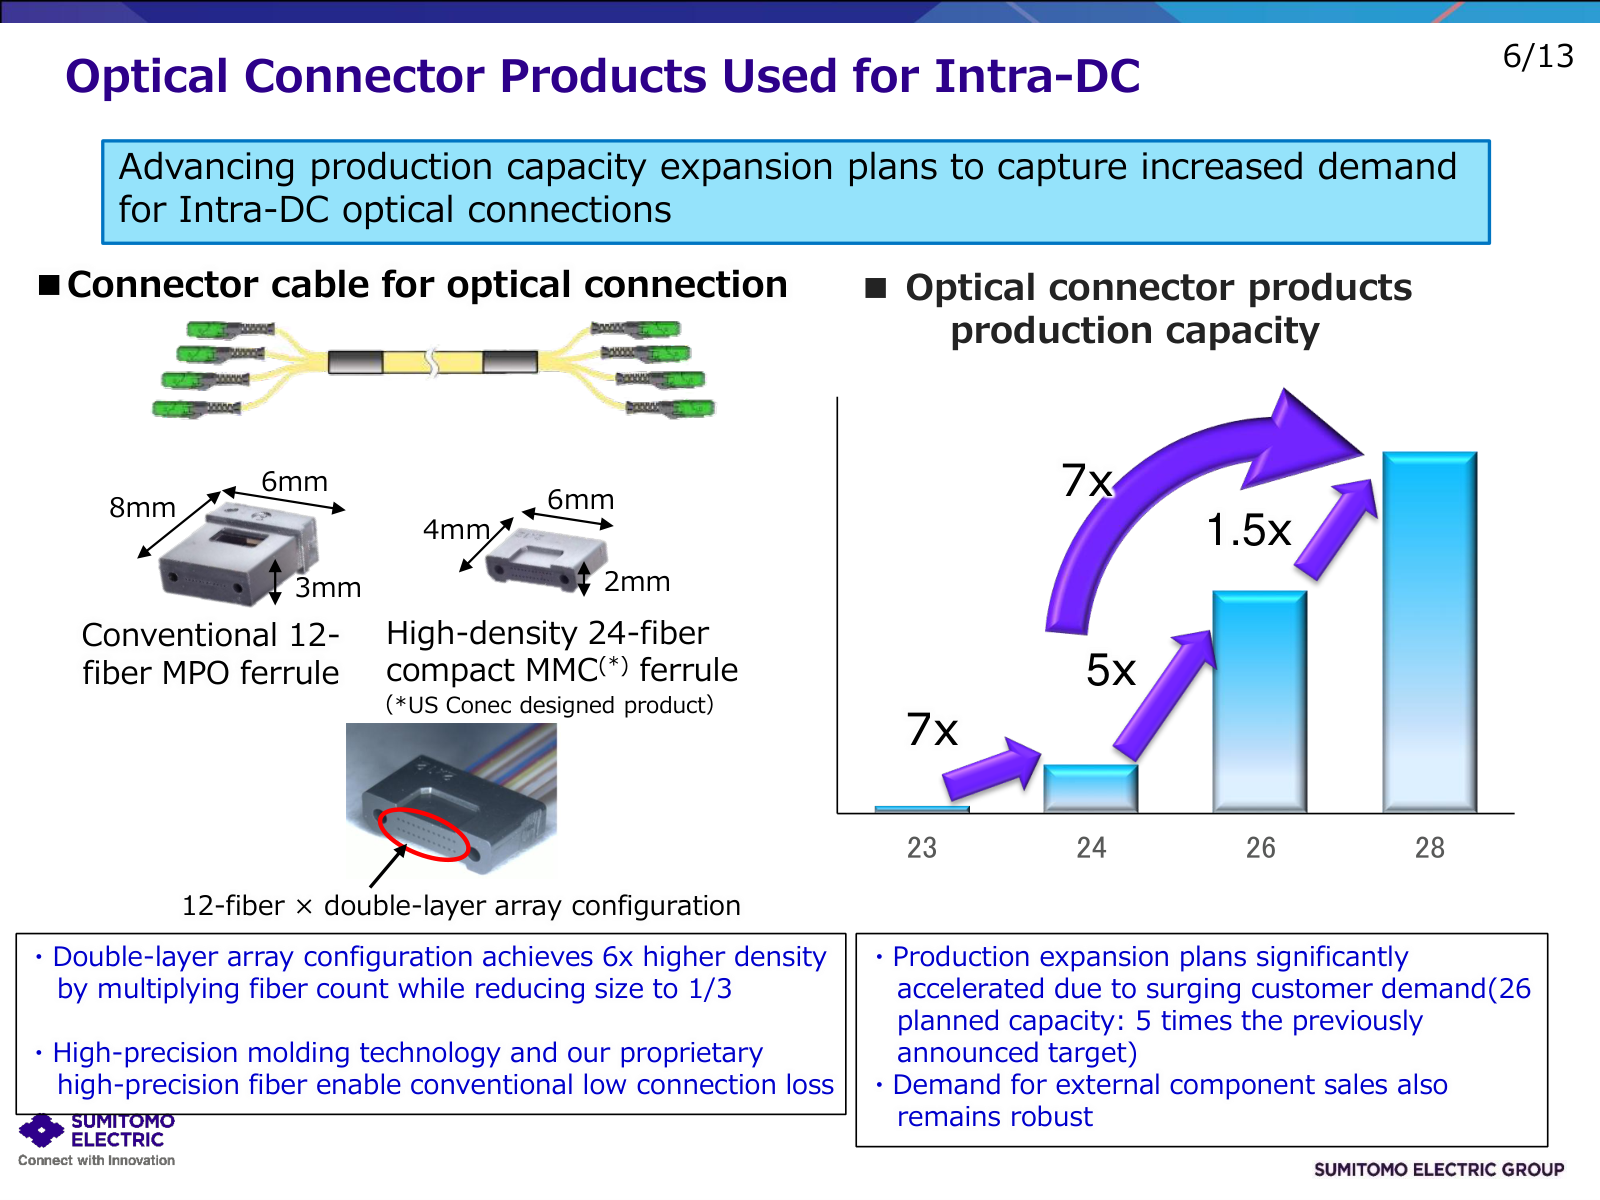
- The November 2025 data center slides planned optical connector capacity at 5 times the 2024 level by 2026 and a further 1.5 times by 2028. The May 2026 results deck drew the same 2024-to-2028 goal at 13 times. Multiplying November's two steps gives about 7.5 times, so the 2028 goal grew 1.73 times in six months. The November slide also noted that the 2026 capacity plan was "5 times the previously announced target," which means this goal was raised twice within a year.
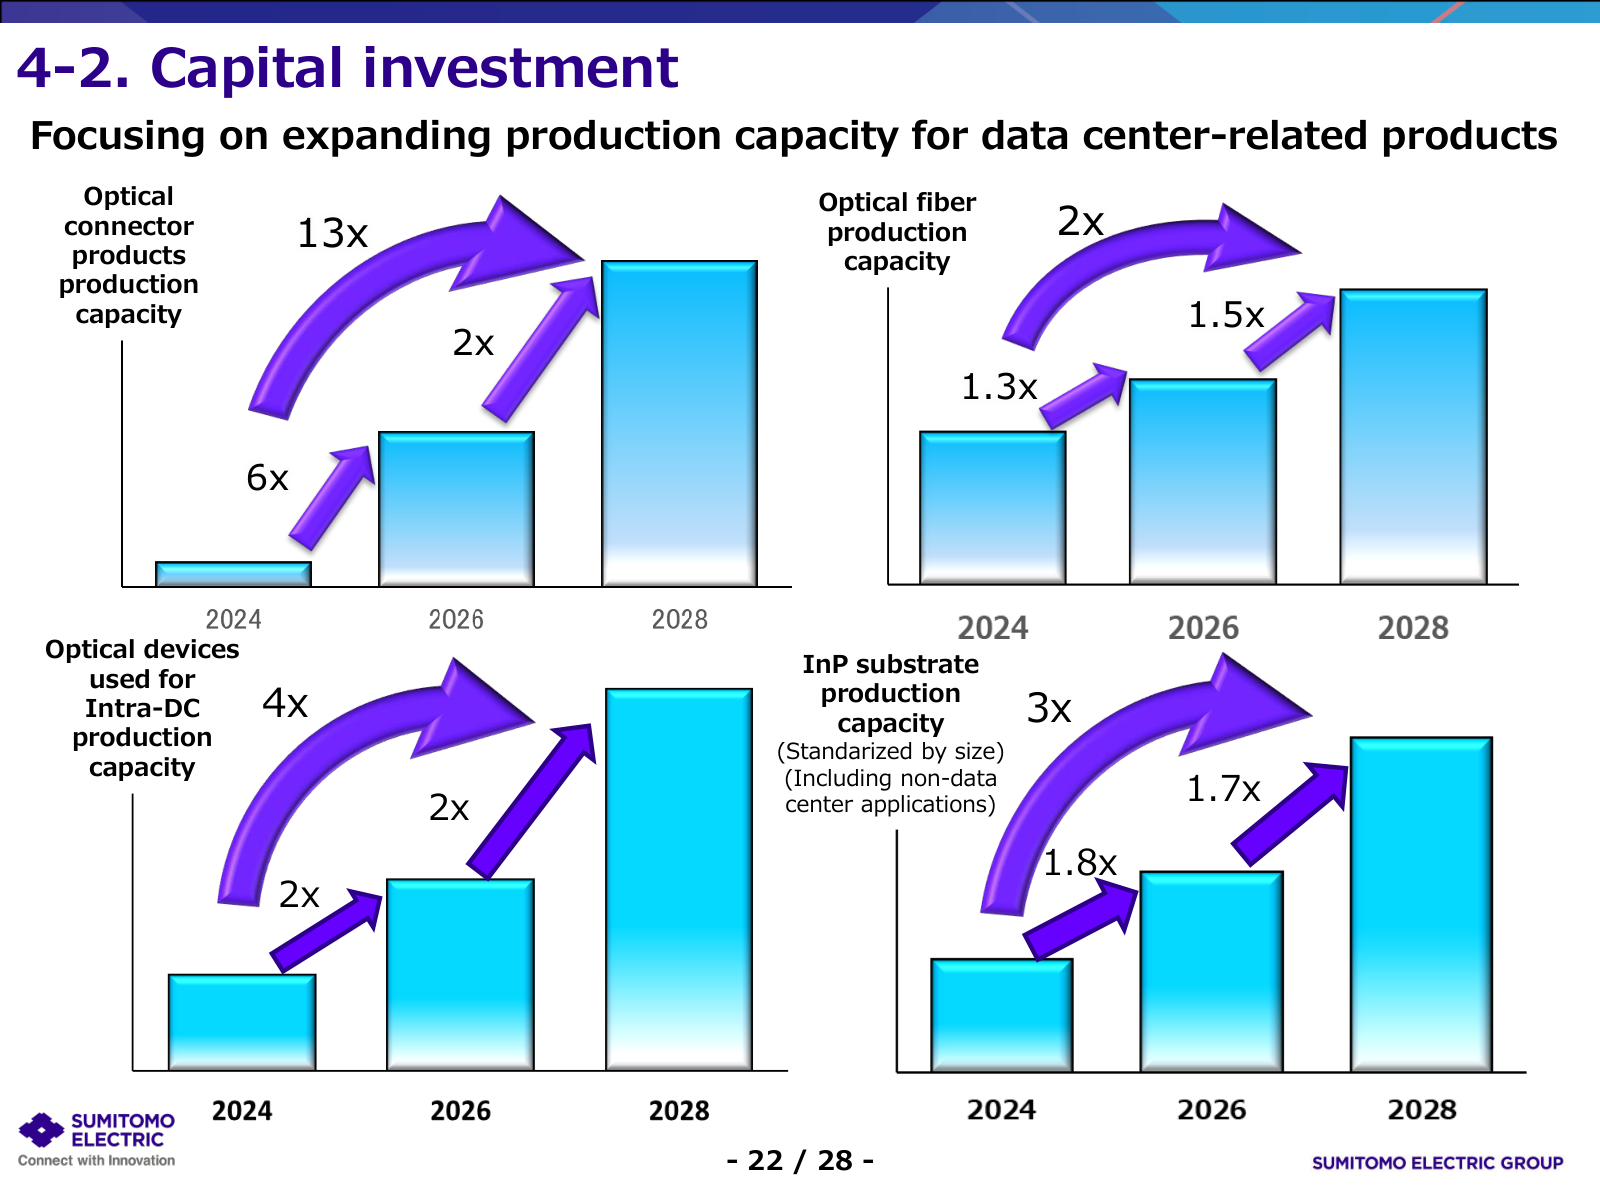
- The May slide shows four capacity lines against 2024: optical connectors 13 times (6 times by 2026, then 2 times), optical fiber 2 times (1.3 then 1.5), intra-data-center optical devices 4 times (2 then 2), and InP substrates 3 times (1.8 then 1.7). November's device plan was 2 times to 2026 and 1.4 times to 2028, so the device goal rose from about 2.8 times to 4 times.
- November stated optical devices at 12 times and InP substrates at 2.4 times against a 2023 base, while May switched the base year to 2024. InP cannot be compared across the two decks on the same basis, which is why only connectors and devices are compared above.
- Company disclosure (fiscal 2025 results briefing Q&A summary, June 2026): The company said it had "since revised the plan upward through additional capital investment and productivity improvements," that connector capacity has a relatively short lead time if demand beats expectations, and that it can secure optical fiber in a tight market because it has long sold preforms to overseas fiber-drawing makers. A decision on expanding preform capacity will follow a look at demand from fiscal 2029, and today's capex plan does not include it.
- The number to test is the gap between capacity and sales. Device capacity doubles by 2026, but June-quarter device sales of ¥23.3 billion were 1.6 times the June 2024 quarter and -13.7% below the March quarter. Fiber capacity is 1.3 times by 2026 while the fiber-and-cable line is already 2.2 times its June 2024 level, though that line includes connectors, so the two ratios do not map one to one. The September quarter's product split will be the first real read on how fast new equipment shows up in revenue.
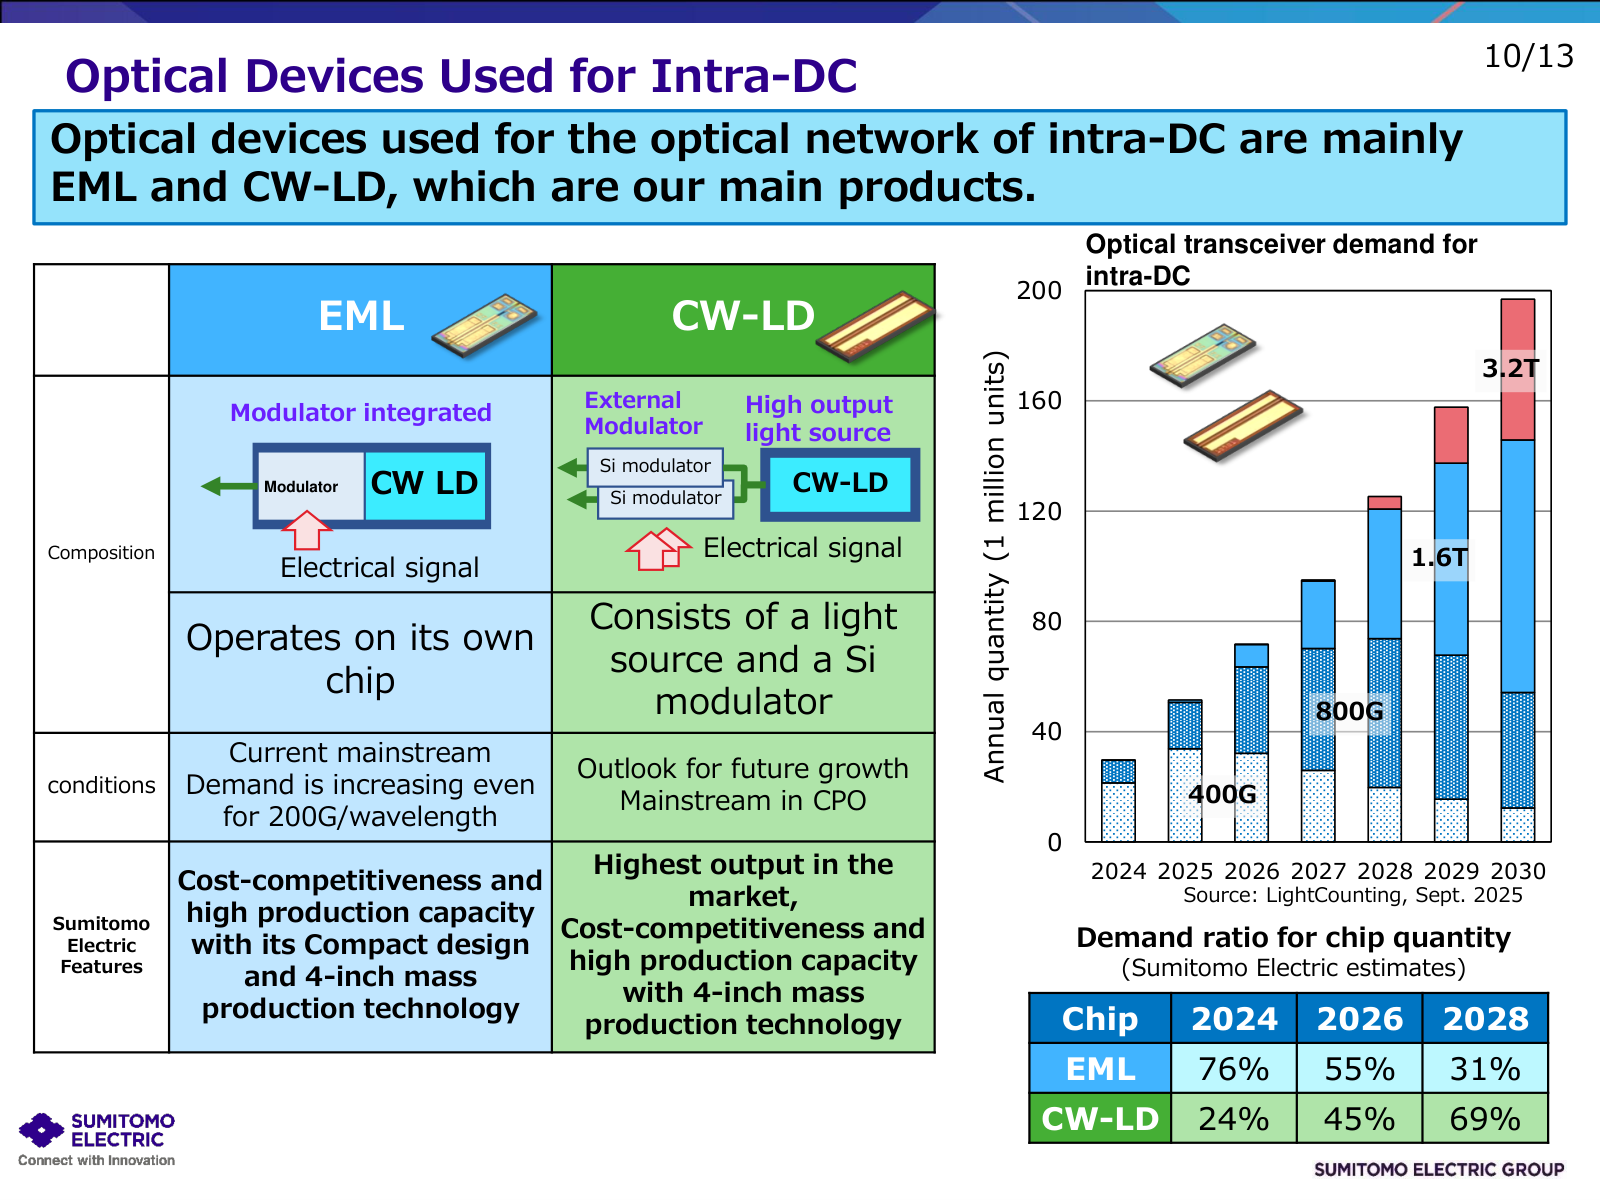
- Company disclosure (data center business strategy slides, page 10, November 2025): The company estimates that EML accounts for 76% of intra-data-center transceiver laser chips in 2024 and 31% in 2028, with CW-LD at 24% and 69% in the same years. An EML modulates on the chip; a CW-LD is a light source that feeds a silicon modulator and is the mainstream choice for co-packaged optics (CPO). The same page's demand chart, citing LightCounting, shows annual intra-data-center transceiver units rising from about 30 million in 2024 toward 200 million by 2030.
- On CPO timing the company is careful. It said its ultra-high-output CW-LD is in final sampling and qualification, with pilot shipments by the end of fiscal 2026 and a ramp from fiscal 2027, and that it was selected as one of NVIDIA's silicon photonics ecosystem partners. It also said "we maintain a cautious view regarding whether CPO will scale rapidly in the near term," and that multicore fiber adoption is taking longer than expected.
What the Street Says vs the Filings
- The AI case for Sumitomo Electric runs from hyperscaler spending to a rerating. I split the version that repeats across Japanese broker notes and business press into ten claims and checked each against company filings and market data.
| # | The thesis | Evidence | Verdict |
| 1 | North American hyperscalers keep raising data center spending | Management Q&A; Corning 2025 revenue +19.1% | Partly holds |
| 2 | Optical links grow faster than server counts | Company transceiver outlook citing LightCounting; 800G to 1.6T shift | Partly holds |
| 3 | The company supplies connectors, fiber, EML, CW-LD and InP substrates | Fact book product lines; data center slides page 3 | Holds |
| 4 | New capacity triples info-communications revenue | ¥970.0 billion target; Q1 sales -18.4% sequentially; Q2 needs ¥113.5 billion | Conditional |
| 5 | A 40% optical profit share ends the auto-parts discount | Q1 share 28.1%; P/B from a 0.77x median to 2.29x | Partly holds |
| 6 | CW-LD keeps the company inside the NVIDIA CPO ecosystem | Partner selection is a company statement; pilot shipments end of fiscal 2026; management cautious | Conditional |
| 7 | Grid spending lifts high-voltage DC cable demand too | Power cable sales ¥338.5 billion; European plant in fiscal 2027; segment profit plan ¥50.0 billion | Partly holds |
| 8 | Preform capacity secures fiber supply in a shortage | Q&A explanation only; no volume or share disclosed | Unverified |
| 9 | A weak yen lifts earnings | ¥9.0 billion of the ¥36.8 billion Q1 increase; plan assumes ¥150 | Holds |
| 10 | Even without the disposal gain the stock is 16 times earnings | 16.17x includes the gain; 19.6x without it; 12.9x median | Wrong |
- Two claims hold, four partly hold, two are conditional, one is unverified and one is wrong. Claim 4 carries the most weight: if capacity does not turn into revenue, the rerating in claim 5 loses its footing, and claims 6 and 7 are fiscal 2027 stories that cannot support this year's share price.
5802 Price Targets and Analyst Revisions

- Aggregator cross-check (aggregated sell-side research, 14 EPS estimates): Average fiscal 2026 EPS is ¥112.80, ¥3.81 above the company's ¥108.99, with ¥134.61 for fiscal 2027 and ¥160.01 for fiscal 2028. A second aggregator's 11-analyst average is ¥114.95, above ¥110.37 ninety days earlier, with six upward estimate revisions and one downward in the last 30 days.
| Date | Broker | Rating | Target (¥, post-split) |
| 2026-09-11 | Mizuho | Buy, maintained | 3,125 to 2,600 |
| 2026-09-07 | SBI | Buy, maintained | 3,768 to 3,330 |
| 2026-09-02 | SMBC Nikko | 1, maintained | 3,850 to 3,870 |
| 2026-08-26 | Mito | Upgrade B+ to A | 3,500 to 3,200 |
| 2026-08-21 | Daiwa | 2, maintained | 3,875 to 2,700 |
| 2026-08-10 | Jefferies | Buy, maintained | 5,150 to 5,300 |
| 2026-08-04 | Nomura | Buy, maintained | 3,775 to 3,020 |
| 2026-08-03 | Goldman Sachs | Buy, maintained | 3,400 to 3,300 |
| 2026-07-07 | UBS | Buy, maintained | 3,845 |
| 2026-06-29 | Morgan Stanley MUFG | Equal-weight, maintained | 3,625 |
| 2026-06-12 | CLSA | Upgrade Hold to Outperform | 3,000 |
- Of eight brokers that changed targets since August, six cut and two raised, and Daiwa went from ¥3,875 to ¥2,700, -30.3%. The eleven targets set since June average ¥3,435, from a low of ¥2,600 to a high of ¥5,300. Ten of eleven ratings are positive, yet the targets are moving down.
- Company disclosure (fiscal 2025 results briefing, May 22, 2026, online): The company held no earnings call for the June quarter, so the most recent management Q&A is the May briefing summary. On dividends it said "while we have not explicitly committed to a progressive dividend policy, we understand that the capital market expects continued dividend growth," which is why it widened the payout target to 35% to 40%.
Who Owns Sumitomo Electric
| Shareholder | Shares held (pre-split, thousands) | Stake | Source |
| The Master Trust Bank of Japan (trust account) | 125,482 | 16.09% | Company stock information, Mar 2026 |
| Custody Bank of Japan (trust account) | 71,336 | 9.14% | Same |
| Nippon Life Insurance | 21,041 | 2.70% | Same |
| Sumitomo Life Insurance | 15,906 | 2.04% | Same |
| State Street Bank and Trust 505001 | 15,682 | 2.01% | Same |
| Government of Norway | 12,504 | 1.60% | Same |
| JPMorgan Chase Bank 385781 | 11,167 | 1.43% | Same |
| Kochi Shinkin Bank | 11,061 | 1.42% | Same |
| National Mutual Insurance Federation of Agricultural Cooperatives | 10,133 | 1.30% | Same |
| Employee Stock Ownership Association | 9,711 | 1.24% | Same |
- The top ten hold 38.97%, led by the two Japanese trust-bank accounts that custody pension and fund assets. Foreign names include State Street, the Government of Norway and JPMorgan. In November 2024 the company said it would cut strategic shareholdings by at least half within a few years; in fiscal 2025 it sold seven holdings outright and trimmed four.
- Holdings by well-known U.S. investors could not be verified: 13F reports cover U.S.-listed securities, so Tokyo-listed shares do not appear, and I found no ADR positions in 13F information tables either. No Korean company or institution appears among the top ten shareholders.
- Filing footnote (extraordinary report on the 156th AGM, filed June 30, 2026): At the June 26 meeting, approval for the 14 director nominees was 83.65% for Chairman Masayoshi Matsumoto (1,023,806 votes against), 87.33% for President Osamu Inoue, 93.34% for Executive Vice President Hideo Hatoh, and 94.87% to 99.06% for the other eleven. Director compensation passed with 99.31%.
- The report does not say why opposition concentrated on the chairman and president. The track record on promises is easier to read: the previous Mid-Term Plan 2025 targeted ¥4.4 trillion of revenue, ¥250.0 billion of operating profit and pre-tax ROIC above 8%, and the company delivered ¥5.11 trillion, ¥418.2 billion and 14.7%.
How Sumitomo Electric Compares With Fujikura and Corning
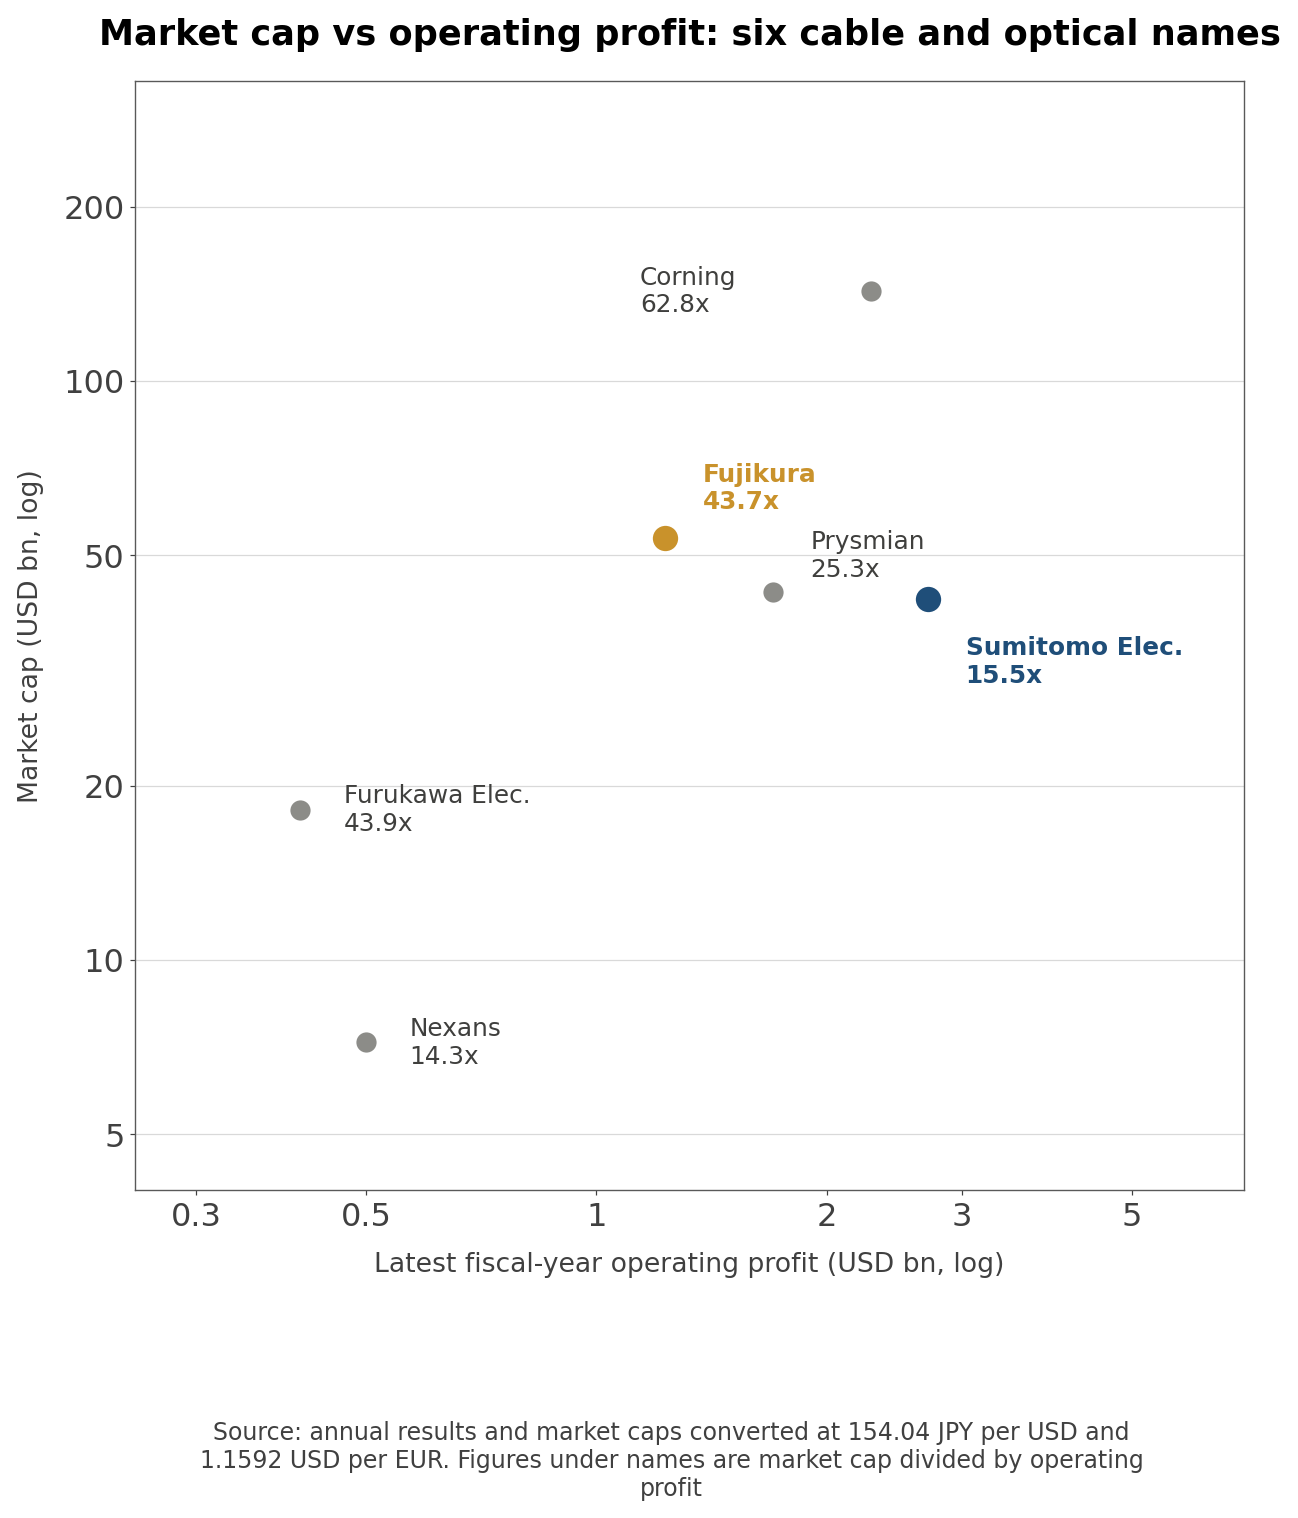
- The peer set is Japan's three cable makers (Sumitomo Electric, Fujikura and Furukawa Electric), Corning in optical fiber, and European power cable makers Prysmian and Nexans. The names priced on optical expectations (Fujikura, Furukawa Electric and Corning) trade above 40 times operating profit, while the power cable names sit at 14 to 25 times.
| Company | Ticker | Market cap ($bn) | P/E (trailing) | P/E (forward) | P/B | Revenue growth |
| Sumitomo Electric | 5802 | 42.07 | 17.5x | 19.1x (company forecast) | 2.29x | +9.2% |
| Fujikura | 5803 | 53.55 | 52.4x | 16.5x | 13.56x | +20.7% |
| Furukawa Electric | 5801 | 18.18 | 38.6x | 13.4x | 6.41x | +8.8% |
| Corning | GLW | 143.04 | 77.0x | 38.3x | 12.00x | +19.1% |
| Prysmian | PRY | 43.11 | 26.4x | 20.9x | 5.24x | +15.4% |
| Nexans | NEX | 7.20 | 33.2x | 15.5x | 2.92x | +12.9% |
| Company | Operating margin | Market cap / operating profit | ROE | Growth-adjusted P/E |
| Sumitomo Electric | 8.2% | 15.5x | 15.8% | 1.91 |
| Fujikura | 16.0% | 43.7x | 39.0% | 2.53 |
| Furukawa Electric | 4.9% | 43.9x | 22.6% | 4.39 |
| Corning | 14.6% | 62.8x | 16.8% | 4.03 |
| Prysmian | 7.5% | 25.3x | 22.4% | 1.71 |
| Nexans | 5.6% | 14.3x | 9.8% | 2.58 |
- Growth-adjusted P/E is trailing P/E divided by latest fiscal-year revenue growth; lower means cheaper relative to growth.
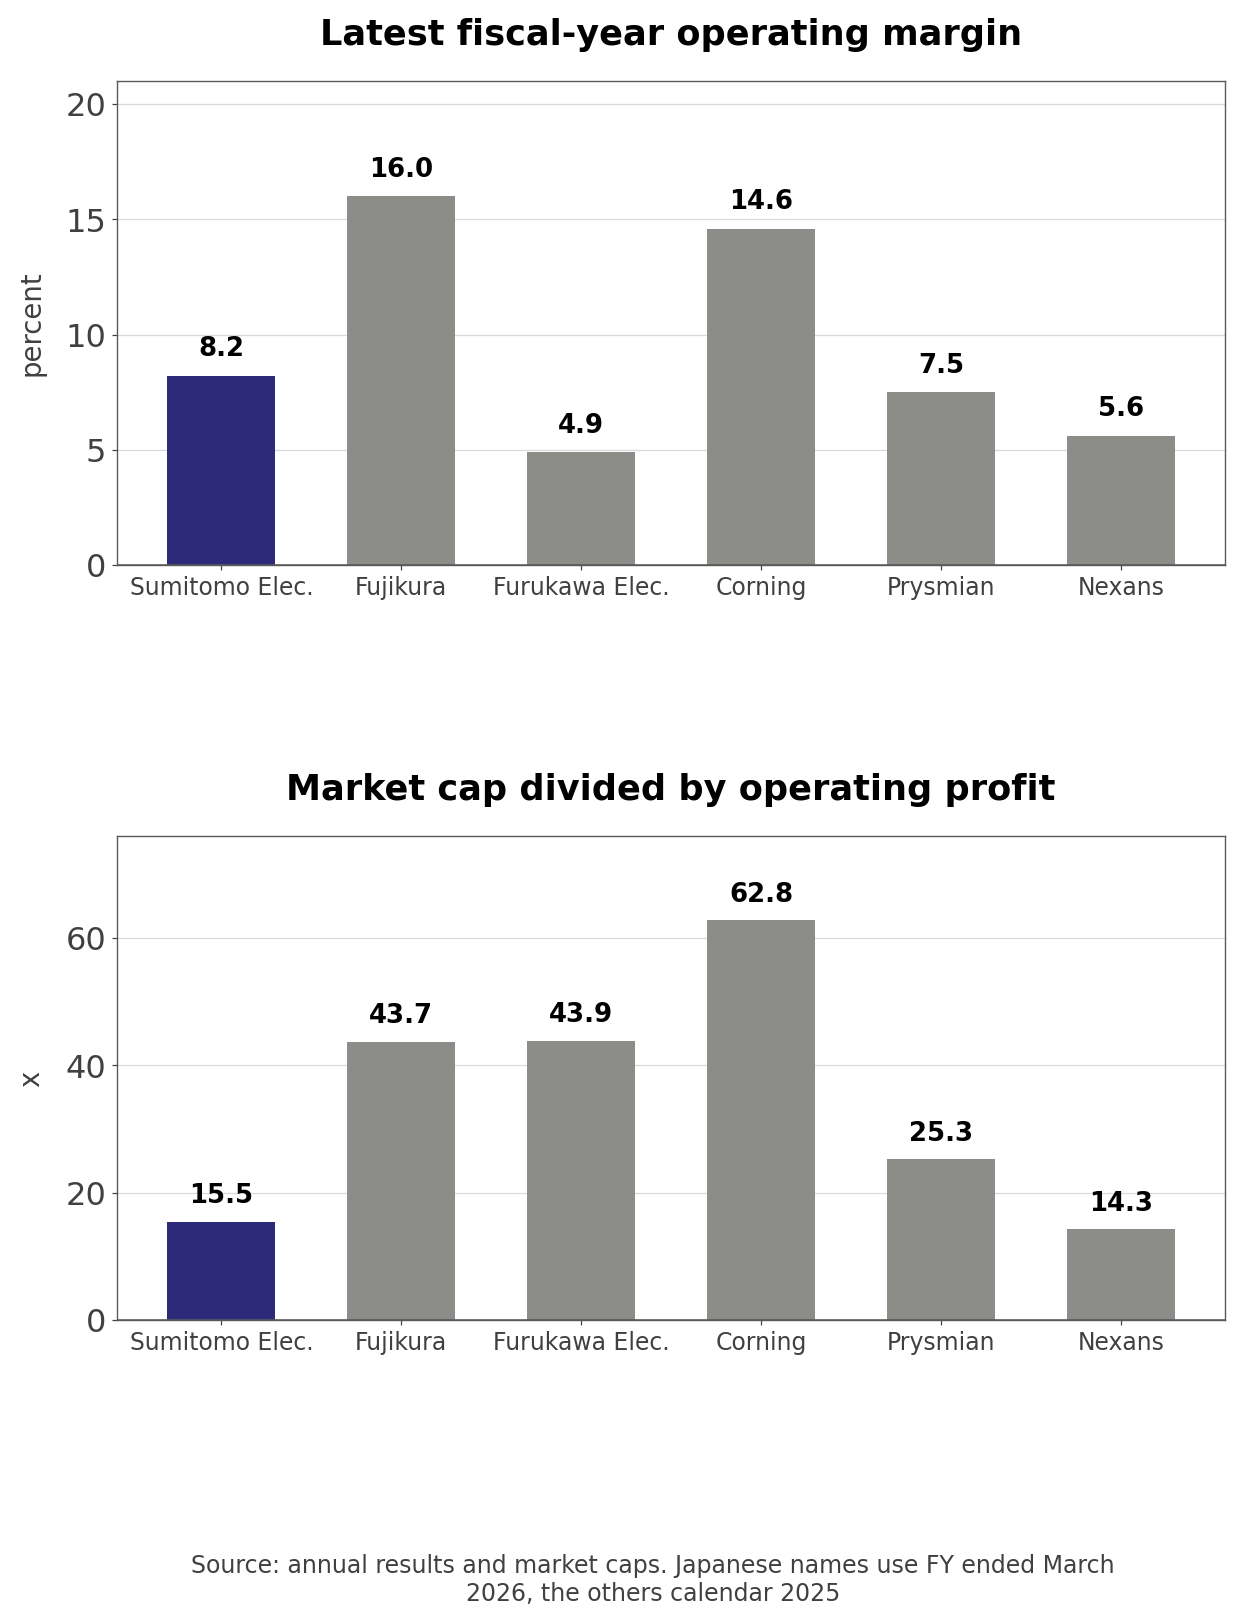
- Own calculation (annual results; Japanese names to March 2026, others to December 2025): Sumitomo Electric ranks third of six on operating margin at 8.2% but fifth on market cap to operating profit at 15.5x. It has the largest operating profit in the group and the second-slowest revenue growth after Furukawa Electric.
- The number of competitors and market shares could not be verified. The company says it holds a world-leading share in wiring harnesses and in EML and CW-LD chips without giving figures, and its slides note that the MMC connector ferrule is a US Conec design. The advantages management cited are low connection loss from precise ferrules paired with fiber dimensional accuracy, and its ability to design rack wiring for data center customers.
Copper Prices and U.S. Power Construction
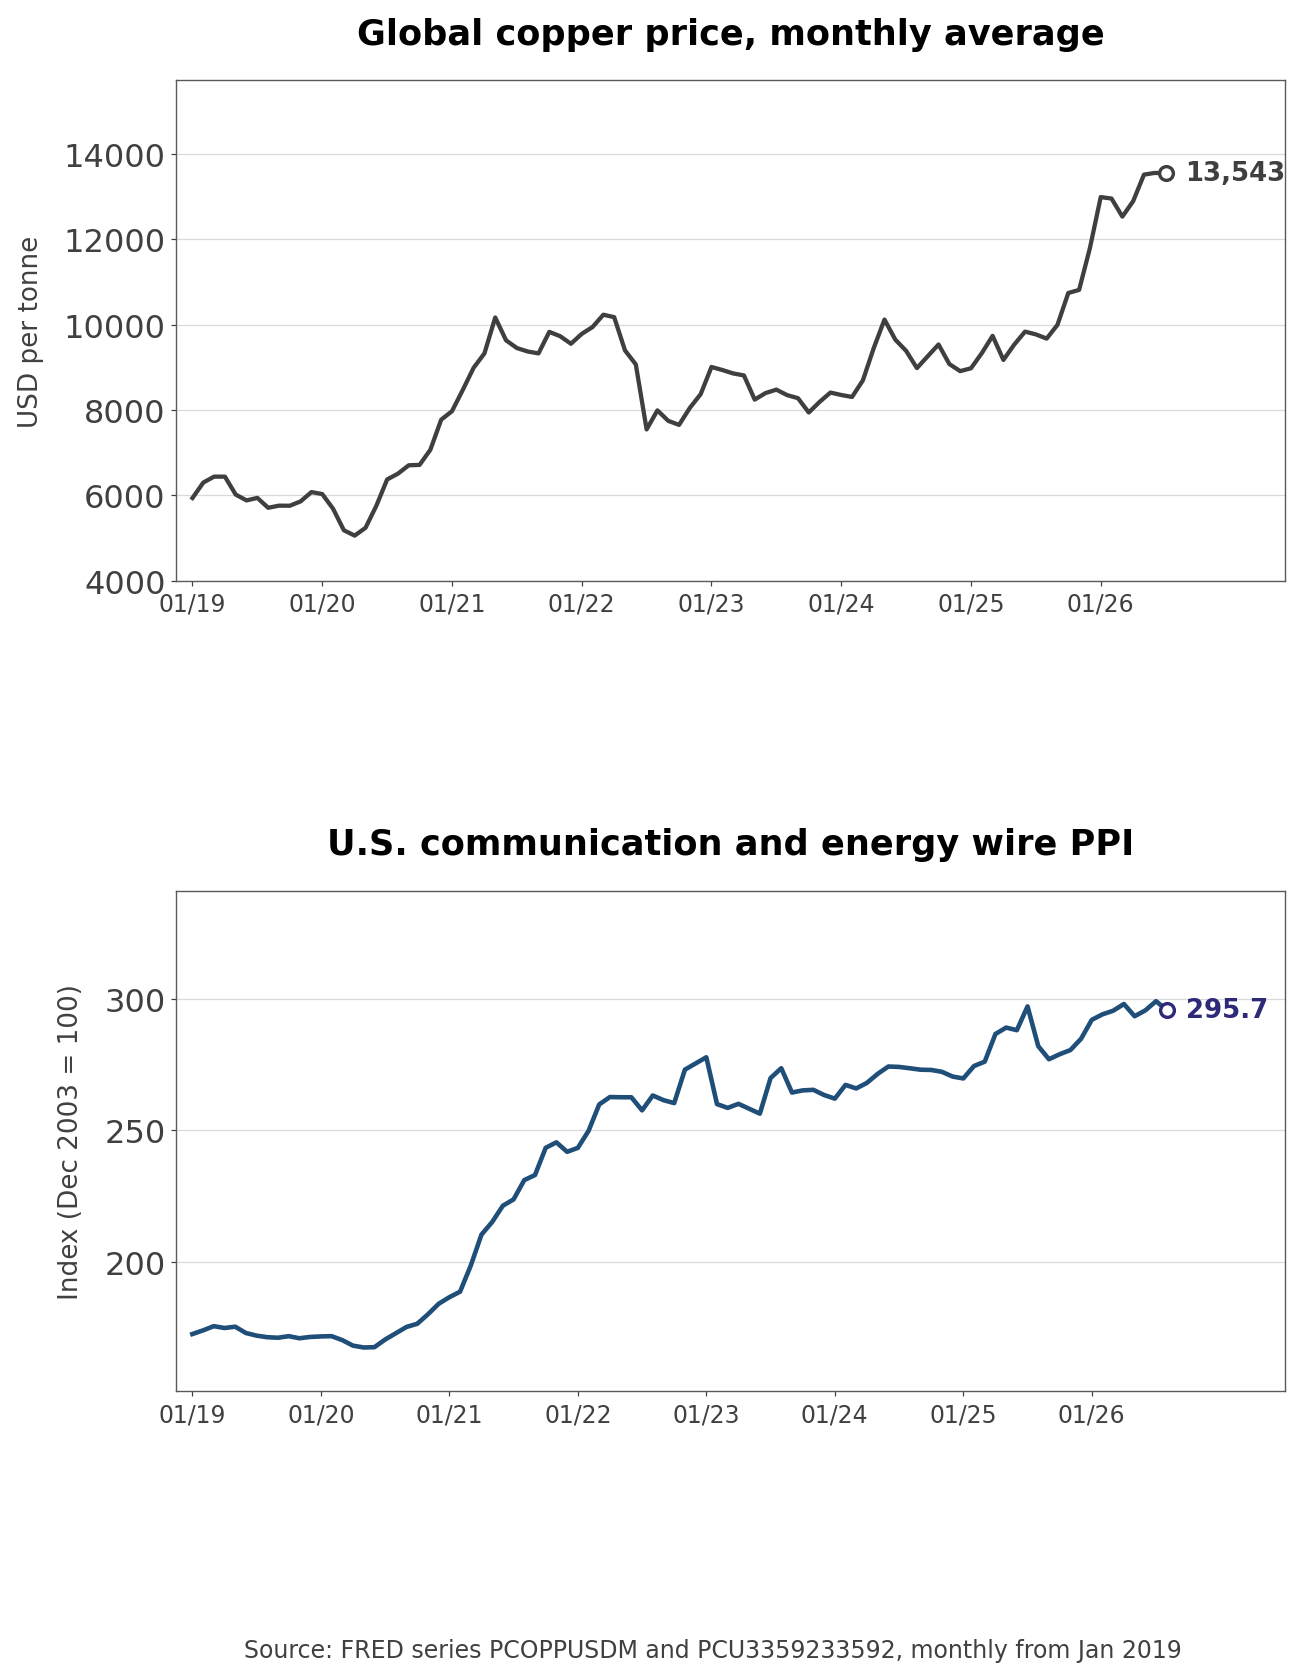
- Official statistics (FRED PCOPPUSDM and PCU3359233592): The global copper price averaged $13,543 per tonne in July 2026, and the U.S. producer price index for communication and energy wire and cable manufacturing stood at 295.7 in August 2026.
- Copper is +43.3% over five years and +38.6% over one, and the wire PPI is +28.0% over five years. Copper pushes this company's sales and profit in different directions. Its own copper reference price went from ¥1,424,000 to ¥2,220,000 per tonne year on year in the June quarter; in Environment and Energy that added ¥50.5 billion of sales and ¥5.7 billion of profit, while in Automotive the same increase was listed as a drag. Because pass-through speed differs by business, quarters with rising copper show faster sales growth than volumes alone would.
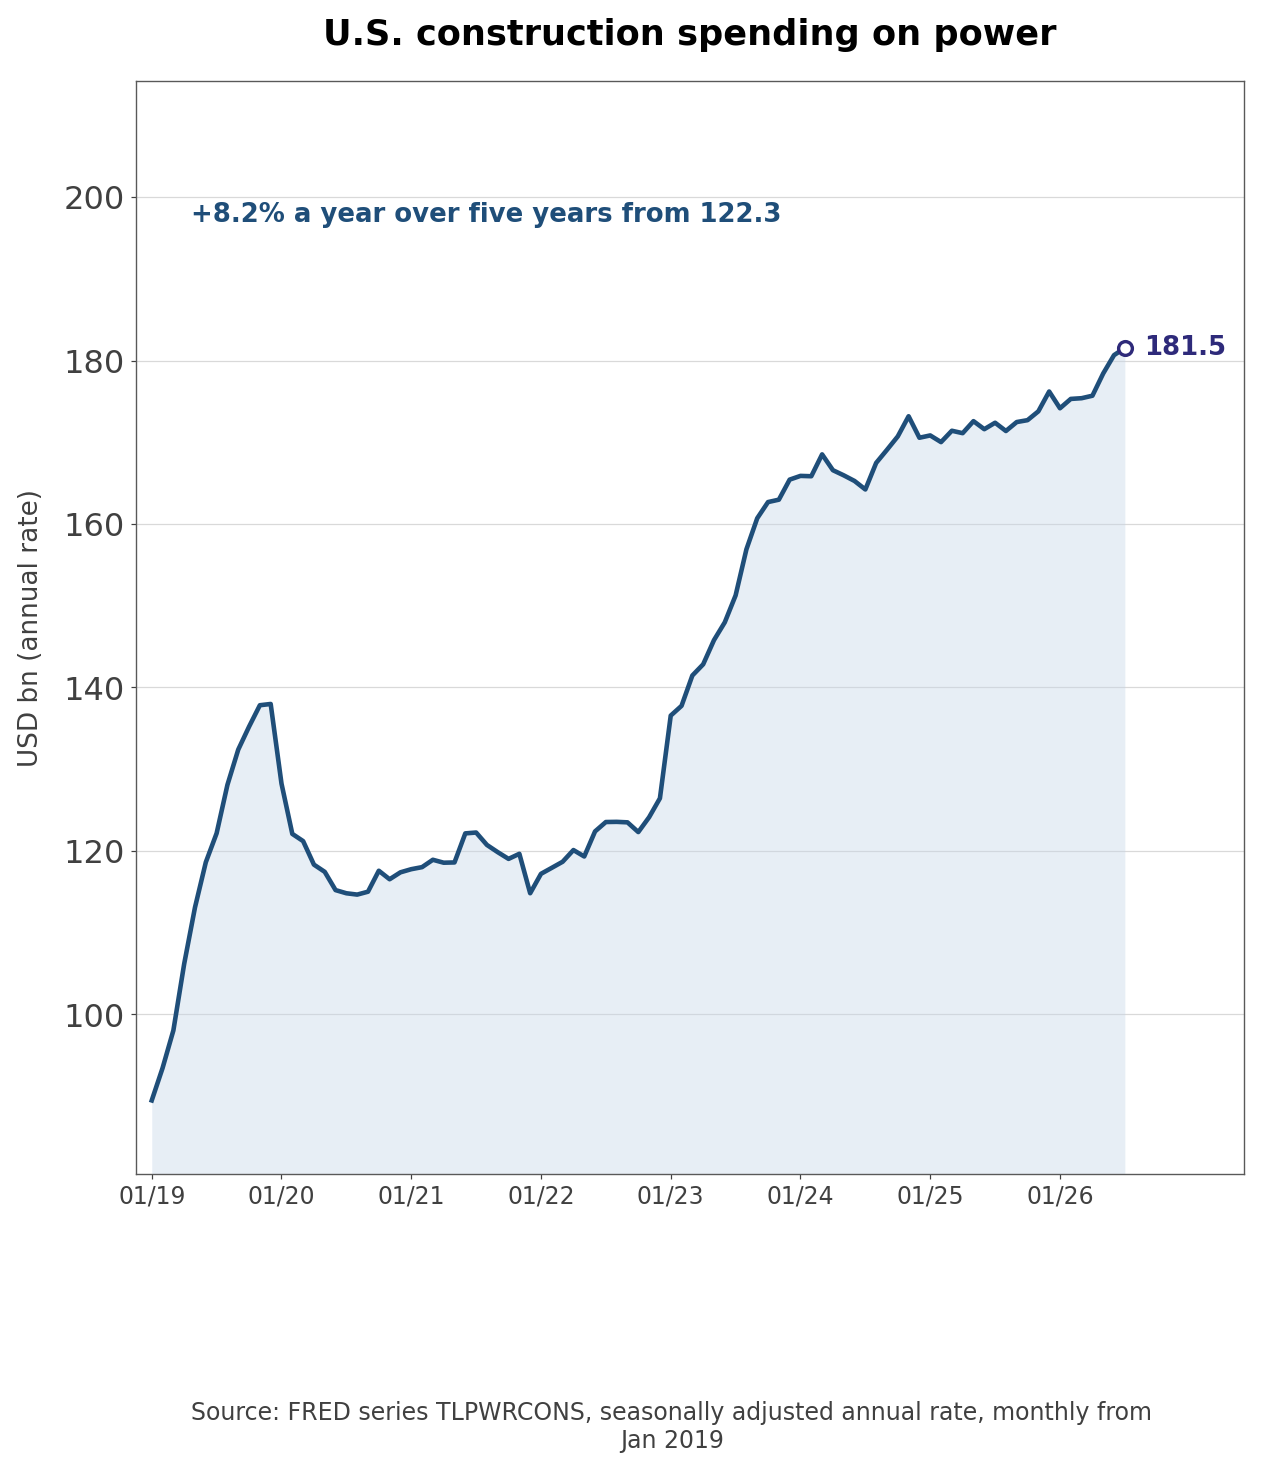
- That is +48.5% from July 2021, or +8.2% a year. Sumitomo Electric plans to serve grid demand through a new subsea cable plant in Scotland and an acquired German underground cable maker, with European mass production in fiscal 2027 and Germany's DC35 project in fiscal 2028.
- Company disclosure (data center business strategy slides, page 4, November 2025): Citing Gartner, the company projects global server spending to grow 29% a year from 2023 to 2029, and citing the IEA, global data center power demand to reach 950 TWh by 2030.
- Policy risk comes from tariffs and geopolitics. The fiscal 2025 profit bridge shows a ¥5.0 billion tariff hit, and the fiscal 2026 plan lists rising petrochemical, energy and freight costs, procurement delays and lower shipments to the Middle East as risks.
What Would Change the Call
| Scenario | Condition | Indicator to check | When · Source |
| Upside | Info-communications sales reach about ¥113.5 billion in Q2 | Segment sales by product | Q2 results, late October to early November |
| Upside | Segment margin holds between 25% and 30% | Info-communications operating margin | Q2 results |
| Downside | Automotive misses the ¥63.0 billion first-half plan | Auto operating profit and Middle East impact | Q2 results |
| Downside | Broker targets keep falling and the average drops below ¥3,000 | Sell-side target changes | As brokers publish |
| Multiple risk | P/B stays above 2x while ex-gain ROE stalls near 11% | P/B against ROE | Half-year results |
- Info-communications quarterly sales matter most. The company's plan depends on a second-quarter rebound, and the sum-of-the-parts check puts more than half the market cap on this segment's pace.
Why Did Inventory Jump in the June Quarter?
- Inventories rose ¥121.8 billion in the June quarter, from ¥1,018.1 billion to ¥1,139.9 billion, and interest-bearing debt rose ¥116.4 billion to ¥826.2 billion, in a quarter when group sales fell from ¥1,423.3 billion to ¥1,330.6 billion.
- The quarterly filings do not break inventory down by segment. Whether the build is higher-priced copper, product staged for second-quarter optical shipments, or auto parts held up by the Middle East disruption changes how much confidence the second-quarter rebound deserves. Shouldn't the first check be the half-year fact book's segment asset table, and how much info-communications assets grew?
Related Analysis
- Credo (CRDO) Stock Analysis: GAAP vs Non-GAAP Earnings Gap
- Ciena (CIEN) Stock Analysis: Growth vs Valuation
- Dell (DELL) Stock Analysis: Q2 FY2027 Earnings and Guidance
Methodology and Sources
- The share price is ¥2,077.5, and dollar and euro figures use ¥154.04 per dollar and $1.1592 per euro. Per-share data reflect the July 1 4-for-1 split.
- Financials come from the company IR library: fact books for fiscal 2020 through fiscal Q1 2026, earnings releases, supplementary sheets, the Mid-Term Management Plan 2028, the November 2025 data center strategy slides and the results briefing Q&A summary. The shareholder list is from the company's stock information page, and AGM votes are from the extraordinary report on the 156th meeting. The company is not an SEC registrant.
- I parsed quarterly net income and equity from six years of fact books in code and checked every quarter against annual and half-year totals before building the bands from 60 month-end closes plus the latest price. Peer figures use aggregated annual results and market caps. Consensus figures are aggregated sell-side research, and broker target changes come from a Japanese target-price aggregator, converted to post-split yen. The outside view is the headline of Nikkei's June 10, 2026 market report, checked against exchange price data. Industry data are FRED series PCOPPUSDM, PCU3359233592 and TLPWRCONS. This is not investment advice.
#SumitomoElectric #5802 #SumitomoElectricStock #5802StockAnalysis #OpticalConnectors #DataCenter #CopperWire #USStocks #StockAnalysis #EquityResearch #GlobalStockBrief
'US Stock Analysis' 카테고리의 다른 글
| Trip.com (TCOM) Stock Analysis: Antitrust Fine and Guidance (0) | 2026.09.14 |
|---|---|
| Bitmine (BMNR) Stock Analysis: mNAV Below 1 and Dilution (0) | 2026.09.14 |
| Oracle (ORCL) Stock Analysis: Cash Flow and Capex Gap (0) | 2026.09.12 |
| Linde (LIN) Stock Analysis: Price, Volume and Margin Trends (0) | 2026.09.12 |
| Uber (UBER) Stock Analysis: Gross Bookings vs Revenue Gap (0) | 2026.09.11 |


