Uber (UBER) Stock Analysis: Gross Bookings vs Revenue Gap
by Global Stock Brief2026. 9. 11.
Uber Technologies (NYSE: UBER) processed $58.0 billion in gross bookings in the second quarter of 2026, up 24% year over year, while reported revenue rose only 12%. This UBER stock analysis works through where those twelve percentage points went, how a UK business model change rewrote the top line on January 2, 2026, why the trailing price-to-earnings ratio of 16.5x understates what investors are paying, and how Uber compares with DoorDash, Airbnb, Grab and Lyft on growth, margin and multiples.
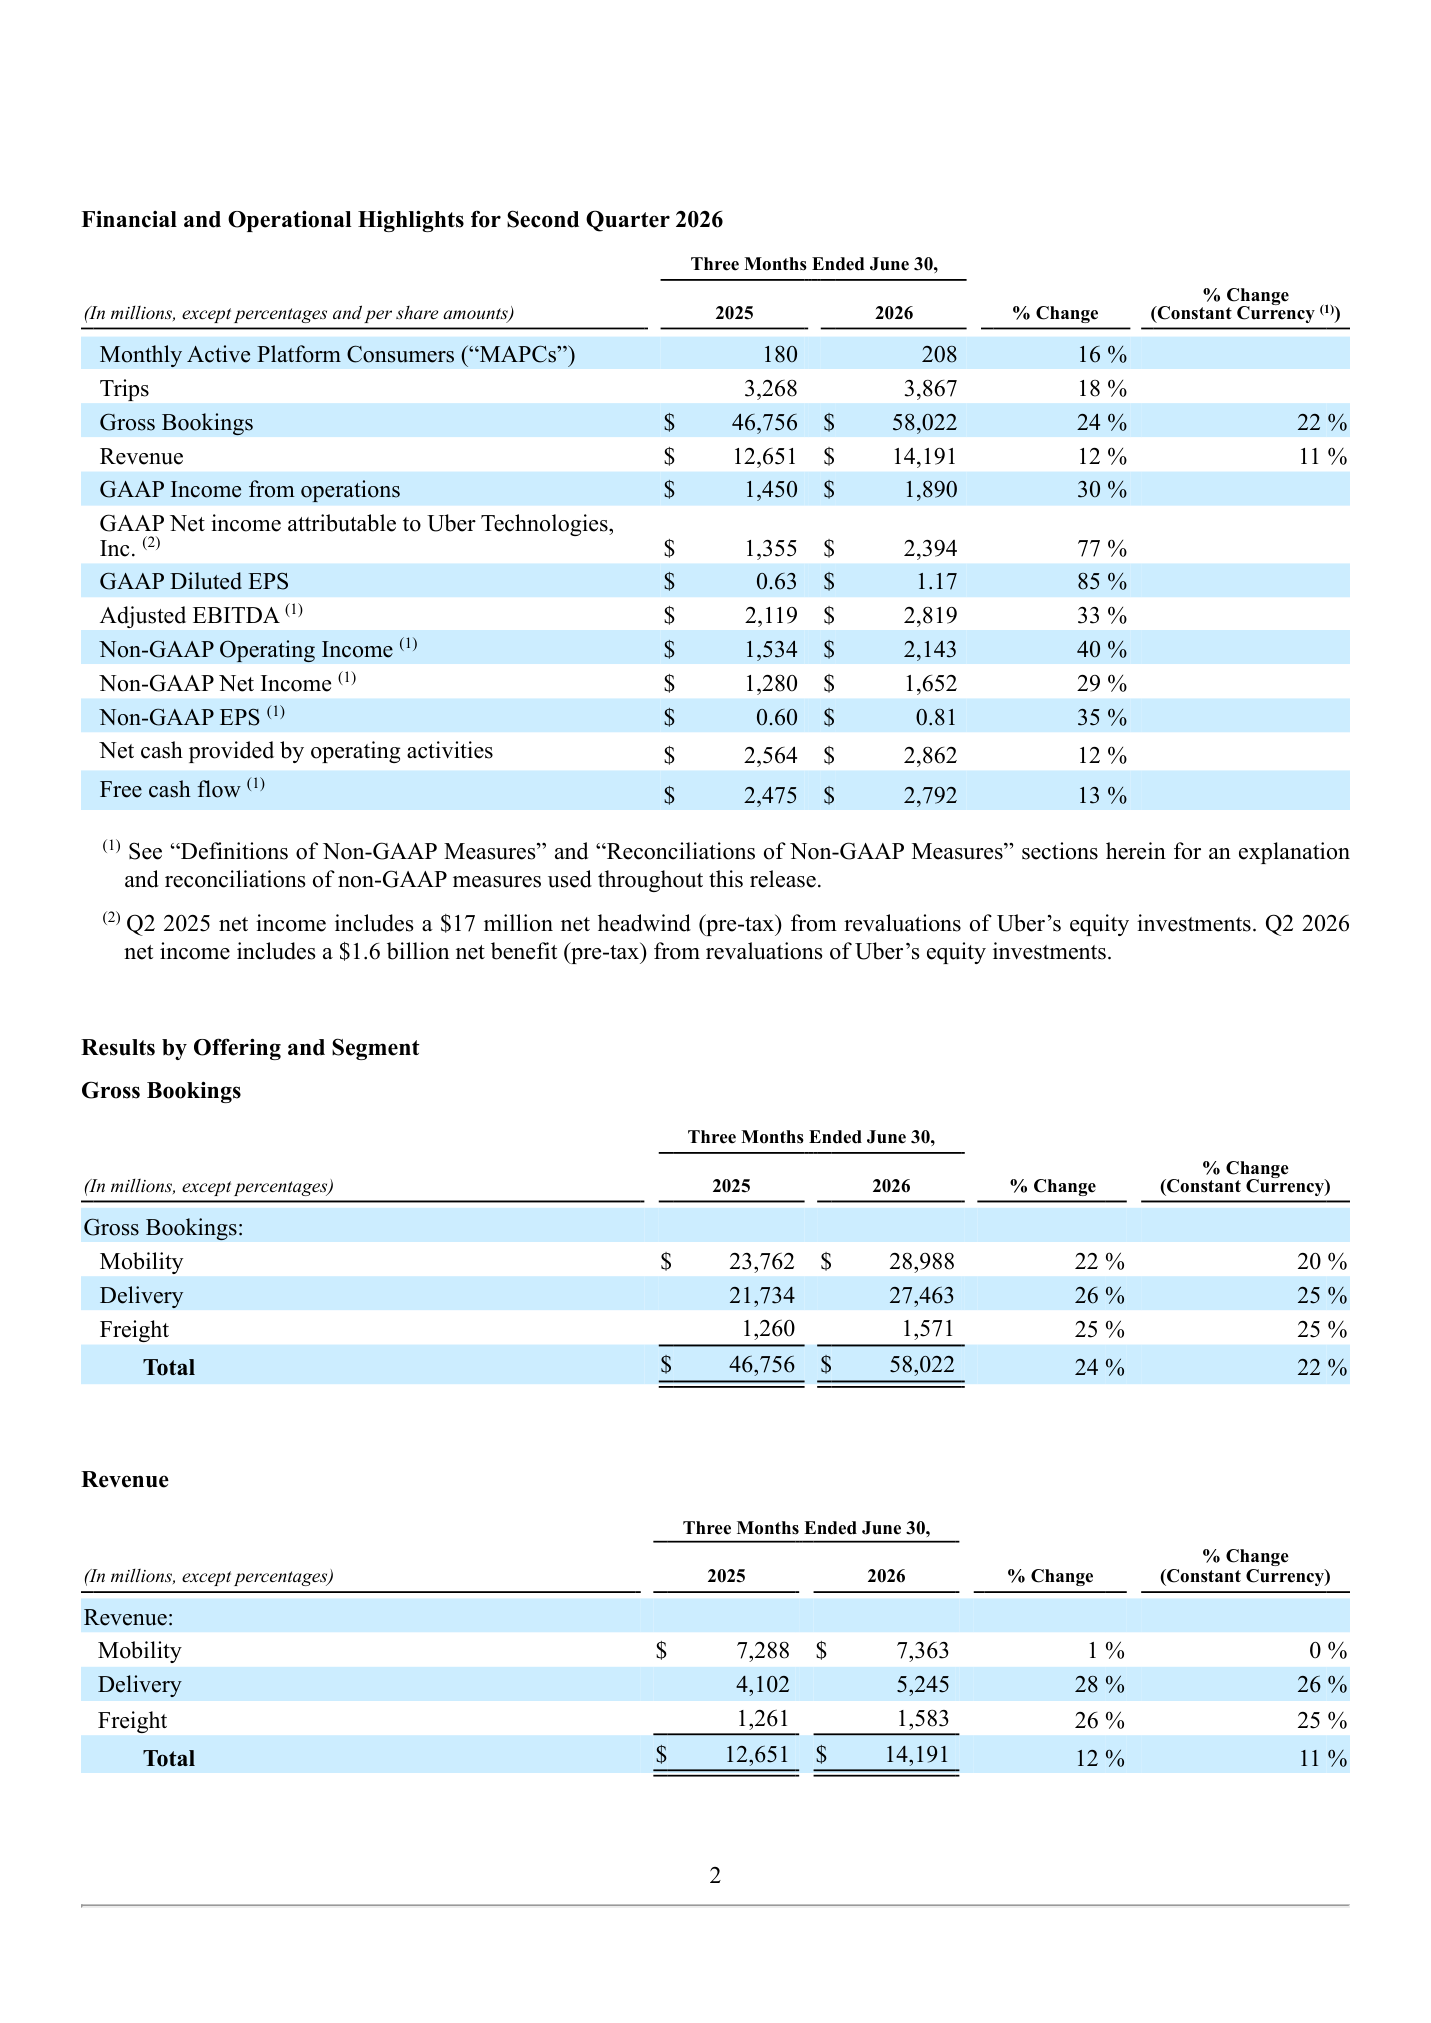
Uber Q2 2026 earnings release: summary table and segment gross bookings and revenue (filed Aug 5, 2026)
The company used to publish the one number that settles this question. It stopped. Uber disclosed segment revenue margin, revenue divided by gross bookings, in a table for six quarters running from Q3 2023 through Q4 2024, and then dropped the table from its releases. I rebuilt it.
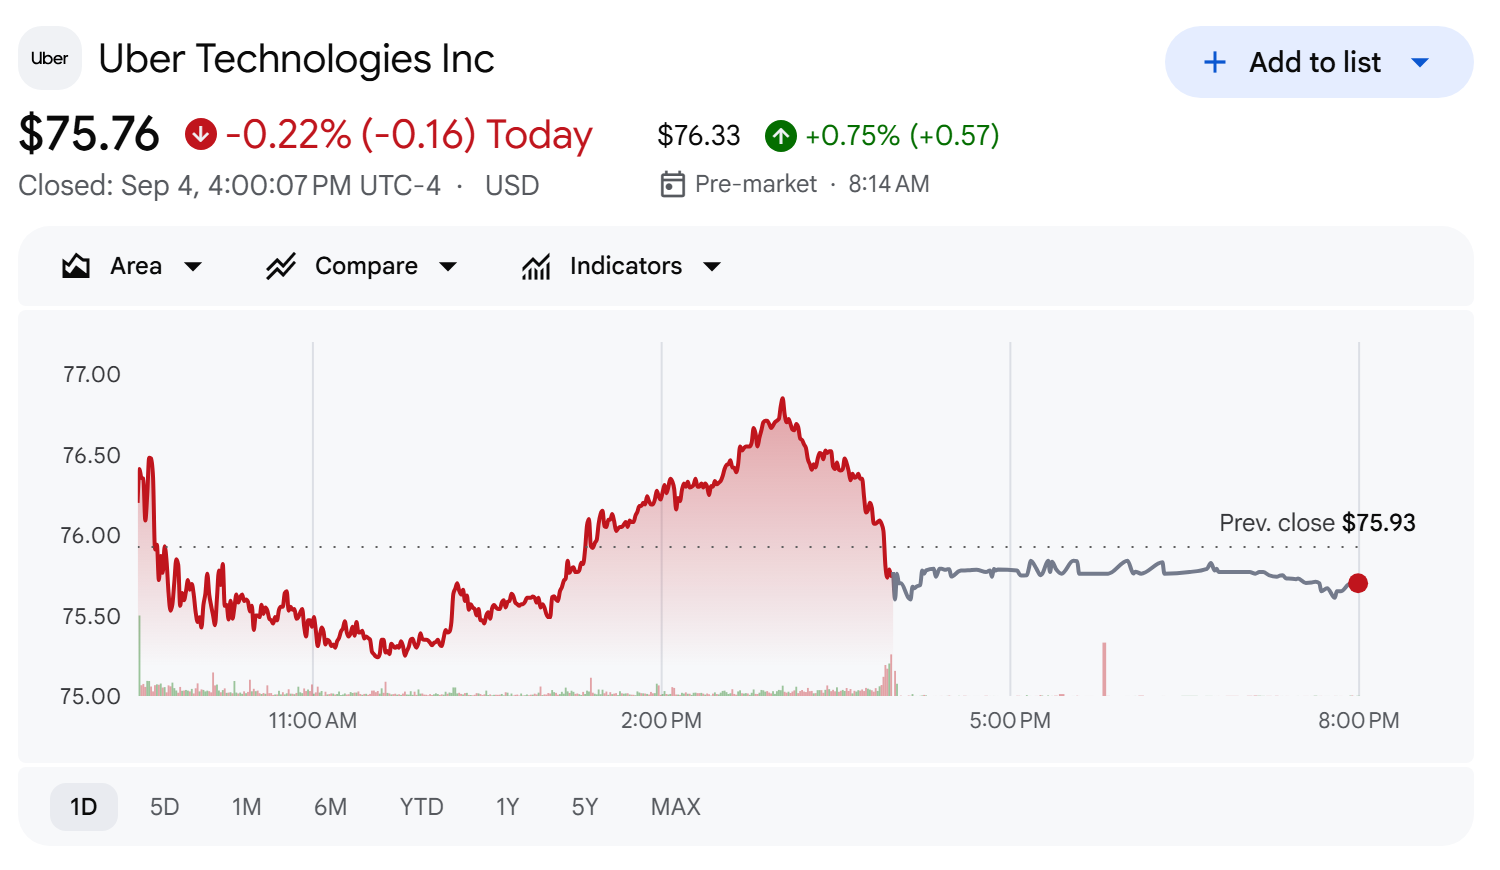
Shares closed at $75.76 on September 4, 2026, putting the market capitalization at $154.7 billion, with a trailing P/E of 16.5x and a price-to-book ratio of 5.66x.
Why Did Uber Revenue Grow Only 12% on 24% Bookings?
Company disclosure (Q2 2026 earnings release, Aug 5, 2026): Gross bookings of $58.02 billion, revenue of $14.19 billion. The release states plainly that "business model changes negatively impacted total revenue YoY growth by 8 percentage points on a reported and constant currency basis."
On a constant-currency basis the split is 22% against 11%, so currency is not doing the work either.
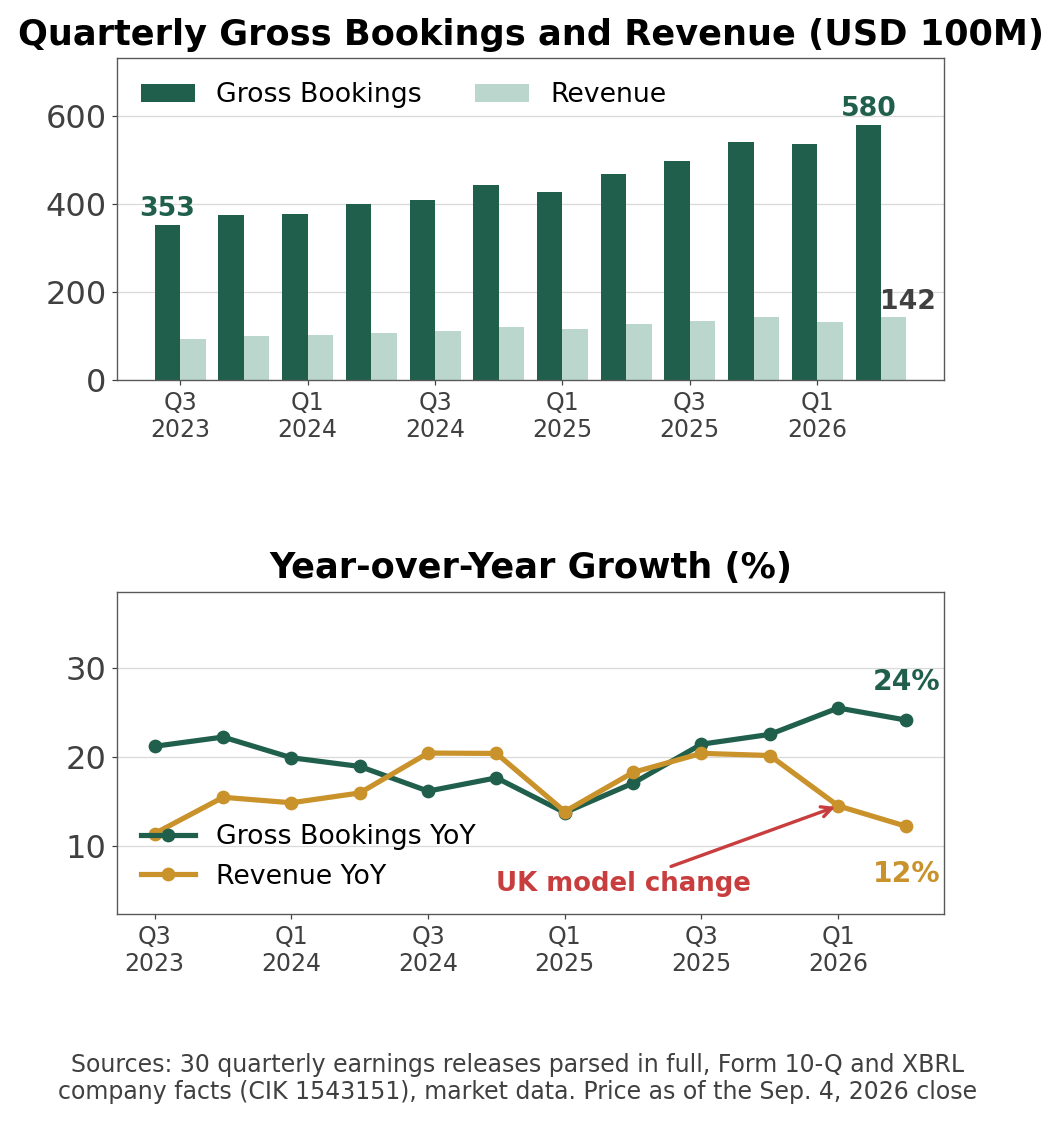
Quarterly gross bookings and revenue, and the widening gap between the two growth rates
Add those 8 points back and revenue growth lands at 20.9%, within shouting distance of bookings. The gap is not a demand problem, and the usage numbers say so directly: monthly active platform consumers reached 208 million, up 16%, and trips reached 3.87 billion, up 18%.
What changed is where a payment sits on the income statement.
Filing footnote (10-Q for the quarter ended June 30, 2026): "Effective January 2, 2026, we implemented a business model change in certain UK markets, primarily driven by regulatory and tax considerations. As a result of this business model change, we are no longer responsible for the Mobility services in these markets, and accordingly, payments to drivers are recorded as a reduction of revenue instead of cost of revenue." The same filing puts the second-quarter impact at $1.1 billion. Form 10-Q
Driver pay used to sit in cost of revenue. Now it comes off the top line before revenue is recognized. Uber does not earn less in Britain. The line item moved.
Rebuilding Uber's Revenue Margin After It Vanished
Revenue margin is the cleanest way to see through this. It asks how much of every $100 flowing across the platform reaches Uber's income statement.
Segment revenue margin: six quarters disclosed by the company and 30 quarters rebuilt by calculation
Own calculation (30 quarterly earnings releases parsed in full, Q1 2019 through Q2 2026): I divided segment revenue by segment gross bookings for every quarter Uber has reported as a public company. For the six quarters where the company also published the figure, my numbers come out at 28.32, 28.71, 30.17, 29.84, 30.52 and 30.31. Uber printed 28.3, 28.7, 30.2, 29.8, 30.5 and 30.3.
They match to the first decimal. That is the point of the exercise: once the method reproduces the disclosed quarters exactly, the quarters the company stopped disclosing can be reconstructed with the same arithmetic.
Run it forward and mobility revenue margin falls from 30.67% in Q2 2025 to 25.40% in Q2 2026, a drop of 527 basis points. Delivery over the same stretch went the other way, from 18.87% to 19.10%.
Only one segment broke, which points at the UK change rather than at the business. Management confirmed the split on the second-quarter earnings call, attributing roughly 400 of the roughly 500 basis points of mobility margin decline to the UK model change and calling the effect optical. Back out the accounting share and about 127 basis points of real compression remain.
Adjusted EBITDA as a Share of Gross Bookings
There is one profitability measure the accounting change cannot touch, and it is the one Uber uses on itself.
Company disclosure (Q2 2026 earnings release): Adjusted EBITDA reached $2.82 billion, or 4.9% of gross bookings, against 4.5% a year earlier. Because the denominator is bookings rather than revenue, a change in revenue recognition leaves the ratio alone. Across 20 quarters the number has moved in one direction, from 0.0% in Q3 2021 to 4.9% today.
Segment results fill in the shape of the business.
Segment
Gross bookings
Revenue
Segment operating income
Revenue margin
Mobility
$28.99 billion
$7.36 billion
$2.22 billion
25.4%
Delivery
$27.46 billion
$5.25 billion
$1.06 billion
19.1%
Freight
$1.57 billion
$1.58 billion
-$24 million
100.8%
Freight clears 100% because Uber books it gross, a reminder that a single company can run three different revenue recognition models at once. Delivery is the segment to watch: bookings have climbed to 95% of mobility's, segment operating income is still less than half, and the growth rate is faster, +38% against +28%.
Uber Delivery Market Outlook and Ride Pricing
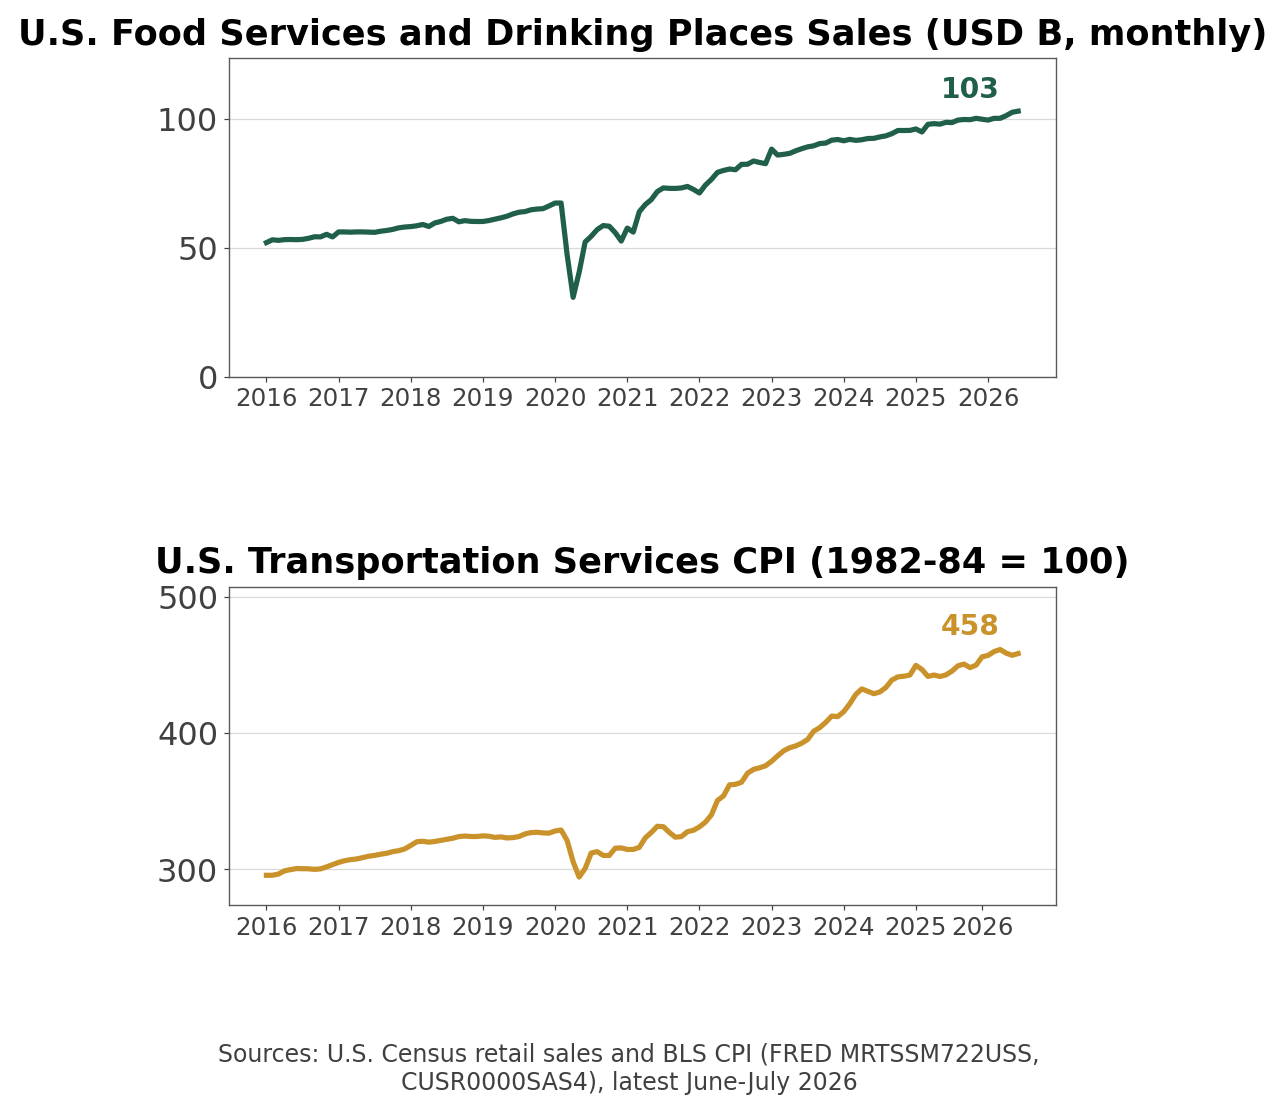
U.S. food services sales and transportation services CPI (FRED)
Official statistics (U.S. Census retail sales, FRED MRTSSM722USS, Jun 2026): Americans spent $103.0 billion at food services and drinking places in a single month.
That is +43.5% against five years earlier. Uber Eats is a claim on moving part of that spending online, and the pool itself keeps growing.
Official statistics (BLS transportation services CPI, FRED CUSR0000SAS4, Jul 2026): The index stands at 458.5, and ride-hail fares sit inside that basket.
Over five years the index is up 38.3%.
That matters for reading the bookings number. Trips grew 18% and bookings grew 24%; the six-point spread is price and mix, not additional rides.
Uber vs DoorDash, Airbnb, Grab and Lyft by Revenue
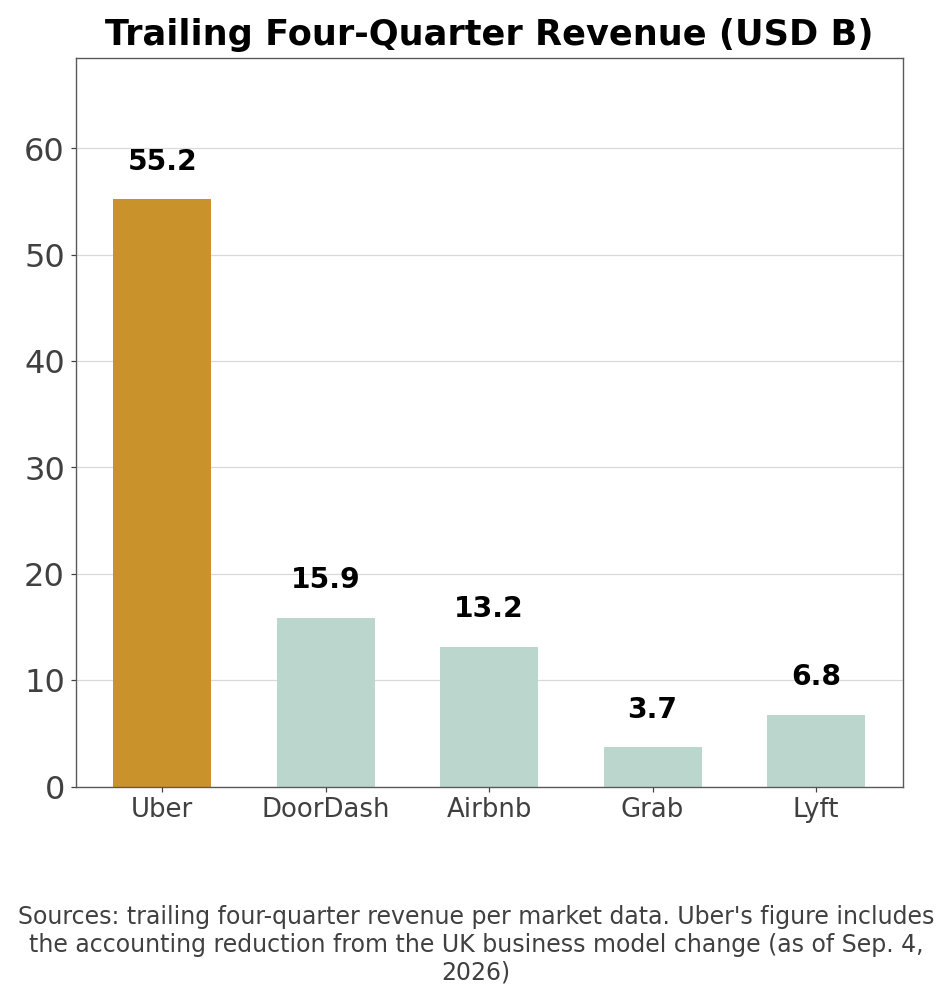
Trailing four-quarter revenue across five platform companies
Aggregator cross-check (as of Sep 4, 2026): Trailing four-quarter revenue runs $55.2 billion at Uber, $15.9 billion at DoorDash, $13.2 billion at Airbnb, $6.8 billion at Lyft and $3.7 billion at Grab. The other four combined reach 71% of Uber alone.
Scale explains a slower growth rate. It does not explain a growth rate that sits below every peer, which is where the accounting distortion follows the story into the comparison table.
Is Uber's 16.5x P/E Real?
Before any multiple, the earnings line needs cleaning.
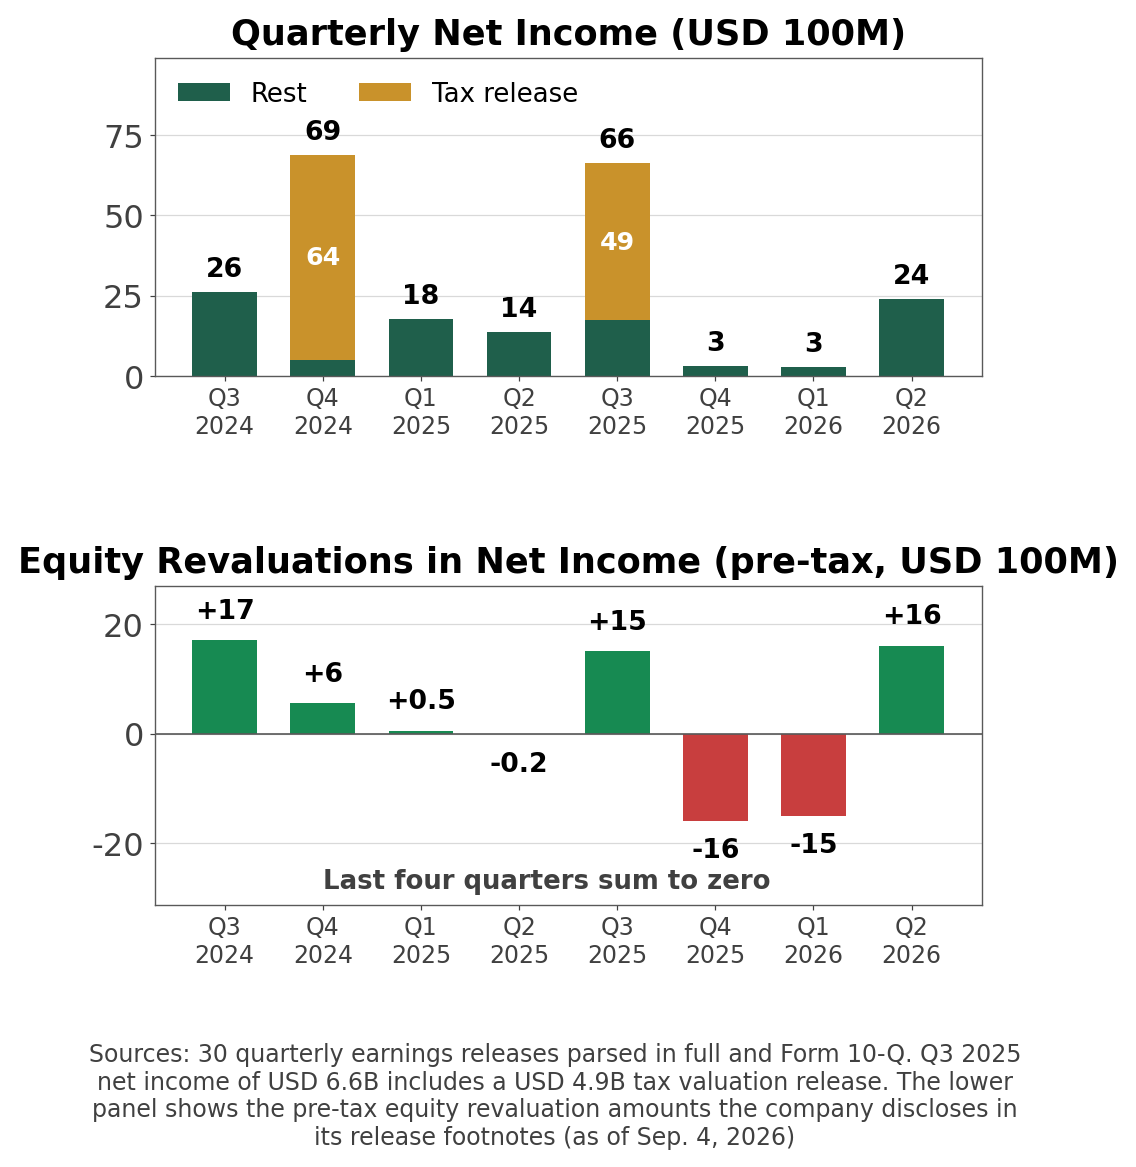
Quarterly net income with tax valuation releases and equity revaluations broken out
Filing footnote (Q3 2025 earnings release): "Net income attributable to Uber Technologies, Inc. was $6.6 billion, which includes a $4.9 billion benefit from a tax valuation release."
Of $9.58 billion in trailing four-quarter net income, $4.9 billion is that single item. Q4 2024 carried another $6.4 billion of the same kind. These are deferred tax assets moving onto the balance sheet, not cash arriving.
Strip the tax release and trailing net income is $4.68 billion, or $2.28 per share. The multiple on that basis is 33.2x, twice the 16.5x on the screen.
The lower panel adds the second variable. Uber discloses equity revaluations in a release footnote every quarter, and the last four ran +$1.5 billion, -$1.6 billion, -$1.5 billion and +$1.6 billion. They cancel across the year and dominate any single quarter, which is why net income collapsed to roughly $0.3 billion in both Q4 2025 and Q1 2026.
Quarterly net income at Uber is set by tax judgments and the market price of holdings the company does not control.
Uber Valuation: P/S and P/B Bands Over Five Years
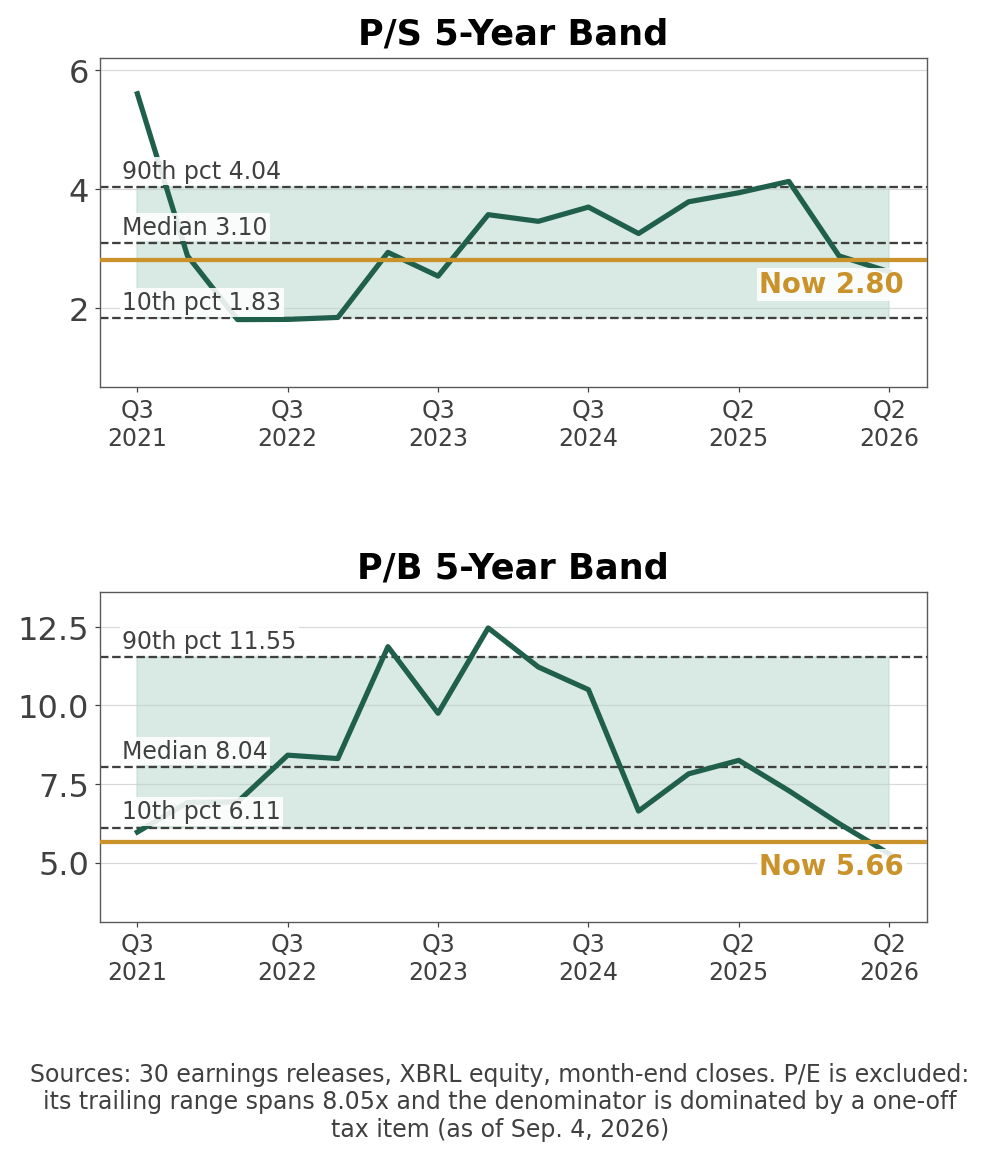
Price-to-sales and price-to-book five-year bands (P/E excluded)
Own calculation (month-end closes and 30 earnings releases, last 20 quarters): Price-to-sales sits at 2.80x, in the bottom 31% of its five-year range, below the 3.10x median, with the 4.13x peak set in Q3 2025.
Price-to-book is 5.66x, bottom 6%, effectively the low of the range. Reading that as five-year-cheap misses what the previous section established. The denominator jumped when Q4 2024 put those deferred tax assets on the balance sheet. Part of the decline in the ratio is equity rising, not price falling.
I did not build a P/E band. Across the same 20 quarters the trailing multiple spans 8.05x between its high and low, and the swings come from the tax items above rather than from operations.
One more yardstick survives the accounting: market capitalization divided by trailing gross bookings is 0.72x today against a five-year median of 0.85x. Measured against a denominator the revenue rules cannot reach, Uber trades below its own history.
Uber Price Targets and Analyst Revisions
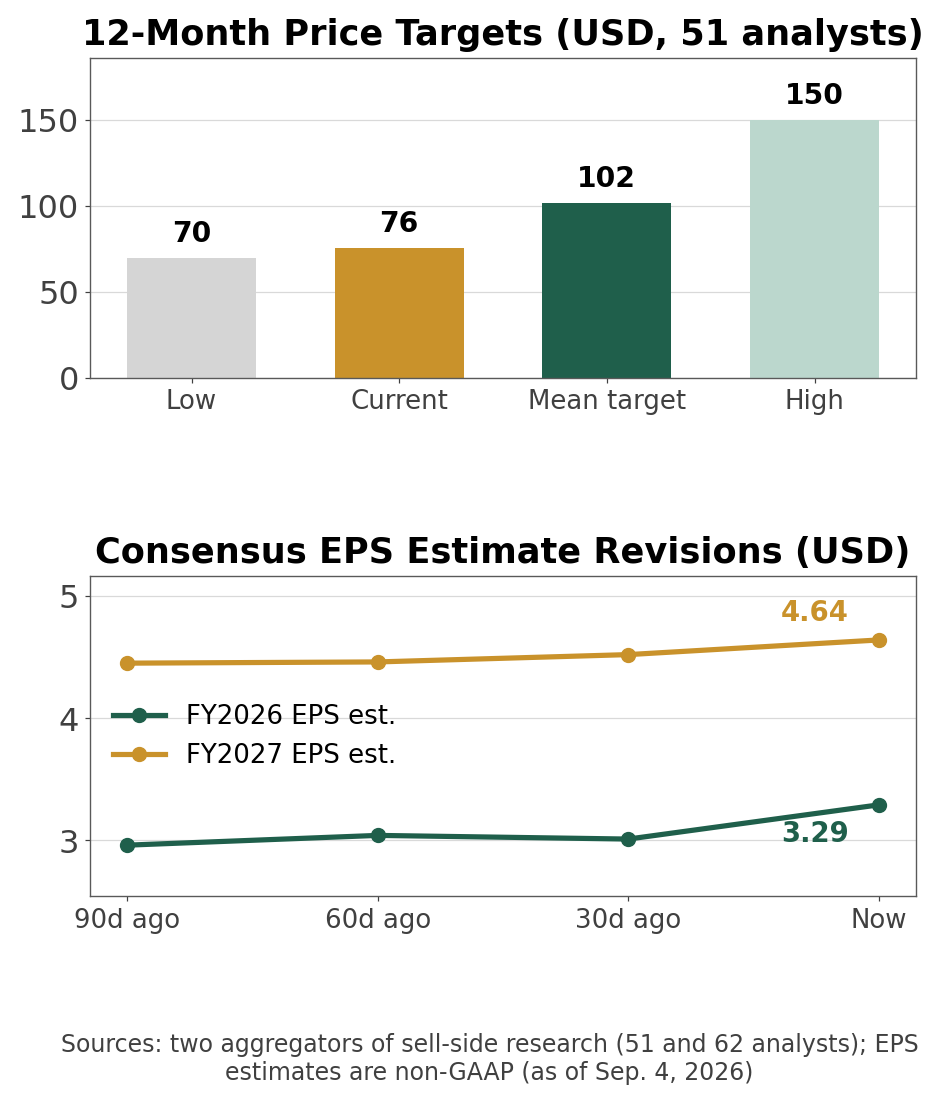
Twelve-month price target distribution and consensus EPS revisions
Aggregator cross-check (as of Sep 4, 2026): Aggregated sell-side research puts the average twelve-month price target at $101.81 across 51 analysts, with a low of $70 and a high of $150. A second aggregation of 62 analysts lands at $101 and a third at $102.29, so three independent counts cluster in the same place.
Ratings show 51 buys, 11 holds and no sells among 62 analysts. The revision record over the last 90 days is less unanimous.
Date
Firm
Rating change
Target
2026-09-04
UBS
Neutral to Sell
unchanged
2026-09-04
BTIG
Buy maintained
$90 to $100
2026-09-03
BMO Capital
Maintained
$106 to $119
2026-09-03
Guggenheim
Buy maintained
unchanged
2026-09-02
BNP Paribas
Underweight to Neutral
unchanged
2026-09-02
Wells Fargo
Overweight maintained
unchanged
Zero upgrades, two downgrades, and two target increases in the same week one house moved to sell. Estimates themselves keep rising: aggregated sell-side estimates for 2026 EPS went from $2.96 ninety days ago to $3.29, and 2027 from $4.45 to $4.64, with 27 analysts raising 2026 numbers in the last 30 days against 2 cutting.
On the call, CFO Balaji Krishnamurthy framed the quarter this way: "We continue to convert strong top-line growth into faster earnings and significant cash generation. Gross Bookings grew 22%, Non-GAAP EPS grew 35%, and trailing twelve-month free cash flow exceeded $10 billion for the first time in Uber's history."
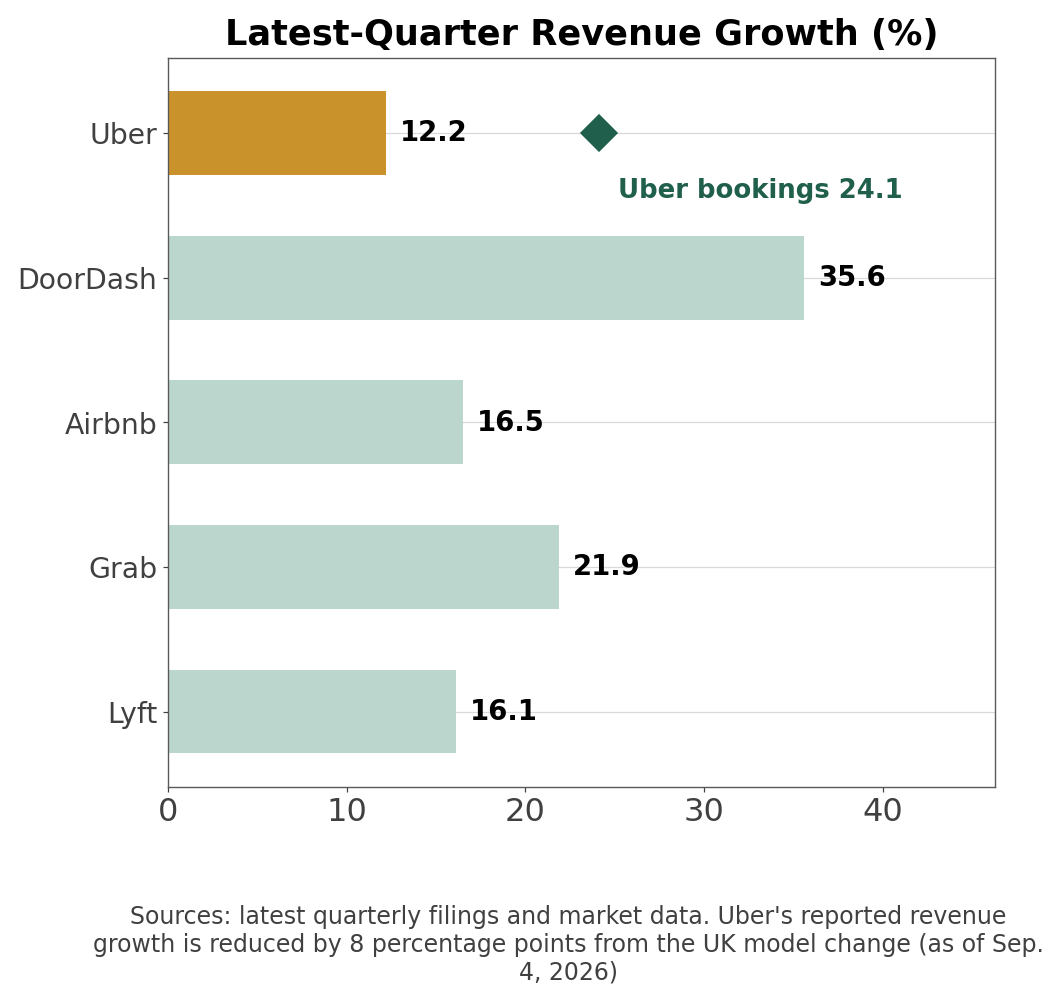
Peer revenue growth with Uber's gross bookings growth marked
Company
Ticker
Market cap
Revenue growth
Operating margin
P/E
P/S
Uber
UBER
$154.7B
+12.2%
13.3%
16.5x
2.80x
DoorDash
DASH
$91.7B
+35.6%
3.9%
111.2x
5.77x
Airbnb
ABNB
$107.3B
+16.5%
21.0%
41.2x
8.15x
Grab
GRAB
$14.0B
+21.9%
2.1%
29.9x
3.74x
Lyft
LYFT
$6.3B
+16.1%
2.6%
2.3x
0.93x
Sorted by revenue growth, Uber finishes last of five. Sorted by gross bookings growth of 24.1%, it finishes second behind DoorDash. The ranking flips on which line you accept, and the previous sections explain why the two lines disagree.
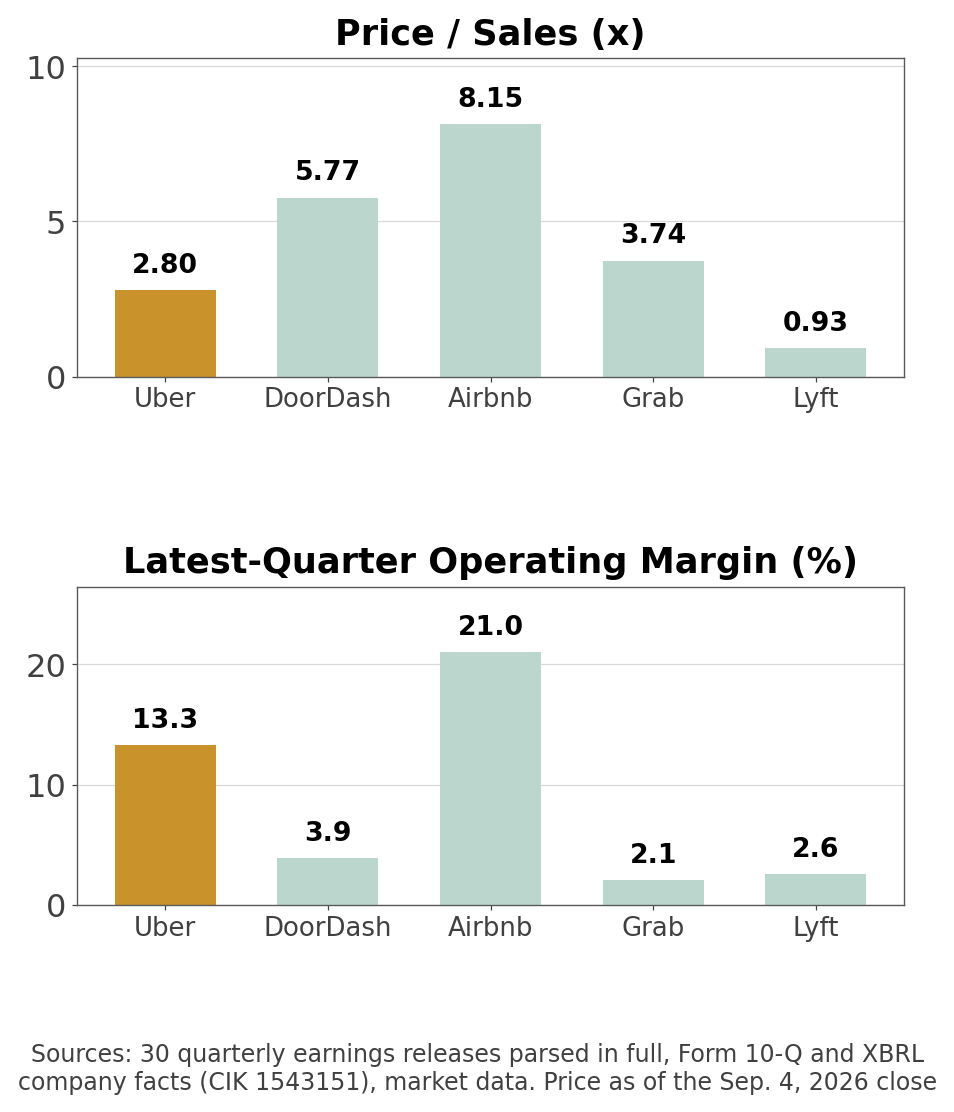
Peer price-to-sales and latest-quarter operating margin
Company
Rule of 40 (growth + operating margin)
Growth-adjusted multiple (P/S ÷ growth)
Uber (bookings basis)
37.4
0.12
Uber (revenue basis)
25.5
0.23
DoorDash
39.5
0.16
Airbnb
37.5
0.49
Grab
24.0
0.17
Lyft
18.7
0.06
Uber belongs in the mature large-cap marketplace bucket, and that bucket gets tested on margin rather than on headline growth. Its 13.3% operating margin trails only Airbnb, while its multiple sits second lowest. Profitability rank and valuation rank point in opposite directions.
Where Uber Is Spending: Delivery Hero and Autonomy
Uber acquisition offer for Delivery Hero (Form 8-K Exhibit 99.1, July 16, 2026)
Company disclosure (8-K, Jul 16, 2026): Uber agreed to acquire Delivery Hero for €41.50 per share in cash, an equity value of $14.8 billion. The combination extends the platform to 99 markets with combined pro-forma 2025 gross bookings of $236 billion. Fourteen overlapping markets go separately to SSW Partners for roughly $1.6 billion. Form 8-K, Exhibit 99.1
The first entry on the list of 50 markets Uber is buying is Baedal Minjok in South Korea, one of the largest delivery franchises in Asia.
On autonomy, CEO Dara Khosrowshahi called the opportunity one of the largest in Uber's history and pointed to 15 markets by year end and a commitment covering 120,000 vehicles over the coming years. He also supplied the scale check himself: autonomous vehicles run hundreds of thousands of trips a week while Uber runs 300 million. The expectation priced into the stock and the contribution visible in the income statement are still on different floors.
One event is missing from the filings. Several outlets reported on September 5 that Uber would cut 3,300 roles and end remote work. No 8-K covering that decision had been filed as of this writing; the company's most recent filing is dated August 7.
Upside and Downside Conditions
Scenario
Condition
Indicator to check
When · Source
Upside
The UK change laps and revenue growth reconverges with bookings growth
Spread between quarterly revenue and bookings growth
Q1 2027 release · 8-K EX-99.1
Upside
Adjusted EBITDA clears 5% of gross bookings
Quarterly EBITDA margin on bookings
Q3 2026 release · 8-K EX-99.1
Upside
Delivery Hero closes and non-GAAP EPS accretion shows up
First combined quarter after close
Post-closing quarter · 10-Q
Downside
Mobility revenue margin keeps sliding after the accounting effect is removed
Segment revenue ÷ segment bookings
Every quarter · 8-K EX-99.1
Downside
Net income excluding tax and revaluation items stays flat
Release footnote amounts
Every quarter · 8-K EX-99.1
Downside (valuation)
Multiples compress if the bookings-based case is not accepted
P/S and market cap ÷ bookings
Continuous · market data
Questions This Analysis Does Not Answer
Will the UK accounting change spread to other markets?
The 10-Q cites regulatory and tax considerations and names no other market. Similar regulatory debates are open elsewhere, but only the UK is confirmed in filings.
Is the Delivery Hero acquisition certain to close?
No. It is a voluntary takeover offer subject to shareholder tender and antitrust clearance. What the filings establish is that Prosus has irrevocably committed its shares, which would take Uber's total economic interest to roughly 53%.
When does autonomy reach the income statement?
Uber discloses market counts and vehicle commitments, not revenue or margin from autonomous trips. The current disclosure does not support a calculation.
I parsed all 30 of Uber's quarterly earnings releases from Q1 2019 through Q2 2026 directly from SEC EDGAR and built the segment series from those documents rather than from a data vendor. Segment revenue margin was computed as segment revenue divided by segment gross bookings and validated against the six quarters Uber disclosed the figure itself, matching to one decimal place. Financial statement items were cross-checked against XBRL company facts (CIK 1543151) and the Form 10-Q for the quarter ended June 30, 2026. Industry series come from FRED (MRTSSM722USS, CUSR0000SAS4). Valuation bands use month-end closing prices over the last 20 quarters; the P/E band was excluded because its high-to-low span reaches 8.05x and is driven by one-off tax items. Consensus figures reflect aggregated sell-side research and aggregated sell-side estimates as of September 4, 2026. Prices and multiples are as of the September 4, 2026 close of $75.76. This article is for information only and is not investment advice.