American Express (AXP) Stock Analysis: Credit Metrics Reset
by Global Stock Brief2026. 9. 10.
American Express (AXP) Stock Analysis
American Express (NYSE: AXP) reported second-quarter 2026 revenue net of interest expense of $19.6 billion, up 10 percent year over year, with diluted earnings per share of $4.53. This AXP stock analysis works through the company's monthly credit statistics, the April 2026 change in how those statistics are calculated, the June sale of charged-off balances, what actually drove pretax income growth, and where the multiples sit against Visa, Mastercard, Capital One, Synchrony, and JPMorgan.
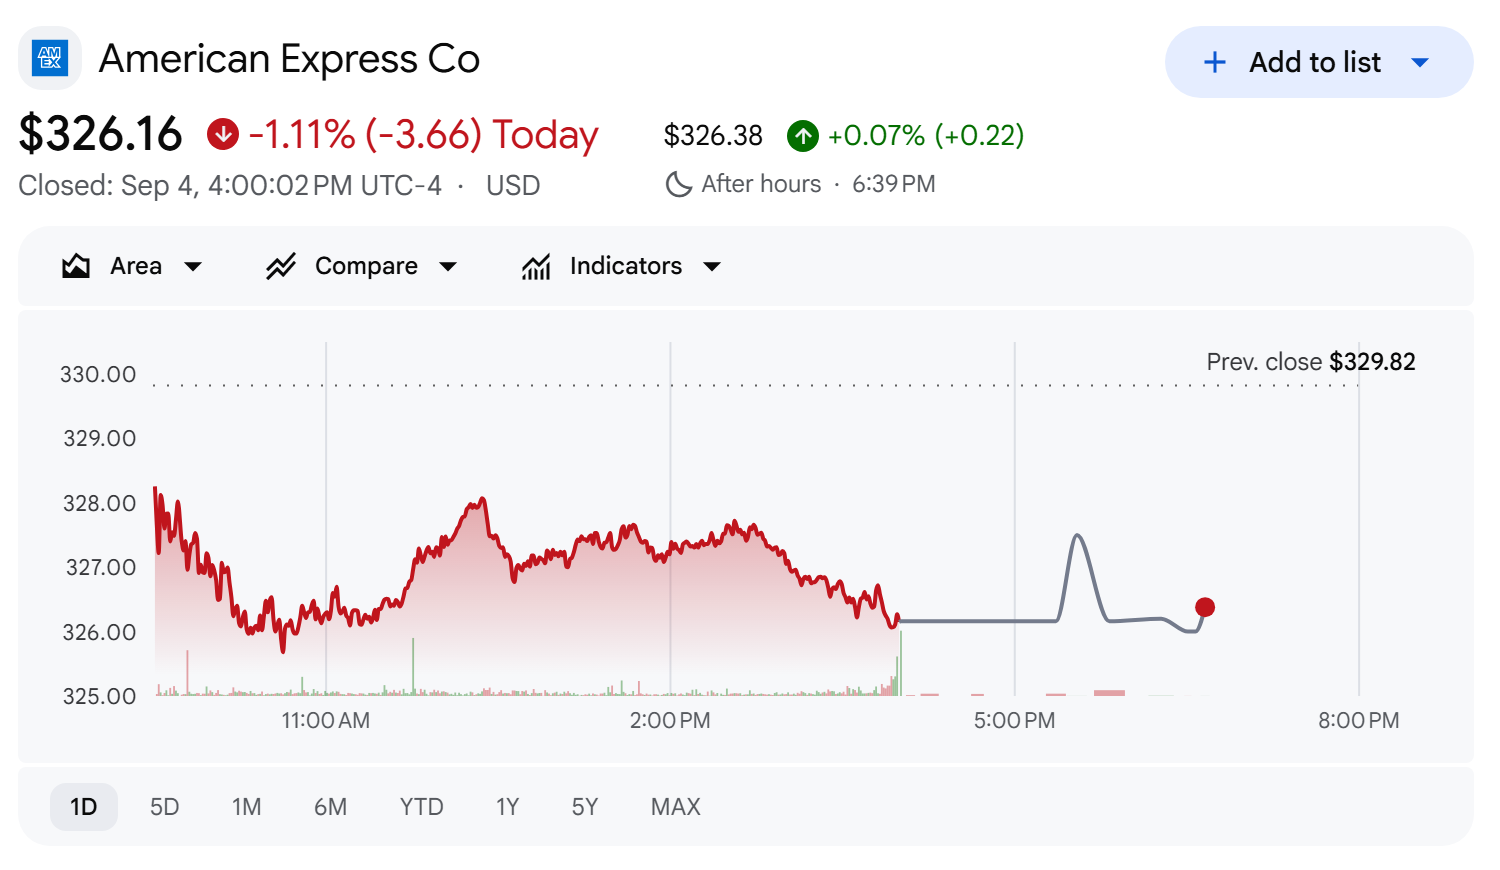
American Express (AXP), close of September 4, 2026
The U.S. consumer delinquency rate reads 1.1 percent for July, against 1.4 percent a year earlier. The ruler changed twice in between. Both changes are in the company's own filings.
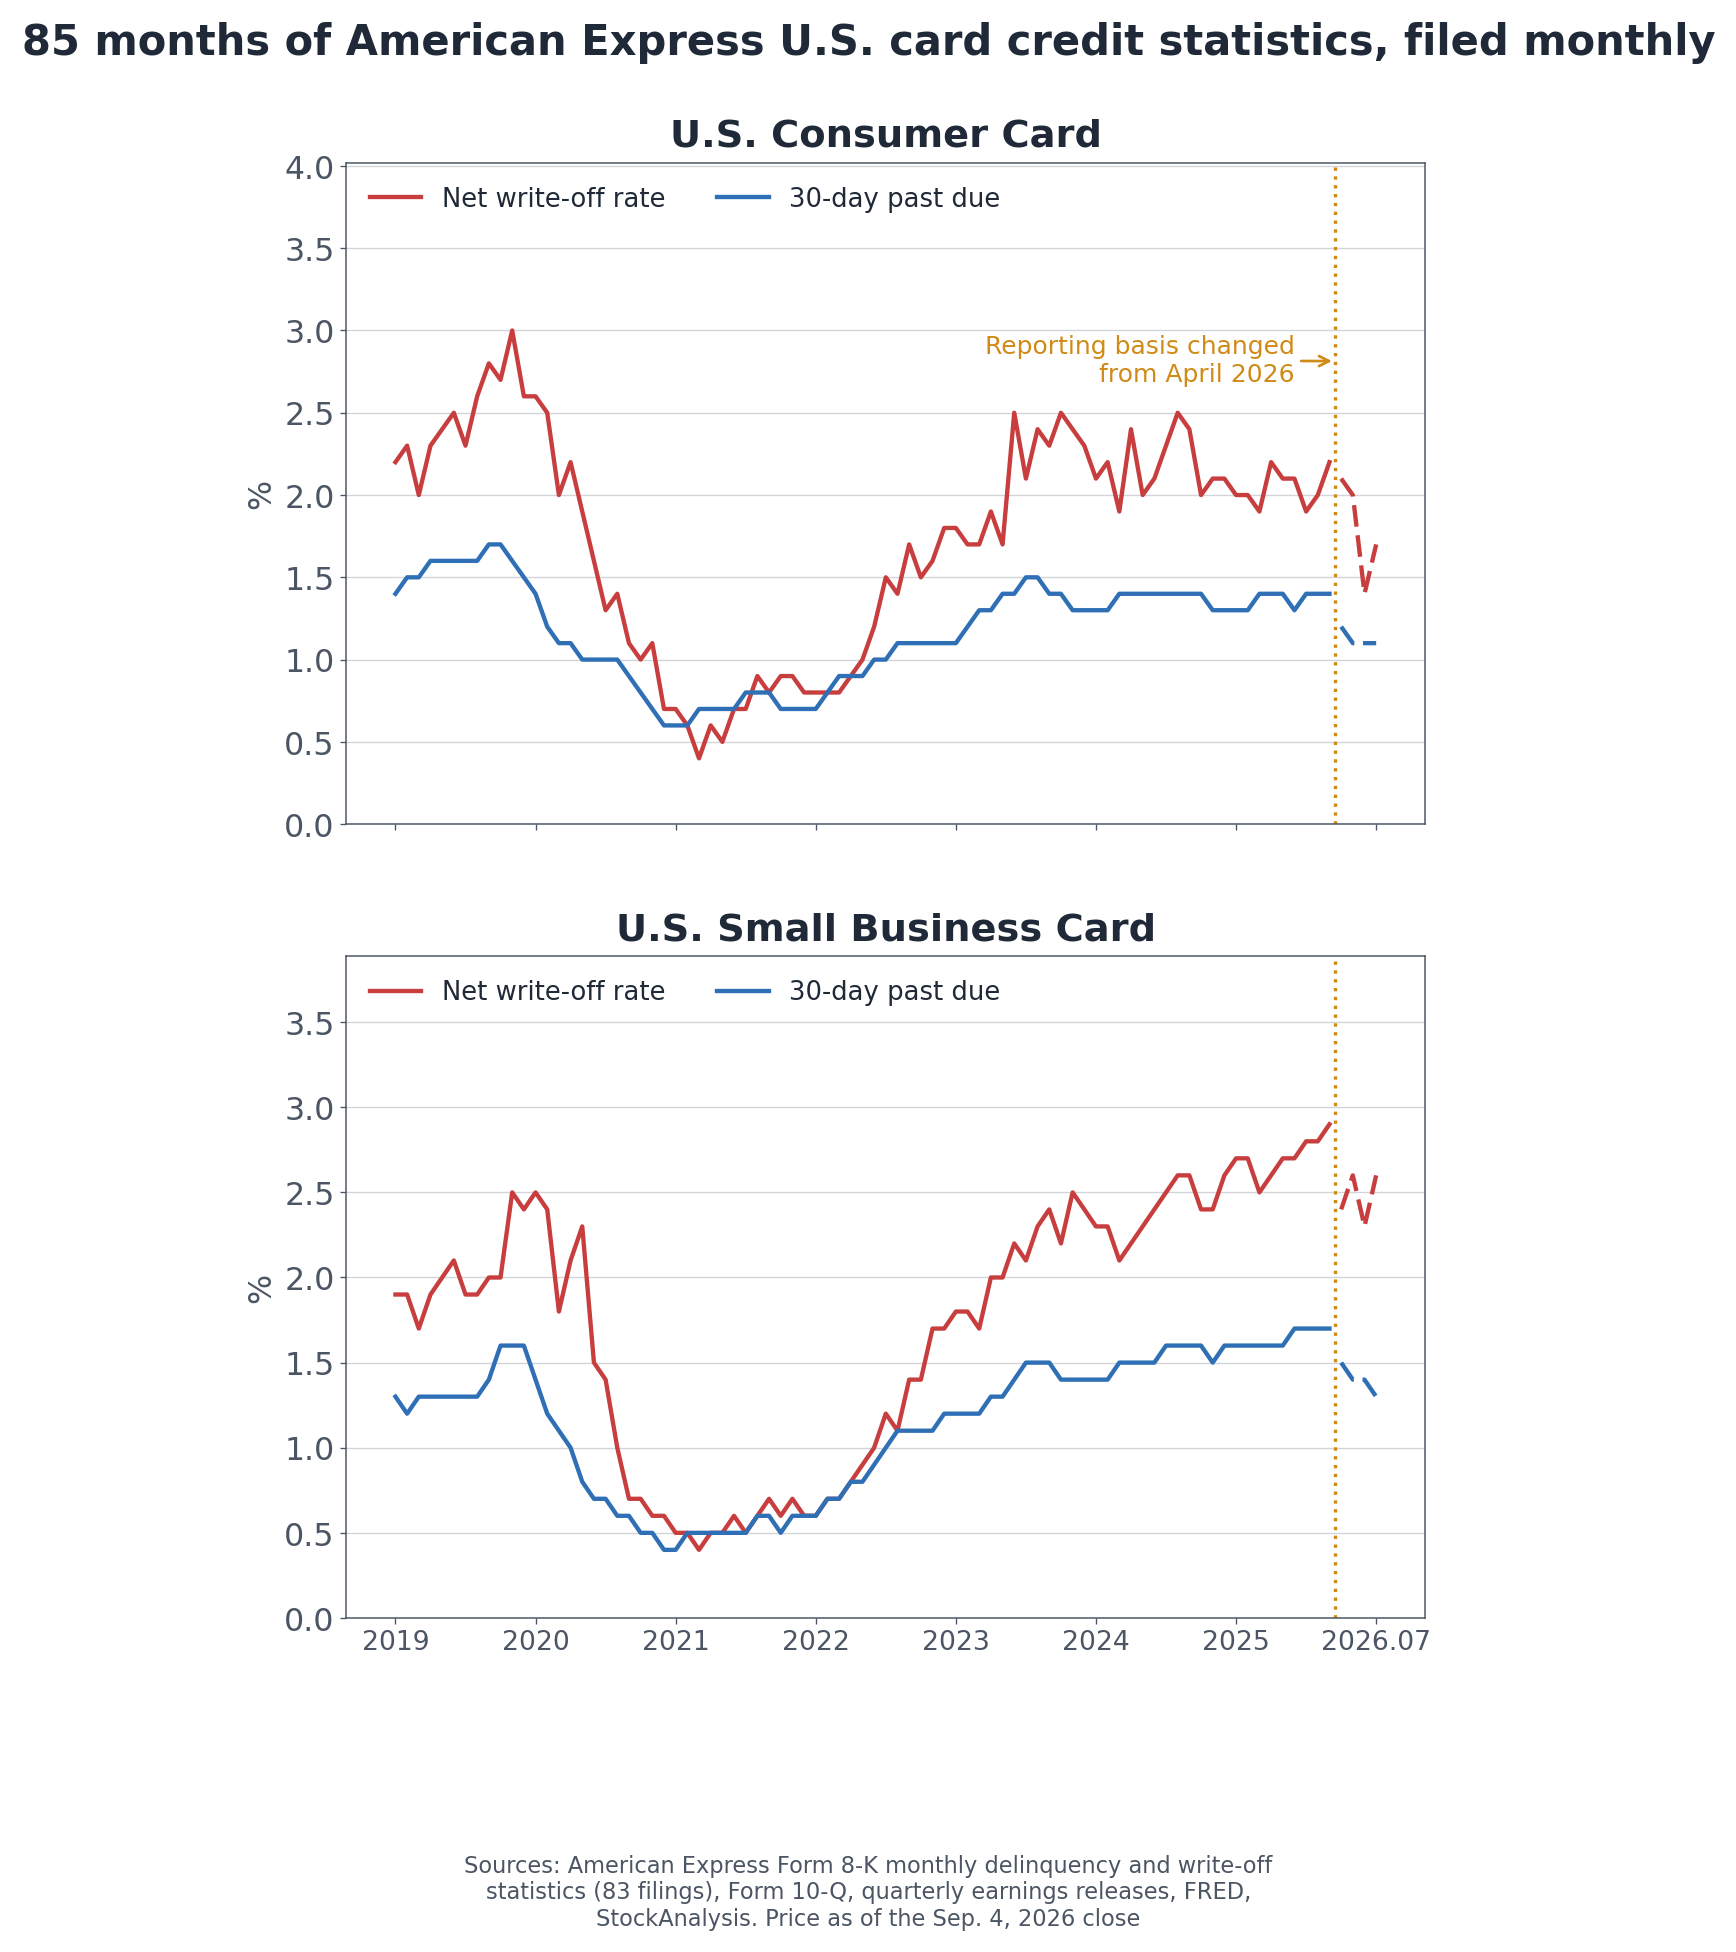
American Express Delinquency and Write-Off Rates: 85 Months
American Express issues cards and earns interest on the balances customers carry. The first number to look at is not revenue. It is the share of those balances the company does not get back, and the company publishes that number every month.
Own calculation (83 monthly Form 8-K filings, July 2019 through July 2026): I downloaded all 177 Form 8-K filings the company submitted since October 2019, kept the 83 that carry the monthly delinquency and write-off table, and parsed every row into a single series. Because each filing reports three months and the filings overlap, most months are reported two or three times. Across 85 months, only two months ever came back with different numbers: February and March 2026.
85 months of monthly U.S. card credit statistics, with the April 2026 basis change marked
Three regimes are visible. The write-off rate reached 3.0 percent after the 2020 shutdowns, fell to 0.4 percent through 2021, and settled back near 2 percent from 2023. The small business series is cleaner still: it climbed in one direction to 2.9 percent by March 2026.
Then both lines turn at the same point, where the chart switches to a dashed segment. Consumer write-offs go from 2.2 percent to 1.4 percent; delinquency from 1.4 percent to 1.1 percent. Eight months of one direction reversed in four. What happened?
U.S. Consumer Card
Feb 2026
Mar 2026
Apr 2026
May 2026
Jun 2026
Jul 2026
30-day past due (%)
1.3
1.3
1.2
1.1
1.1
1.1
Net write-off rate (%)
1.9
2.0
2.1
2.0
1.4
1.7
Total card balances (USD bn)
107.4
110.8
111.4
113.8
113.8
113.1
February and March 2026 shown on the new reporting basis. Source: monthly Form 8-K statistics.
Why the Denominator Changed in April 2026
The company wrote the answer down.
Company disclosure (Form 8-K, May 15, 2026): "The Company has updated its presentation and disclosure of Card Member loans and Card Member receivables to present them on a combined basis as Card balances. As a result, the table below now presents all Card balances, including both revolve-eligible balances and balances that need to be paid in full on or before the Card Member's payment due date."
The company's own description of the presentation change, Form 8-K of May 15, 2026
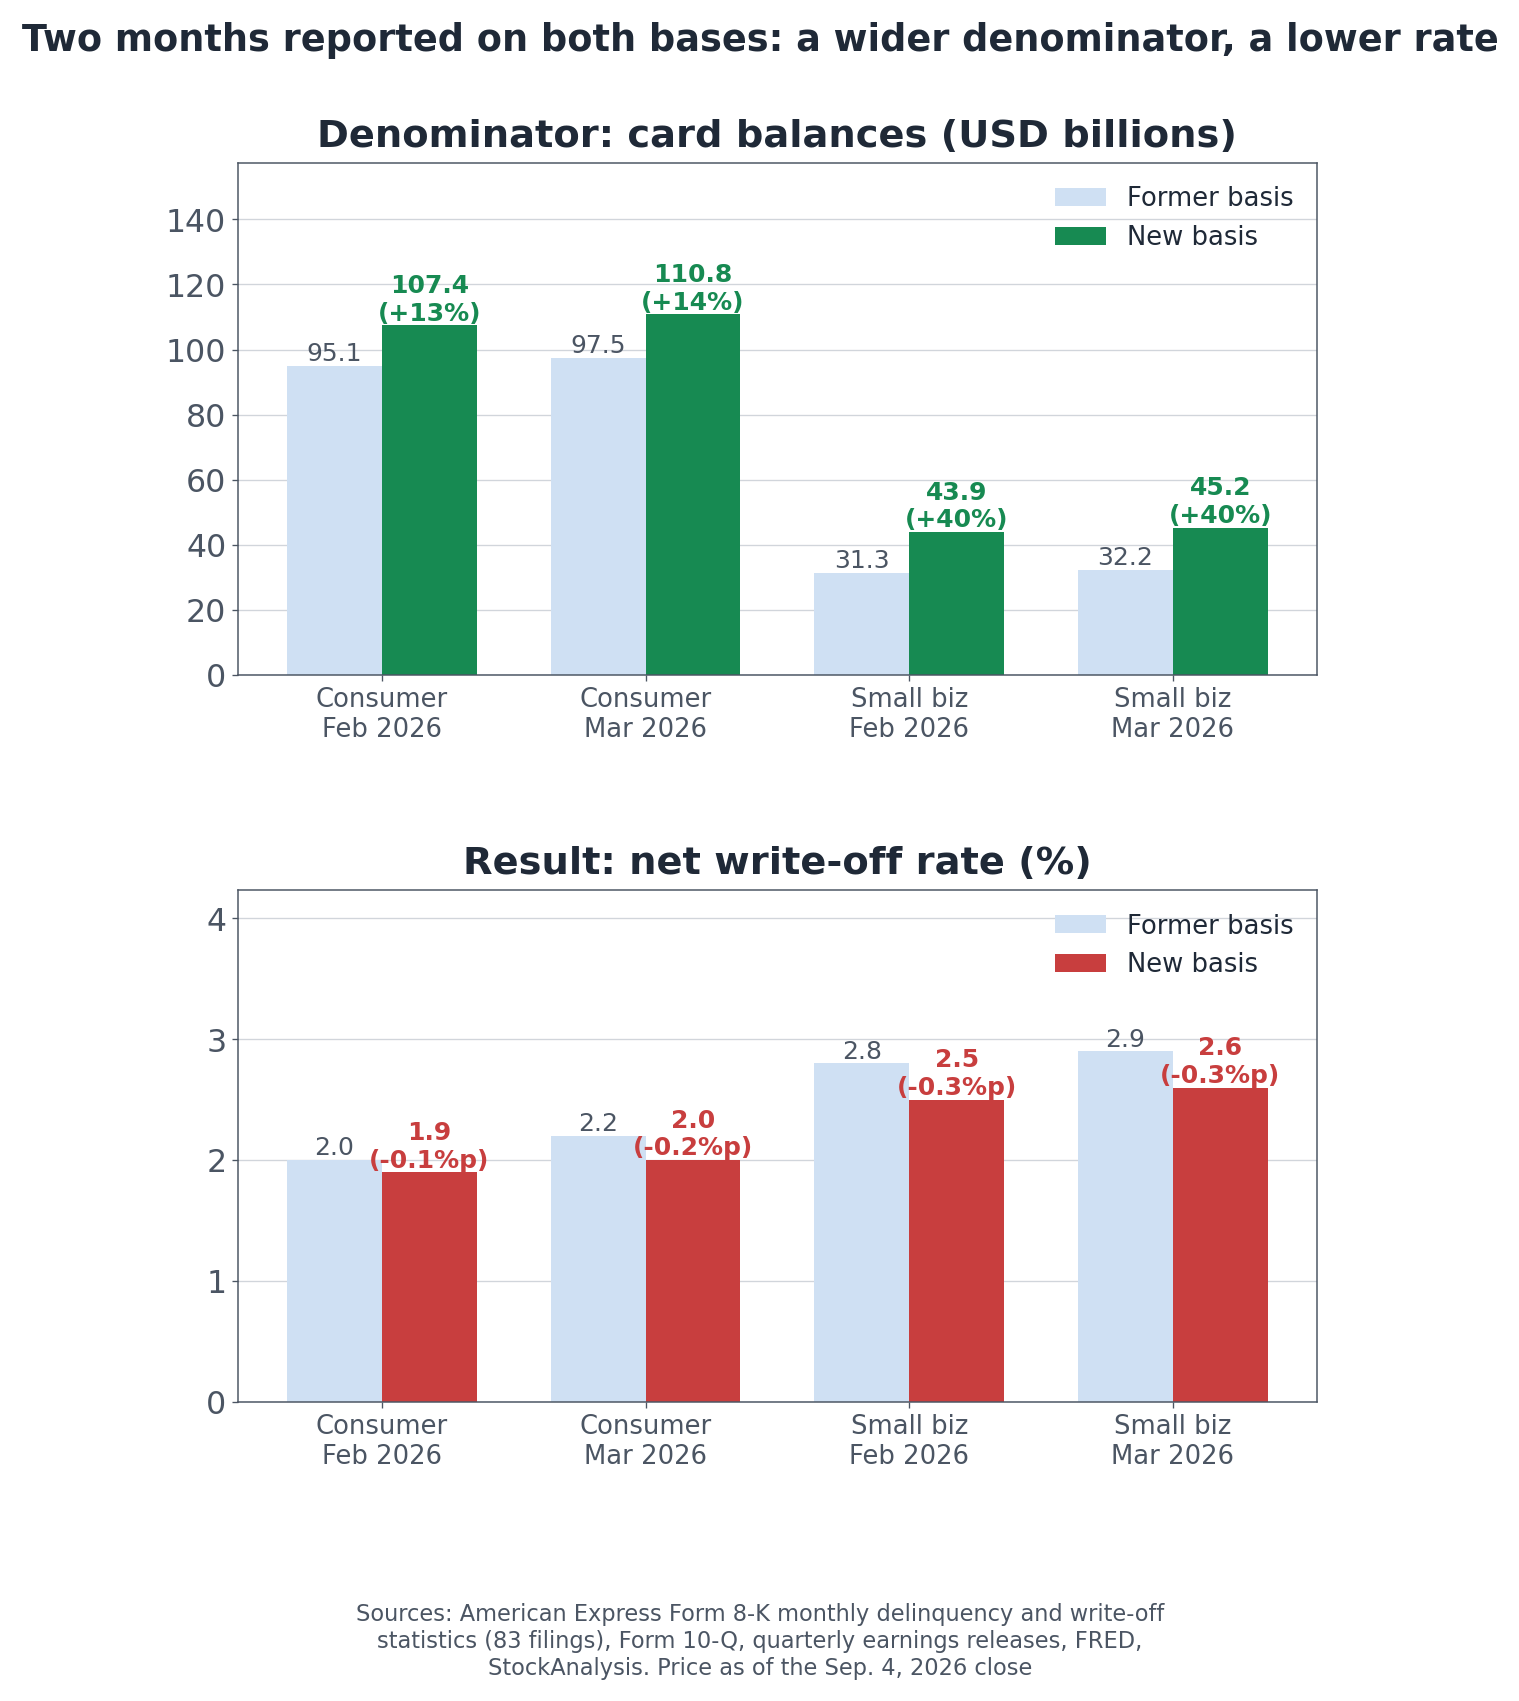
The denominator got wider. The old table measured delinquency against revolving loan balances only. The new one adds the balances of customers who pay in full every month, and those balances rarely go past due. The numerator barely moves; the denominator grows; the ratio falls on its own.
By how much? The company reported two months on both bases, which makes the effect measurable rather than assumed.
Own calculation (Form 8-K filings of April 15 and May 15, 2026, compared): For February 2026, U.S. consumer card balances were restated from $95.1 billion to $107.4 billion, 12.9 percent wider, and the same month's write-off rate was restated from 2.0 percent to 1.9 percent. Small business moved more: $31.3 billion became $43.9 billion, 40.3 percent wider, and the write-off rate went from 2.8 percent to 2.5 percent.
Two months reported on both bases, and what the wider denominator did to the rates
None of this is wrong. The company disclosed the change and pointed to the Form 10-Q for detail. But the step down between March and April 2026 is not customers paying better. It is a different ruler. Splicing the series together and calling it an improvement puts words in the company's mouth that the company did not say.
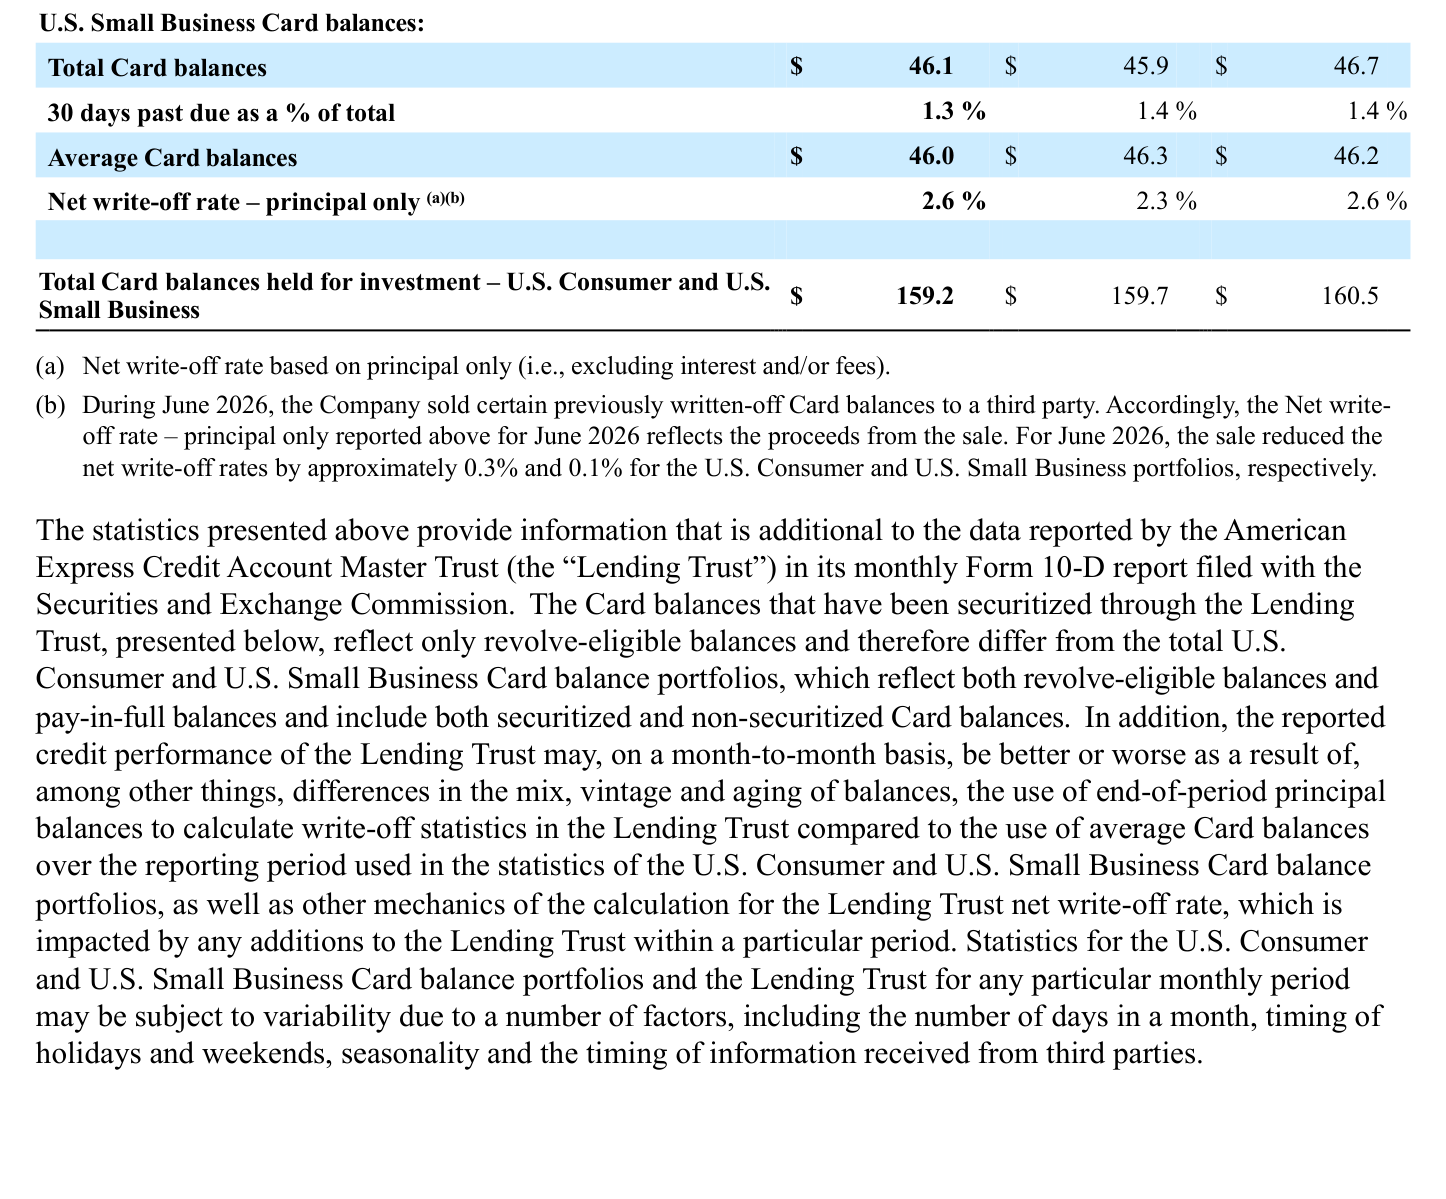
Did American Express Sell Charged-Off Card Balances?
It did, in June, and it said so in a footnote.
Filing footnote (monthly Form 8-K statistics, note (b), filed July 15 and August 17, 2026): "During June 2026, the Company sold certain previously written-off Card balances to a third party. Accordingly, the Net write-off rate – principal only reported above for June 2026 reflects the proceeds from the sale. For June 2026, the sale reduced the net write-off rates by approximately 0.3% and 0.1% for the U.S. Consumer and U.S. Small Business portfolios, respectively."
Footnote (b), disclosing the June sale of previously written-off balances
That footnote appears for the first time in 85 months of filings. I checked every month back to July 2019 and found no comparable note. Add the 0.3 percentage points back to June's 1.4 percent and it becomes 1.7 percent, which sits level with April's 2.1 percent and May's 2.0 percent rather than below them.
So two things pushed the reported credit numbers down in the first half of 2026. The wider denominator runs through every month from April onward. The asset sale hit June alone, and it was gone by July, which is why the rate went back to 1.7 percent. Convert July's 1.7 percent to the old basis and it lands around 1.8 to 1.9 percent. A year earlier the same month read 2.0 percent. That is closer to flat than to better.
Provisions, Not Revenue, Drove Pretax Income
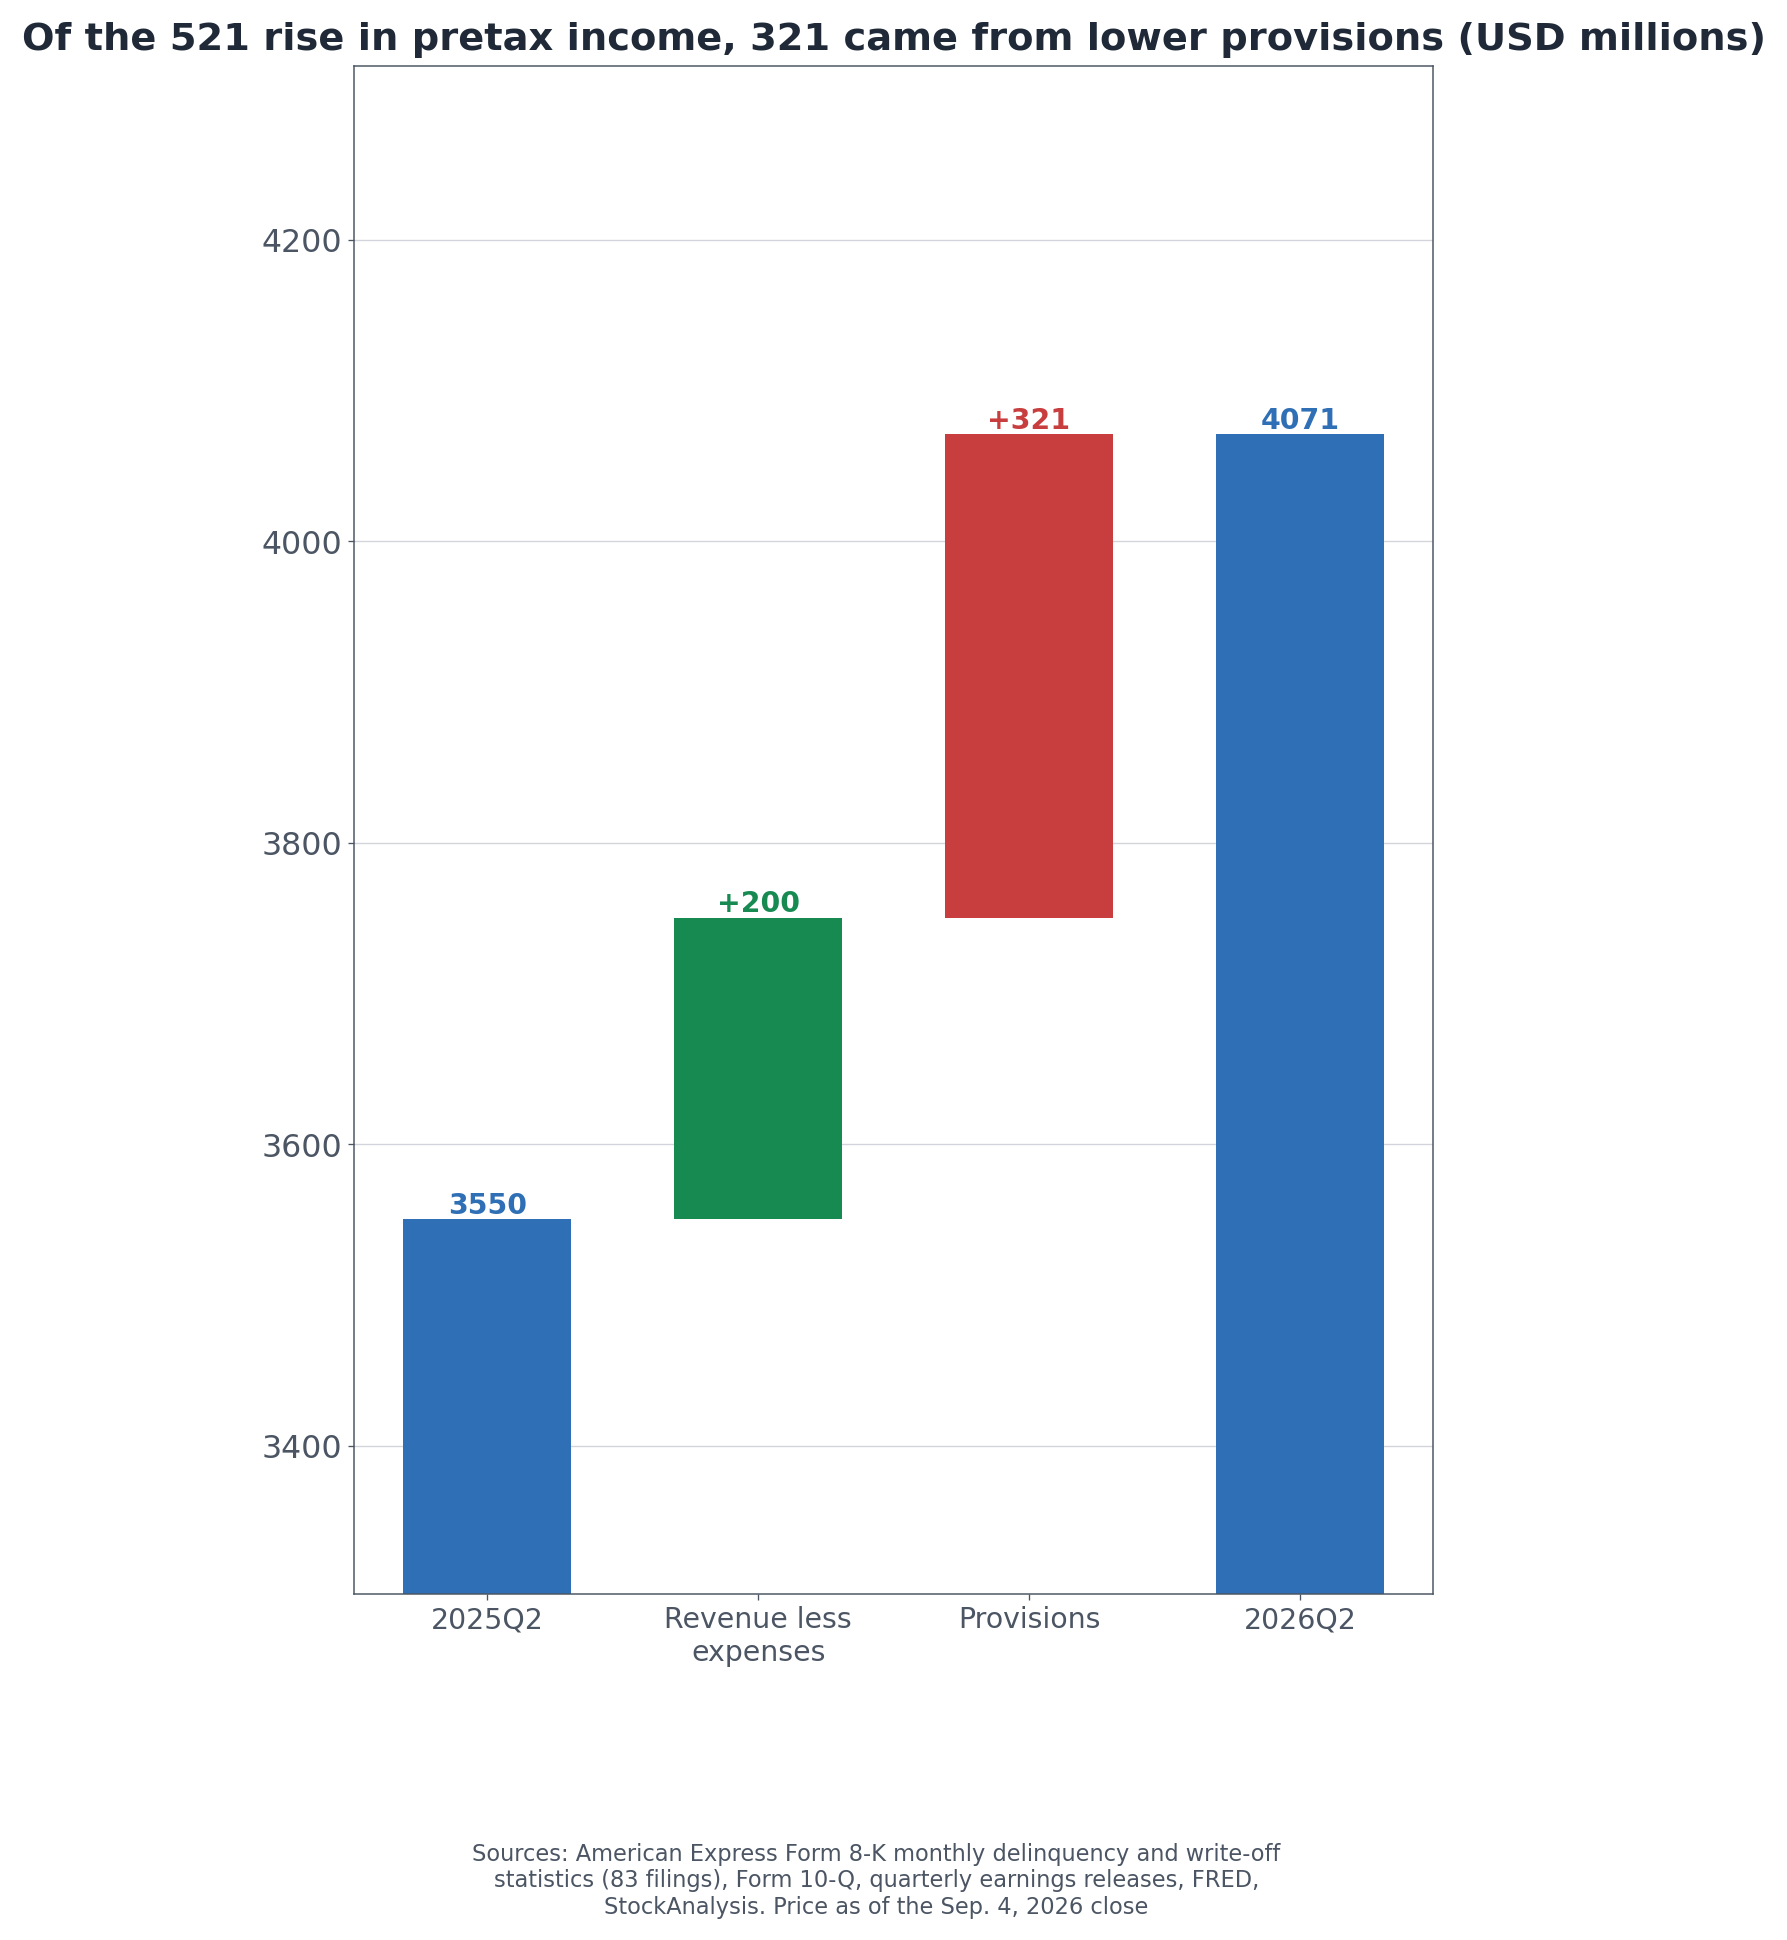
How much of the quarter rides on this? Splitting the income statement answers it. All figures below are U.S. GAAP.
Own calculation (Form 10-Q XBRL: total revenues net of interest expense, total expenses, and provisions, Q2 2025 vs. Q2 2026): Pretax income rose from $3,550 million to $4,071 million, an increase of $521 million. Provisions for credit losses fell from $1,405 million to $1,084 million, and that $321 million decline is 62 percent of the total increase. Revenue added $1,781 million, expenses took away $1,581 million, and the two together left $200 million.
Bridging pretax income from Q2 2025 to Q2 2026
Two thirds of the improvement came from the credit line. That is why two changes to how credit is measured are not a footnote for this company.
Provisions are not write-offs, of course. Provisions are an accounting charge for expected losses; write-offs are balances actually given up. The company explained the difference itself.
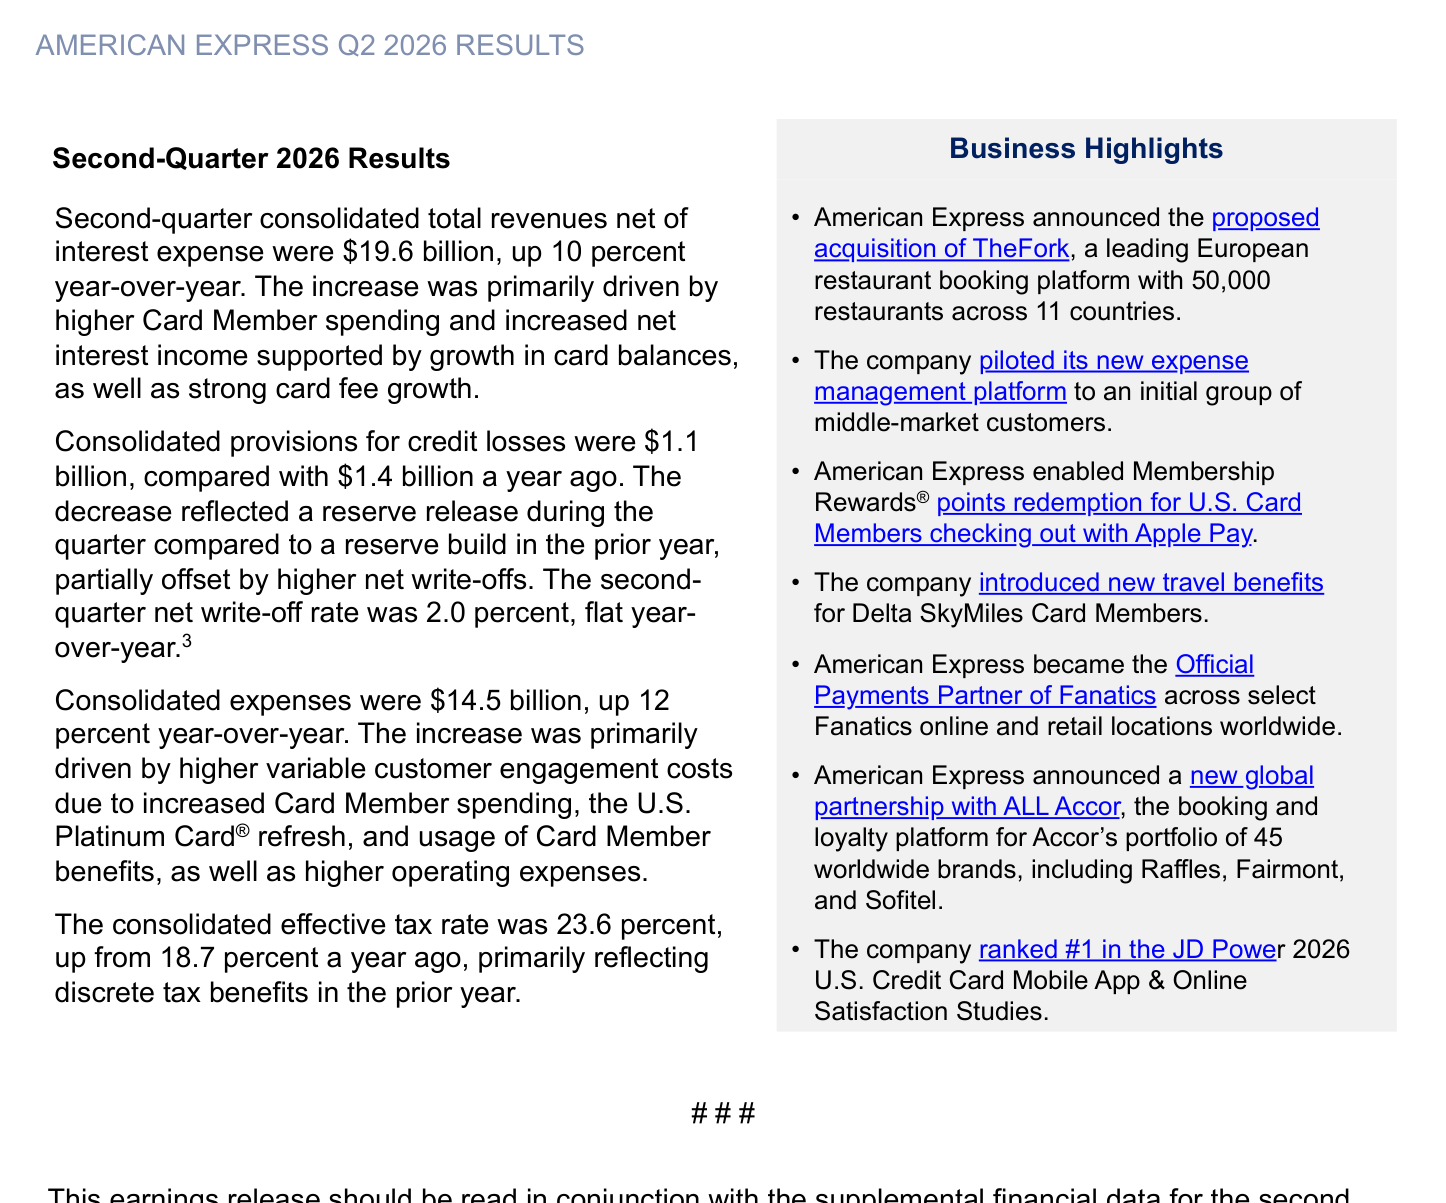
Company disclosure (second-quarter 2026 earnings release, July 24, 2026): "Consolidated provisions for credit losses were $1.1 billion, compared with $1.4 billion a year ago. The decrease reflected a reserve release during the quarter compared to a reserve build in the prior year, partially offset by higher net write-offs. The second-quarter net write-off rate was 2.0 percent, flat year-over-year."
The company's own account of why provisions fell
On the earnings call the same morning, management put a number on the release: the $1.1 billion provision expense included a reserve release of $191 million, attributed mainly to further strengthening in portfolio credit performance.
Read the release closely and the company concedes three things. Provisions fell because reserves were released. Actual write-offs went up, not down. And the write-off rate was flat against last year. In the same document, Chairman and Chief Executive Stephen J. Squeri writes that "our best-in-class credit performance further strengthened." One side of the page says stronger; the other says flat. Which one to weight is the reader's call.
Provisions as a share of revenue peaked at 9.1 percent in Q4 2023 and stand at 5.52 percent now, the lowest in four and a half years. How much of that decline is household repayment capacity and how much is the reserve model is not something the filings let you separate.
American Express Revenue Breakdown: Fees vs. Interest
Balance is needed here, because the credit line is not what holds this company up.
Company disclosure (second-quarter 2026 supplemental financial data, July 24, 2026): Of $19,637 million in total revenues net of interest expense, discount revenue was $10,163 million, net interest income $4,649 million, net card fees $2,862 million, and service fees and other revenue $1,963 million.
Q2 2026 revenue mix
USD millions
Share
Year over year
Discount revenue
10,163
51.8%
+9%
Net interest income
4,649
23.7%
+11%
Net card fees
2,862
14.6%
+15%
Service fees and other
1,963
10.0%
+7%
Total
19,637
100%
+10%
Only net interest income carries direct credit risk, and it is 23.7 percent of the total. The other 76 percent comes from a slice of every transaction and from annual fees. Card fees grew 15 percent, the fastest of the four, as the refreshed U.S. Platinum Card fee schedule worked through the base. Management noted on the call that card fee revenue has now grown at a double-digit rate for 32 consecutive quarters.
The same refresh shows up in costs. Expenses rose 12 percent, which the company tied to variable customer engagement costs, the Platinum refresh, and benefit usage. Revenue grew 10 percent. The company raised its full-year revenue growth guidance to 10 percent while leaving EPS guidance at $17.30 to $17.90, saying it plans to reinvest the outperformance.
U.S. Credit Card Delinquency Rate Trends
Is this an American Express story or an industry one? The official series says partly the latter.
Official statistics (FRED series DRCCLACBS and CORCCACBS, Q2 2026): The delinquency rate on credit card loans at all U.S. commercial banks was 2.85 percent and the charge-off rate 3.82 percent, against 3.23 percent and 4.70 percent in Q4 2024.
Industry credit card delinquency and charge-off rates against American Express
Two readings. American Express runs at well under half the industry level: 1.1 percent against 2.85 percent, and 1.7 percent against 3.82 percent. That is what a premium, fee-paying cardholder base looks like in the data. At the same time, the industry series has been moving the same way since 2025, which means the improvement at American Express cannot be separated into company effect and cycle effect from this chart alone.
U.S. revolving consumer credit outstanding
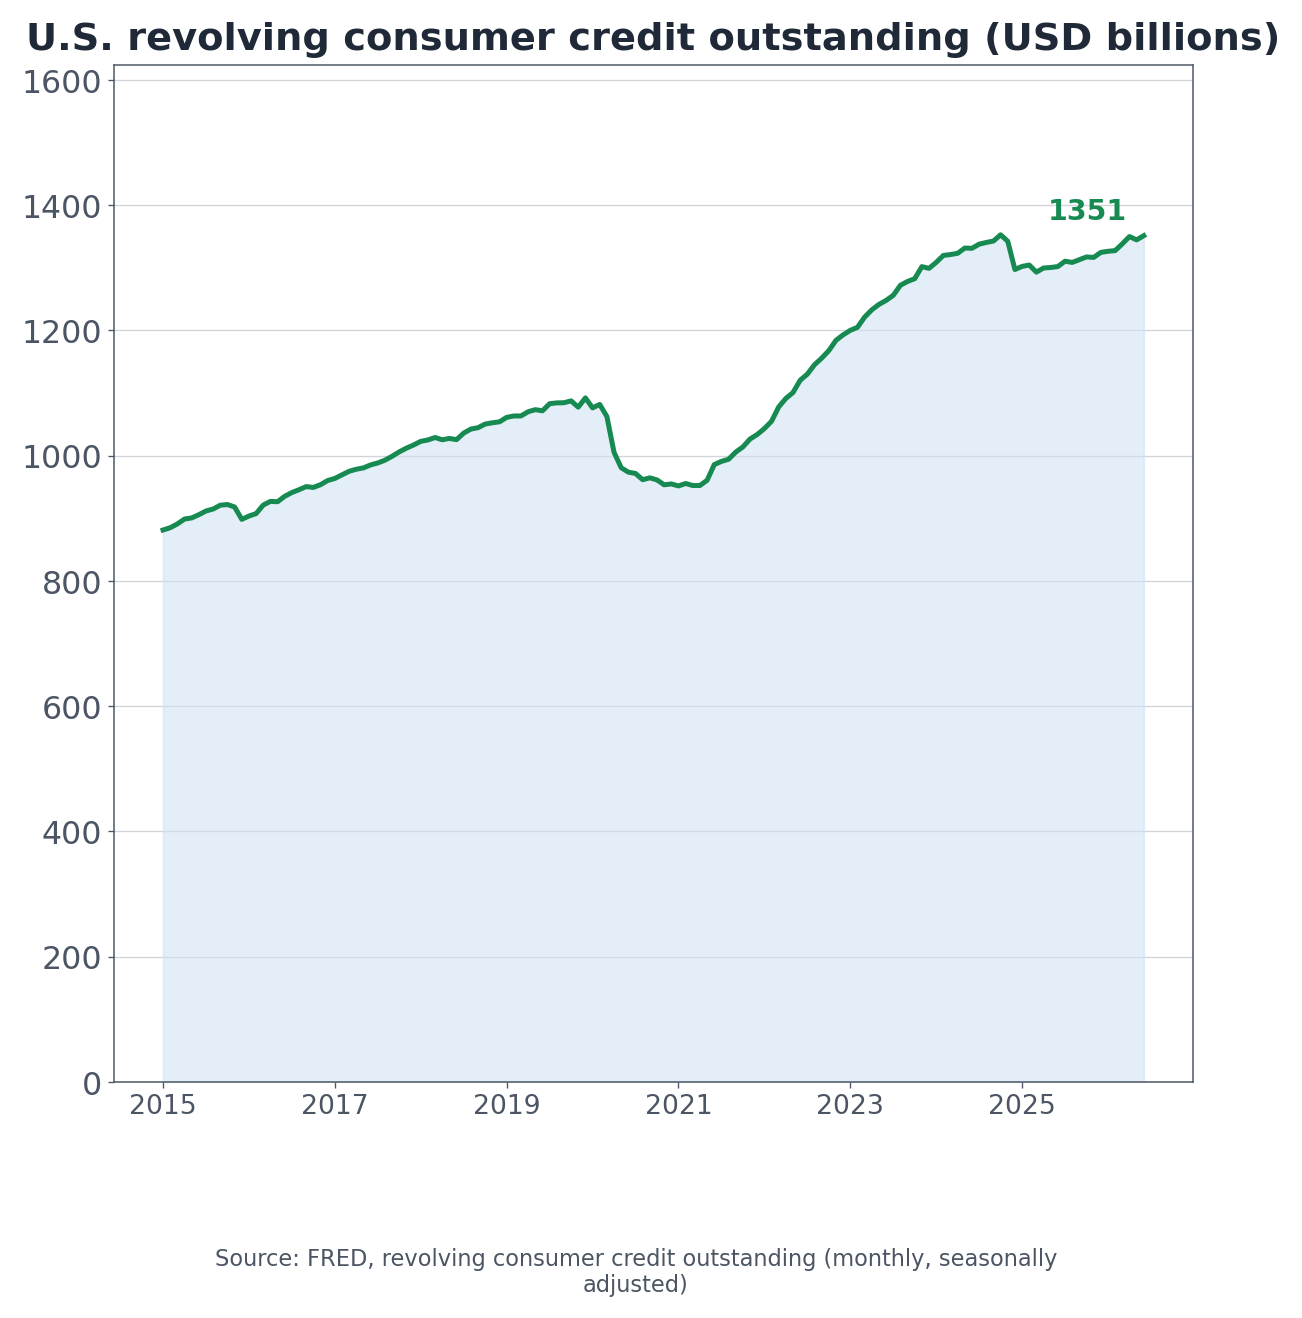
The market itself keeps growing. Revolving consumer credit outstanding reached $1,351 billion in June 2026, near a record, with the average card rate at 20.94 percent. American Express card balances grew 8 percent to $218 billion. Larger balances bring more interest income and more exposure at the same time; right now the first is arriving in the income statement ahead of the second.
AXP Valuation vs. Visa, Mastercard, Capital One and JPMorgan
The business mix shows up directly in the multiples.
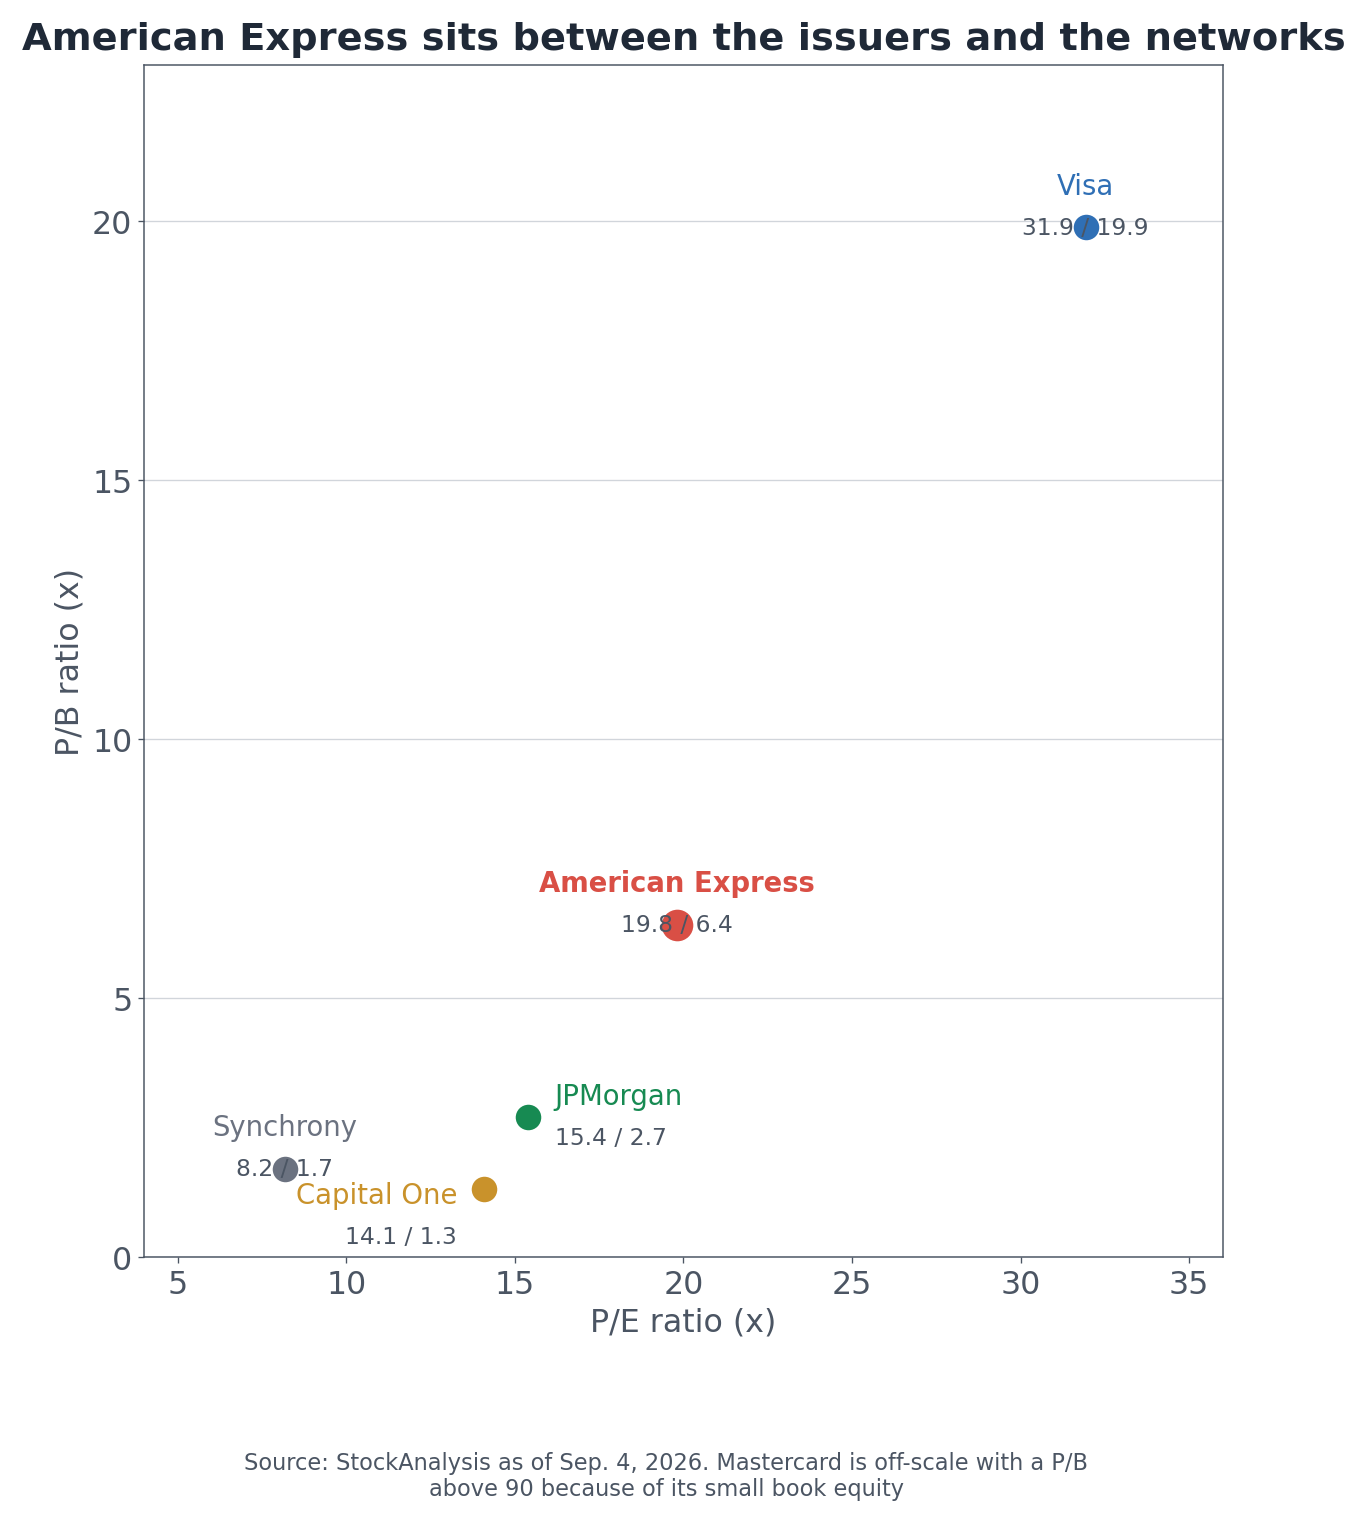
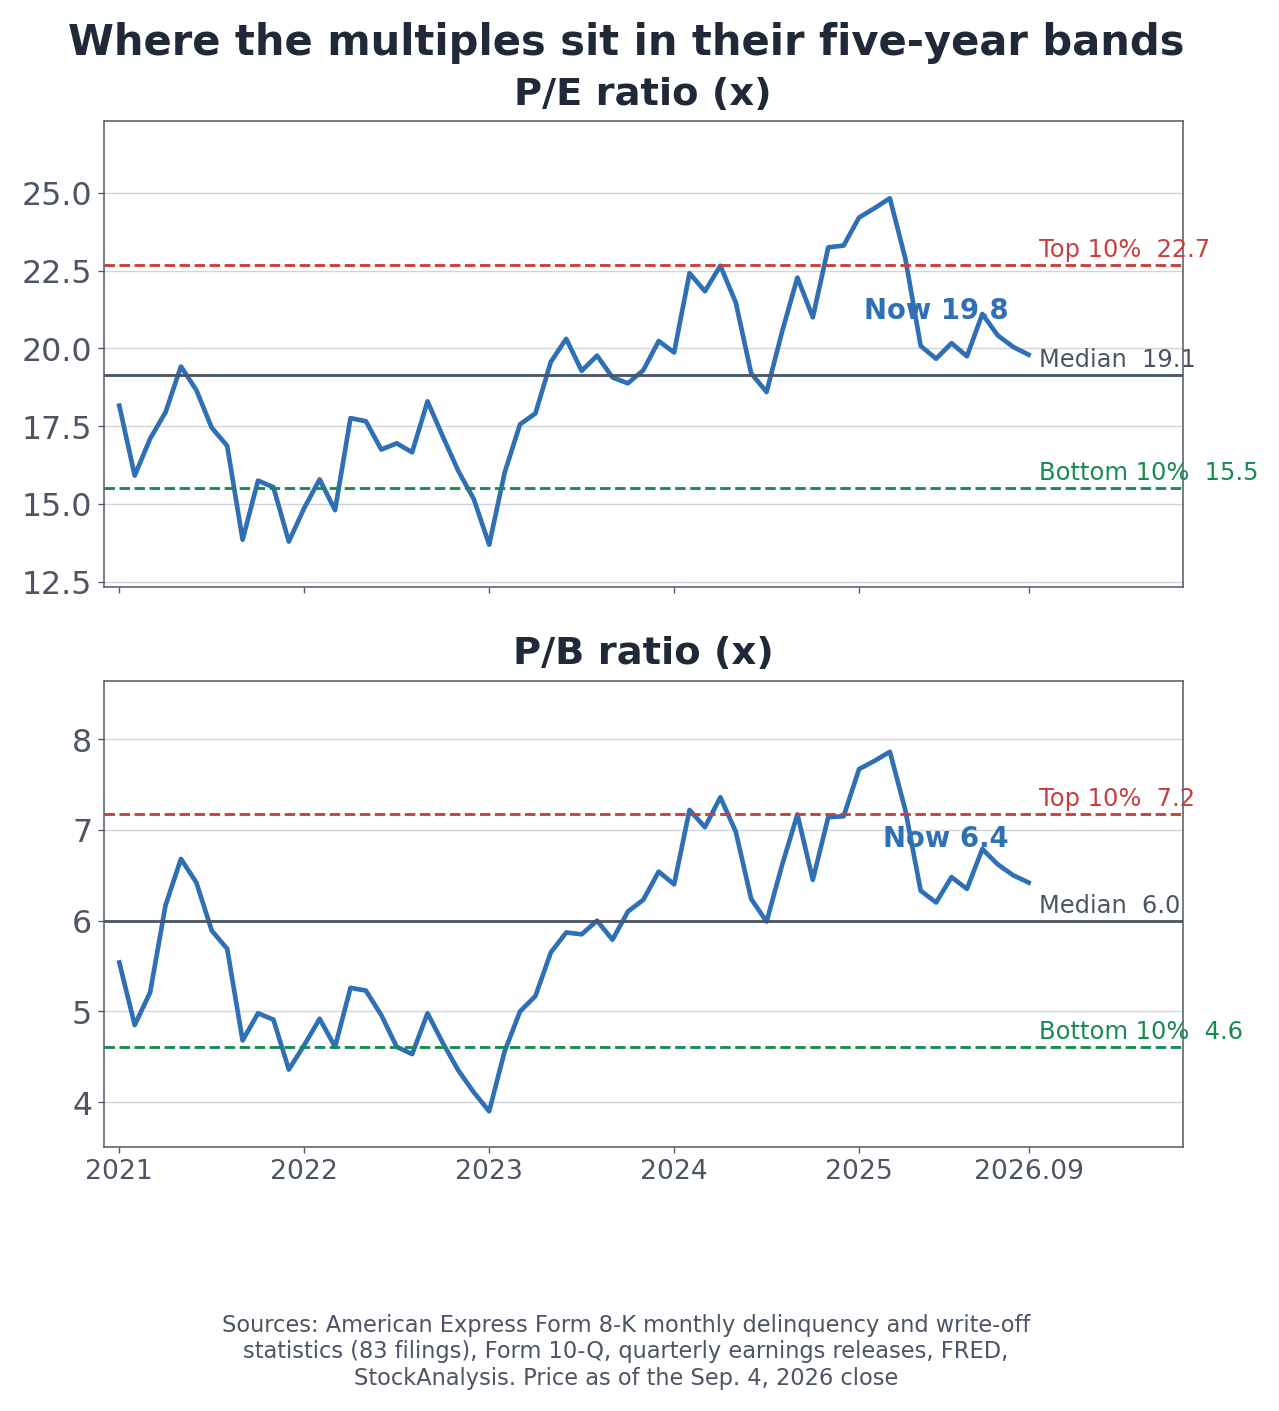
Aggregator cross-check (as of the September 4, 2026 close): American Express trades at 19.8x trailing earnings and 6.42x book value.
American Express between the networks and the issuers
Company
P/E (x)
P/B (x)
Market cap
American Express
19.8
6.42
$220.3bn
Visa
31.9
19.9
$688.5bn
Mastercard
31.9
90.6
$507.4bn
Capital One
14.1
1.31
$134.7bn
Synchrony
8.2
1.71
$26.0bn
JPMorgan
15.4
2.70
$953.3bn
Issuers that hold card loans on the balance sheet trade at 8x to 15x. Networks that take a fee and hold nothing trade near 32x. American Express sits between them at 19.8x, which is what a company that carries the credit risk but earns three quarters of its revenue from fees looks like when the market prices it.
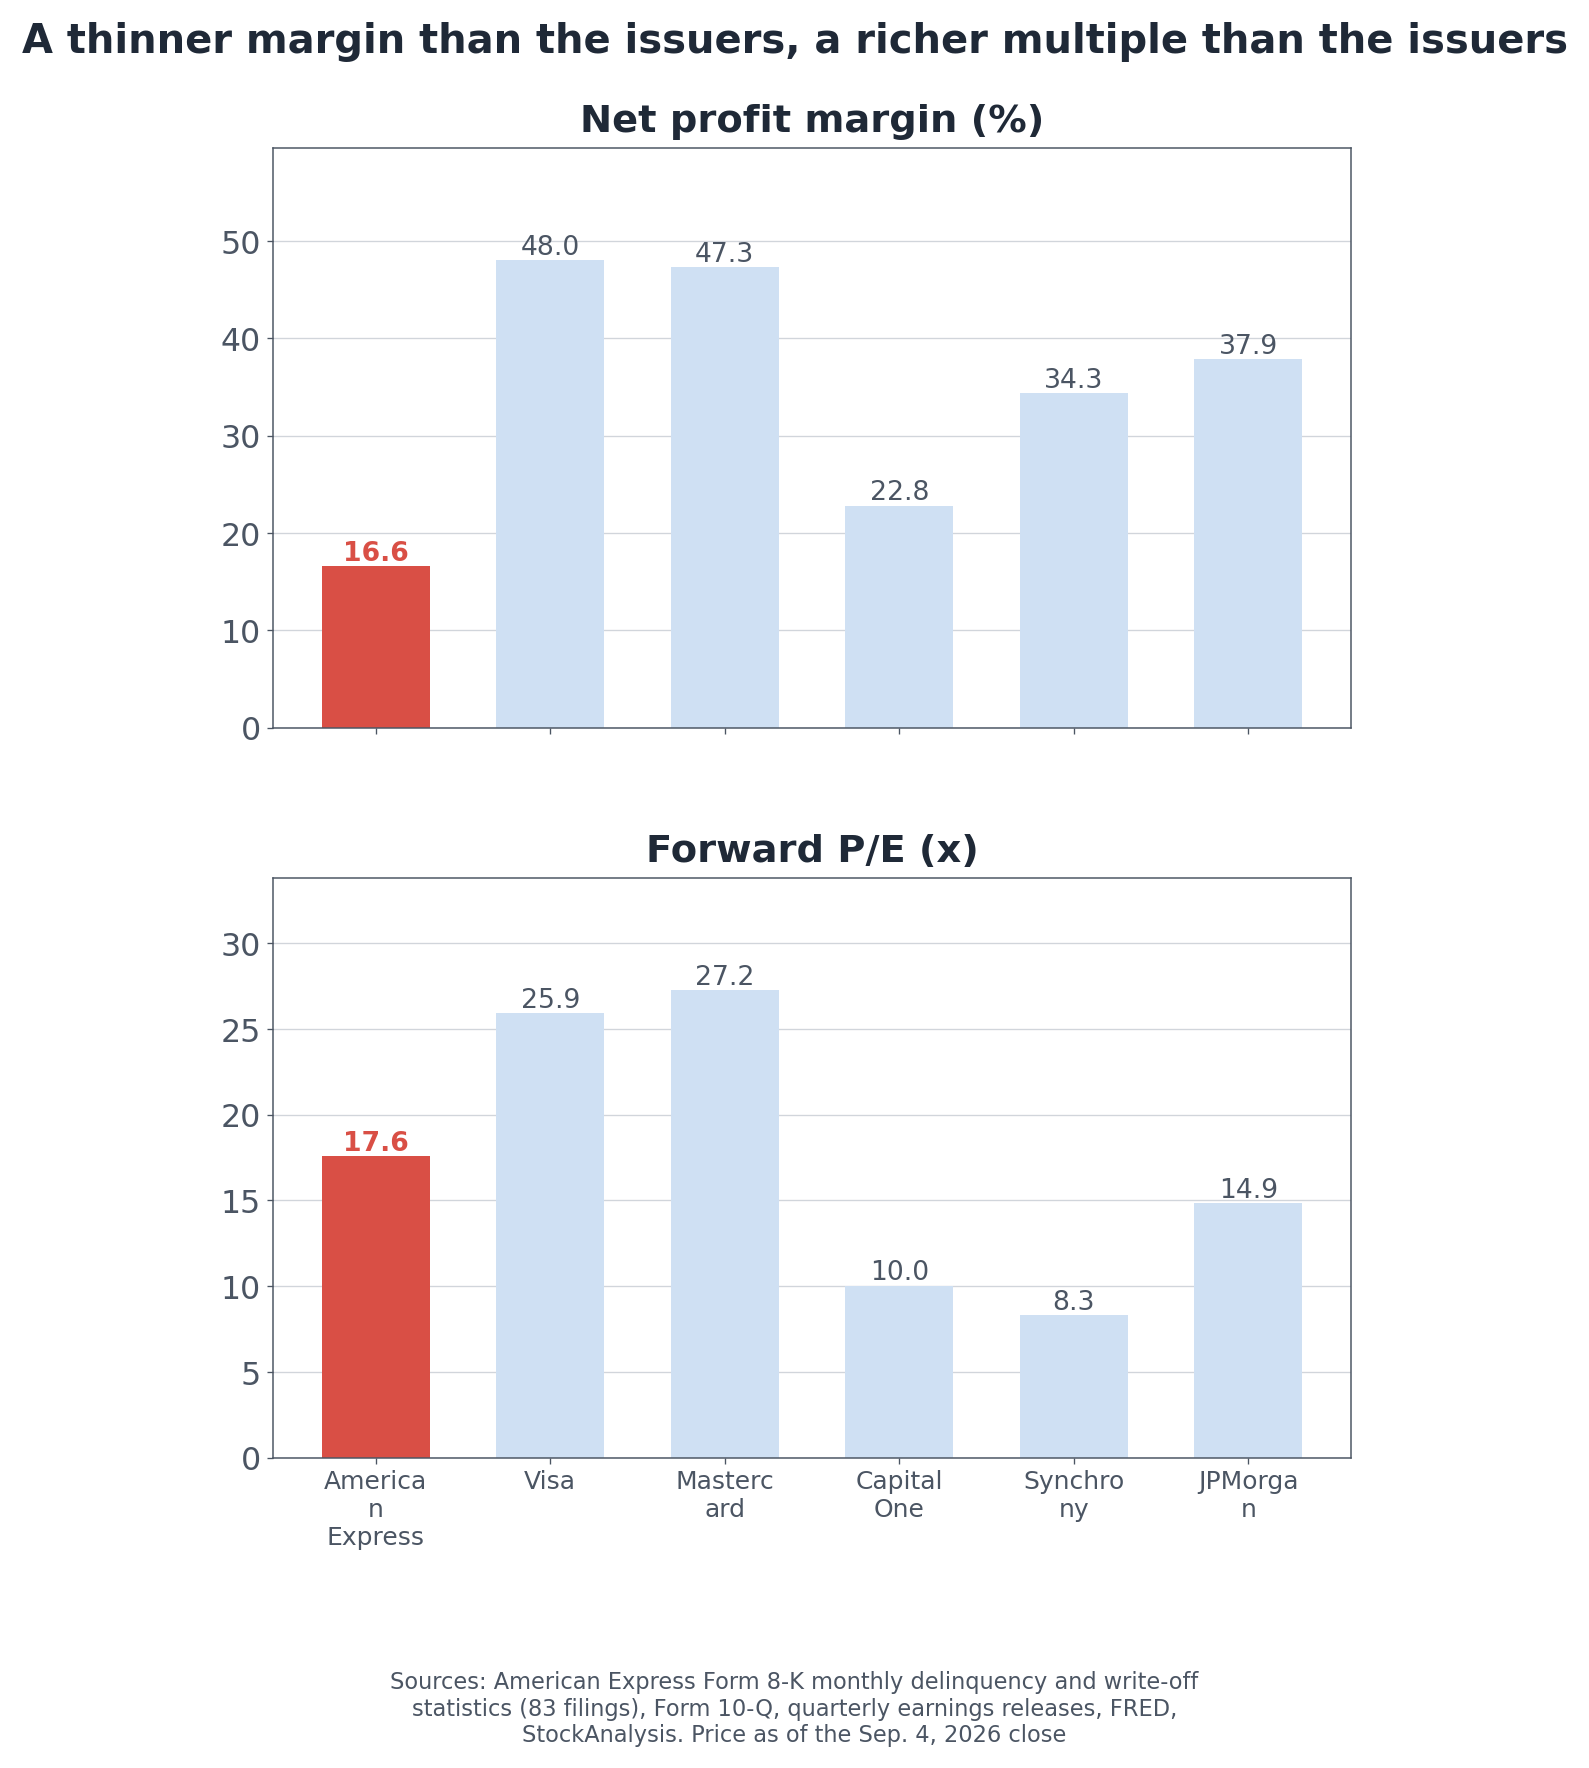
Net margin and forward earnings multiple across the group
Company
Return on equity
Shareholder payout yield (dividend + buyback)
Forward P/E (x)
American Express
34.4%
3.66%
17.6
Visa
61.2%
3.59%
25.9
Mastercard
241.2%
2.95%
27.2
Capital One
9.0%
shares issued for acquisition
10.0
Synchrony
20.8%
11.49%
8.3
JPMorgan
17.8%
5.23%
14.9
Mastercard's return on equity is overstated by a small book equity base after years of buybacks. Capital One issued shares to acquire Discover, so its buyback yield is negative.
One line stands out. At 16.6 percent, the American Express net margin is the lowest in this table, below both Synchrony at 34.3 percent and Capital One at 22.8 percent. Yet its forward multiple is roughly double theirs. Heavy spending on cardholder benefits keeps the margin thin, and the market pays for the recurring fee stream instead.
Five-year P/E and P/B bands
Own calculation (month-end closes and trailing twelve-month diluted EPS, October 2021 through September 2026): The 19.8x earnings multiple sits at the 65th percentile of its own five-year band and the 6.42x book multiple at the 68th. Five-year medians are 19.1x and 6.00x. Both have come down from 24x and 7.9x in early 2025. Neither cheap nor expensive is the honest description.
AXP Price Targets and Analyst Revisions
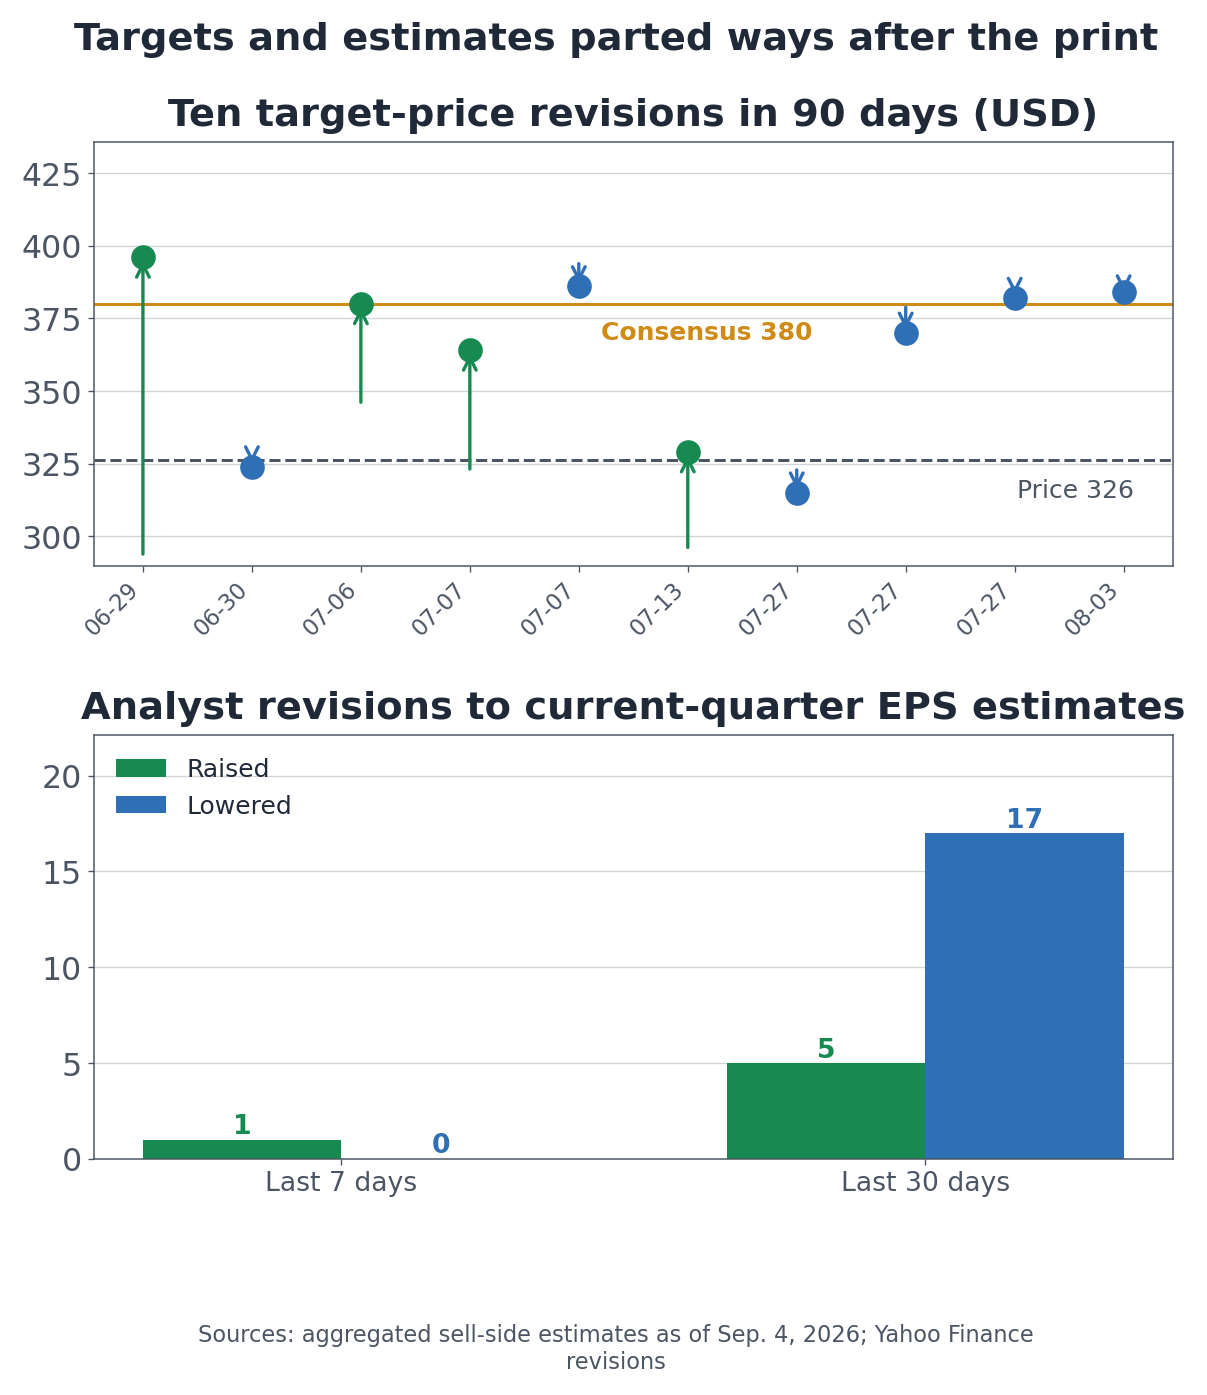
Aggregator cross-check (aggregated sell-side research, as of September 4, 2026): The average price target is $380, or 16.6 percent above the current price, in a range of $315 to $415. Of ten rating or target changes in the past 90 days, four were raises and six were cuts.
Target price revisions over 90 days and current-quarter EPS estimate changes
Date
Firm
Rating
Target
2026-08-03
UBS
Neutral
$386 → $384
2026-07-27
Morgan Stanley
maintained
$385 → $382
2026-07-27
Evercore ISI
maintained
$380 → $370
2026-07-27
BTIG
maintained
$324 → $315
2026-07-13
HSBC
Hold
$295 → $329
2026-07-07
Barclays
maintained
$322 → $364
The dates split cleanly. Before the July 24 earnings release, targets were mostly going up. Three days after it, on July 27, three firms cut on the same day, in a quarter that raised revenue guidance and delivered 11 percent EPS growth. The 12 percent expense growth and the source of the pretax gain are the plausible reasons.
Estimate revisions point the same way. Over the past 30 days, five analysts raised current-quarter EPS estimates and seventeen lowered them. This is a company that beat consensus in seven of the last eight quarters by an average of 3.8 percent, and estimates are now drifting down.
What Would Change This Picture?
Scenario
Condition
Indicator to check
When and source
Upside
New-basis write-off rate stays below 2 percent and delinquency holds near 1.1 percent
Full-year EPS reaches the top of the $17.30 to $17.90 guidance range
Fourth-quarter earnings release
January 2027
Downside
Old-basis write-off rate crosses back above 2 percent
Monthly Form 8-K, reversing the denominator change
Every month, mid-month
Downside
Reserve releases stop and provisions return toward 7 percent of revenue
Form 10-Q provisions and total revenues
Late October
Downside
Expense growth keeps outrunning revenue growth and compresses the pretax margin
Quarterly earnings release, expense lines
Late October
The cheapest test is the first row. This company does not make you wait for a quarter. The August 17 filing carried data through July, so the next monthly filing, due around the middle of September, will carry August. A consumer write-off rate near 1.7 percent would mean the series settled once the asset sale washed out. A move back into the 2 percent range would put more weight on the reading that the last four months were measurement rather than performance.
Three Questions This Analysis Does Not Answer
What assumptions produced the reserve release? The company gave the amount, $191 million, and a one-line reason. Whether the change came from unemployment forecasts, recovery assumptions, or portfolio mix is not disclosed.
What did the charged-off balances sell for? Neither the size of the sale nor the proceeds appears in the filings. Only the effect on the rate, 0.3 and 0.1 percentage points, is in the footnote.
What does the pre-2026 series look like on the new basis? The company restated two months. The 2019 through 2025 history has not been recalculated on the combined Card balances basis.
Credit statistics come from every Form 8-K American Express filed with the SECsince October 2019. I downloaded all 177 of them, identified the 83 that contain the monthly delinquency and write-off table, and parsed each row into a continuous 85-month series covering July 2019 through July 2026, with no missing months. Because each filing repeats three months, overlapping values served as a consistency check; the only disagreements were February and March 2026, which is how the reporting-basis change was measured rather than assumed. Income statement figures come from Form 10-Q XBRL data, with quarterly values verified against annual totals for 2019 through 2025 and pretax income reconciled to the figures printed in the earnings release. Industry comparisons use FRED series DRCCLACBS, CORCCACBS, and REVOLSL. Multiples use month-end closes and trailing twelve-month diluted EPS, cross-checked against aggregated market data as of the September 4, 2026 close. Analyst targets and estimate revisions are from aggregated sell-side research as of the same date.
This article is for information only and is not investment advice. Last updated: September 6, 2026.