CrowdStrike (CRWD) Stock Analysis: GAAP vs Non-GAAP Results
by Global Stock Brief2026. 9. 8.
CrowdStrike Holdings (CRWD) Stock Analysis
CrowdStrike Holdings (NASDAQ: CRWD) reported second-quarter fiscal 2027 revenue of $1.47 billion, up 26 percent year over year, with annual recurring revenue of $5.84 billion and record net new ARR of $332.8 million. This CRWD stock analysis works through the gap between the company's GAAP and non-GAAP results across thirty quarters, what still sits inside the adjustments two years after the July 19 outage, how the business itself has recovered, and where the multiples stand against Palo Alto Networks, Fortinet, Zscaler, and SentinelOne.
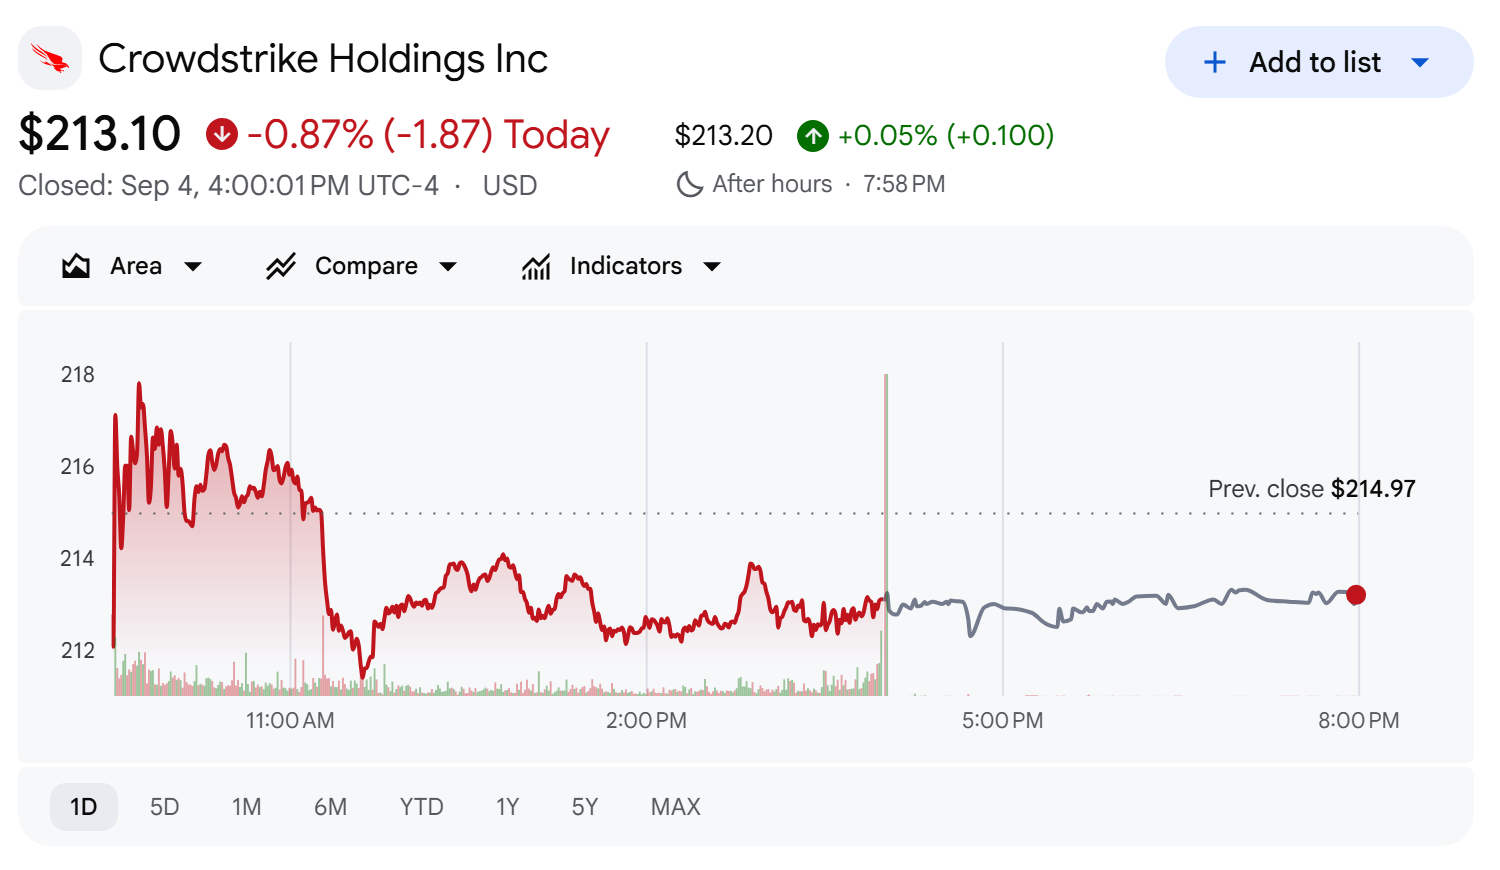
CrowdStrike Holdings (CRWD), close of September 4, 2026
Founder and Chief Executive George Kurtz called it "the best quarter in CrowdStrike's history." Page three of the same document reports a GAAP operating loss of $33.2 million. Both statements are accurate. They are measured with different rulers.
CrowdStrike GAAP vs Non-GAAP: Thirty Quarters Compared
Most people who follow this company read the non-GAAP line, because that is the line the company speaks in and the line analysts model. How far apart the two rulers actually sit is not something a single quarter shows. So I counted all of them.
Own calculation (30 quarterly earnings releases, FQ1 2020 through FQ2 2027): I pulled every Form 8-K the company has filed since its 2019 listing, kept the 30 that carry a quarterly earnings release, and parsed GAAP operating income, non-GAAP operating income, revenue, ARR, net new ARR, and free cash flow into a continuous thirty-quarter series with no gaps.
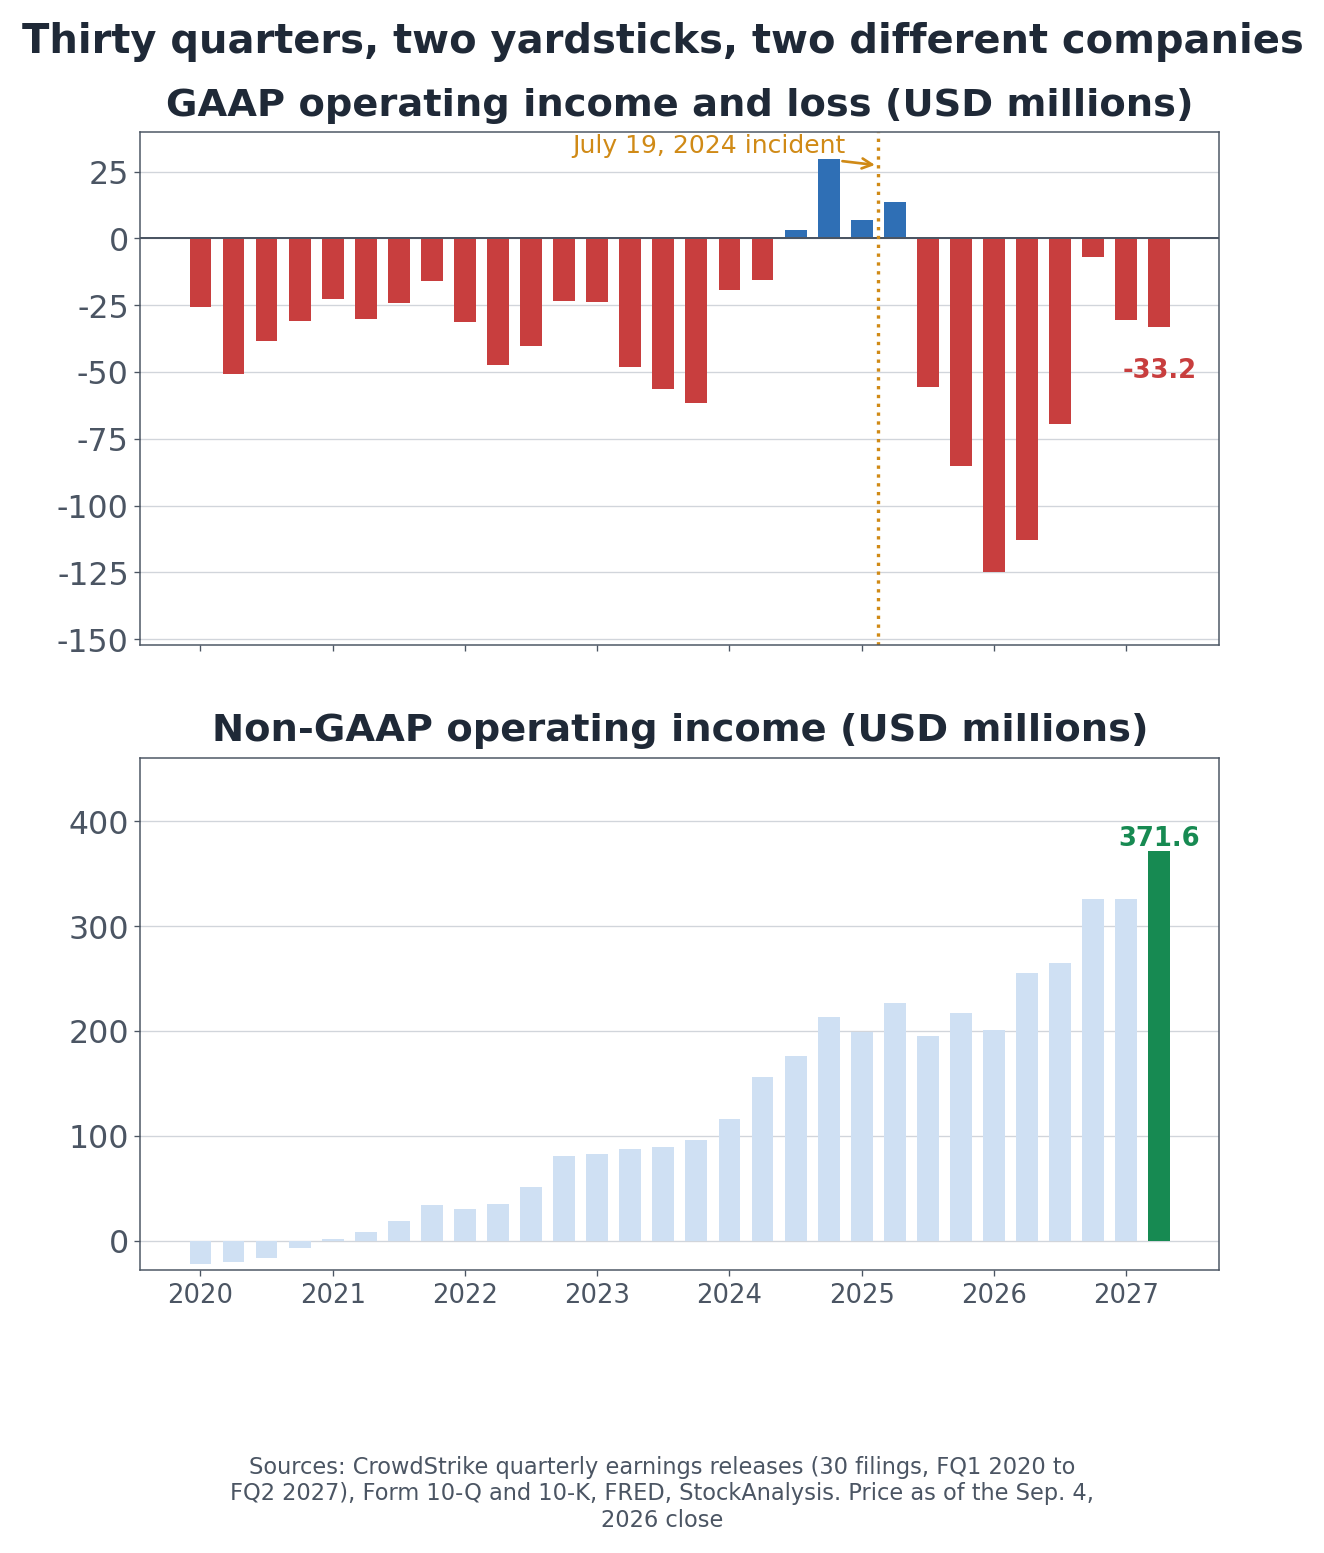
The same thirty quarters measured two ways
The two panels look like two different companies. Non-GAAP operating income crossed into profit in early fiscal 2022 and has not turned back since, reaching $371.6 million this quarter. GAAP operating income was positive in four quarters out of thirty, from FQ3 2024 through FQ2 2025.
That last profitable quarter ran from May to July 2024, which is the quarter the July 19, 2024 outage falls in. Every quarter since has been a GAAP operating loss: eight in a row, the deepest being $124.7 million in FQ2 2026.
The distance between the two measures, and what it is as a share of revenue
The gap has widened the whole way. It was about 4 percent of revenue in 2019, crossed 20 percent in 2022, and stands at 27.5 percent now. In dollars, $404.8 million. More than a quarter of revenue is set aside as not reflecting operating performance.
Why Is the July 19 Incident Still in the Adjustments?
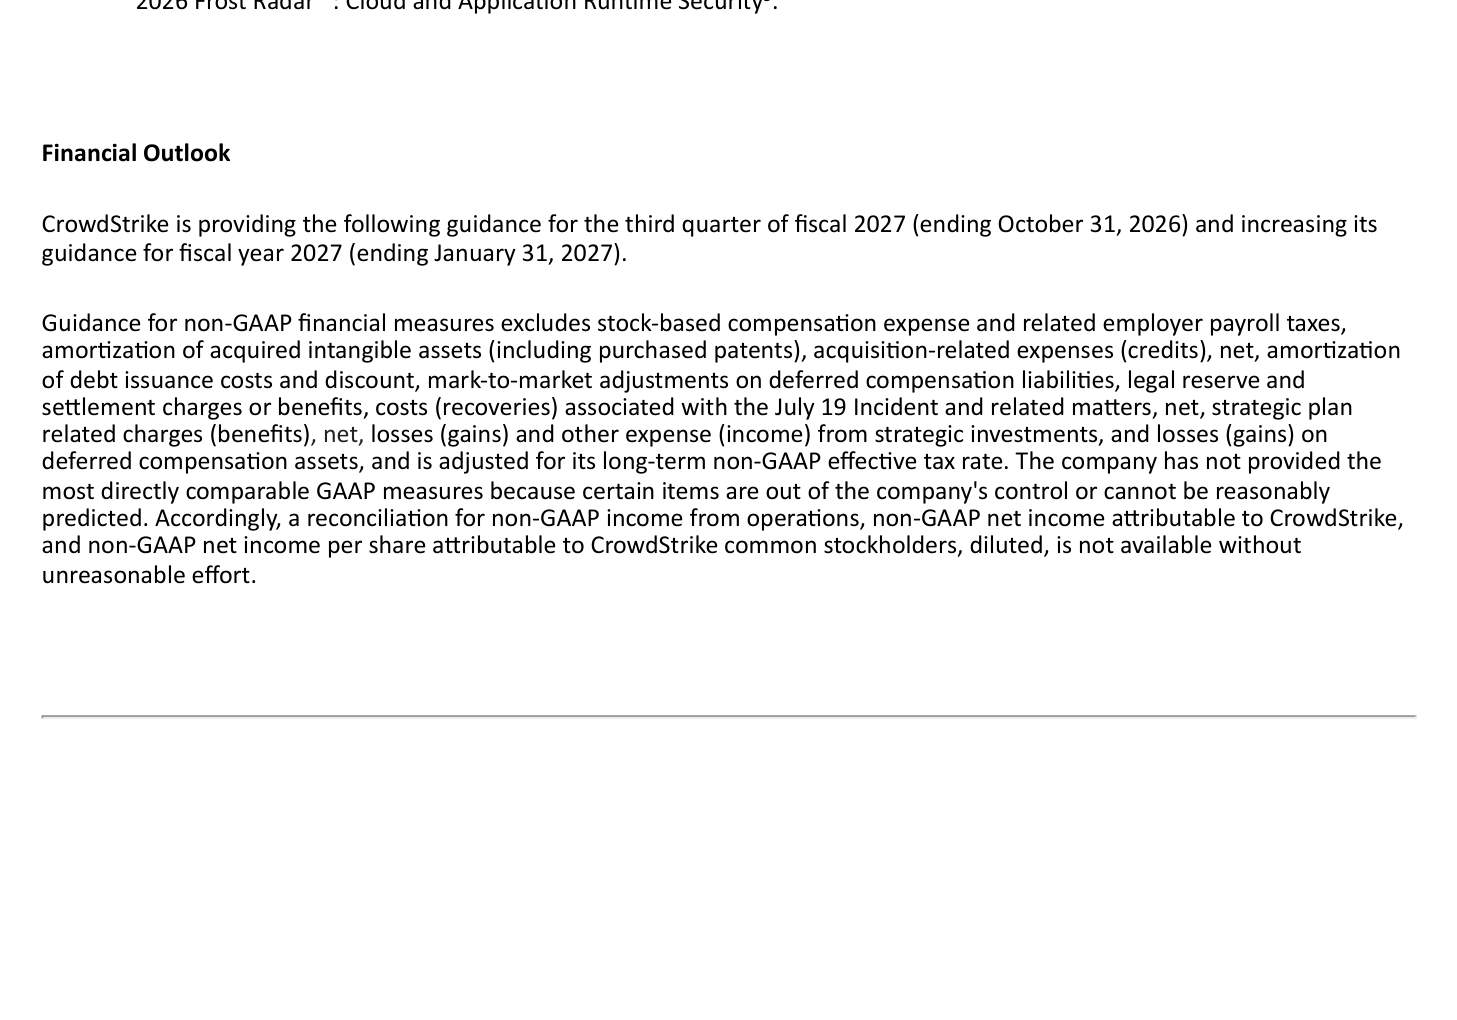
The company lists what it takes out.
Company disclosure (FQ2 2027 earnings release, August 26, 2026): "Guidance for non-GAAP financial measures excludes stock-based compensation expense and related employer payroll taxes, amortization of acquired intangible assets, acquisition-related expenses, amortization of debt issuance costs and discount, mark-to-market adjustments on deferred compensation liabilities, legal reserve and settlement charges or benefits, costs (recoveries) associated with the July 19 Incident and related matters, net, strategic plan related charges, losses (gains) from strategic investments, and losses (gains) on deferred compensation assets."
The company's own list of what it removes from non-GAAP results
In the middle of that list is the update failure that took roughly 8.5 million Windows machines offline in July 2024.
Own calculation (full-text search across all 30 releases): The incident is named in every release from FQ2 2025 through FQ2 2027. That is nine consecutive quarters, starting with the quarter the outage happened and running to the most recent one.
Litigation and insurance recoveries do take years, and the company has not hidden any of this. Still, "the best quarter in our history" and "we are still adjusting out costs from an incident two years ago" appear in the same document. The company itself attaches a caution to the measure.
Filing footnote (same release, non-GAAP explanation): "non-GAAP financial information is presented for supplemental informational purposes only, has limitations as an analytical tool, and should not be considered in isolation or as a substitute for financial information presented in accordance with GAAP."
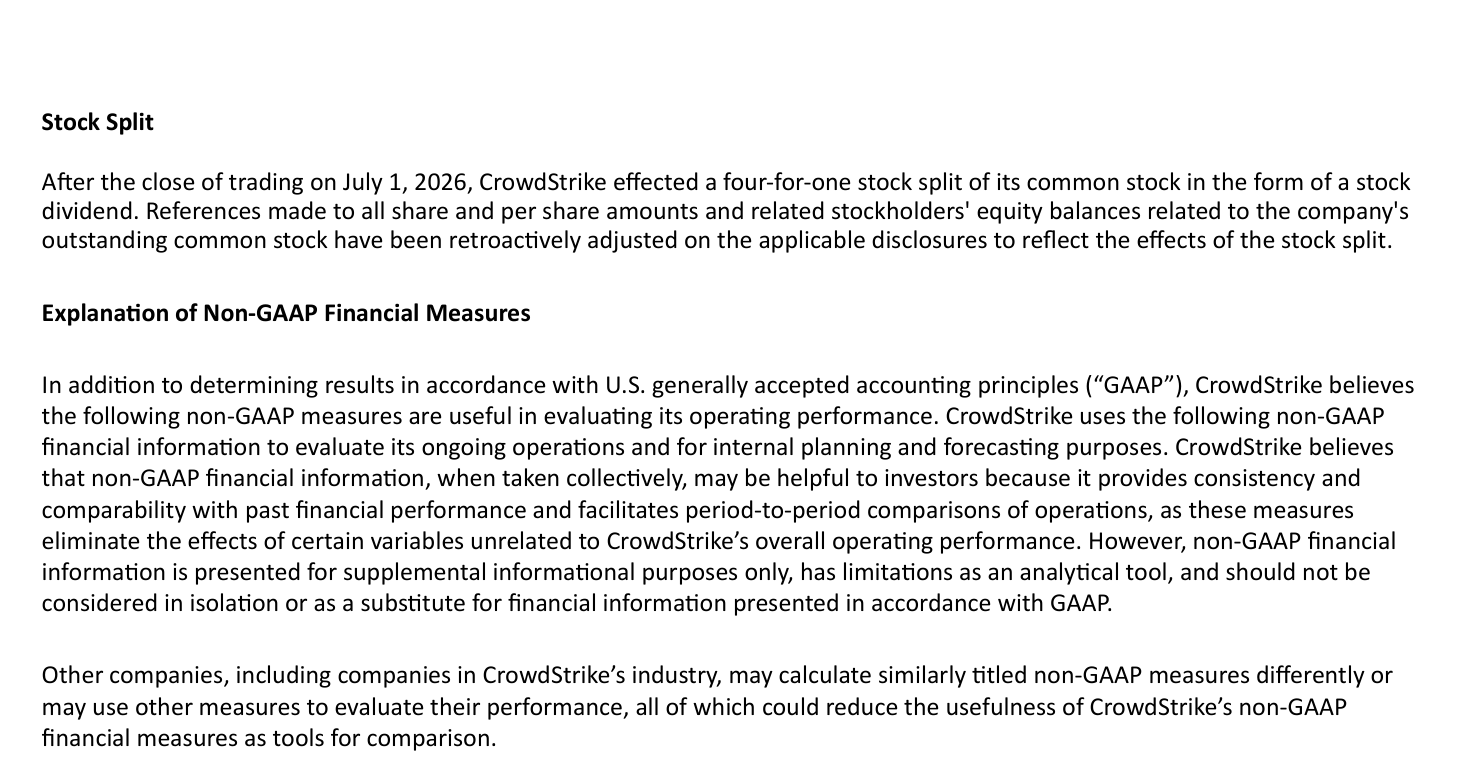
The four-for-one split and the company's note on non-GAAP measures
Net New ARR Passed Its Pre-Incident High
The accounting question is one thing. Whether the business itself recovered is another, and it deserves its own answer. For this company the clearest read is not revenue but net new ARR, the subscription base added in the quarter.
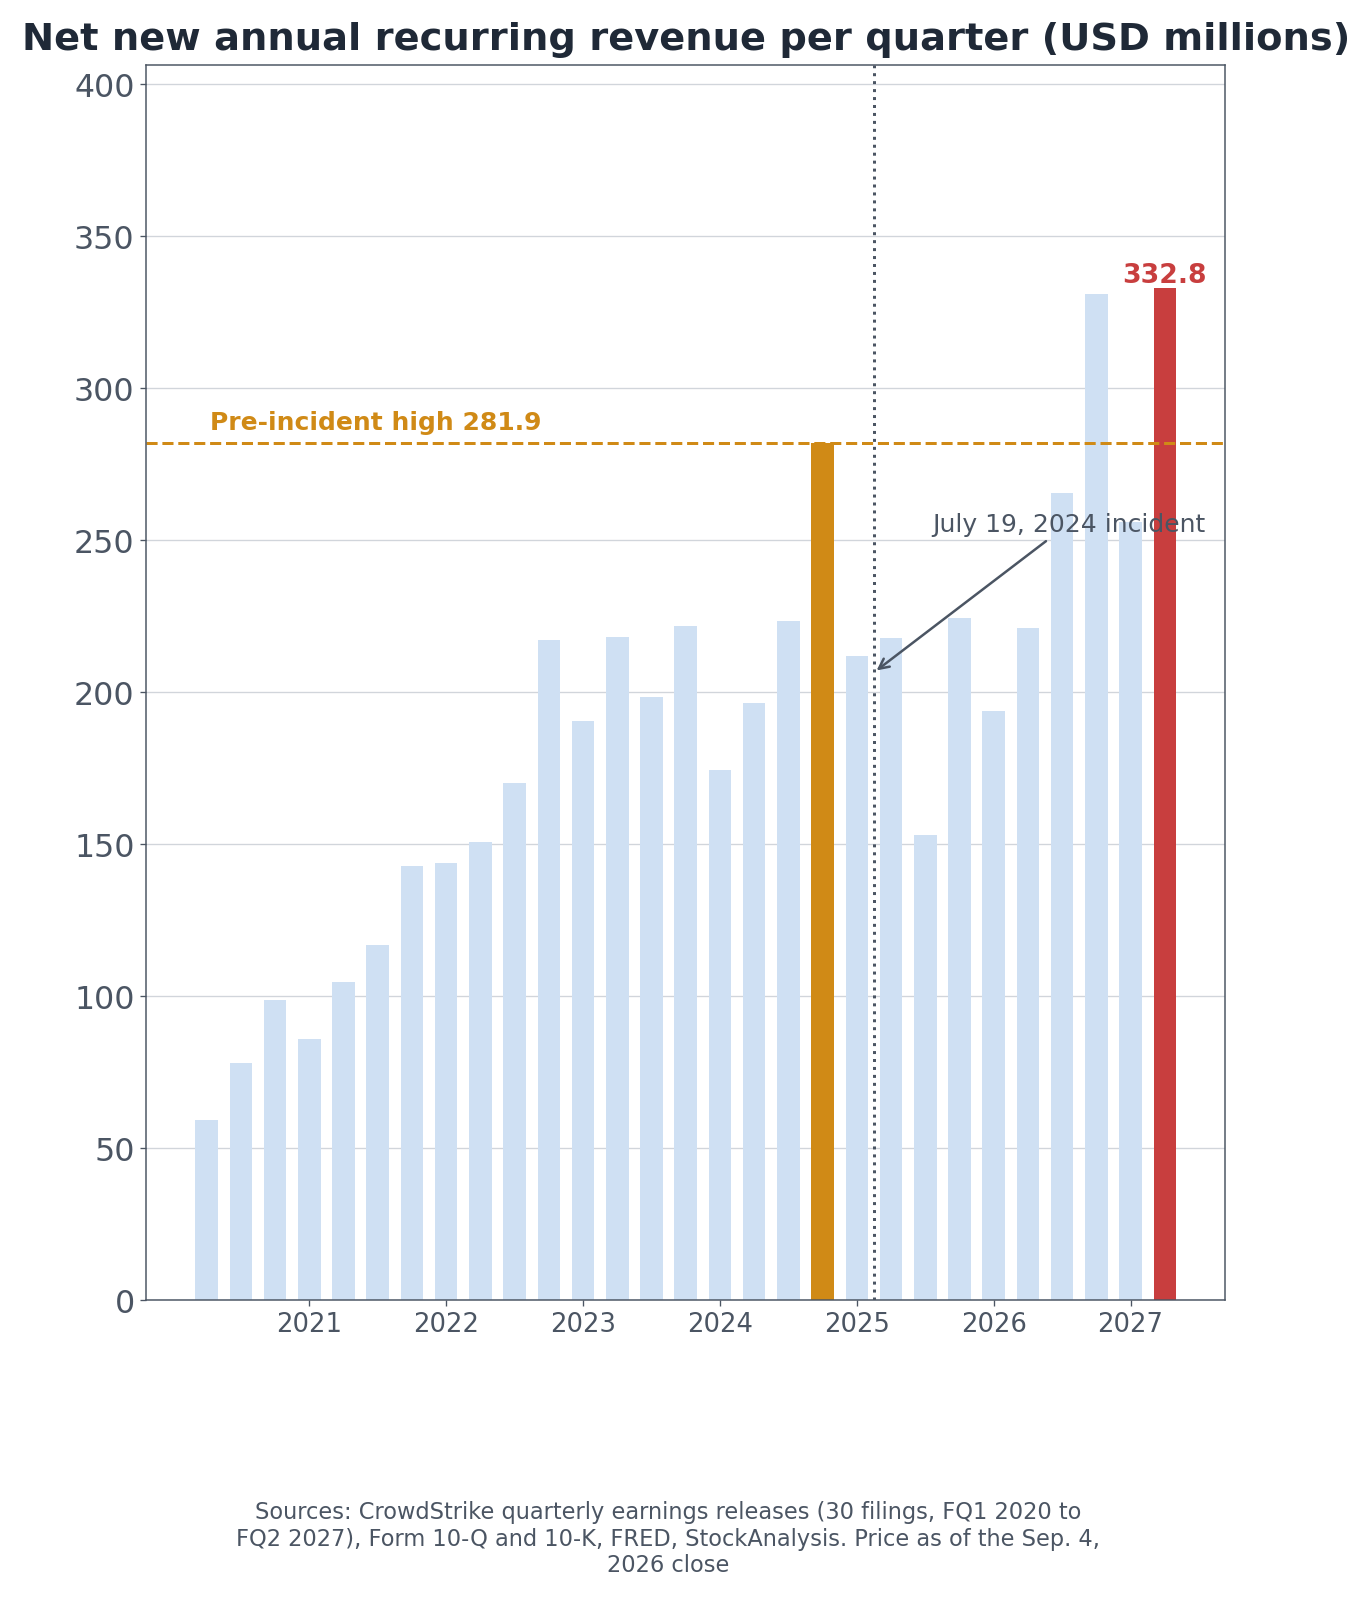
Quarterly net new ARR and the July 2024 outage
Company disclosure (same release): ARR reached $5.84 billion as of July 31, 2026, up 25 percent, of which $332.8 million was added during the quarter.
The outage is visible in the series. The pre-incident high was $281.9 million in FQ4 2024. In FQ3 2025, the first full quarter after the outage, net new ARR fell to $153.0 million, close to half. Five quarters passed near the $200 million mark before FQ3 2026 reached $265.3 million and FQ4 2026 reached $330.7 million, finally clearing the old high. This quarter came in at $332.8 million.
It took about two years. That is the ground the company stands on when it calls this its best quarter, and on this measure the claim holds.
Management credits Falcon Flex, a subscription structure that lets customers move spend between modules inside a committed amount. ARR from accounts on Falcon Flex passed $2.29 billion and grew 101 percent. Just over half of subscription customers now run six or more modules.
What Fills the $405 Million Gap?
Most of it is not incident cost. It is stock-based compensation.
Own calculation (FQ2 2027 release and Form 10-Q): The $33.2 million GAAP operating loss and the $371.6 million non-GAAP operating income differ by $404.8 million. Stock-based compensation is by far the largest single item the company removes; incident-related costs are much smaller.
Stock compensation does not move cash. It moves shares. Whether that belongs in operating expense is a genuine argument, and this analysis does not settle it. What is worth knowing before taking a side is the size: more than a quarter of revenue.
Cash, meanwhile, arrives.
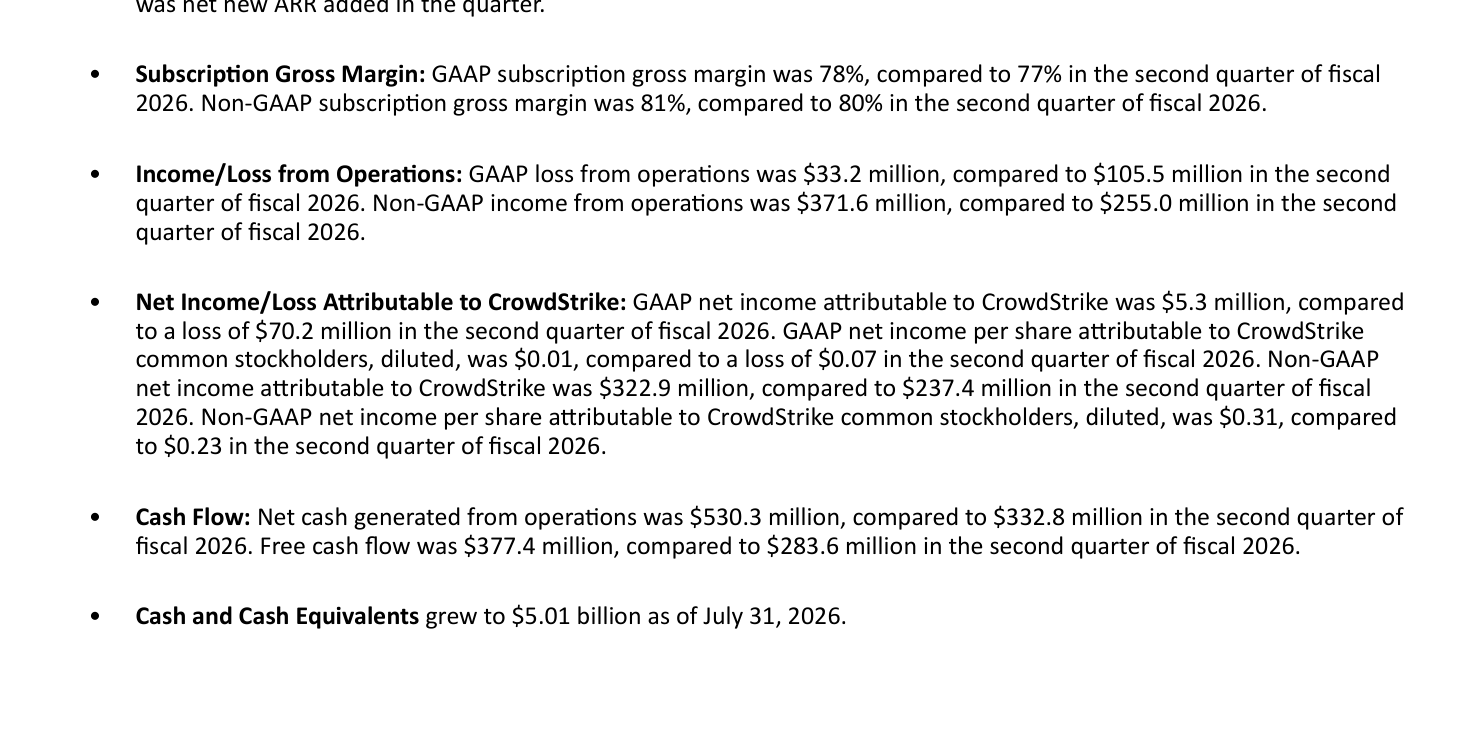
Company disclosure (same release): Operating cash flow was $530.3 million and free cash flow $377.4 million, both second-quarter records. Cash and equivalents grew to $5.01 billion.
GAAP and non-GAAP results set side by side by the company
Free cash flow is 25.7 percent of revenue. A GAAP loss and strong cash generation sit in the same quarter because subscriptions are billed ahead of delivery and because of the stock compensation just described.
Company disclosure (FQ2 2027 earnings call, August 26, 2026): Chief Financial Officer Burt Podbere listed the quarter as eight records and included "record operating income of $372 million or 25% of revenue growing 46% year over year" among them.
The ruler splits here too. That 25 percent operating margin is the non-GAAP figure. On a GAAP basis the same quarter is negative 2.3 percent.
CrowdStrike Revenue Breakdown: Subscription at 95%
Company disclosure (same release): Of $1.47 billion in total revenue, subscription revenue was $1.40 billion, growing 27 percent against 26 percent for the total, which puts subscription at 95.2 percent of the mix.
FQ2 2027
Value
Year over year
Total revenue
$1.47bn
+26%
Subscription revenue
$1.40bn
+27%
Annual recurring revenue
$5.84bn
+25%
Net new ARR
$332.8m
+51%
GAAP operating income
-$33.2m
loss narrowed
Non-GAAP operating income
$371.6m
+45.7%
Free cash flow
$377.4m
+33.1%
GAAP subscription gross margin is 78 percent, up from 77 percent. That is a normal place for a software business, and nothing in the gross margin line is the problem. The profit disappears below it, in sales and marketing and research and development.
Cybersecurity Spending and Peer Growth Rates
The market this company sells into keeps growing.
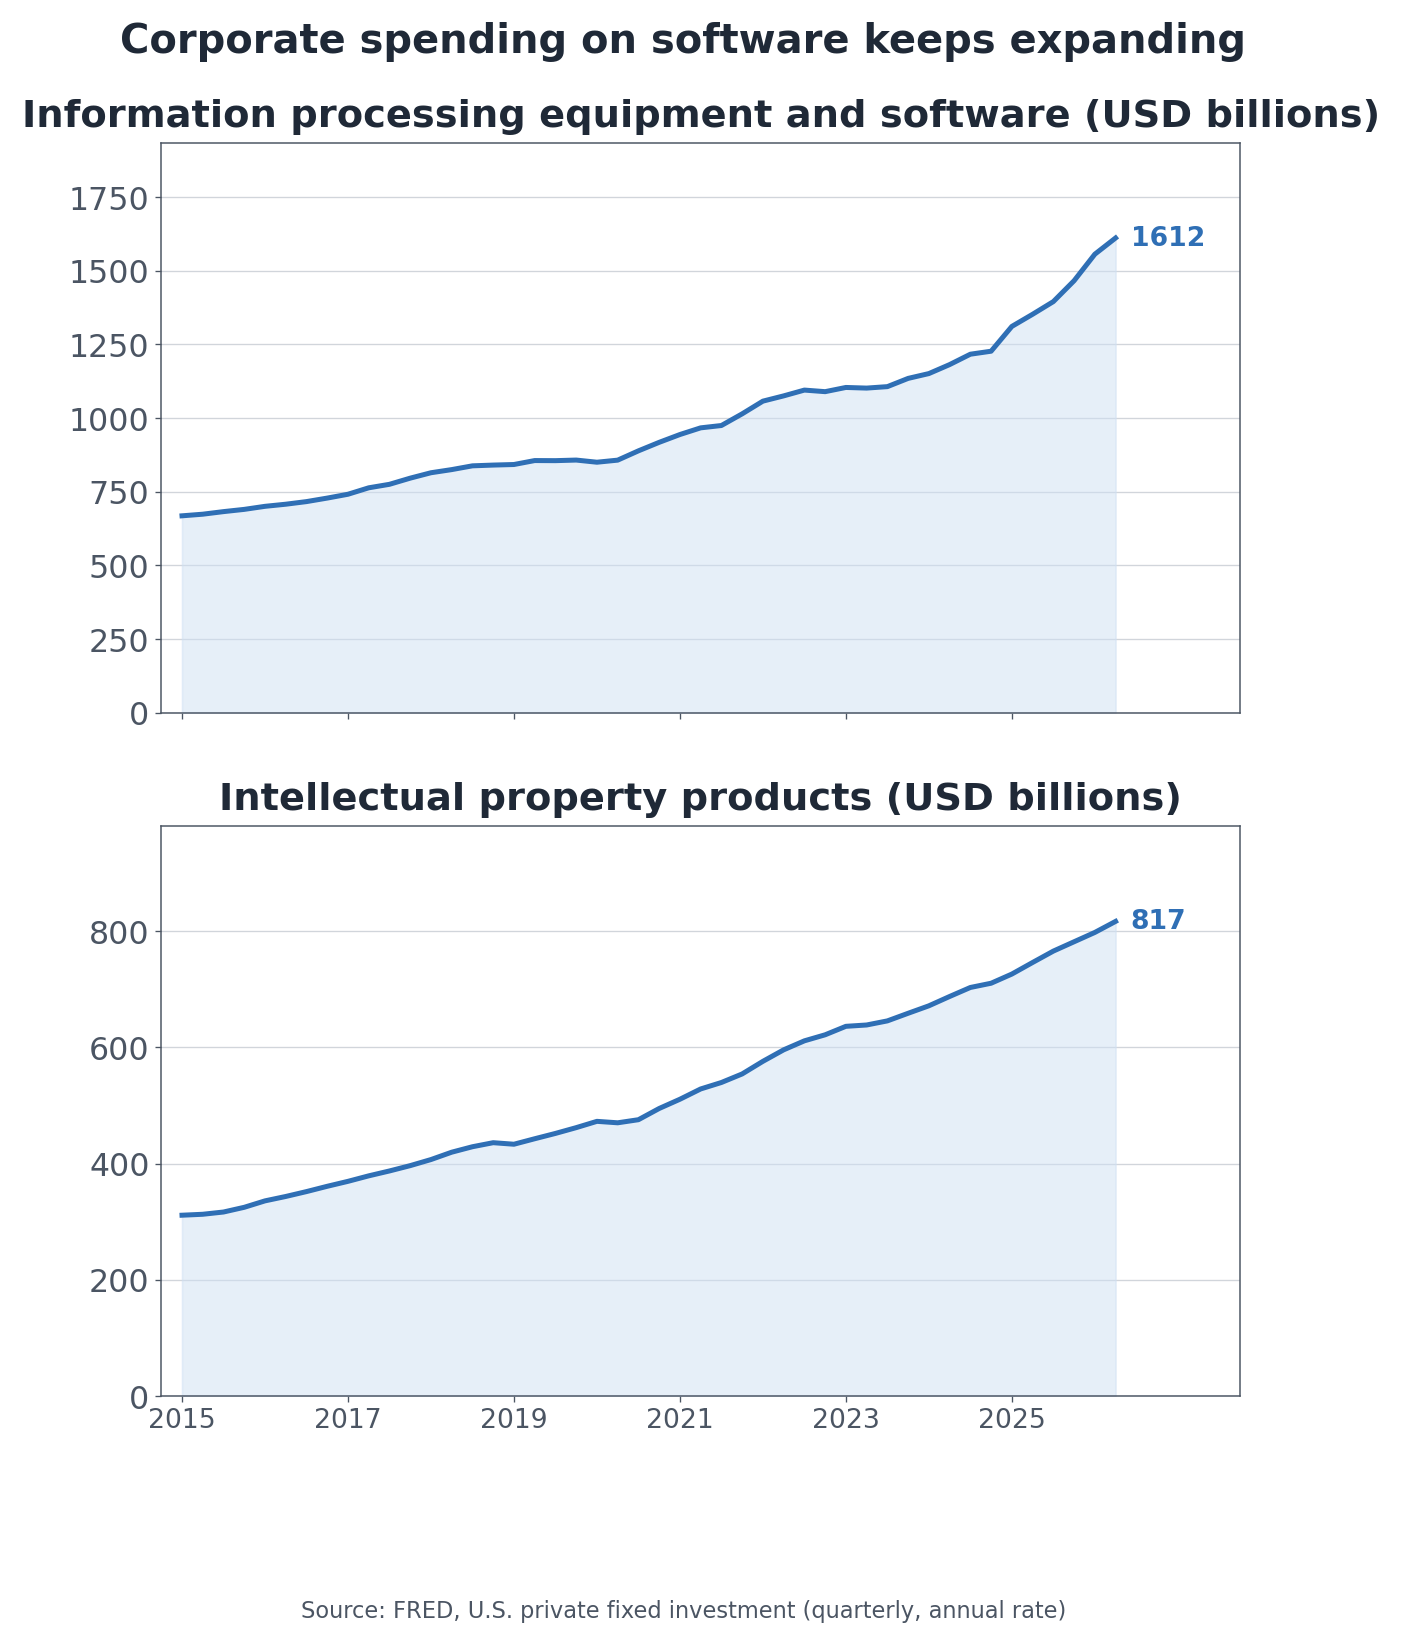
Official statistics (FRED series A679RC1Q027SBEA and B985RC1Q027SBEA, Q2 2026): U.S. private fixed investment in information processing equipment and software ran at an annual rate of $1,611.5 billion, and intellectual property products at $816.6 billion, roughly 2.4 and 2.6 times their level a decade earlier.
U.S. business investment in information processing and software
Both curves steepened after 2020. When companies spend more on software they spend more on securing it, and security budgets are hard to push down the priority list once they are set.
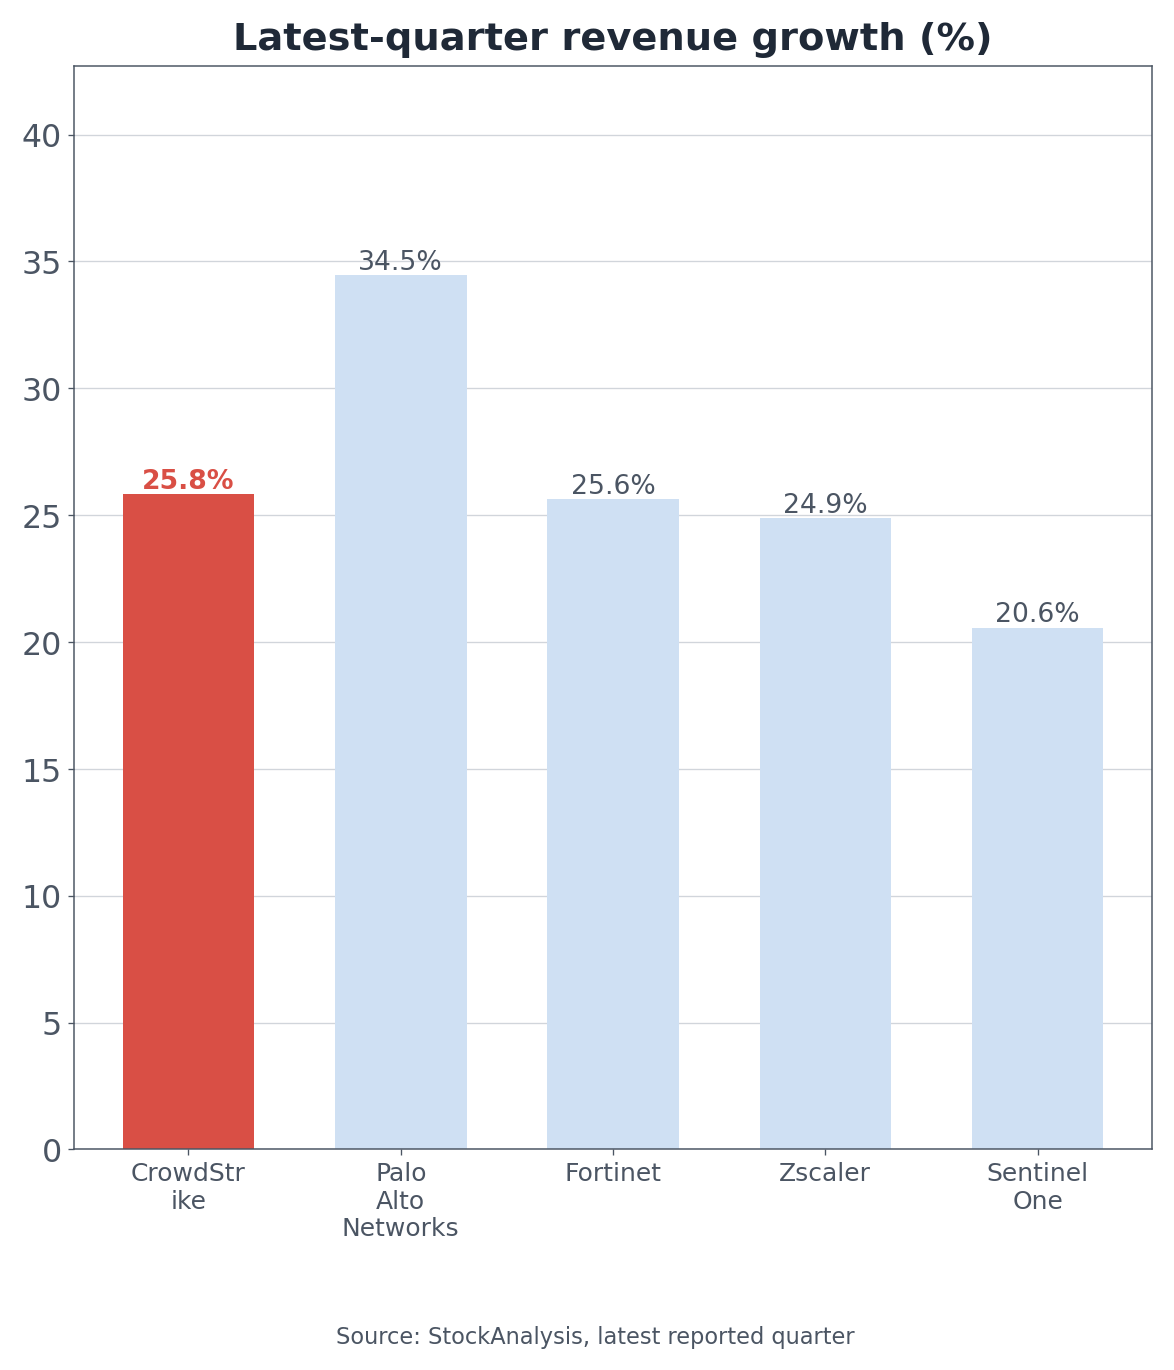
Latest-quarter revenue growth across the group
Aggregator cross-check (as of September 4, 2026): Latest-quarter revenue growth reads Palo Alto Networks 34.5 percent, CrowdStrike 25.8 percent, Fortinet 25.6 percent, Zscaler 24.9 percent, and SentinelOne 20.6 percent. The whole group is compounding in the mid-twenties to low-thirties, and CrowdStrike sits in the middle of it.
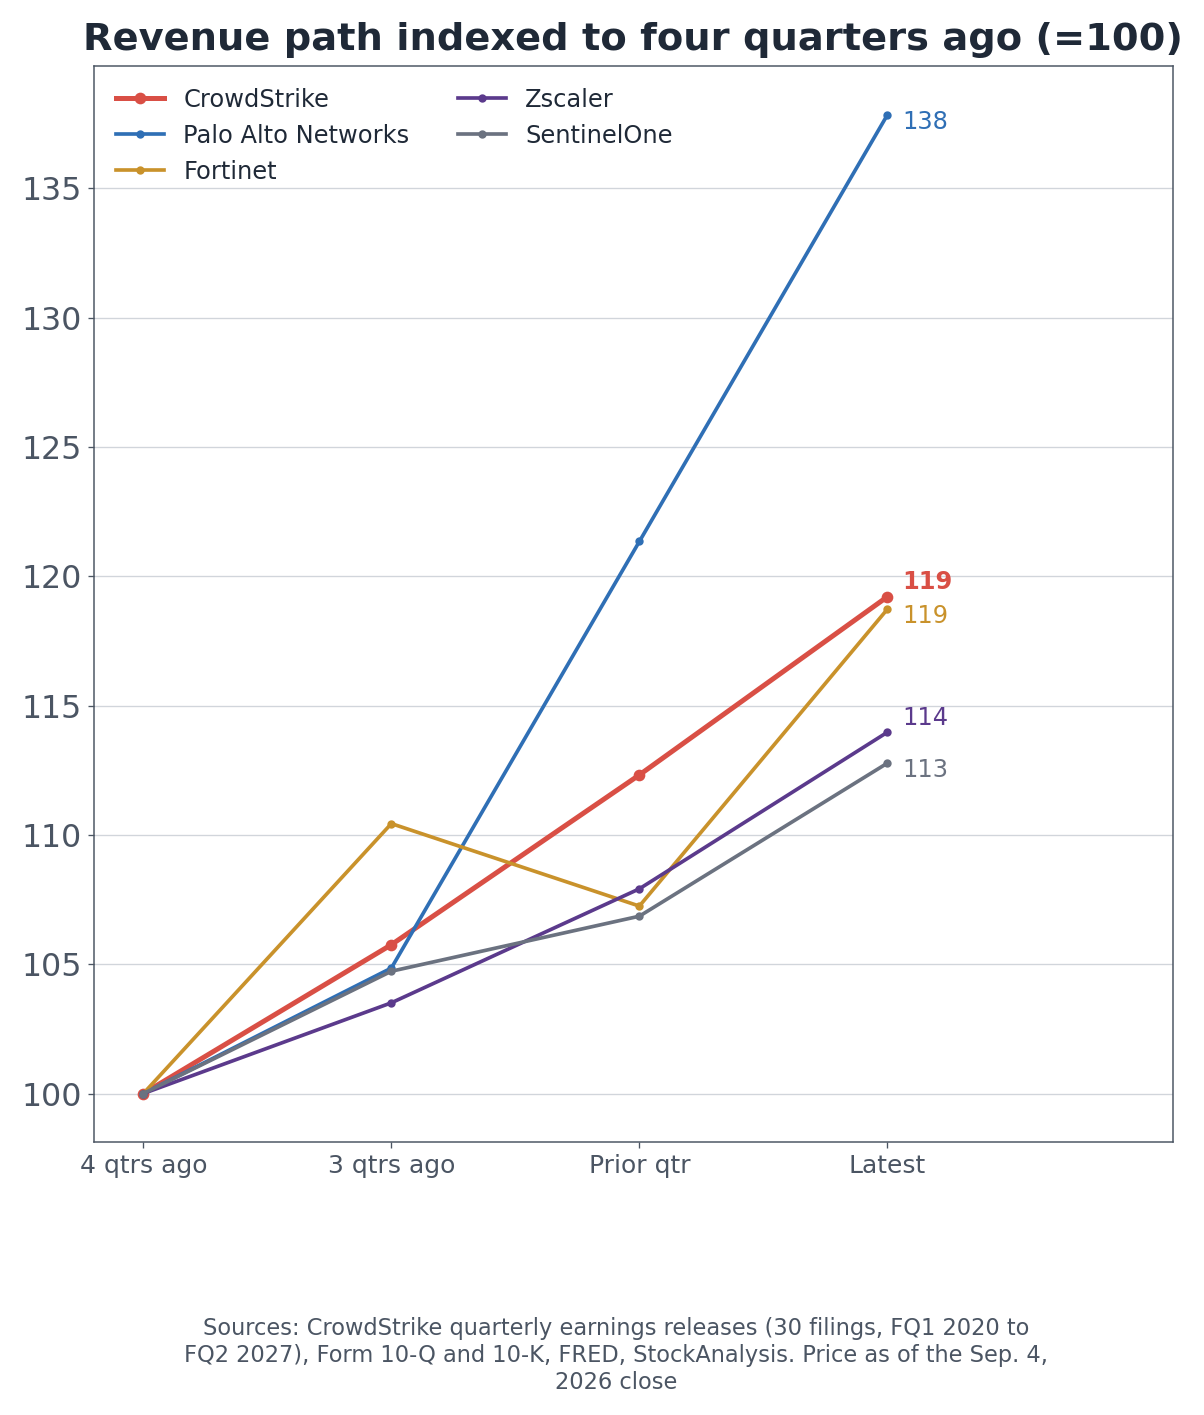
Revenue path indexed to four quarters ago (=100)
Indexed over four quarters, Palo Alto leads at 138 while CrowdStrike and Fortinet land together at 119. This company is not growing unusually fast for its sector. What it has done is climb back to the sector's own pace after the outage.
CRWD Valuation vs. Palo Alto, Fortinet and Zscaler
GAAP earnings are negative, so a price-to-earnings band does not stand. Sales and book value are what is left.
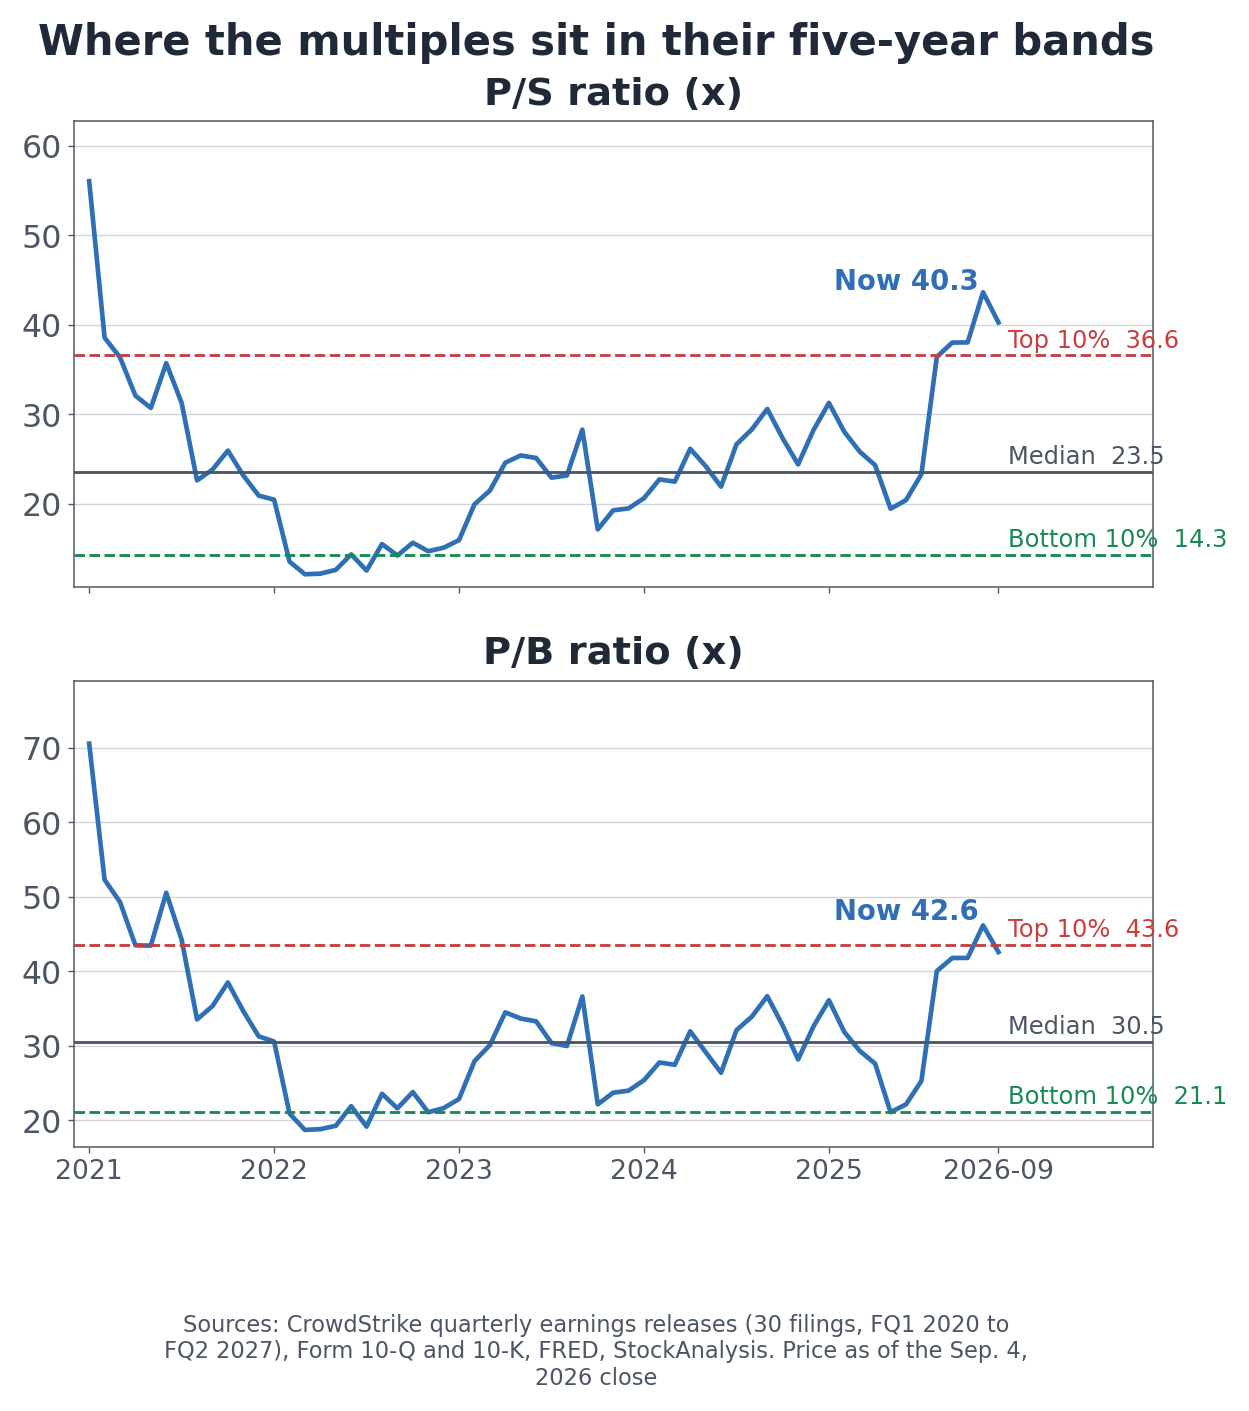
Five-year price-to-sales and price-to-book bands
Own calculation (month-end closes and trailing twelve-month revenue, October 2021 through September 2026): The 40.3x price-to-sales multiple sits at the 97th percentile of its own five-year band, against a five-year median of 23.6x. Price to book at 42.6x is at the 87th percentile.
One caution on the arithmetic. CrowdStrike effected a four-for-one stock split after the close on July 1, 2026. The price series is split-adjusted, but the share counts in the filings arrive as a mix of restated and pre-split figures depending on the quarter. Without reconciling that, historical multiples come out at a quarter of their true value.
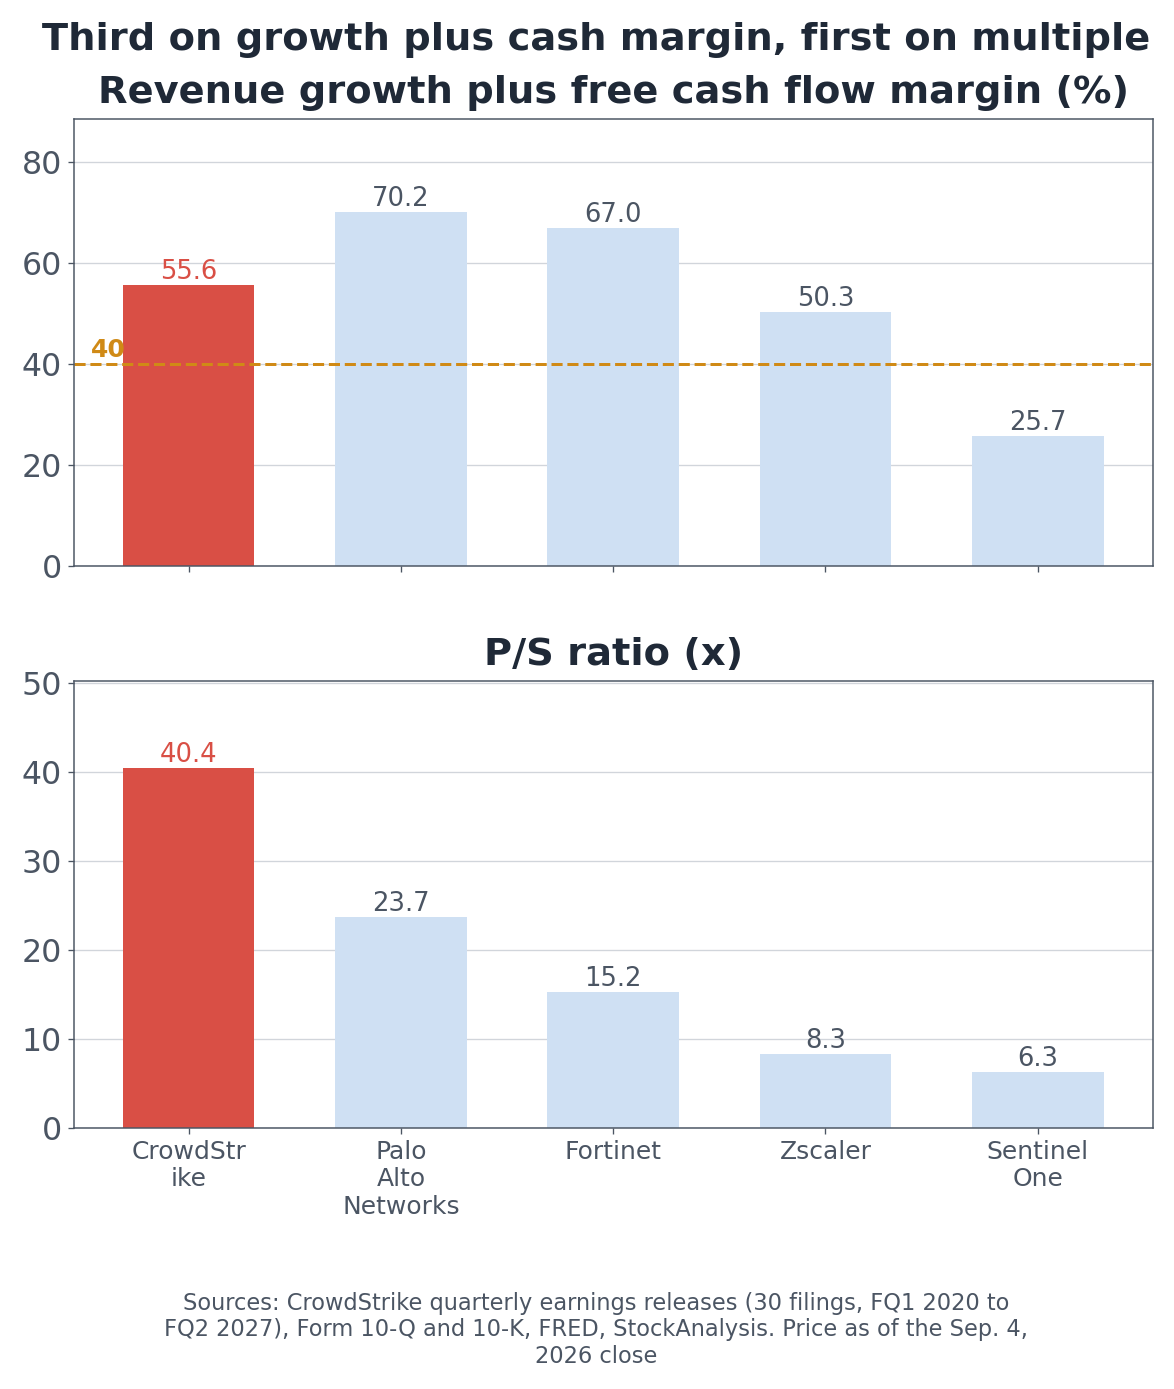
Growth plus cash margin, and the sales multiple
Own calculation (trailing four quarters): Revenue growth plus free cash flow margin comes to 55.6 for CrowdStrike, behind Palo Alto Networks at 70.2 and Fortinet at 67.0. Four of the five clear the 40 threshold the sector uses.
Company
P/S (x)
Growth + FCF margin
Forward P/E (x)
CrowdStrike
40.4
55.6
151.2
Palo Alto Networks
23.7
70.2
79.5
Fortinet
15.2
67.0
44.6
Zscaler
8.3
50.3
34.6
SentinelOne
6.3
25.7
49.3
Third on growth plus cash generation, first on multiple. That spread is the premium. Retention through the outage and the fact that more than half of subscription customers run six or more modules are the reasons usually given for it.
CRWD Price Targets: The Split Distorted the Average
Aggregator cross-check (aggregated sell-side research, as of September 4, 2026): The headline consensus target reads $596, some 179 percent above the current price. The per-firm views on the same screen run from $119 to $250.
Pre-split targets are still sitting in that average. The apparent wave of cuts on August 27, the day after earnings, is the same artifact: $765 to $245 and $510 to $200 are split adjustments with revisions mixed in, not reductions of that size.
The nine price targets restated after the split
Own calculation (nine per-firm views updated after the split): Averaging only the refreshed targets gives $223, or 4.6 percent above the September 4 close of $213.10, in a range of $119 to $250.
Firm
Rating
Target
Updated
Needham
Buy
$250
2026-08-27
UBS
Buy
$250
2026-08-27
BTIG
Buy
$245
2026-08-27
Raymond James
Outperform
$240
2026-08-27
Morgan Stanley
Overweight
$238
2026-08-27
BMO Capital
Outperform
$235
2026-08-27
Goldman Sachs
Buy
$230
2026-08-27
Roth Capital
Buy
$200
2026-08-27
Bernstein
Market Perform
$119
2026-08-27
Across the past 90 days the aggregated record shows 15 rating or target actions, no upgrades, 15 reiterations, and 14 target changes, nearly all of them clustered on August 27. Earnings estimates point the other way: over the past 30 days, 41 analysts raised full-year EPS estimates and none lowered them. The company has beaten consensus in seven of the last eight quarters by an average of 6.4 percent.
What Would Change This Picture?
Scenario
Condition
Indicator to check
When and source
Upside
Net new ARR holds above $300 million and the 34 percent full-year growth guide is met
Quarterly earnings release, opening bullets
Early December
Upside
GAAP operating income turns positive again
Income/Loss from Operations line in the release
Early December
Upside
Falcon Flex ARR keeps compounding at triple digits
Release headline bullets
Early December
Downside
The gap between the two measures passes 30 percent of revenue
GAAP and non-GAAP operating income divided by revenue
Early December
Downside
Price to sales reverts toward the 23.6x five-year median
Market capitalization over trailing revenue
Continuous
Downside
July 19 costs remain in the adjustments past a tenth quarter
Non-GAAP explanation paragraph in the release
Early December
The cheapest test is the second row. This company has produced GAAP operating profit before, in the four quarters ending with the outage. Revenue is now 1.9 times what it was then. Whether it crosses back into GAAP profit is the simplest available answer to the entire adjustment argument. The company has guided to a third-quarter report in early December.
Three Questions This Analysis Does Not Answer
How much is the July 19 cost each quarter? The company names the item in its adjustment list but does not break out a quarterly figure in the release body. It is a net number after recoveries, so the reconciliation detail matters.
Should stock compensation be excluded? This piece measures the size only. Valuing the dilution per share is separate work.
Does Falcon Flex pull revenue recognition forward? How committed-amount contracts interact with ARR and with revenue recognition timing requires the Form 10-K revenue note.
Quarterly figures come from every CrowdStrike earnings release filed with the SECsince the 2019 listing. I downloaded all 64 Form 8-K filings, identified the 30 that carry a quarterly release, and parsed each into a continuous thirty-quarter series covering FQ1 2020 through FQ2 2027, with no missing quarters. Fourth-quarter releases carry both quarterly and full-year highlights in one document, so the quarterly section was isolated before parsing. Income statement figures were cross-checked against Form 10-Q and 10-K XBRL data, with quarterly values reconciled to annual totals for each of the eight fiscal years. Industry comparisons use FRED series A679RC1Q027SBEA and B985RC1Q027SBEA. Multiples use month-end closes and trailing twelve-month revenue, with share counts reconciled across the four-for-one split of July 1, 2026 and checked against the cover-page share count. Analyst targets and estimate revisions are from aggregated sell-side research as of September 4, 2026; the consensus average was recalculated from per-firm views updated after the split.
This article is for information only and is not investment advice. Last updated: September 6, 2026.