Casey's General Stores (CASY) : fiscal Q4 2026 results reported June 9, 2026
Casey's (CASY) Q4 FY2026 Earnings: The Numbers
Casey's General Stores (NASDAQ: CASY) runs 2,944 convenience stores across 19 states and closed fiscal 2026 with revenue of $17.56 billion, net income of $714.4 million, and diluted earnings per share of $19.16. This CASY stock analysis works through the fourth-quarter earnings, the category mix behind the gross profit line, the fuel margin that drove the quarter, valuation against Murphy USA and other retailers, and what to watch when the company reports fiscal Q1 2027 on September 9, 2026.
Here is the part that does not match the story the company tells about itself. Casey's is known for pizza. It has sold whole pies and slices since 1984 and puts a full kitchen in nearly every store. But in the fourth quarter, most of the additional gross profit came from the fuel pumps outside.
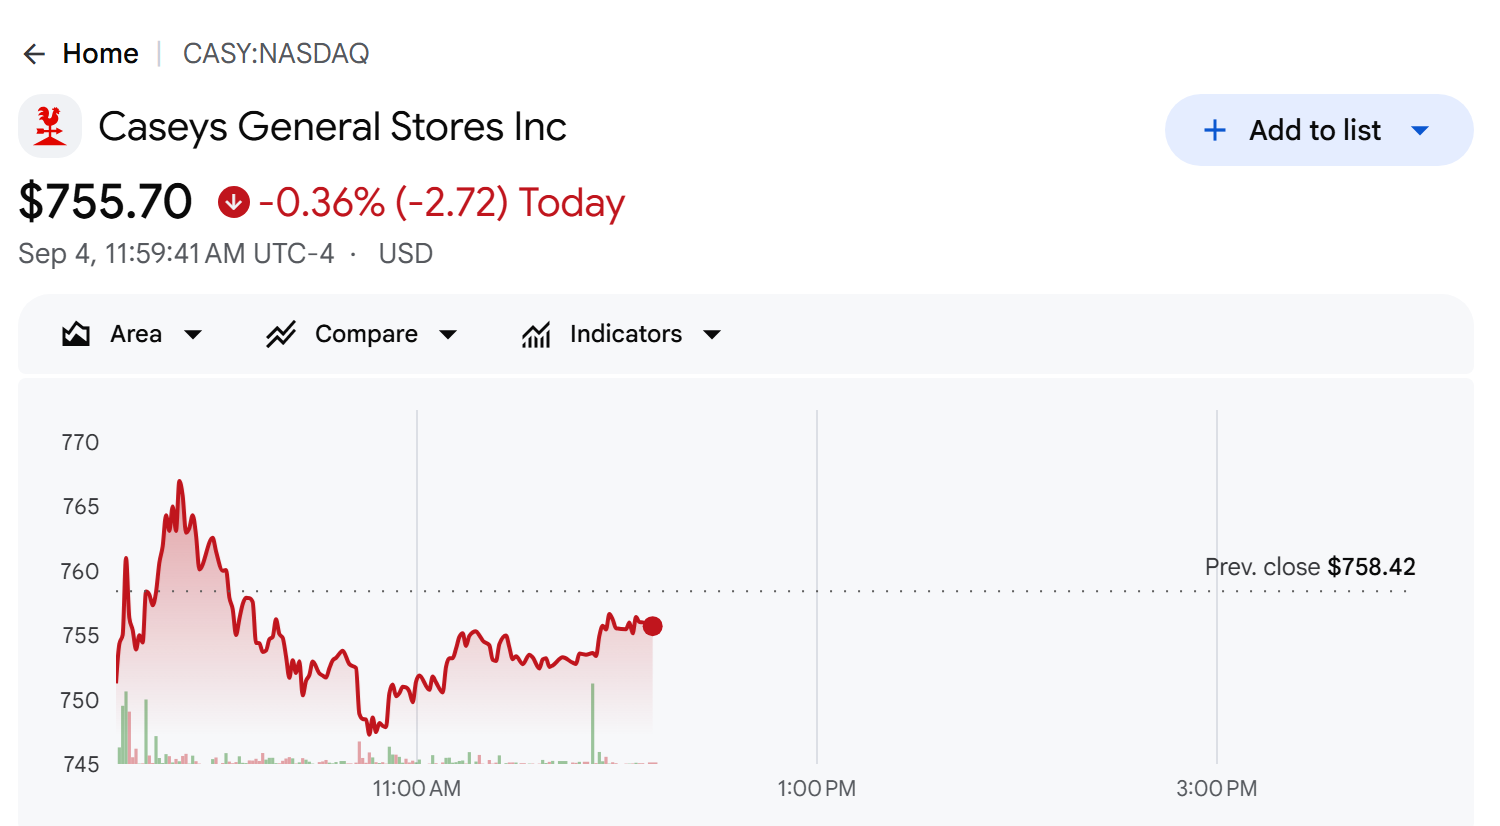
Casey's General Stores (CASY) on Google Finance, September 4, 2026, 11:59 AM ET
The stock traded at $755.70 on the morning of September 4, -0.36% on the day, for a market capitalization near $27.9 billion. Every price figure in this article is fixed to that moment.
Fiscal Q4 2026 covers February through April 2026. Casey's closes its books on April 30, so its quarters sit one step off the calendar-year reporting most US retailers use.
Metric
Q4 FY2026
Q4 FY2025
Change
Revenue
$4,571.8 million
$3,992.8 million
+14.5%
Gross profit
$1,080.4 million
$926.0 million
+16.7%
Operating expenses
$730.0 million
$663.0 million
+10.1%
Net income
$162.7 million
$98.3 million
+65.5%
Diluted EPS
$4.37
$2.63
+66.2%
EBITDA
$350.3 million
$263.0 million
+33.2%
Revenue grew 14.5%. Net income grew 65.5%. The gap between those two numbers is what the rest of this analysis unpacks.
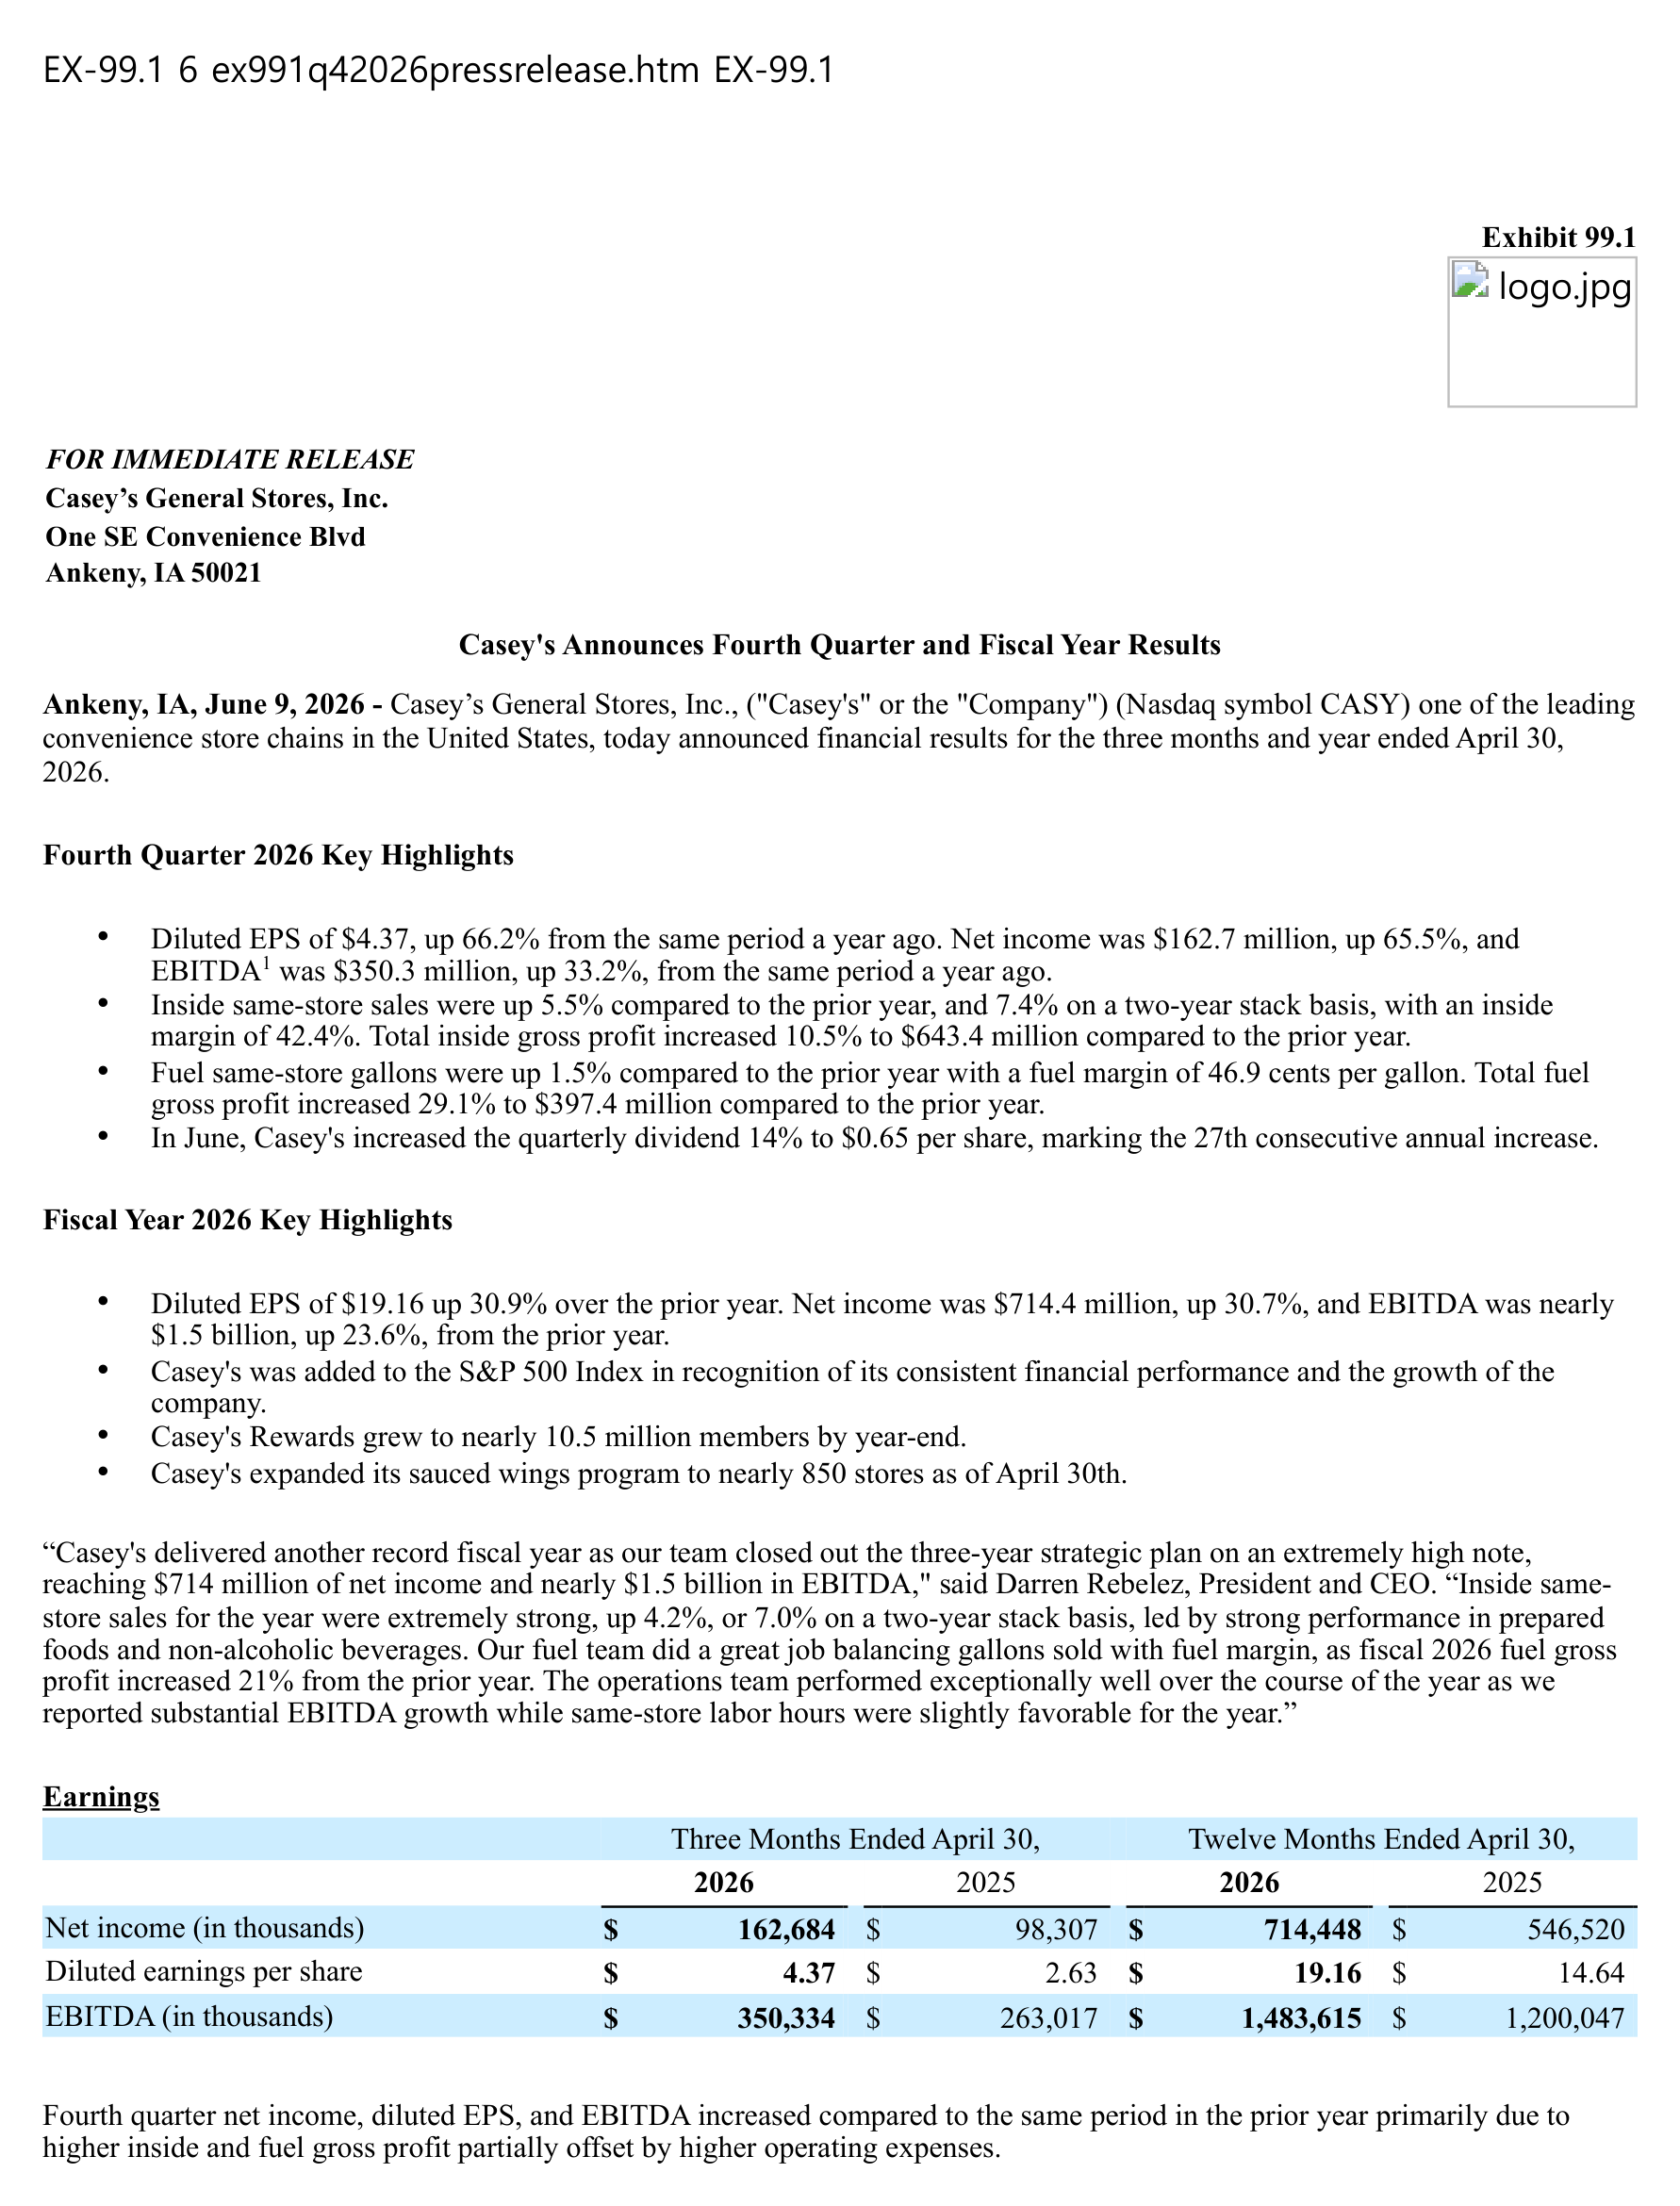
For the full year, revenue rose +10.2% and net income +30.7%. EBITDA reached $1.48 billion. The board raised the quarterly dividend 14% to $0.65 per share, the 27th consecutive annual increase, and expanded the buyback authorization to $1 billion. The company also noted that "Casey's was added to the S&P 500 Index in recognition of its consistent financial performance and the growth of the company."
One qualifier belongs on the revenue line. Annual revenue rose $1,620.2 million, and the 10-K attributes $1,034.1 million of that to the Fikes acquisition during the first six months of the year. Organic growth was the remaining $586.1 million.
What Does Casey's General Stores (CASY) Do?
Casey's was incorporated in Iowa in 1967 and still concentrates there. About half its stores sit in Iowa, Missouri, and Illinois, and roughly 71% of all locations are in towns of fewer than 20,000 people. National chains often skip those markets, which leaves a single convenience store doing the work of a grocer.
The company sells three things. Fuel comes first by volume: every store but six has pumps, and Casey's moved 3.52 billion gallons in fiscal 2026. Grocery and general merchandise comes second, with more than 3,000 packaged items per store across beverages, tobacco, snacks, and household goods. Prepared food and dispensed beverage comes third by revenue and first by identity.
Pizza is the flagship. Casey's began selling it in 1984 and now operates full kitchens in almost all stores, adding hot sandwiches, made-to-order subs, salads, and bakery items around it. Bone-in and boneless wings reached roughly 850 stores by April 30, with plans to extend them across the rest of the fleet. When Casey's acquires a store without a kitchen, it typically installs one during the remodel and rebrands the site; locations that cannot fit a kitchen stay under the GoodStop or CEFCO banners.
The physical network behind that is substantial. Casey's runs three distribution centers, in Ankeny, Iowa, Terre Haute, Indiana, and Joplin, Missouri, plus a fuel terminal in Waco, Texas, and a fleet of more than 500 tractors. It self-distributes most of its fuel. The Casey's Rewards loyalty program passed 10 million members by year-end.
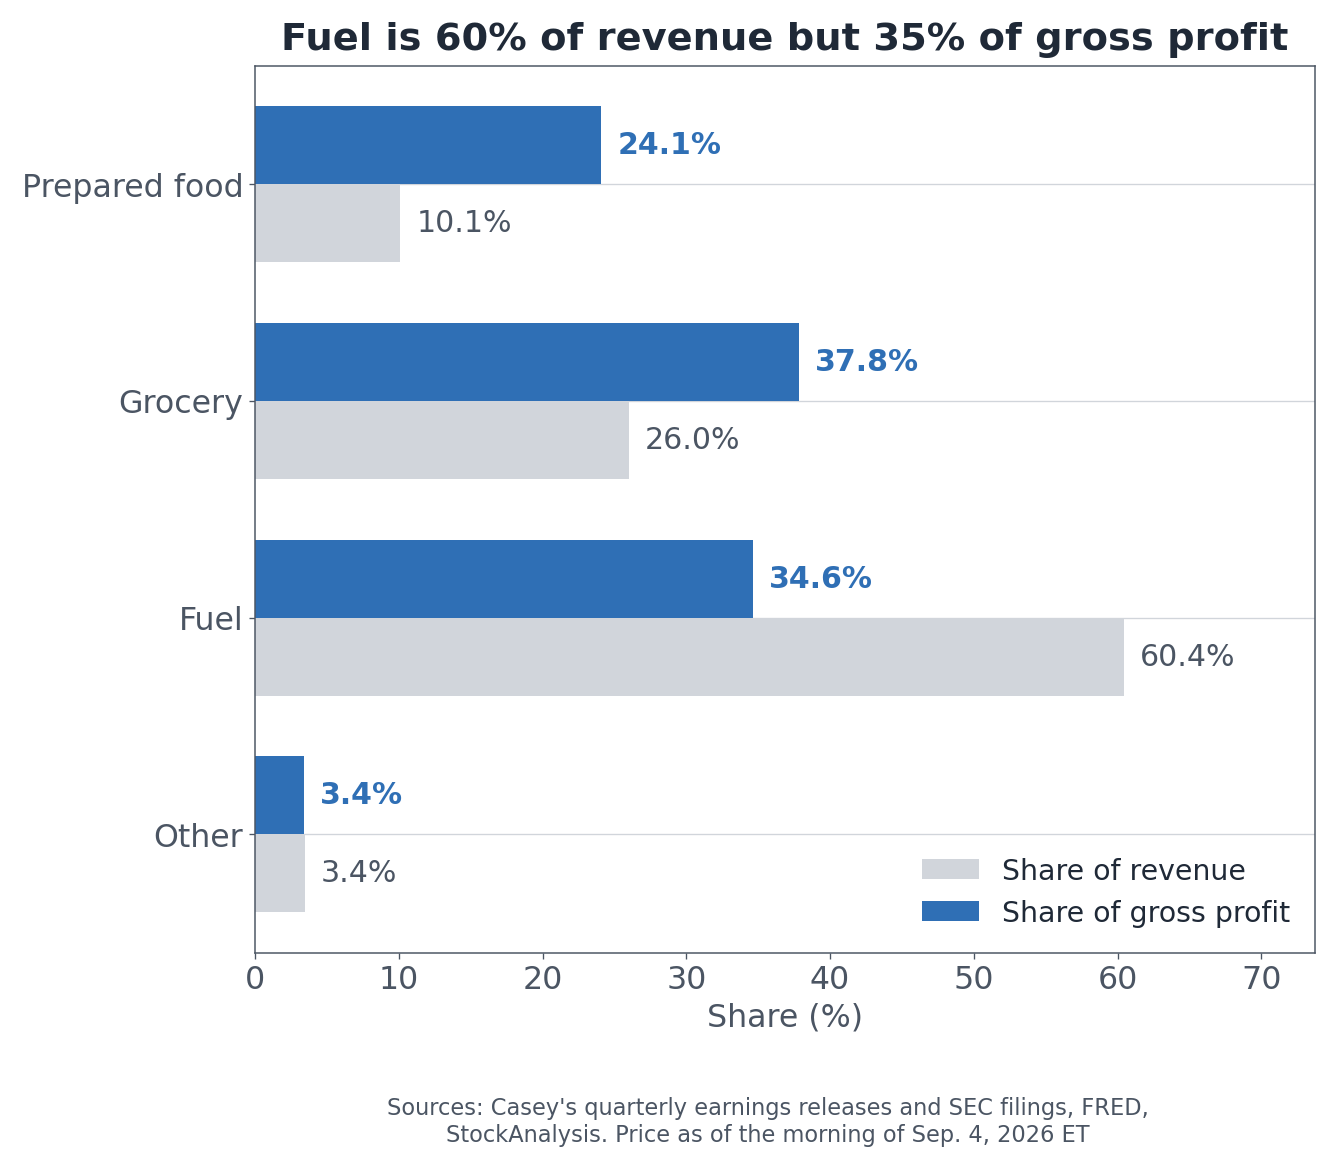
Fuel Is 60% of Revenue but 35% of Gross Profit
Casey's fiscal 2026 revenue share and gross profit share by category, excluding depreciation and amortization
The 10-K states the structure more directly than any outside summary could. Over the last three fiscal years, retail sales of prepared food and dispensed beverage and grocery and general merchandise "have generated about 36% of our total revenue, but they have resulted in approximately 63% of our revenue less cost of goods sold."
The fiscal 2026 numbers line up behind that sentence.
Category
Revenue
Share of revenue
Gross profit
Share of gross profit
Margin
Fuel
$10,615.4 million
60.4%
$1,496.6 million
34.6%
14.1%
Grocery and general merchandise
$4,563.6 million
26.0%
$1,635.4 million
37.8%
35.8%
Prepared food and dispensed beverage
$1,776.8 million
10.1%
$1,040.9 million
24.1%
58.6%
Other
$605.3 million
3.4%
$148.1 million
3.4%
24.5%
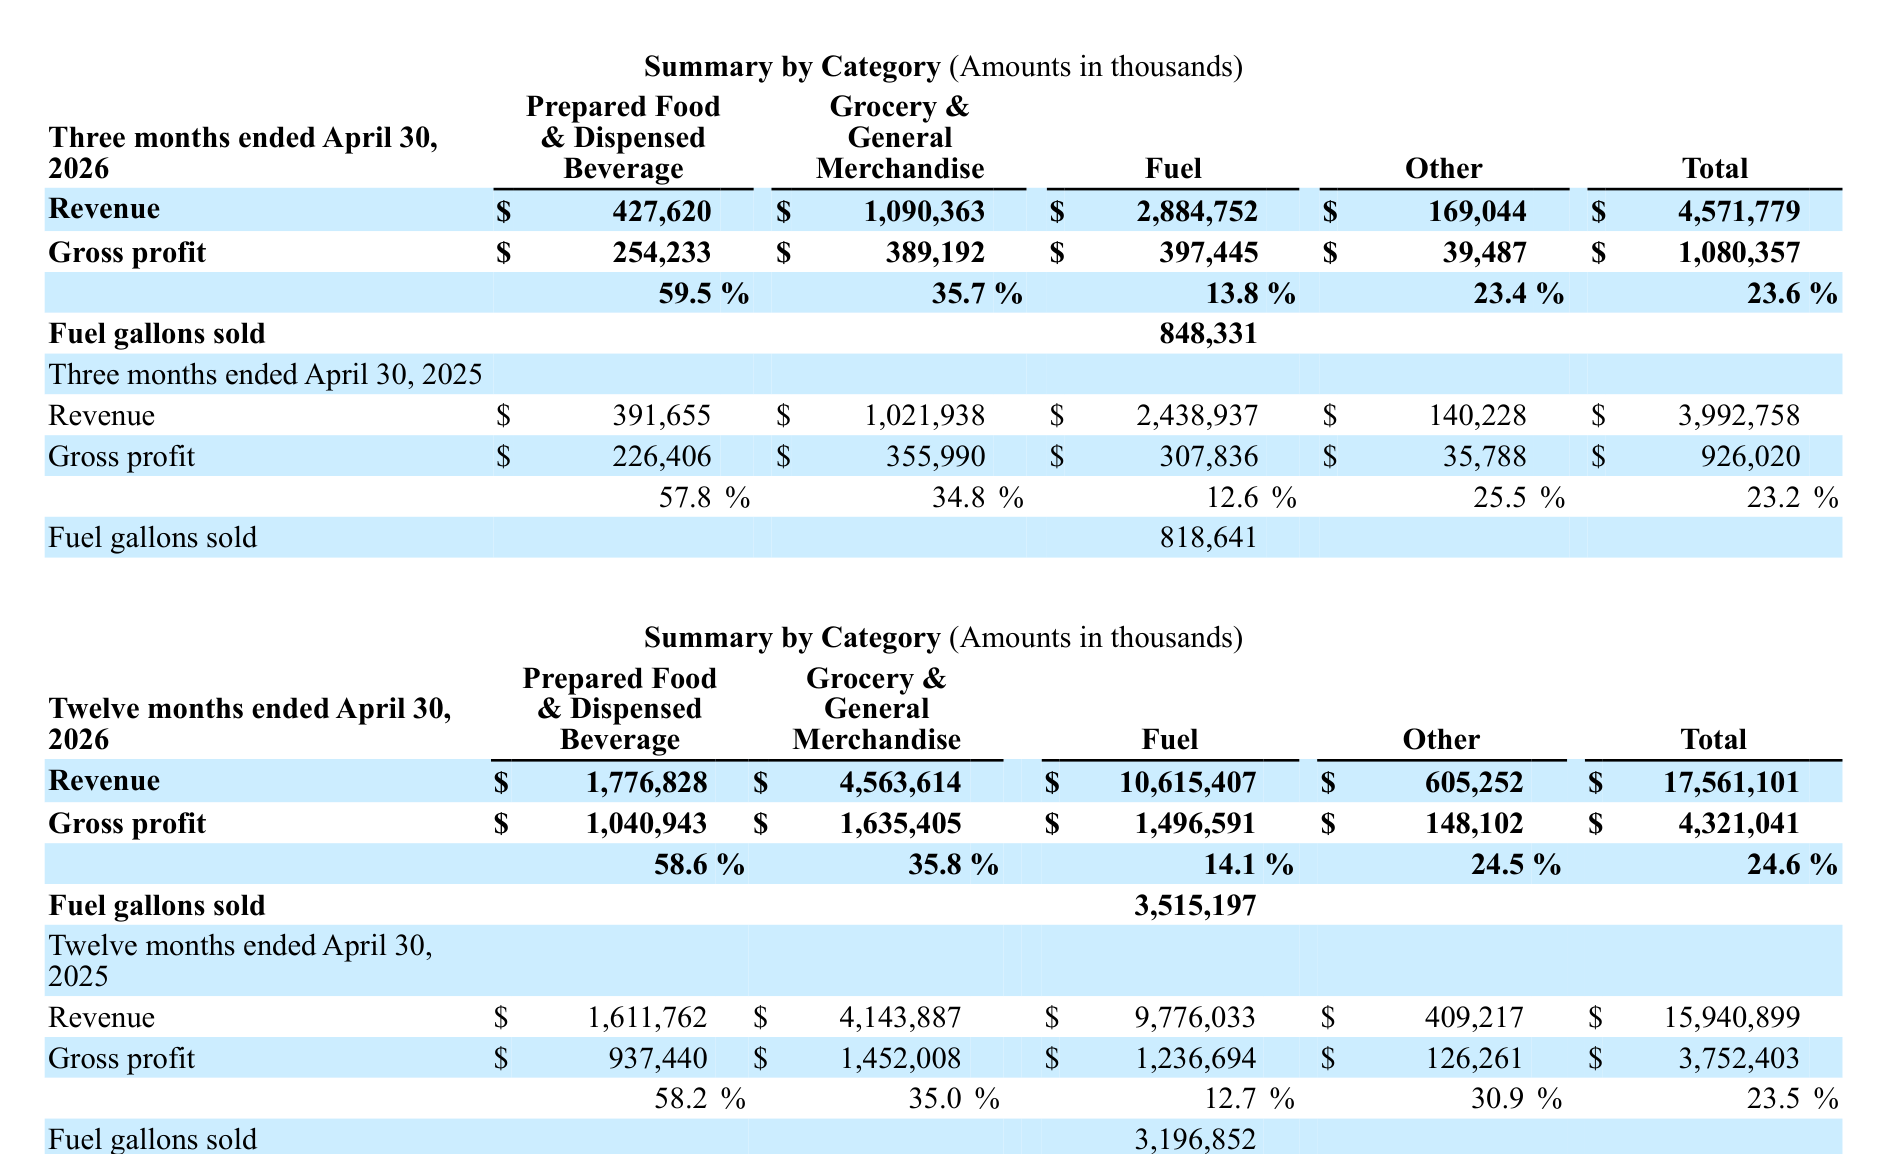
Fuel carries 60% of the revenue and produces 35% of the gross profit, because its margin is 14.1%. Prepared food does the reverse: 10% of revenue, 24% of gross profit, on a 58.6% margin. Selling more gallons moves the top line hard and the bottom line very little.
Casey's quarterly and annual summary by category, from the company's earnings release
Per-store figures sharpen it further. Average retail sales per store were $5.88 million in fiscal 2026, of which inside sales were $2.20 million. Yet gross profit per store was $896,000 from inside and $512,000 from fuel.
That fuel figure is what moved. Per-store fuel gross profit was $445,000 in fiscal 2024 and $446,000 in fiscal 2025, flat for two years, then $512,000 in fiscal 2026. Per-store operating income rose $70,000 over the year, and $66,000 of that came from the fuel side.
Where Did the Q4 Gross Profit Increase Come From?
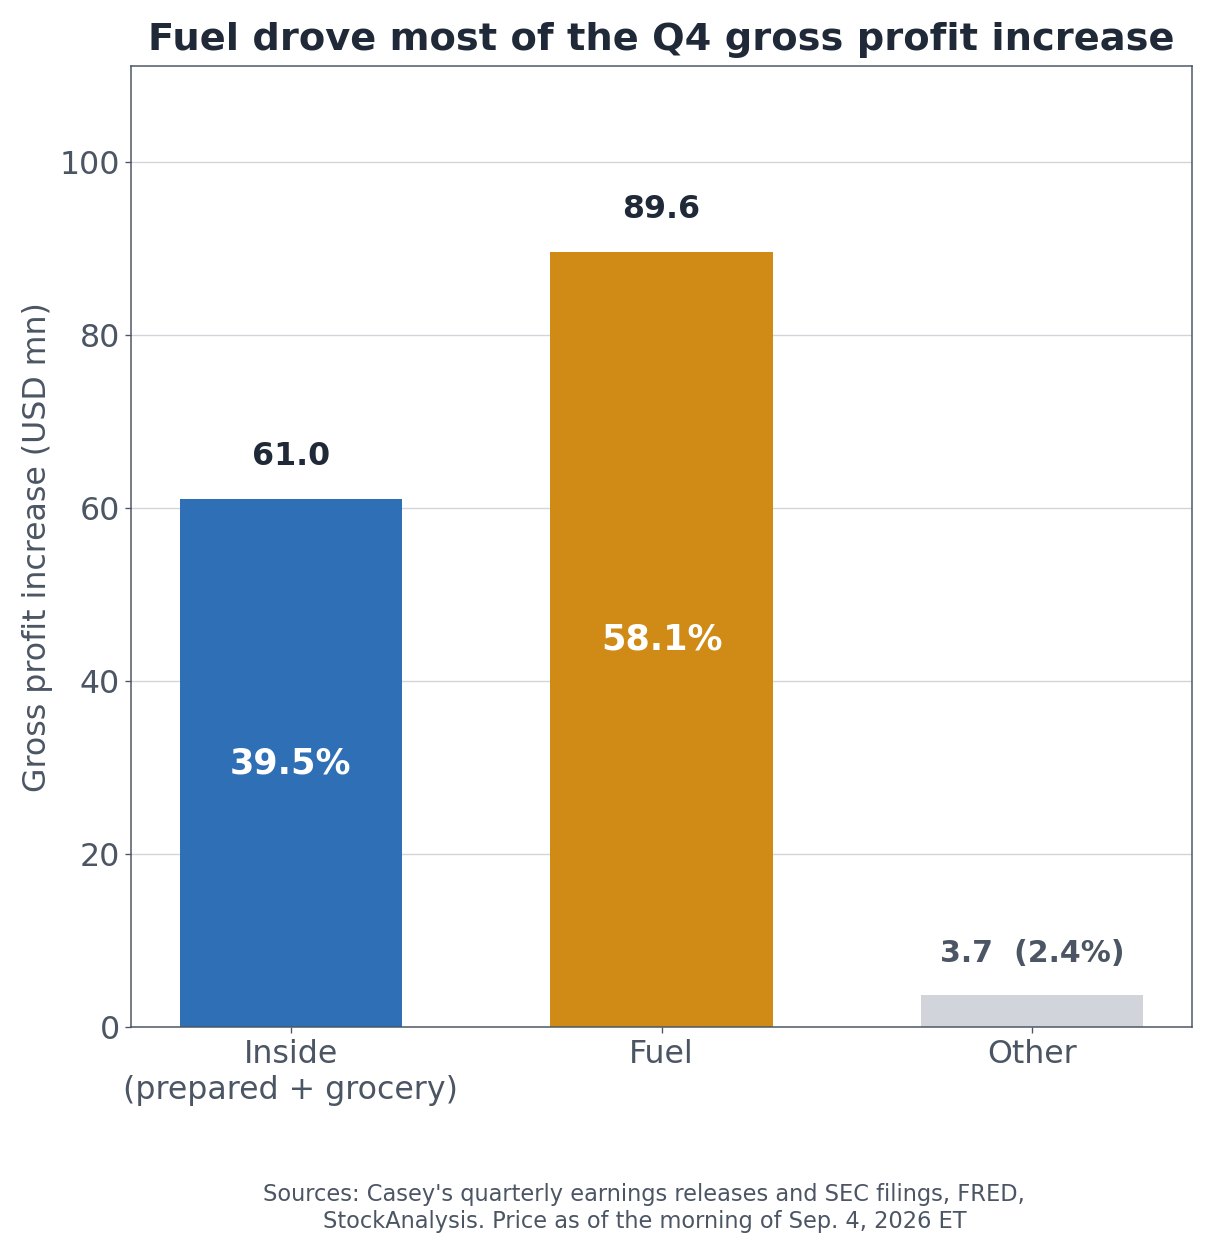
Breakdown of Casey's $154.3 million fiscal Q4 2026 gross profit increase by category
Fourth-quarter gross profit rose from $926.0 million to $1,080.4 million, an increase of $154.3 million. Fuel contributed $89.6 million of that, inside $61.0 million, and other categories $3.7 million. Fuel's share was 58.1%.
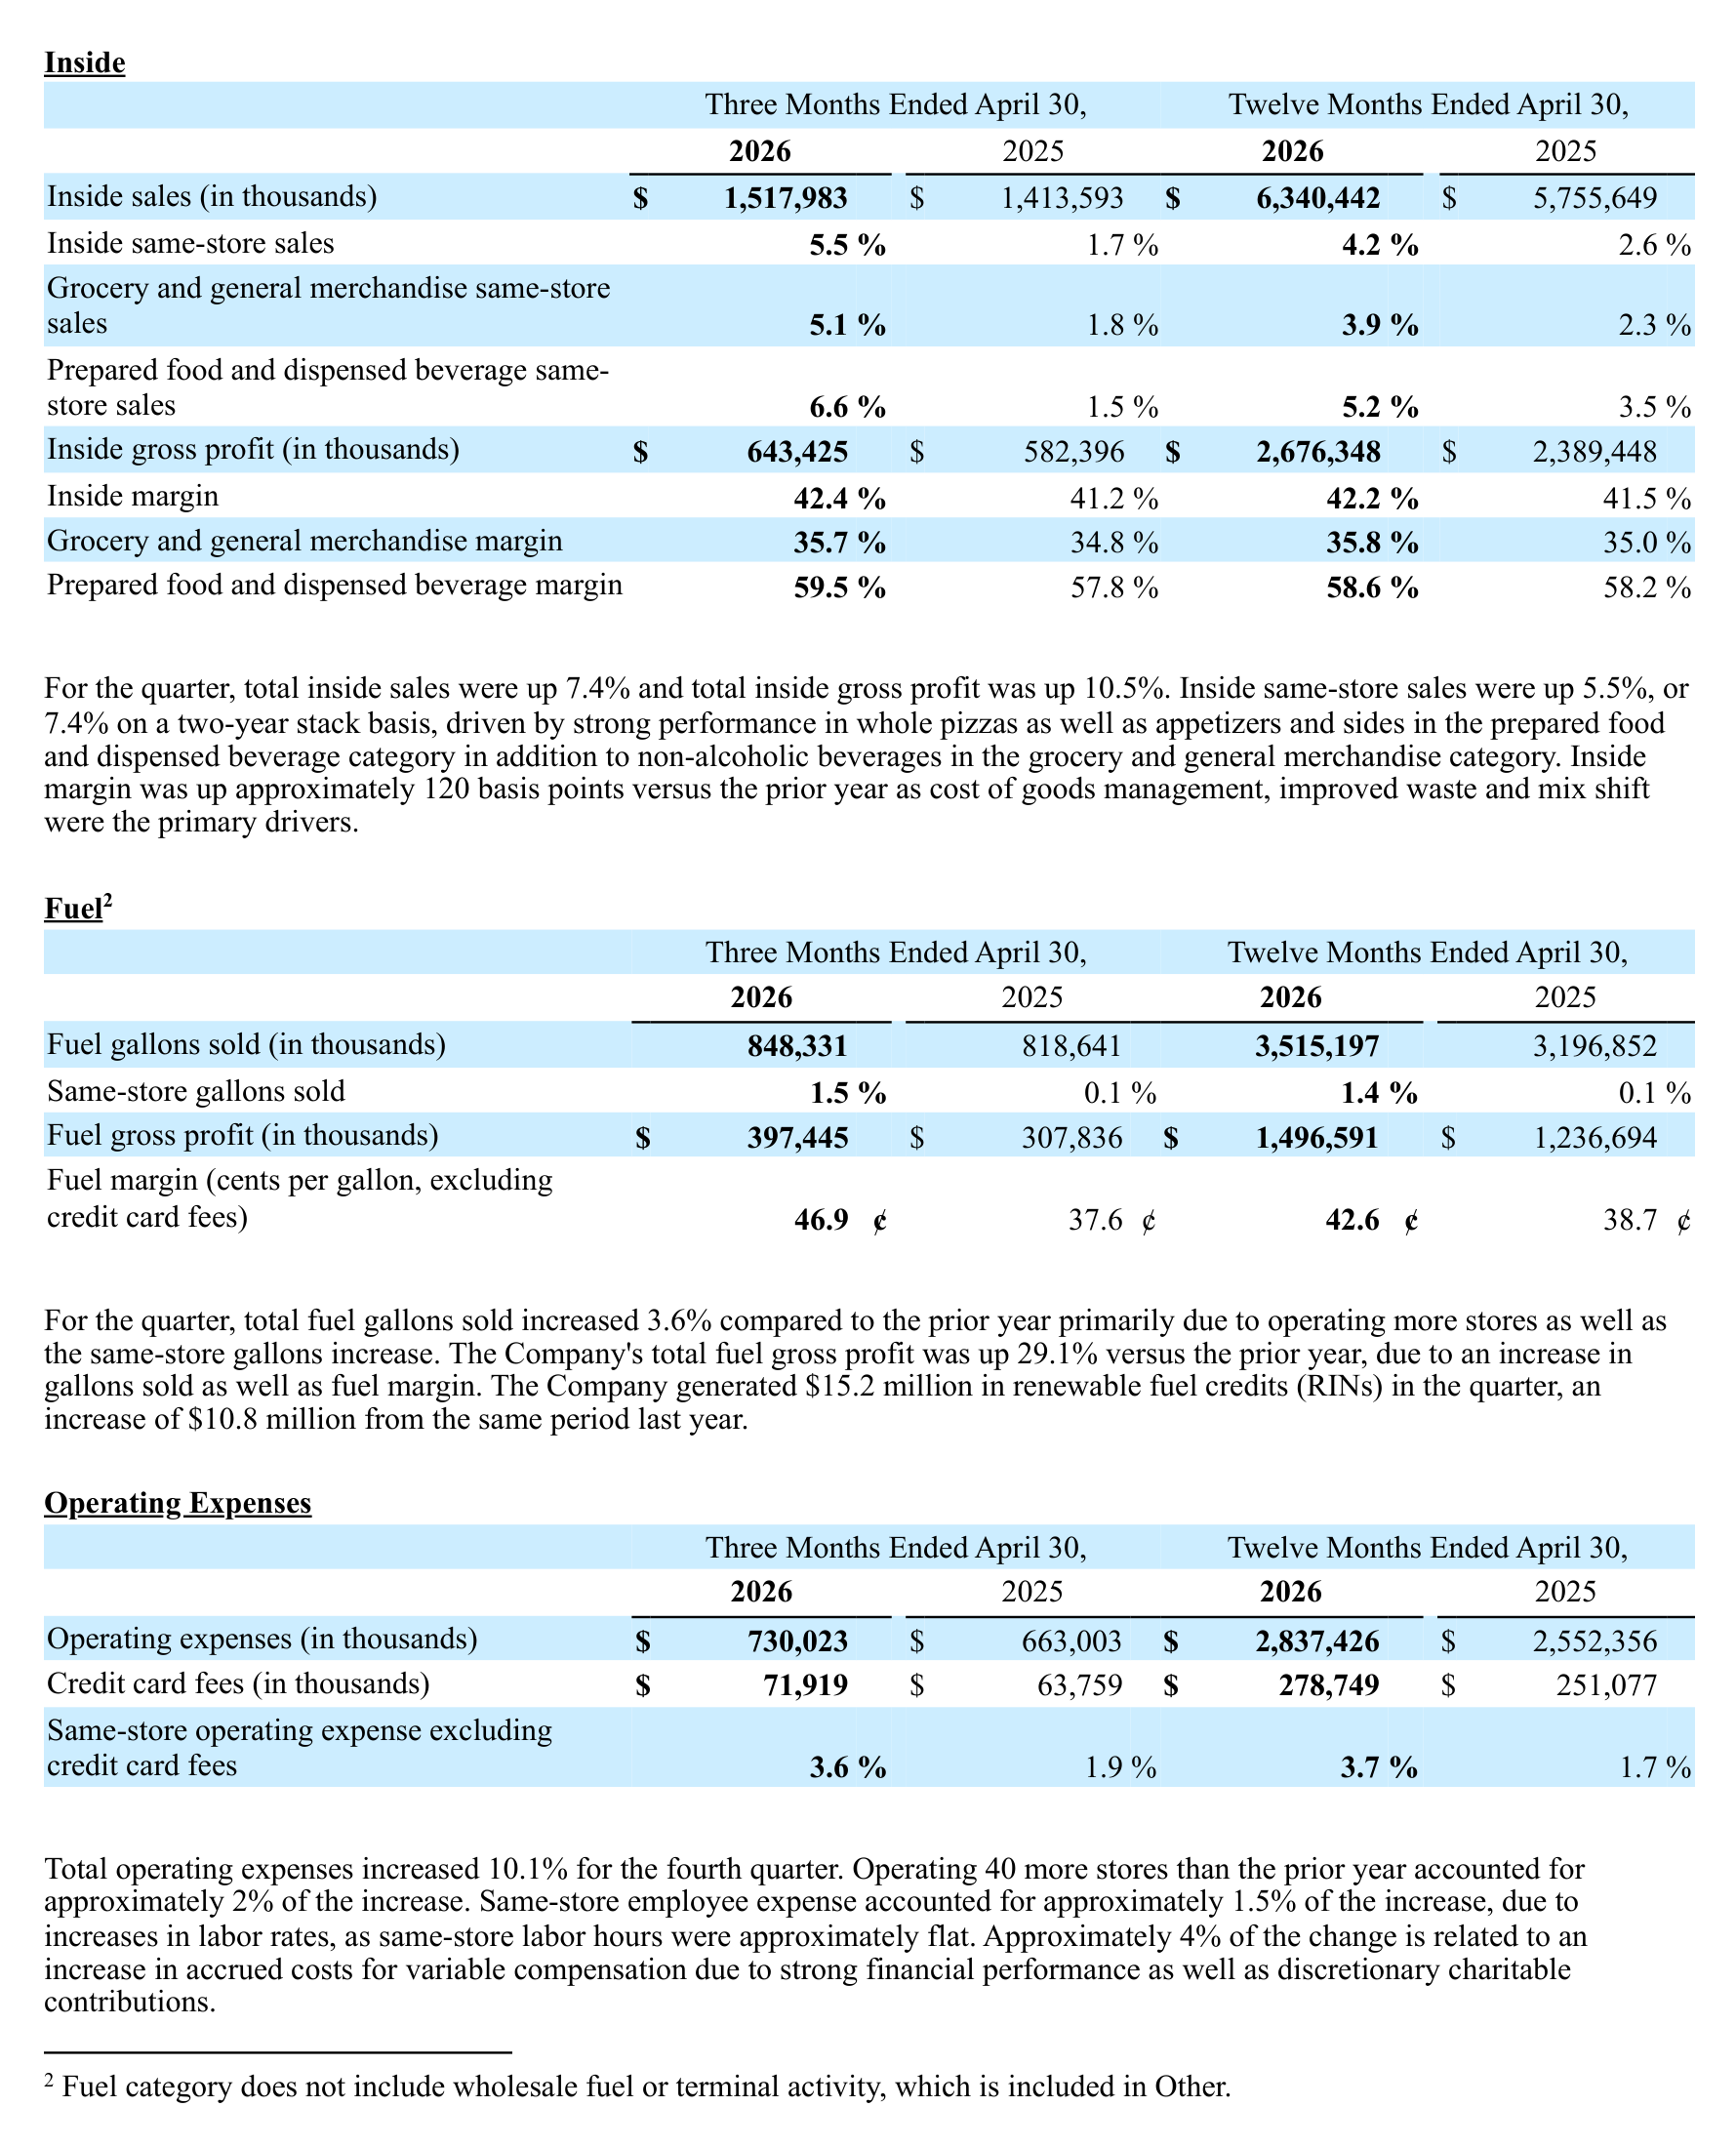
Inside did not stumble. Same-store sales rose +5.5%, or 7.4% on a two-year stack. Prepared food same-store sales rose 6.6%, which the company credited to whole pizzas, appetizers, and sides. Inside margin improved 120 basis points to 42.4% on cost-of-goods management, lower waste, and mix.
Casey's fiscal Q4 2026 inside and fuel results, from the company's earnings release
The issue is scale. Inside gross profit grew 10.5% while fuel gross profit grew +29.1%, nearly three times faster.
Split the $89.6 million of fuel gross profit into volume and margin and the answer is lopsided. Gallons rose from 818.6 million to 848.3 million, an increase of 29.7 million. Multiply that by the prior-year margin of 37.6 cents and you get $11.2 million. Multiply the full 848.3 million gallons by the 9.3-cent margin improvement and you get $78.9 million. Roughly 88% of the fuel gain came from margin, not volume.
Volume itself deserves a second look. Total gallons rose +3.6% while same-store gallons rose only 1.5%. The difference is store count: 40 new builds, 40 acquisitions, and 41 closures left the fleet 40 units larger. Existing stores did not sell much more fuel.
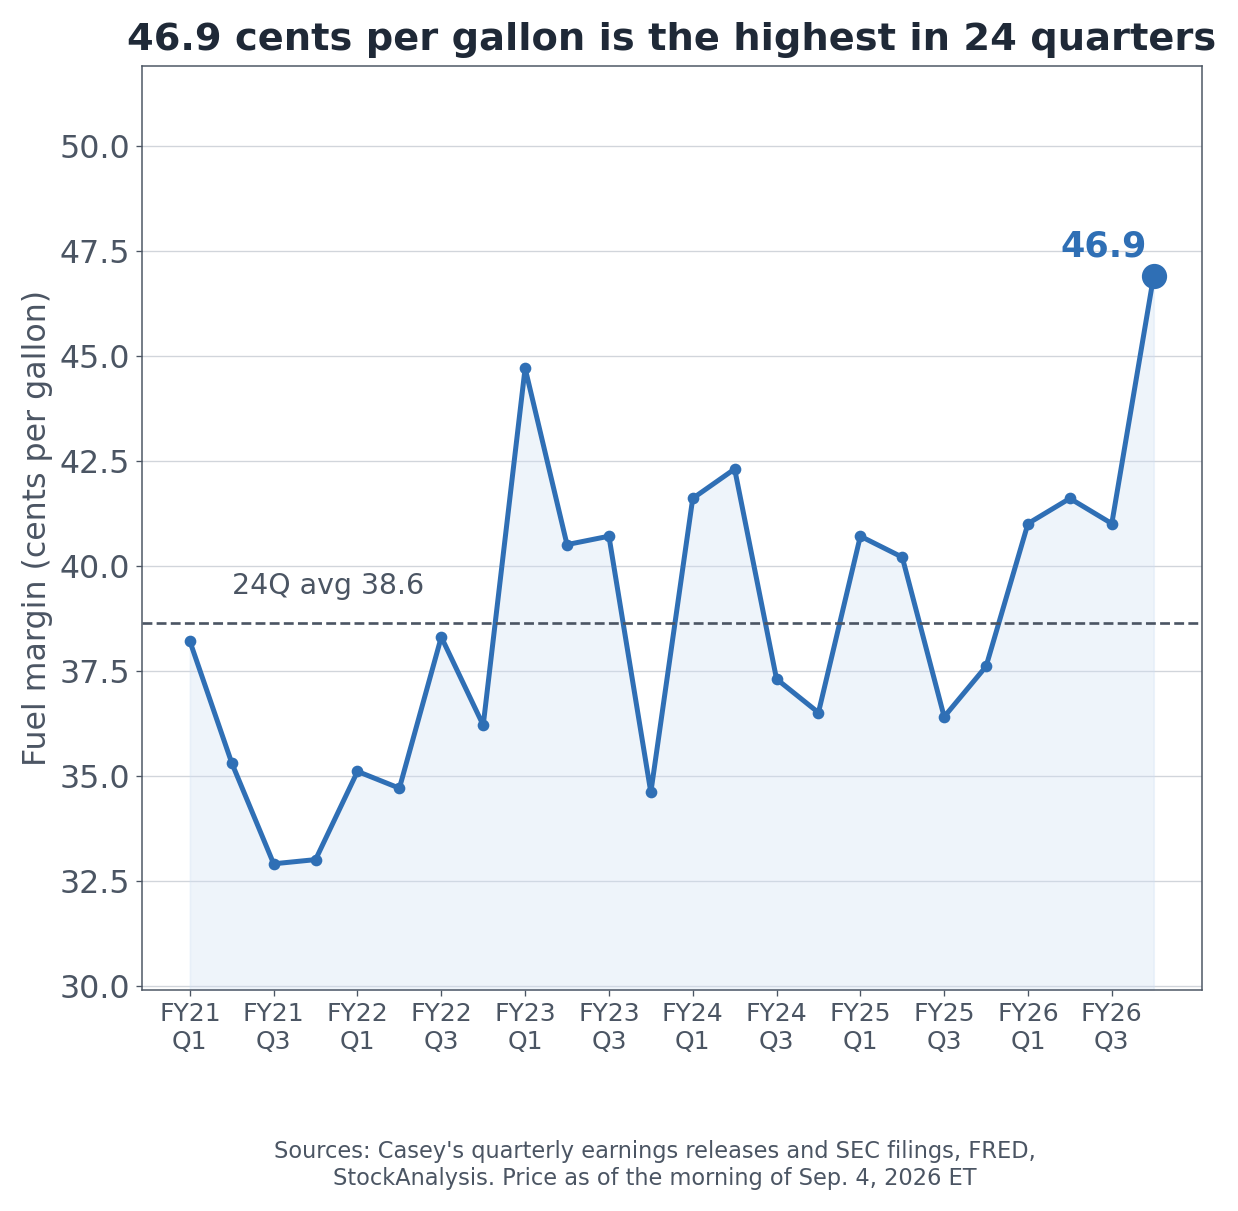
46.9 Cents a Gallon Is the Highest in 24 Quarters
Casey's fuel margin in cents per gallon across 24 quarters, excluding credit card fees
Context requires the time series. Parsing all 24 quarterly earnings releases back to fiscal Q1 2021 puts the average fuel margin at 38.6 cents. The previous peak was 44.7 cents in fiscal Q1 2023. At 46.9 cents, this quarter is the highest of the 24.
The company's own three-year table reaches the same conclusion.
Fiscal year
Q1
Q2
Q3
Q4
Full year
2026
41.0 cents
41.6 cents
41.0 cents
46.9 cents
42.6 cents
2025
40.7 cents
40.2 cents
36.4 cents
37.6 cents
38.7 cents
2024
41.6 cents
42.3 cents
37.3 cents
36.5 cents
39.5 cents
Casey's quarterly same-store sales and margins across three fiscal years, from the company's earnings release
Notice the seasonality. Casey's states in its 10-K that the first and second quarters, May through October, run stronger than the third and fourth. The table confirms it: fourth-quarter fuel margins were the weakest of their years in fiscal 2024 and 2025, at 36.5 and 37.6 cents. In fiscal 2026 the fourth quarter was the strongest. The seasonal pattern inverted.
The company explained one piece of it. Casey's generated $15.2 million in renewable fuel credits during the quarter, an increase of $10.8 million from the year before, which accounts for about 12% of the fuel gross profit gain. For the other 88%, the release cites volume growth and margin, and chief executive Darren Rebelez said only that "our fuel team did a great job balancing gallons sold with fuel margin, as fiscal 2026 fuel gross profit increased 21% from the prior year."
US Gasoline Market and Convenience Store Demand
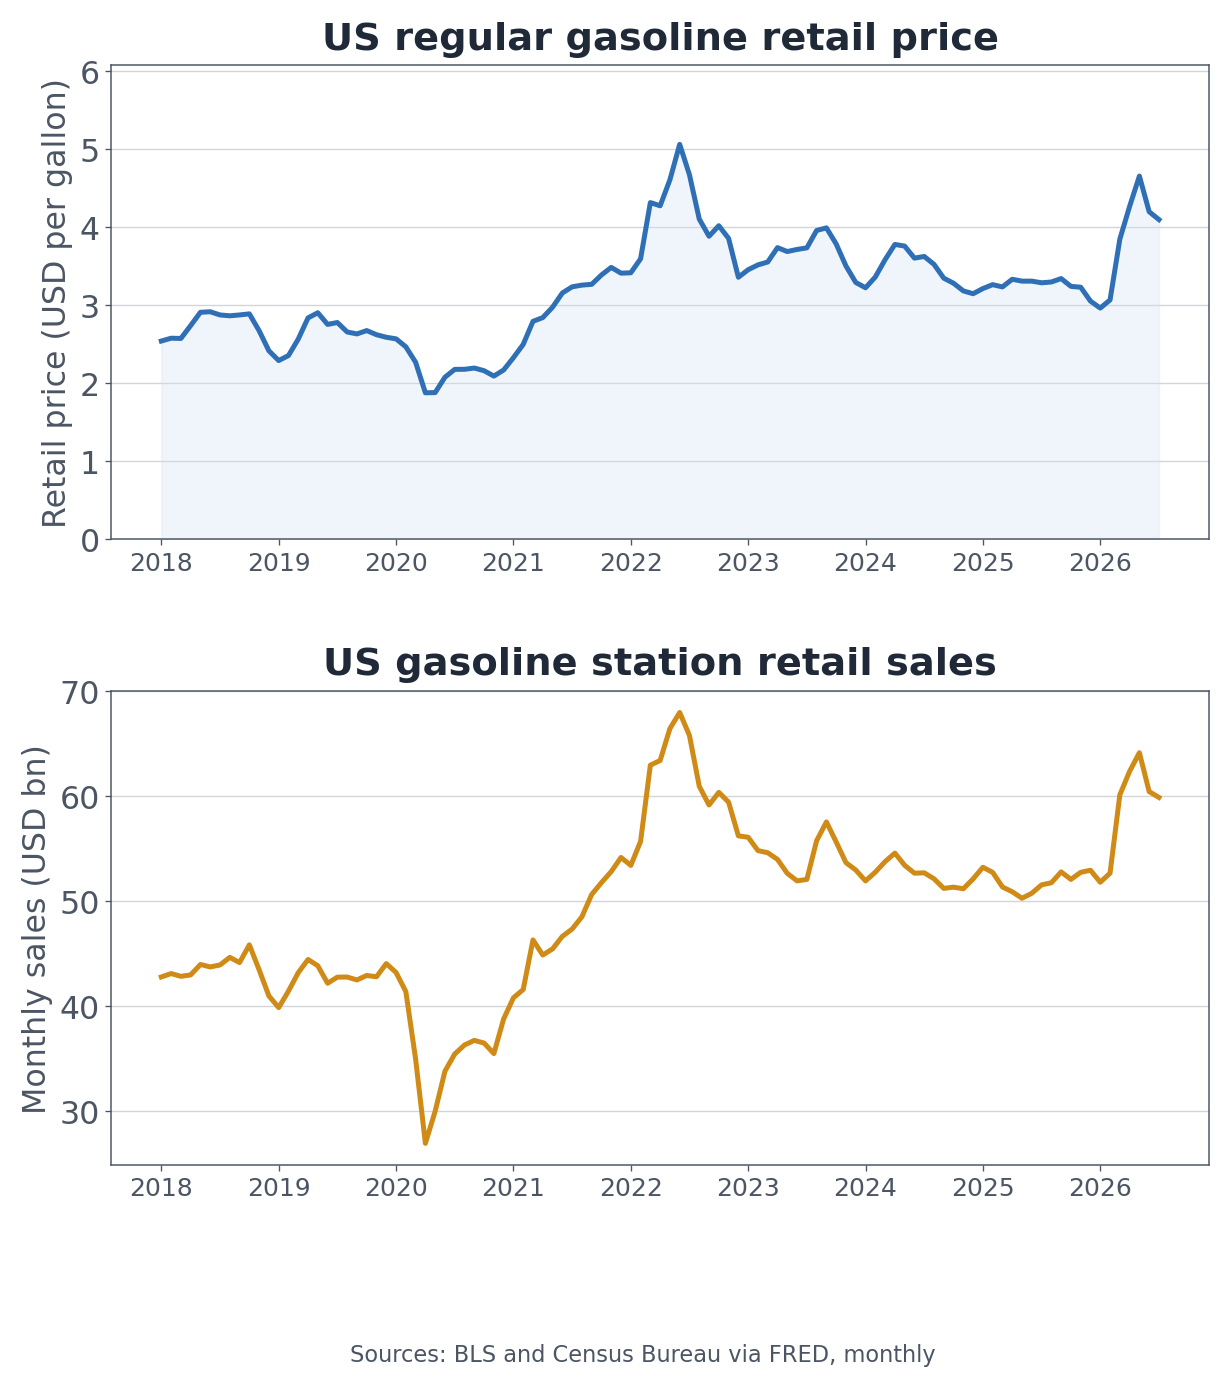
US regular gasoline retail price and gasoline station retail sales (Bureau of Labor Statistics and Census Bureau via FRED)
Fuel margin is not a price Casey's sets. It is the spread between wholesale and retail, and that spread moves with crude, refining margins, local competition, and how fast wholesale costs change. Official series belong next to the company's numbers.
The US average retail price for regular gasoline went from $2.961 per gallon in January 2026 to $3.065 in February, $3.843 in March, and $4.263 in April. Casey's fourth quarter runs exactly February through April. The quarterly average was $3.454, about 6.4% above the $3.247 of the same window a year earlier.
So the record margin arrived during a rising-price stretch. Retail margins usually compress when wholesale costs climb quickly, because pump prices lag. This time the two moved together. Casey's did not describe a causal link, and cross-checking the release and the 10-K against the official series confirms the direction and nothing more.
Gasoline station retail sales climbed over the same months, from roughly $52 billion to $64 billion. That series tracks dollars rather than gallons, so it rises with price and should not be read as demand growth.
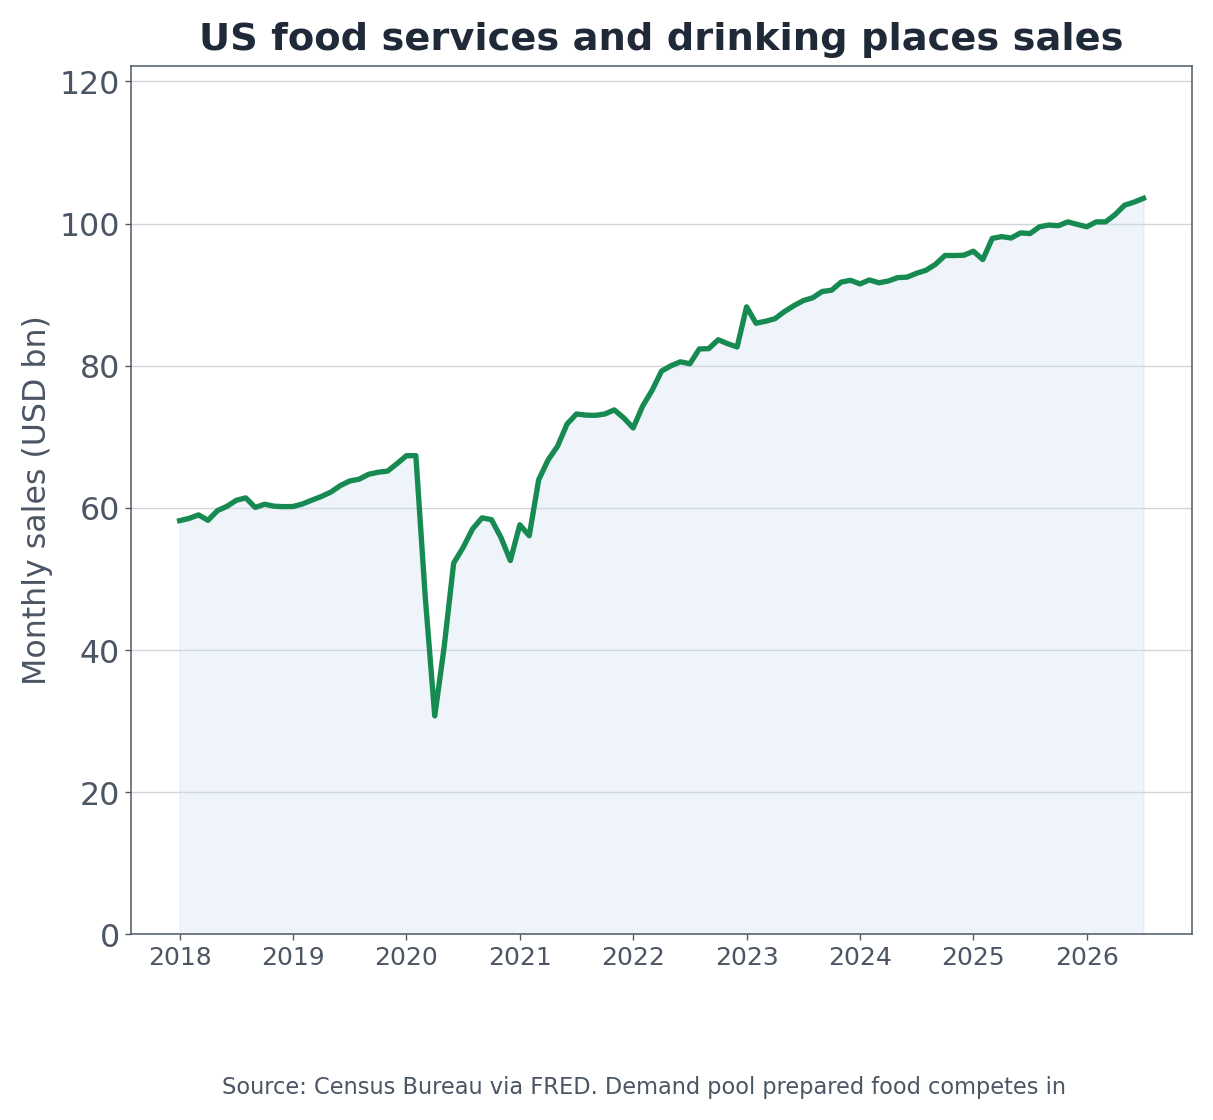
US food services and drinking places sales (Census Bureau via FRED), the demand pool Casey's prepared food competes in
The inside business faces a different backdrop. US food services and drinking places sales have climbed steadily since the 2020 collapse and now exceed $100 billion a month. Casey's pizza competes against that entire market, not only against other convenience stores. Its 10-K lists dollar stores and local grocers as competitors in small towns, and national chains, supermarkets, and quick-service restaurants in larger ones.
Operating Expenses Rose on Incentive Pay
Casey's fiscal Q4 2026 operating expense bridge, from the company's investor materials
Rising profit brings rising cost. Fourth-quarter operating expenses reached $730.0 million, up +10.1%. The company's own bridge splits those 10 percentage points five ways: same-store employee expense 1.5 points, same-store operations 1 point, growth and acquisitions 2 points, same-store credit card fees 1 point, and other 4.5 points.
The largest slice is that last one, which the footnote defines as performance-based compensation and charitable contributions. Variable compensation accrued higher because results were strong. It expands in good quarters and contracts in weak ones, which makes it a poor candidate for a fixed-cost line.
Labor held up well. Same-store labor hours were roughly flat, so only wage rates flowed through, at 1.5 points. Credit card fees of $71.9 million scale with sales by construction.
Casey's Valuation vs. Murphy USA and Dollar Tree
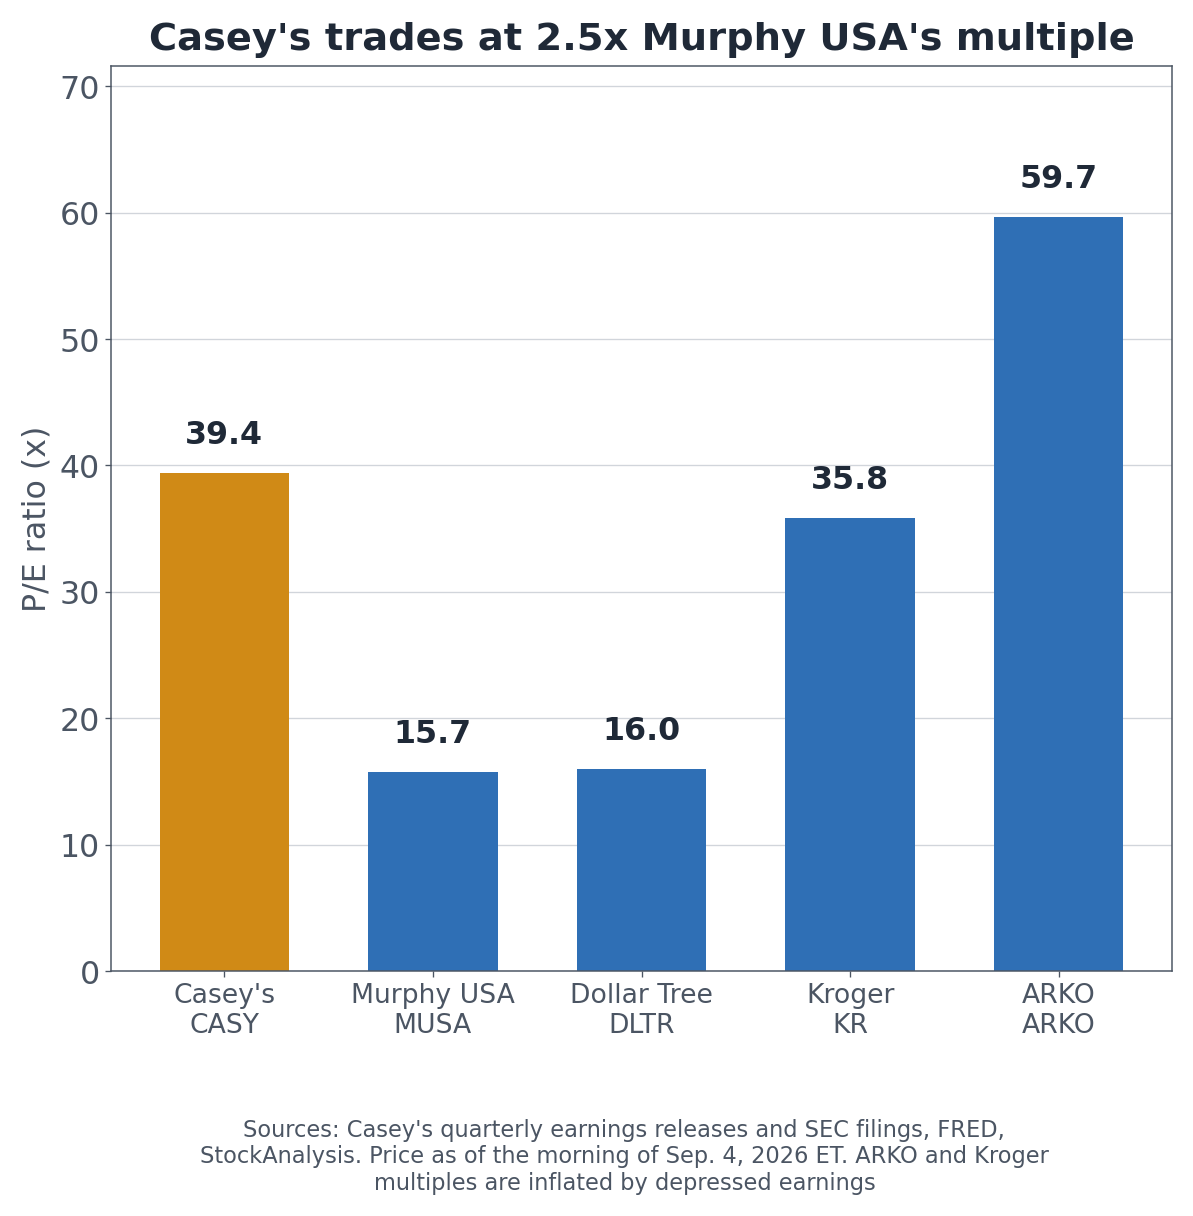
Price-to-earnings comparison across convenience, fuel, and adjacent US retail (September 4, 2026)
Lining up comparable operators shows what the market is actually paying for.
Company
Ticker
Market cap
Revenue (TTM)
P/E
Casey's General Stores
CASY
$27.8 billion
$17.56 billion
39.4x
Murphy USA
MUSA
$9.45 billion
$19.09 billion
15.7x
Dollar Tree
DLTR
$24.6 billion
$20.07 billion
16.0x
Kroger
KR
$35.9 billion
$148.7 billion
35.8x
ARKO
ARKO
$0.55 billion
$6.89 billion
59.7x
Murphy USA is the cleanest comparison. It operates fuel-led convenience stores across the US South and Midwest, often on Walmart-adjacent sites. Its revenue of $19.09 billion exceeds Casey's. Its market capitalization is a third of Casey's, and it trades at 15.7 times earnings.
The reason sits in the category table from earlier. Murphy USA is weighted toward fuel and runs almost no prepared-food kitchens. Casey's takes 36% of revenue from inside and turns it into 62% of gross profit. The 2.5x premium is the price of that inside business.
Kroger and ARKO need a caveat. Kroger's trailing EPS of $1.63 is depressed, which lifts its trailing multiple to 35.8x against a forward multiple near 11.1x. ARKO's $0.08 of EPS makes its ratio close to meaningless. Dollar Tree, which Casey's own 10-K names as a small-town competitor, trades at 16.0x.
Is Casey's Stock Expensive? Two Multiples, One Answer
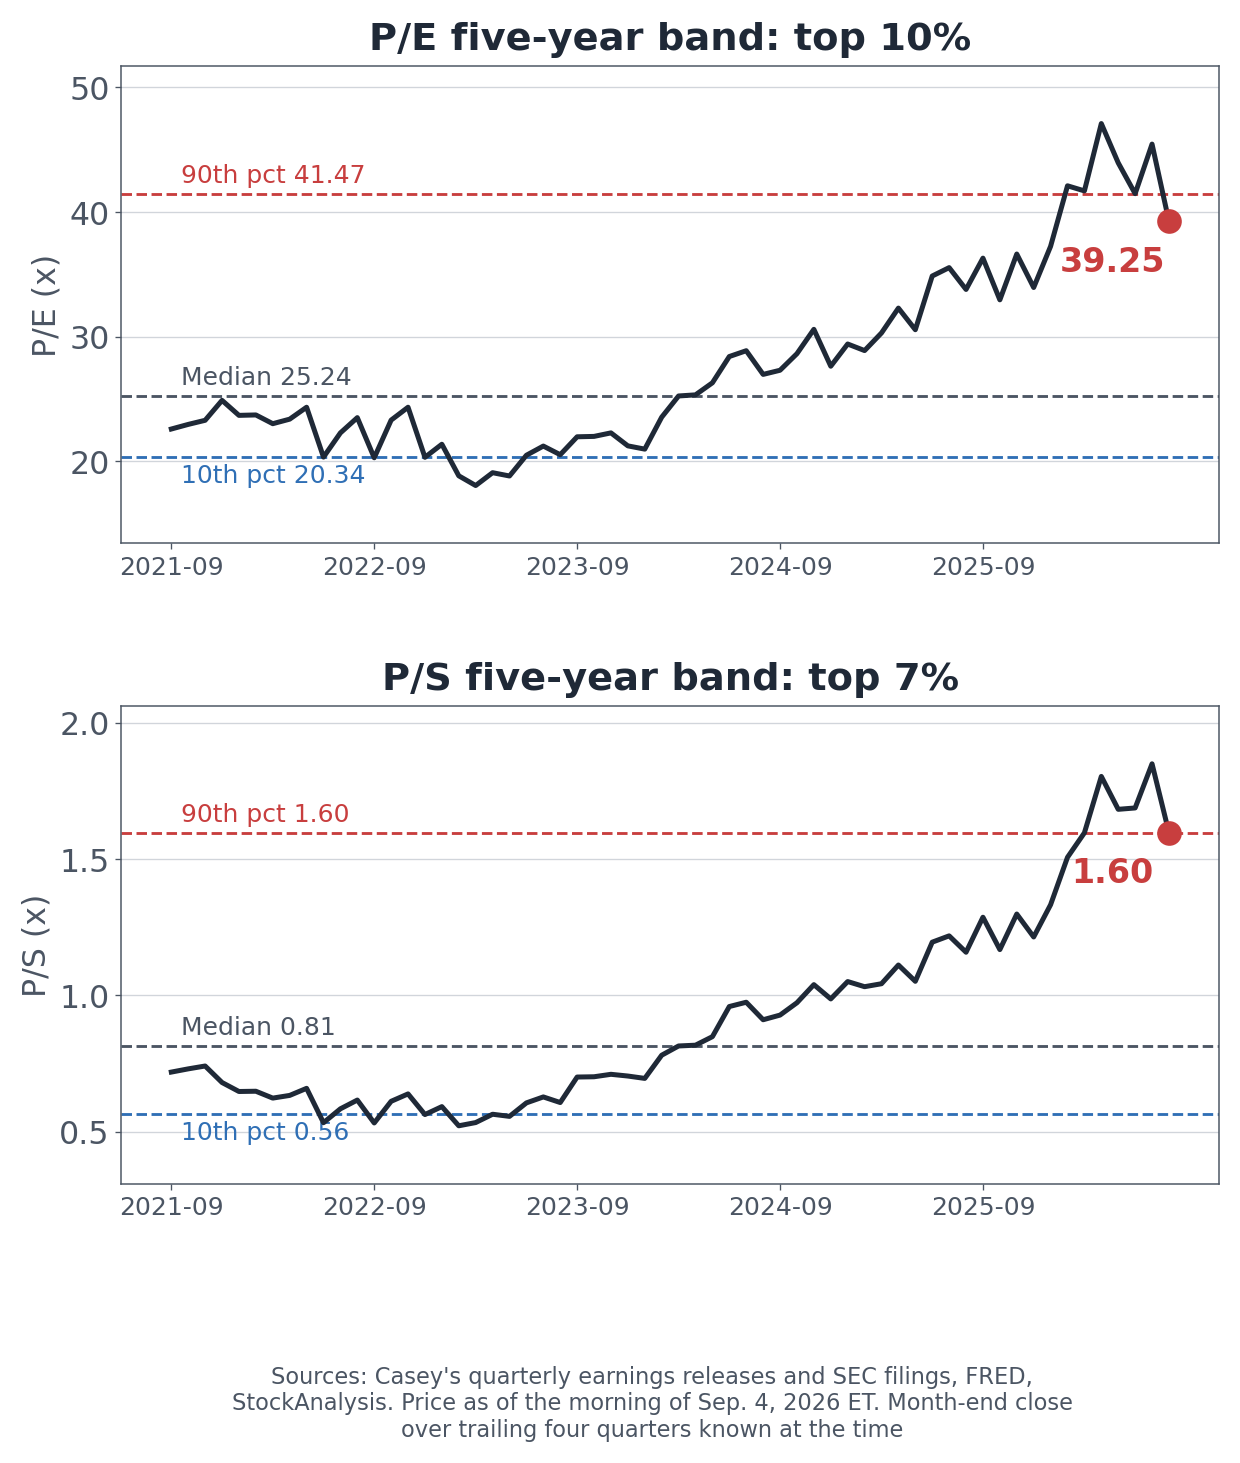
Casey's price-to-earnings and price-to-sales five-year bands, using month-end closes and the trailing four quarters known at each date
Plotting the multiples across 60 months of month-end closes, each paired with the trailing four quarters the market actually had at that date, puts the current level near the top. Because Casey's closes in April, the reporting calendar is mapped in code and the result was checked against aggregator figures for all three ratios before use.
Price-to-earnings sits at 39.25x, in the top 10% of five years, against a median of 25.24x. Price-to-sales is 1.60x, in the top 7%, and exactly double its 0.81x median. Price-to-book is 7.10x, also top 7%, against a 3.98x median. All three are pinned to the upper edge.
The re-rating has a start date. From 2021 through mid-2023 the price-to-earnings ratio moved between 18x and 25x. It began climbing in the second half of 2023 and reached 47x by April 2026. Earnings per share rose 61% over that stretch, from $11.91 to $19.16, and the share price rose considerably faster.
The most recent move runs the other way. The multiple has come back from 47.10x to 39.25x as earnings caught up and the price eased. Casey's repurchased about $63 million of stock in the fourth quarter and its board lifted the authorization to $1 billion in June. The average analyst price target is $956.28.
The balance sheet supports the flexibility. At April 30 the company held about $523 million in cash against roughly $900 million of undrawn credit, for approximately $1.4 billion of available liquidity. Shareholders' equity was $3.95 billion, entirely retained earnings.
What to Watch in the September 9 Earnings Report
Casey's reports fiscal Q1 2027 on September 9, 2026, a date listed on the company's investor events calendar. That quarter covers May through July and is seasonally the strongest of the year.
One number matters most: whether fuel margin held near 46.9 cents.
The backdrop has changed. US average gasoline prices ran $4.651 per gallon in May, $4.195 in June, and $4.094 in July. The fourth quarter was a rising-price stretch; the first quarter was a falling one. How the margin behaves across those two regimes is exactly what this report will show. A return to the low 40s would mark 46.9 cents as a single-quarter event. Another reading in the mid-40s would be evidence that fuel operations changed in a durable way.
On the inside business, prepared food same-store sales and the pace of the wings rollout are the pair to watch together. Fourth-quarter prepared food same-store sales of 6.6% were the strongest in two years, and whether that holds while the program expands from 850 stores toward the full fleet determines how much of the inside growth is real.
Casey's turns 36% of its revenue into 62% of its gross profit, and that structure is why it earns 2.5 times the multiple of a comparable operator. The fourth quarter was not driven by that structure. It was driven by fuel margin, and the stock trades at the top of its five-year range. Those two facts sitting together are what make September 9 worth watching.
Figures come from Casey's General Stores SEC filings and quarterly earnings releases, with official time series from the Federal Reserve Economic Data service and market data from StockAnalysis. The fuel margin series was built by parsing all 24 quarterly earnings releases from fiscal Q1 2021 through fiscal Q4 2026 and cross-checking against the company's own three-year summary table. Category revenue and gross profit come from the fiscal 2026 Form 10-K. Quarterly XBRL data was reconciled against the releases, and fourth-quarter figures were derived from annual totals where quarterly tags were absent. Valuation multiples pair month-end closing prices with the trailing four quarters of results publicly available at each date, mapped to Casey's April fiscal year end in code and verified against aggregator values. Share price data is as of the morning of September 4, 2026. This article is for information only and is not investment advice.