Shopify (SHOP) Stock Analysis: Net Income vs. Equity Gains
by Global Stock Brief2026. 9. 7.
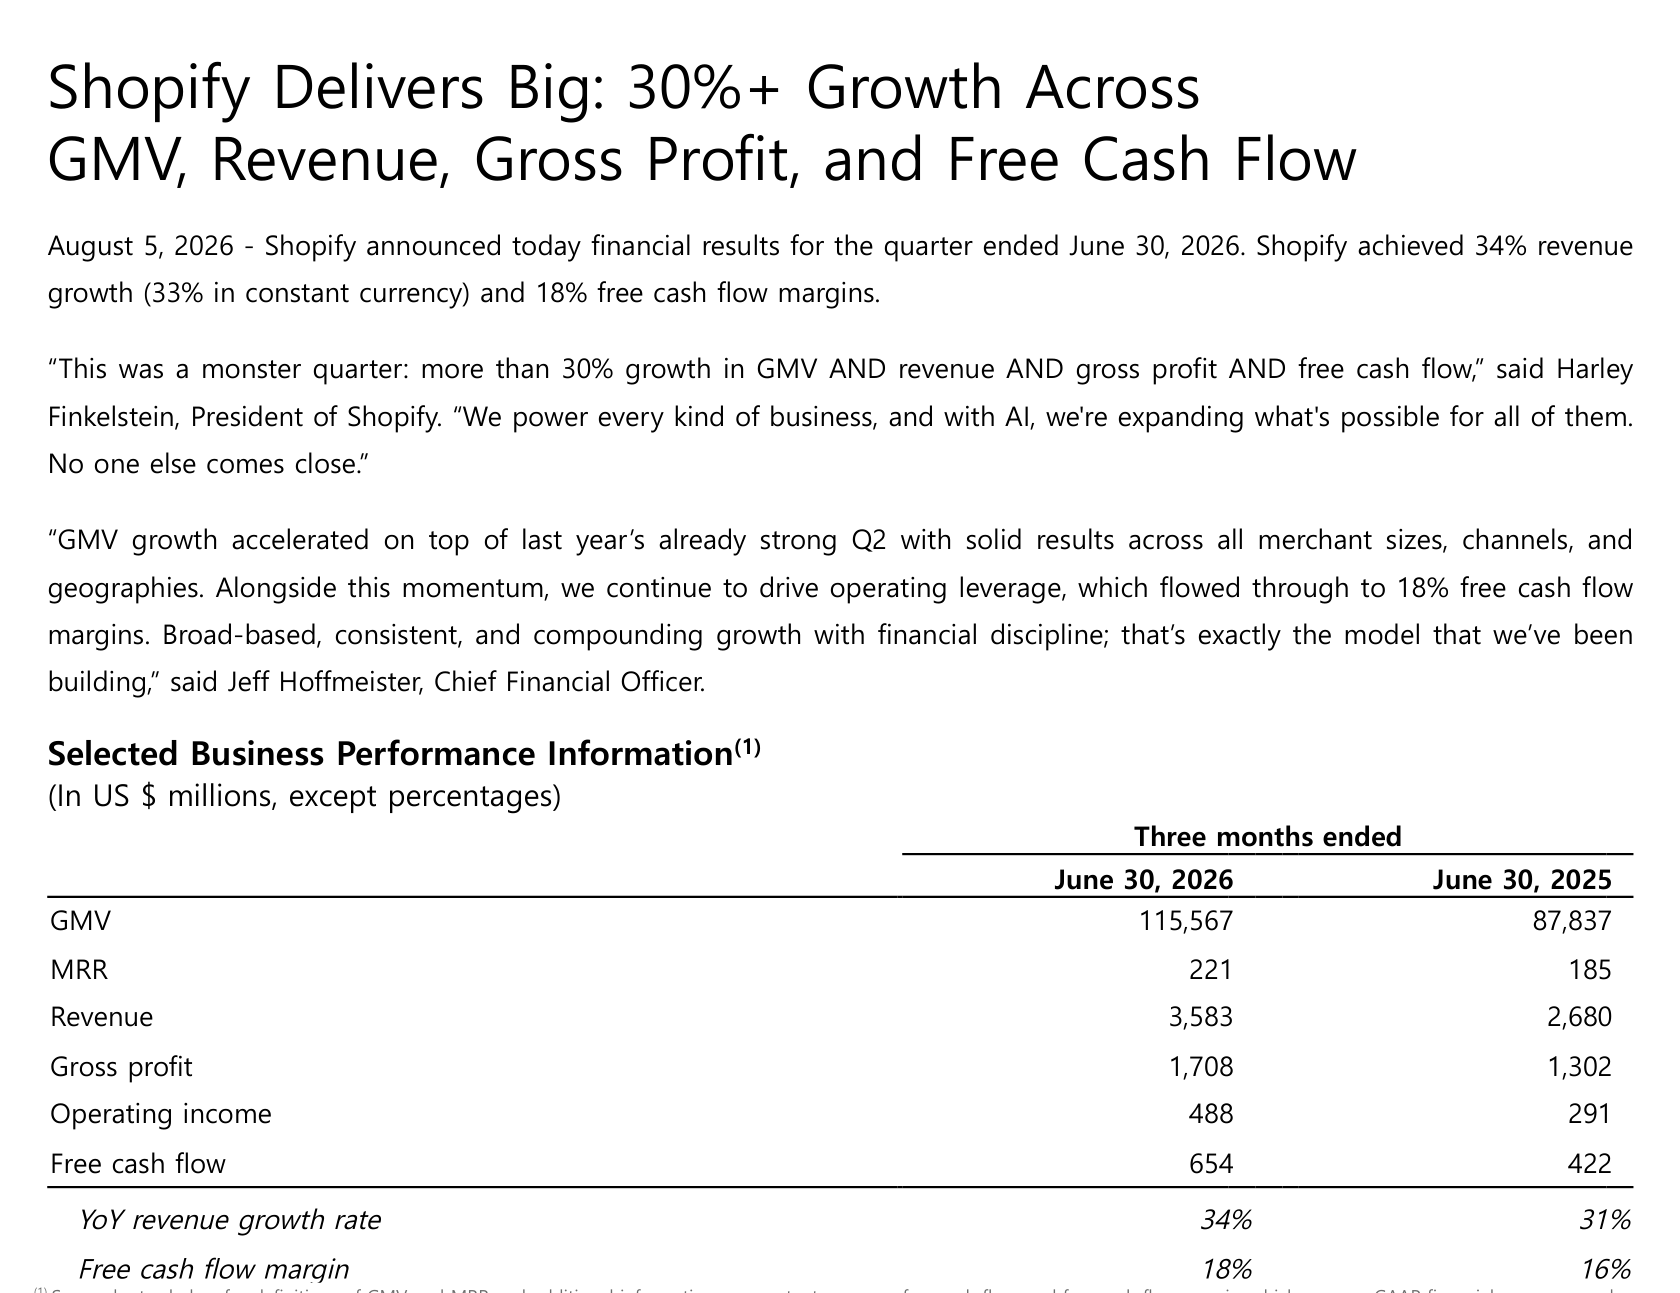
Shopify (NASDAQ: SHOP) grew Q2 2026 revenue 33.7% to $3.58 billion and reported net income of $1.50 billion, but $1.06 billion of that bottom line came from marking equity investments to market. This SHOP stock analysis works through what the company's own footnote asks investors to subtract, how 45 quarterly earnings releases line up when both measures are counted, why one aggregator shows operating income of 629 while the filing says 488, where the P/S and P/B bands sit today, and why a P/E band cannot be drawn at all.
The instruction to subtract does not come from a skeptic. It comes from Shopify. One line below net income in the release, the company prints "less: equity investments, marked to market, net of taxes," and beneath that a second bottom line of $439 million. So the question for this quarter is not whether Shopify had a good one. It is which number you should be reading.
Shopify Q2 2026 earnings release, page 1: the metrics the company chose to put up front
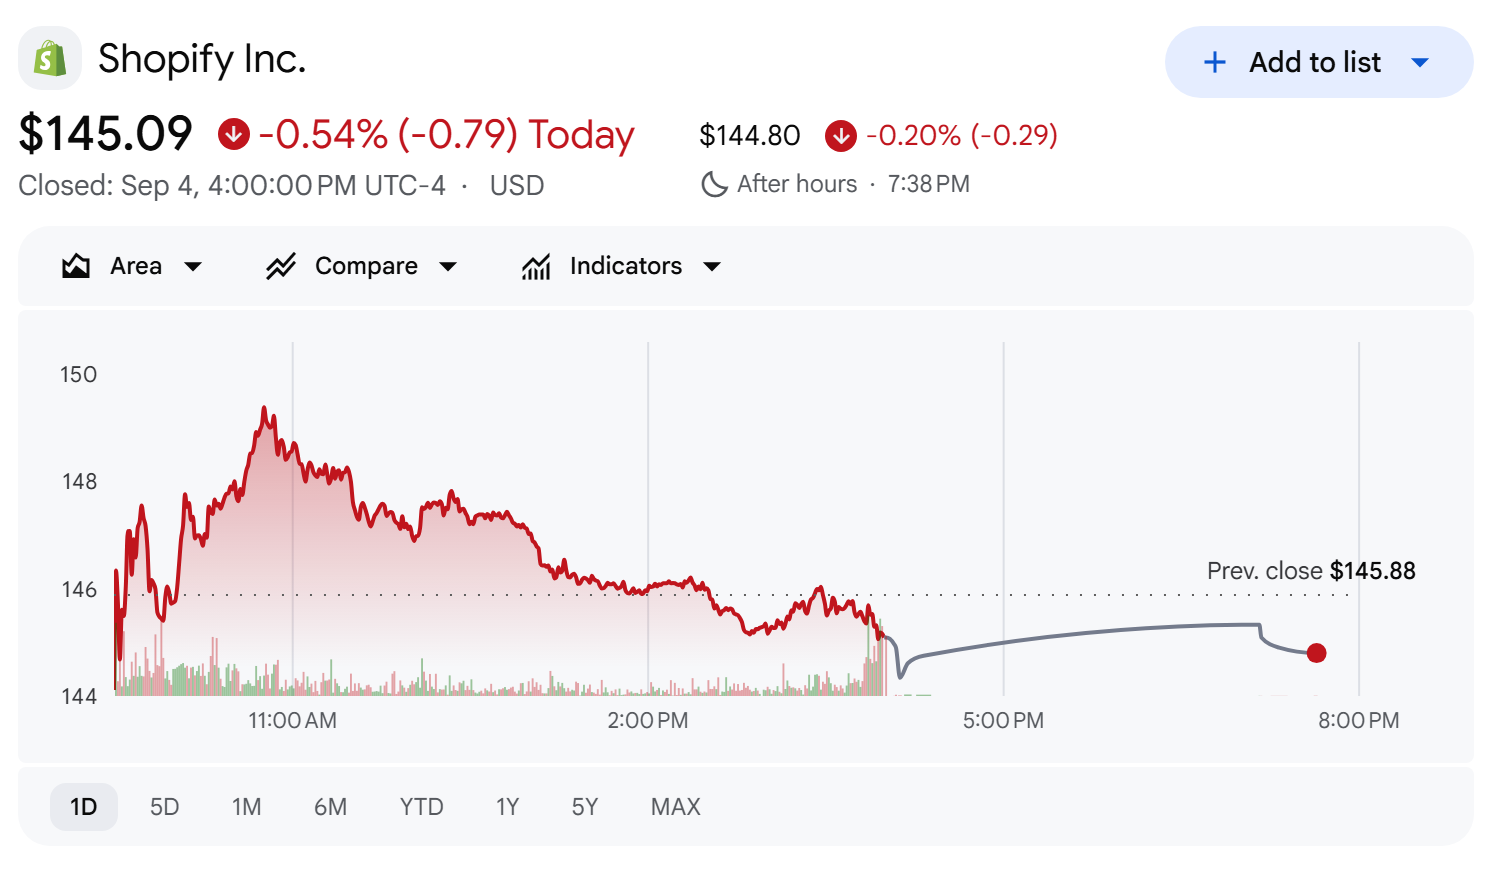
Shopify's market capitalization is $186.7 billion. The fiscal year ends in December, so Q2 2026 covers April through June. Unless stated otherwise, every profit figure here is US GAAP, and multiples use trailing-twelve-month (TTM) denominators.
SHOP share price, Google Finance, close of Sep. 4, 2026
Shopify's Own Footnote Asks You to Subtract $1.06 Billion
Filing footnote (Q2 2026 earnings release, page 3, note 3): "valuations of third parties in public and private markets are outside of our control, and therefore, fluctuations in those valuations are not relevant to the fundamentals of our business and have little analytical or predictive value regarding our ability to drive operational results."
Notes 2 and 3 from the Q2 2026 earnings release, in the company's own words
Read that again with the accounting in front of you. Shopify holds stakes in public and private companies. When those stakes move, GAAP net income moves with them. The company is telling you that movement says nothing about how well it runs its business, and then it prints a second bottom line with the movement stripped out.
So when did that second line first appear? Own calculation (45 quarterly earnings releases, Q2 2015 to Q2 2026): I pulled every quarterly earnings release Shopify has filed since its first public quarter and parsed the income statements into a single series. There are no gaps. The adjusted net income line shows up in the last six of those 45 quarters, and nowhere in the 39 before them.
The timing is worth a second look. It first appeared in the Q1 2025 release of May 8, 2025, a quarter that reported a net loss of $682 million, of which $908 million was an equity mark. Strip the mark out and that quarter was a $226 million profit. The disclosure was born in the quarter that most needed it.
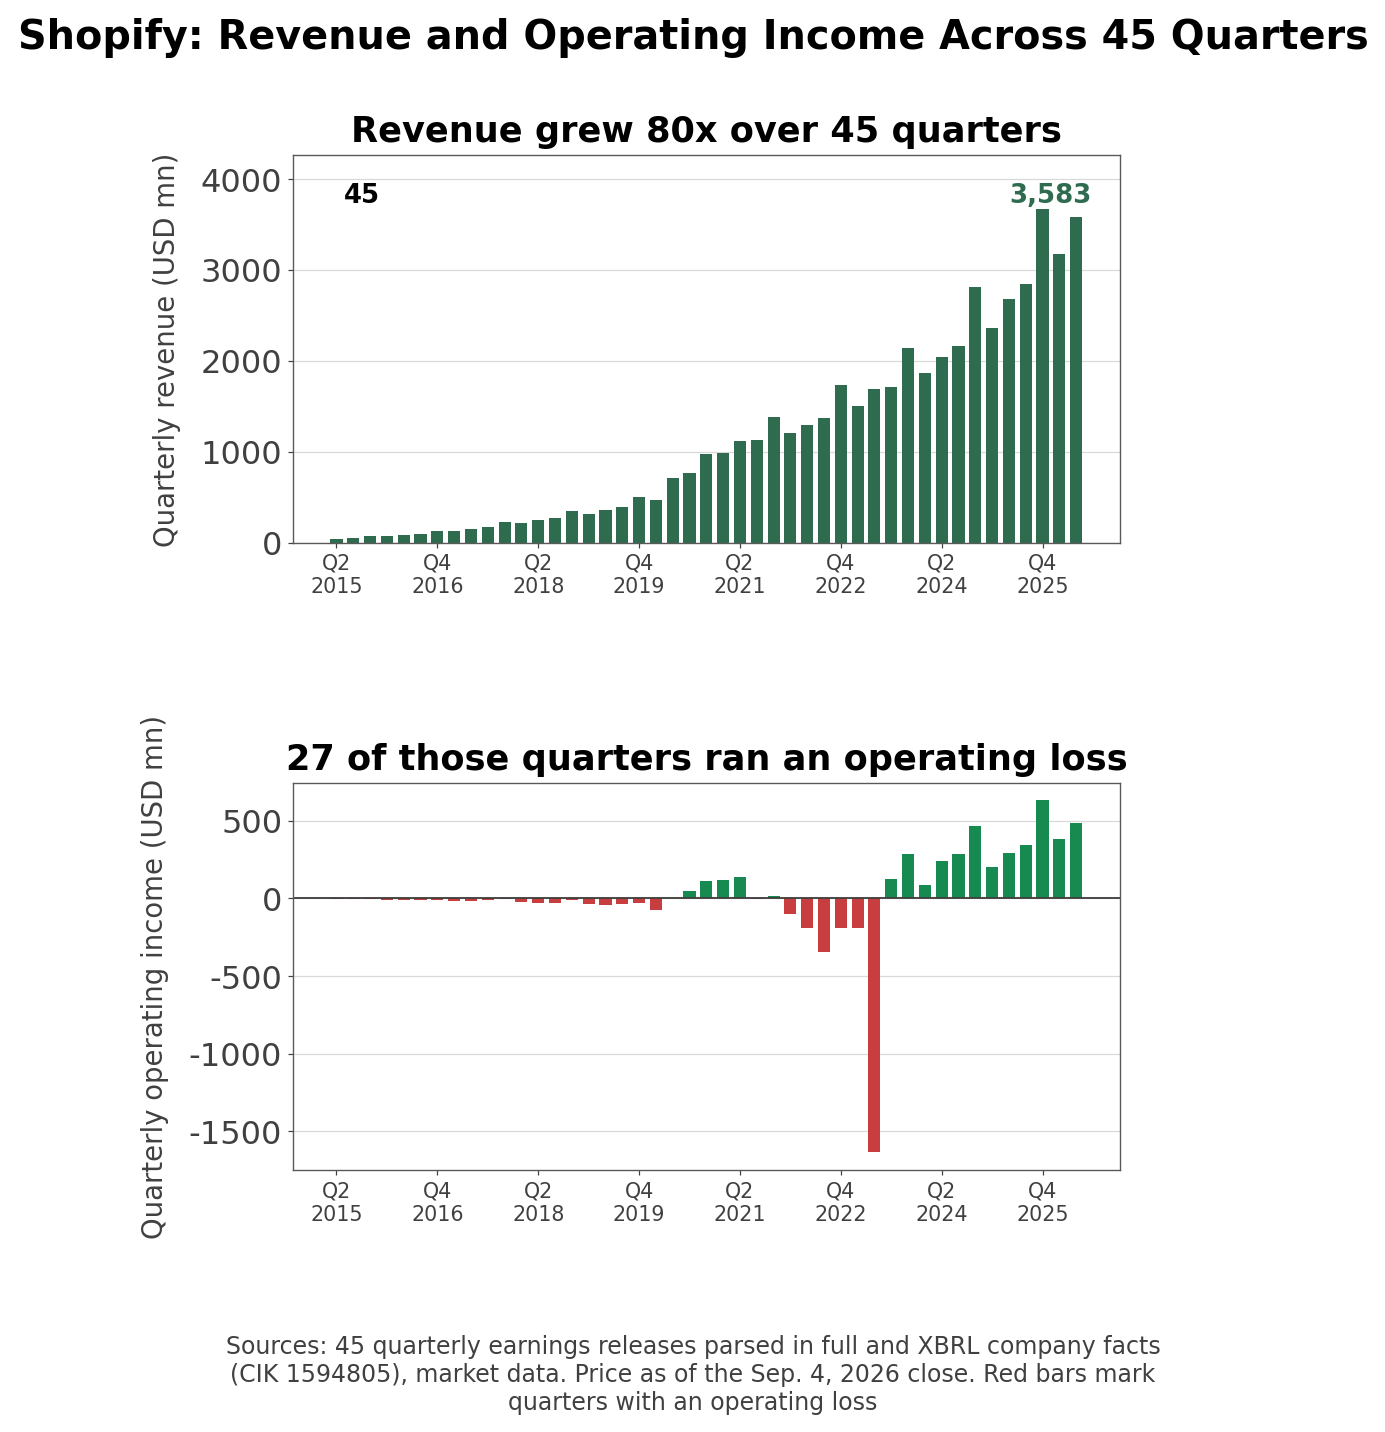
Revenue across 45 quarters and the operating income underneath it
The long series is worth having for its own sake. Revenue went from $45 million in Q2 2015 to $3.58 billion, an 80x increase. Operating income was negative in 27 of those 45 quarters and only settled into the black from Q3 2023.
Reported Net Income Goes Negative Twice; Adjusted Does Not
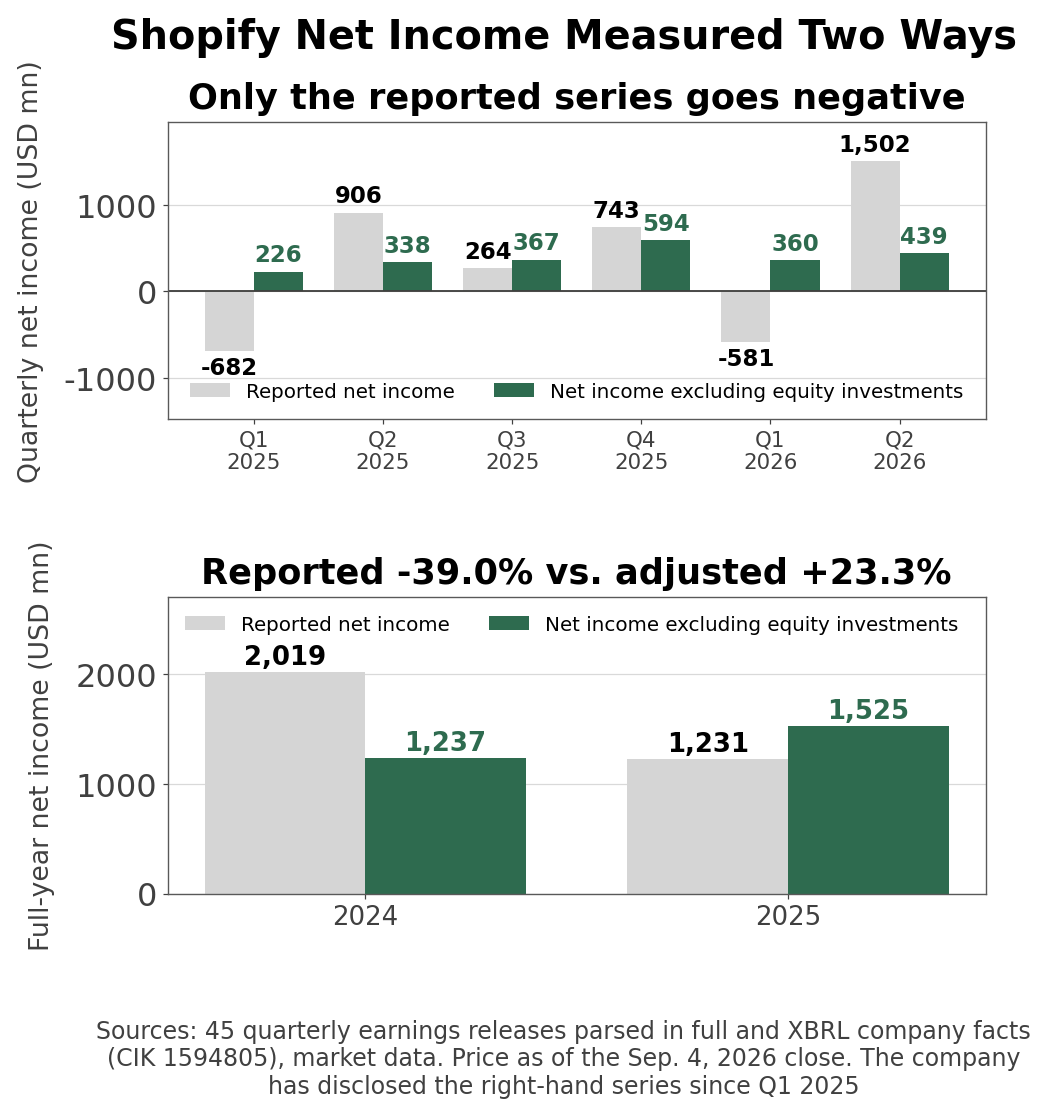
Here are the six quarters the company has disclosed both ways, in millions of dollars.
Quarter
Reported net income
Equity marks
Excluding equity marks
Adjusted net margin
Q1 2025
-682
-908
226
9.6%
Q2 2025
906
568
338
12.6%
Q3 2025
264
-103
367
12.9%
Q4 2025
743
149
594
16.2%
Q1 2026
-581
-941
360
11.4%
Q2 2026
1,502
1,063
439
12.3%
The left column swings from -682 to 1,502 and crosses zero twice. The right column stays between 226 and 594 and is positive in all six quarters.
Six quarters and two years, counted both ways
The standard deviation of reported net income across those six quarters is 788. For the adjusted series it is 112. Seven times the spread. Every quarter this company is described as having beaten or missed, and most of that motion was made by other companies' share prices.
Stretch the frame to full years and the sign itself flips. Company disclosure (Q4 2025 earnings release, full-year columns, Feb. 11, 2026): reported net income fell from $2,019 million in 2024 to $1,231 million in 2025, while net income excluding equity marks rose from $1,237 million to $1,525 million.
The reconciliation table Shopify prints at the end of each release
Down 39.0% on the books, up 23.3% on the company's own measure. The cause is that equity marks swung to a $294 million loss in 2025. "Earnings fell by nearly two fifths" and "earnings rose by more than a fifth" are both true statements about the same year.
Why Does SHOP Operating Income Read 629 and 488?
The split at the bottom of the income statement has a quieter cousin further up.
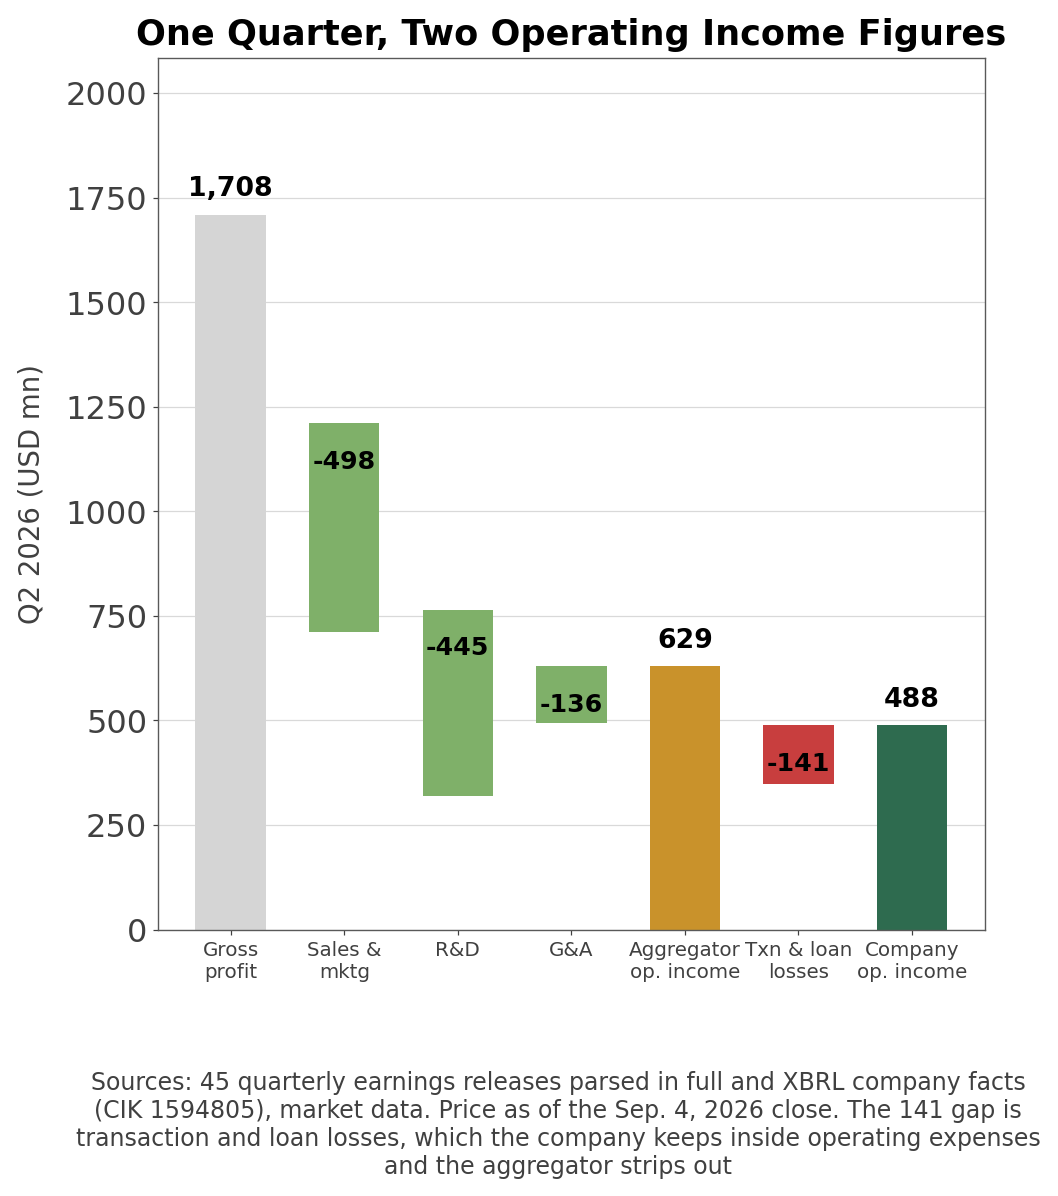
Aggregator cross-check (as of Sep. 4, 2026): one widely used data provider shows Shopify's Q2 2026 operating income as $629 million and its operating margin as 17.6%. The filing says $488 million and 13.6%.
Where the 141 sits between 629 and 488
The gap is transaction and loan losses. Take gross profit of 1,708, subtract sales and marketing 498, R&D 445, and G&A 136, and you land on 629. Shopify then subtracts transaction and loan losses of 141 and reports 488. That charge is 3.9% of revenue.
Neither presentation is wrong. But Shopify lends to merchants and processes their payments, so credit and fraud losses are a cost of running the business rather than something outside it, which is presumably why the company keeps them inside operating expenses. Pick whichever convention you like; just know which one is on your screen before you compare margins with a peer.
What Does Shopify (SHOP) Do?
Of Q2 2026 revenue of 3,583, subscription solutions contributed 802 and merchant solutions 2,781, a split of 22.4% to 77.6%. Merchant solutions covers payment and currency-conversion fees from Shopify Payments, merchant lending, partner referrals, shipping labels, point-of-sale hardware, and app-store advertising.
The two lines move at different speeds. Subscription revenue grew 22.3% while merchant solutions grew 37.4%. Monthly recurring revenue reached $221 million, up 19.5%. Shopify Payments handled 68% of global GMV, three percentage points more than a year earlier. The revenue mix keeps tilting toward payments.
Company disclosure (FY2025 Form 10-K, Item 1): on gross merchandise volume the company writes that "GMV does not represent revenue earned by us." GMV is what merchants sold; Shopify takes the fee on top.
That makes the top line a function of how much merchants sell. Q2 2026 GMV was $115.57 billion, and revenue of $3.58 billion is 3.1% of it. By channel, offline GMV grew 32%, B2B GMV 76%, and GMV through the company's own Shop app 53%, all faster than the base. Hold the take rate steady and GMV sets the direction of revenue.
On the earnings call the same morning, management framed the quarter around the same four metrics as the release headline. President Harley Finkelstein, quoted in that release, put it this way: "This was a monster quarter: more than 30% growth in GMV AND revenue AND gross profit AND free cash flow." Chief Financial Officer Jeff Hoffmeister added that "GMV growth accelerated on top of last year's already strong Q2 with solid results across all merchant sizes, channels, and geographies." Neither list includes net income.
US E-Commerce Penetration Rate and Market Size
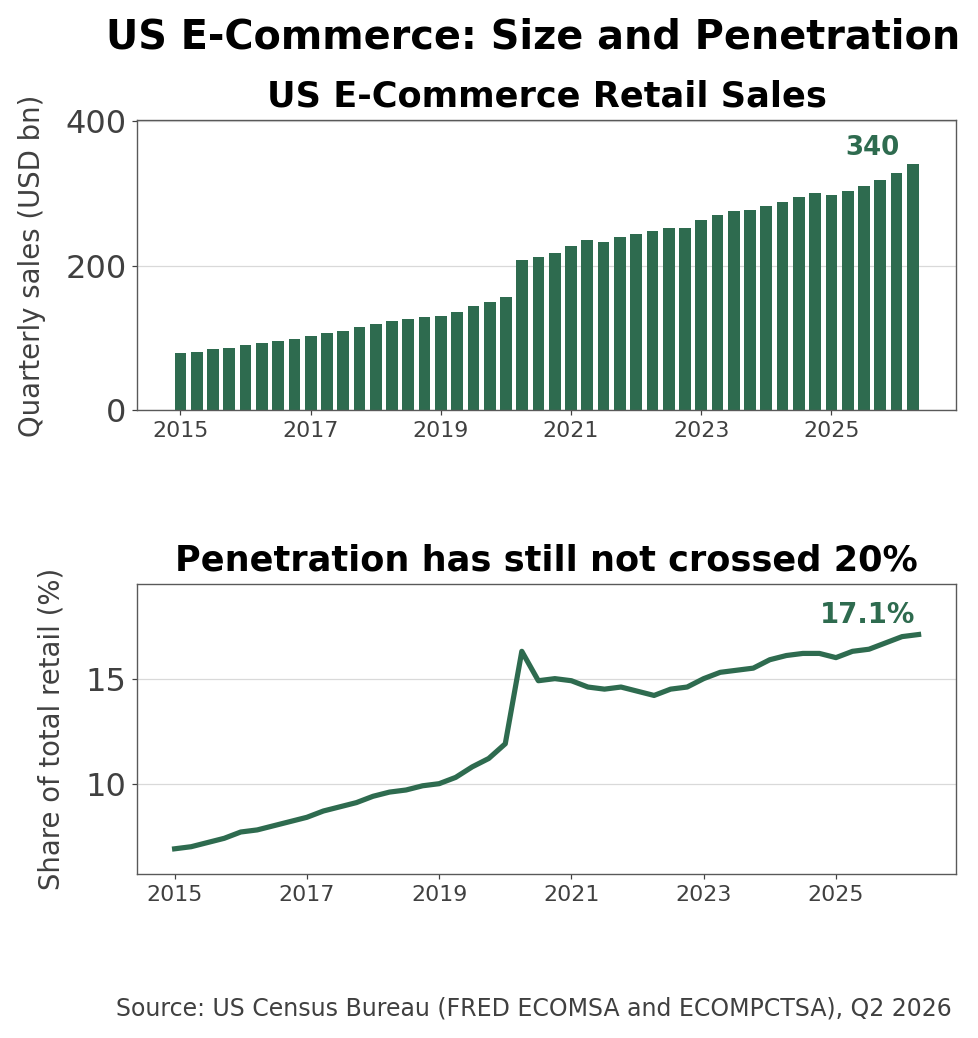
Official statistics (FRED ECOMSA and ECOMPCTSA, Q2 2026): US e-commerce retail sales were $340.2 billion for the quarter, or 17.1% of total retail. The series began at 0.6% in late 1999 and was around 11.2% at the end of 2019.
US e-commerce sales and penetration, 1999 to 2026
Penetration under 20% is the spine of the growth case for this industry. It is also easy to misuse. Shopify's GMV is worldwide and includes offline point-of-sale, while the Census series counts US online retail only. Dividing one by the other does not produce a market share.
Measure
Q2 2026
Year earlier
Change
US e-commerce sales
$340.2bn
$303.3bn
+12.2%
US e-commerce penetration
17.1%
16.3%
+0.8pp
Shopify GMV
$115.6bn
$87.8bn
+31.6%
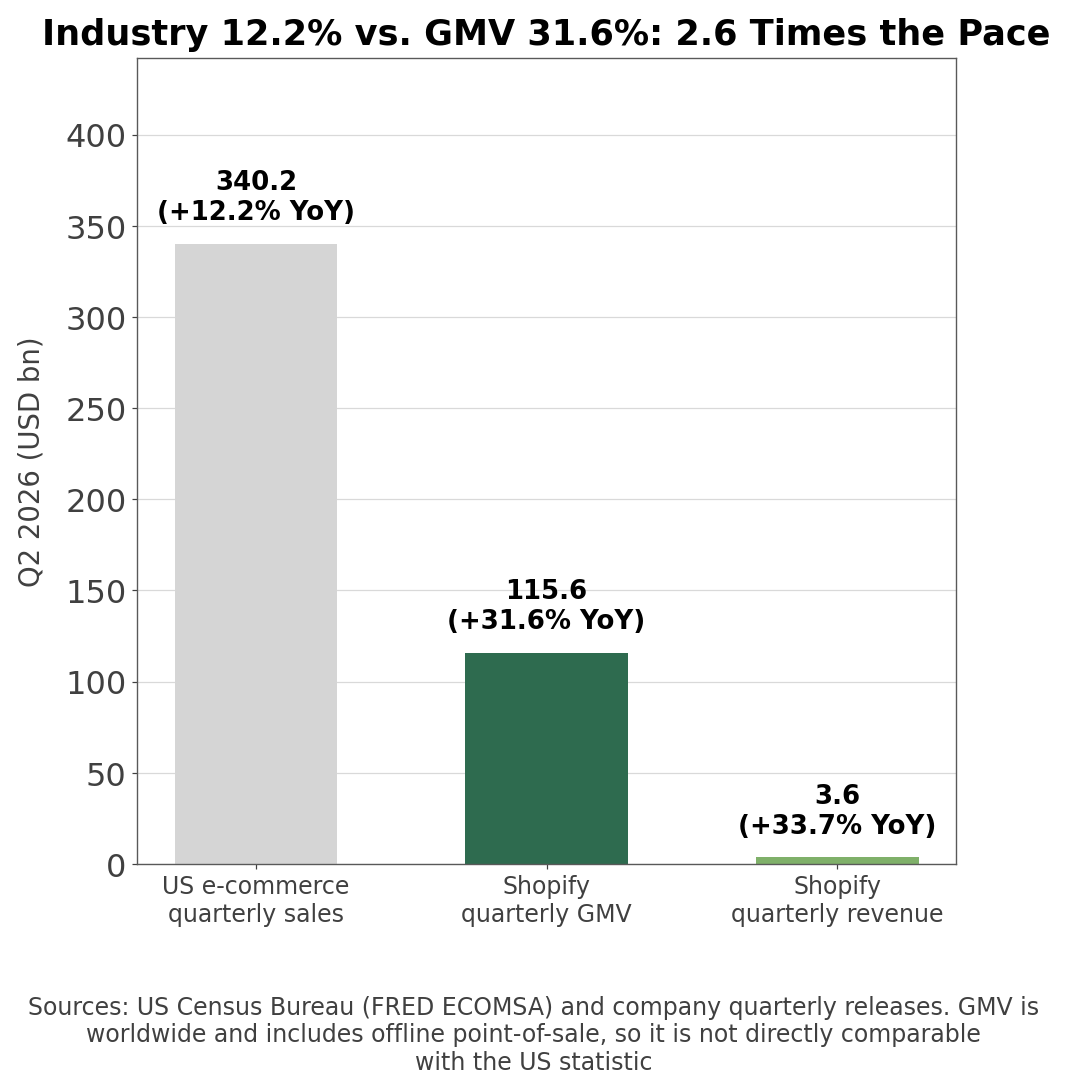
Shopify GMV against quarterly US e-commerce sales
The industry grew 12.2% while Shopify's GMV grew 31.6%, roughly 2.6 times the pace. More of that came from taking share than from the market expanding, and that is what currently supports the multiple.
Management makes the same argument with a different number, telling investors on the call that Shopify accounts for more than 14% of US e-commerce and citing a research firm's estimate that Shopify merchants captured close to half of every incremental US e-commerce dollar since the start of 2025. A company with 14% of a market taking half the growth is a company still pulling share from the other 86%. Whether that holds is the load-bearing assumption under the valuation below.
Is Shopify Stock Expensive? Two Bands, One Missing
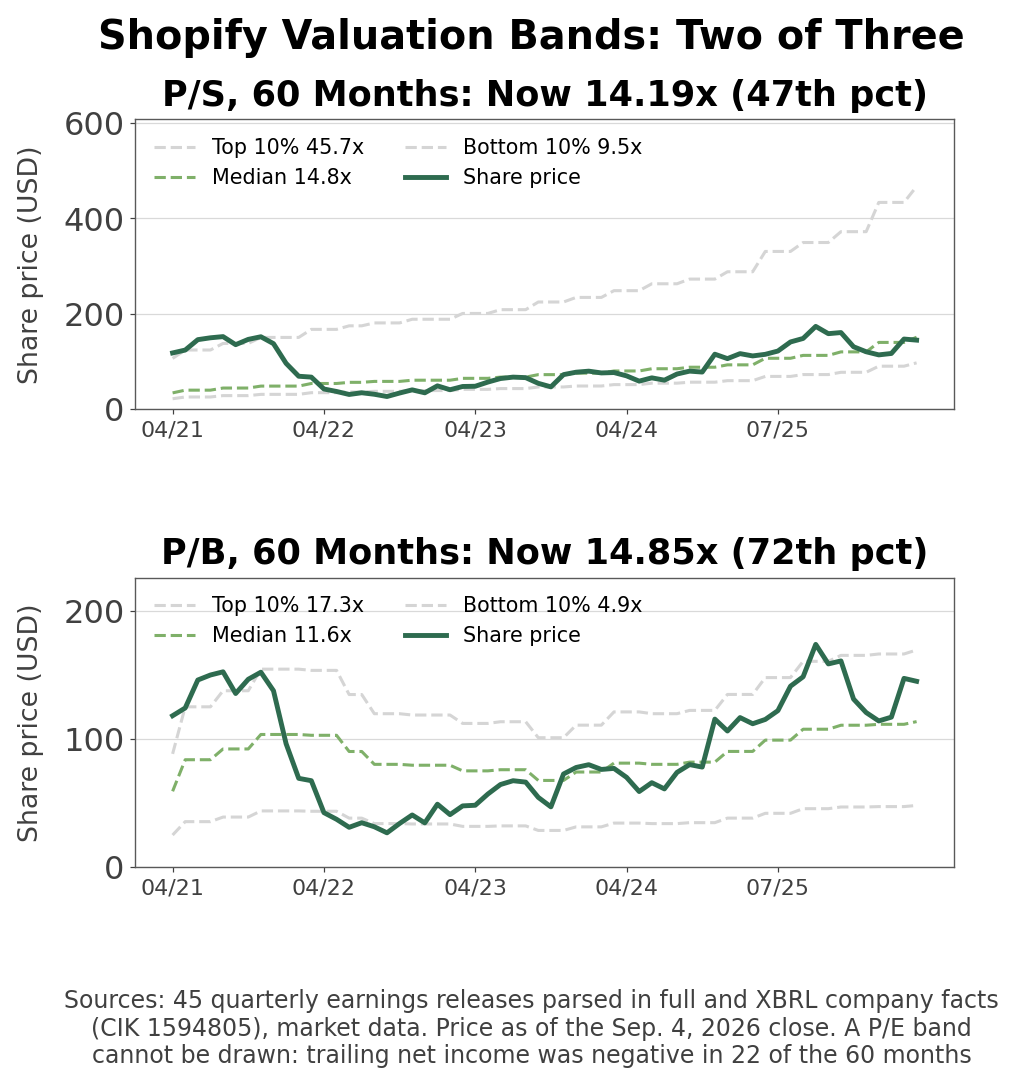
Own calculation (60 month-end closes, TTM denominators): I built month-end market capitalization from April 2021 through September 2026 and measured the multiples. The price-to-earnings ratio cannot be computed in 22 of those 60 months, because trailing net income was negative from August 2022 through August 2024.
P/S and P/B over 60 months; the P/E band has a two-year hole in it
What put those months underwater was, again, equity marks. Holdings were written down hard through 2022 and dragged trailing net income below zero with them. For more than a third of the last five years the market had no P/E to look at, and the reason had nothing to do with how much merchants were selling.
The two bands that do stand: price-to-sales is 14.19x, the 47th percentile of its own five-year range and just under the 14.79x median. Price-to-book is 14.85x, the 72nd percentile, above its 11.63x median.
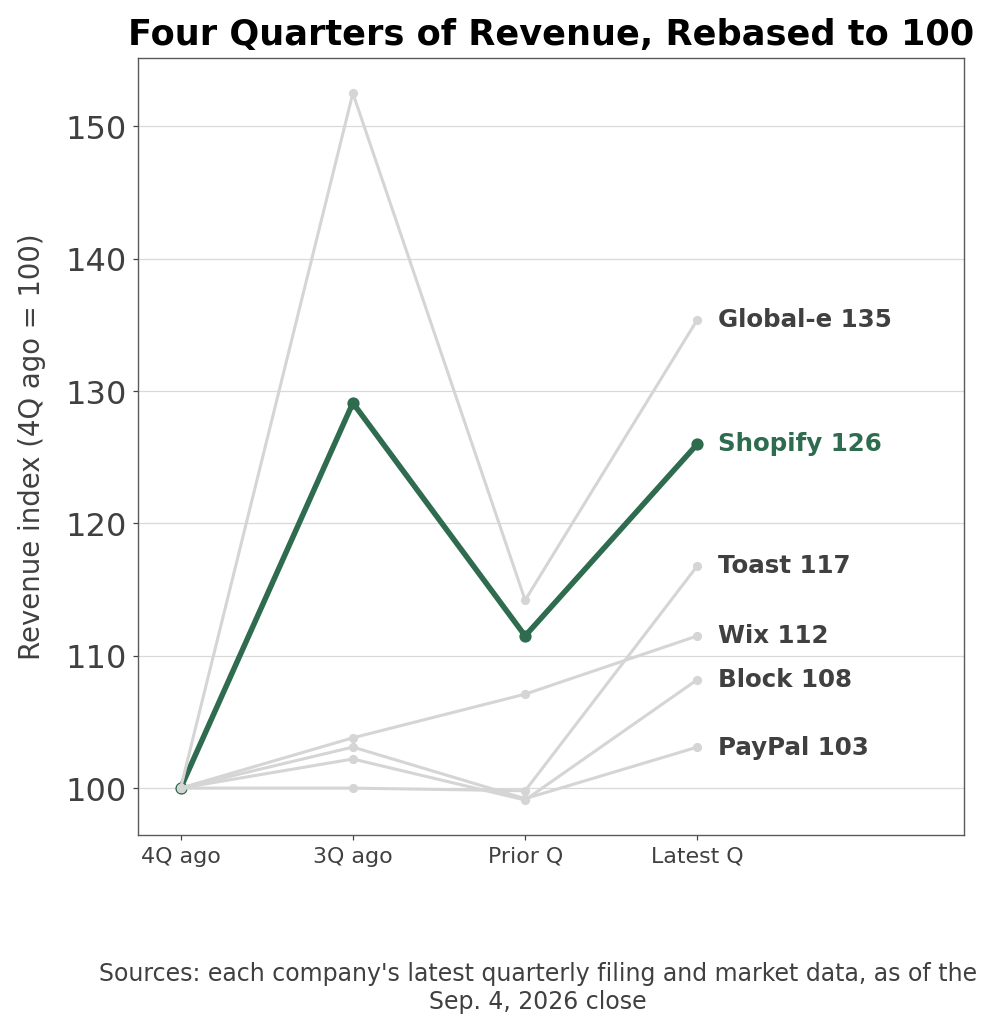
Six peers, revenue rebased to 100 four quarters ago
Company (Ticker)
Revenue growth
P/S
P/E
Net margin
Shopify (SHOP)
+33.7%
14.07x
97.93x
41.9%
Shopify, excluding equity marks
+33.7%
14.07x
-
12.3%
Global-e (GLBE)
+39.1%
5.81x
44.48x
16.0%
Toast (TOST)
+23.1%
2.88x
43.27x
8.1%
PayPal (PYPL)
+4.8%
1.38x
10.36x
12.7%
Block (XYZ)
+9.3%
2.00x
140.68x
1.3%
Wix (WIX)
+14.9%
1.49x
-
-13.6%
At 14.07x sales Shopify is the most expensive of the six, and the second-fastest grower behind Global-e. The column to sit with is the last one. A 41.9% net margin leads the group by a distance, but take out the marks the company itself asks you to remove and it becomes 12.3%, below PayPal's 12.7%. The ordering of two businesses growing seven times apart reverses right there.
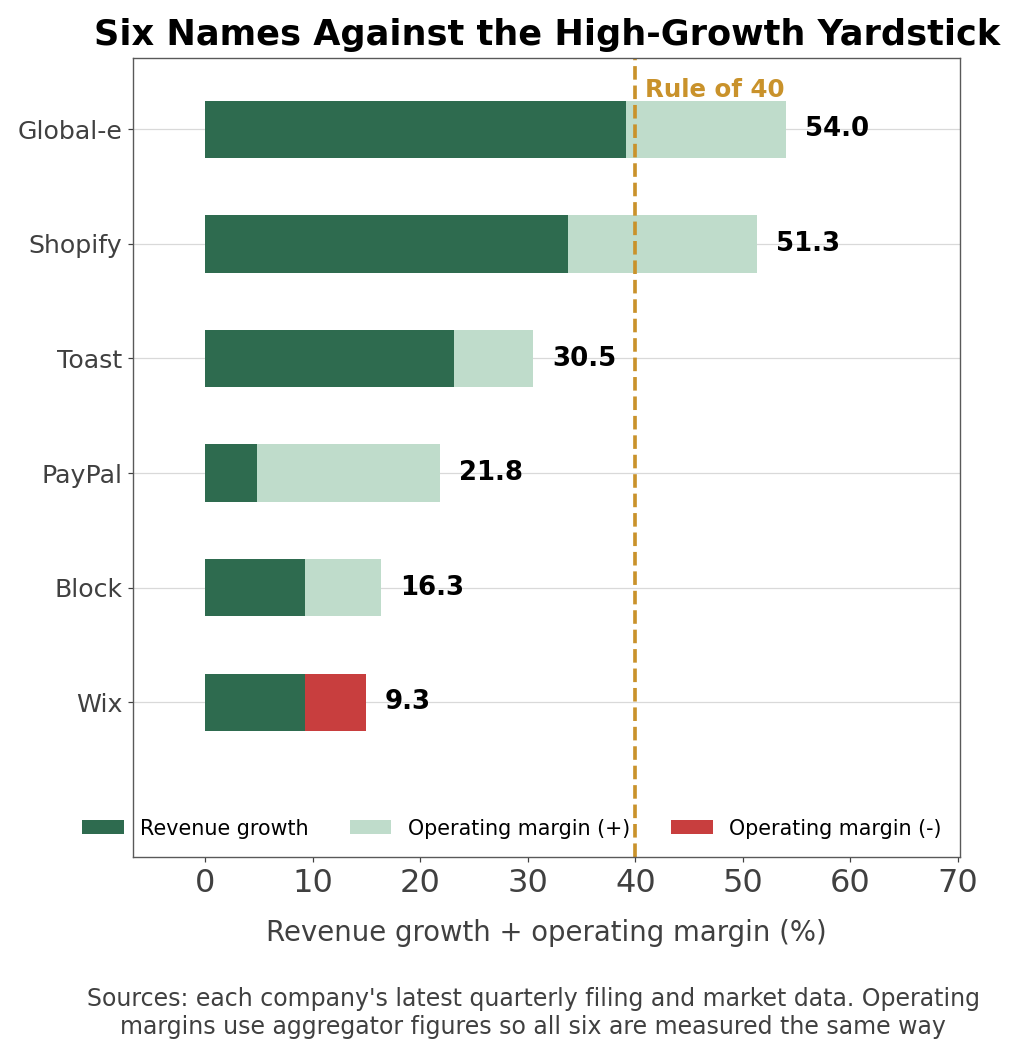
Revenue growth plus operating margin, the high-growth yardstick
Company (Ticker)
Revenue growth
Operating margin
Rule of 40
Above 40
Global-e (GLBE)
39.1%
14.9%
54.0
Yes
Shopify (SHOP)
33.7%
17.6%
51.3
Yes
Toast (TOST)
23.1%
7.4%
30.5
No
PayPal (PYPL)
4.8%
17.0%
21.8
No
Block (XYZ)
9.3%
7.0%
16.3
No
Wix (WIX)
14.9%
-5.6%
9.3
No
Operating margins here use aggregator figures so all six are measured the same way. Substituting Shopify's own 13.6% brings its total to 47.3 and changes no rankings. Either way only two of the six clear 40, and the market prices those two 2.4x apart on sales.
SHOP Price Targets and Analyst Revisions
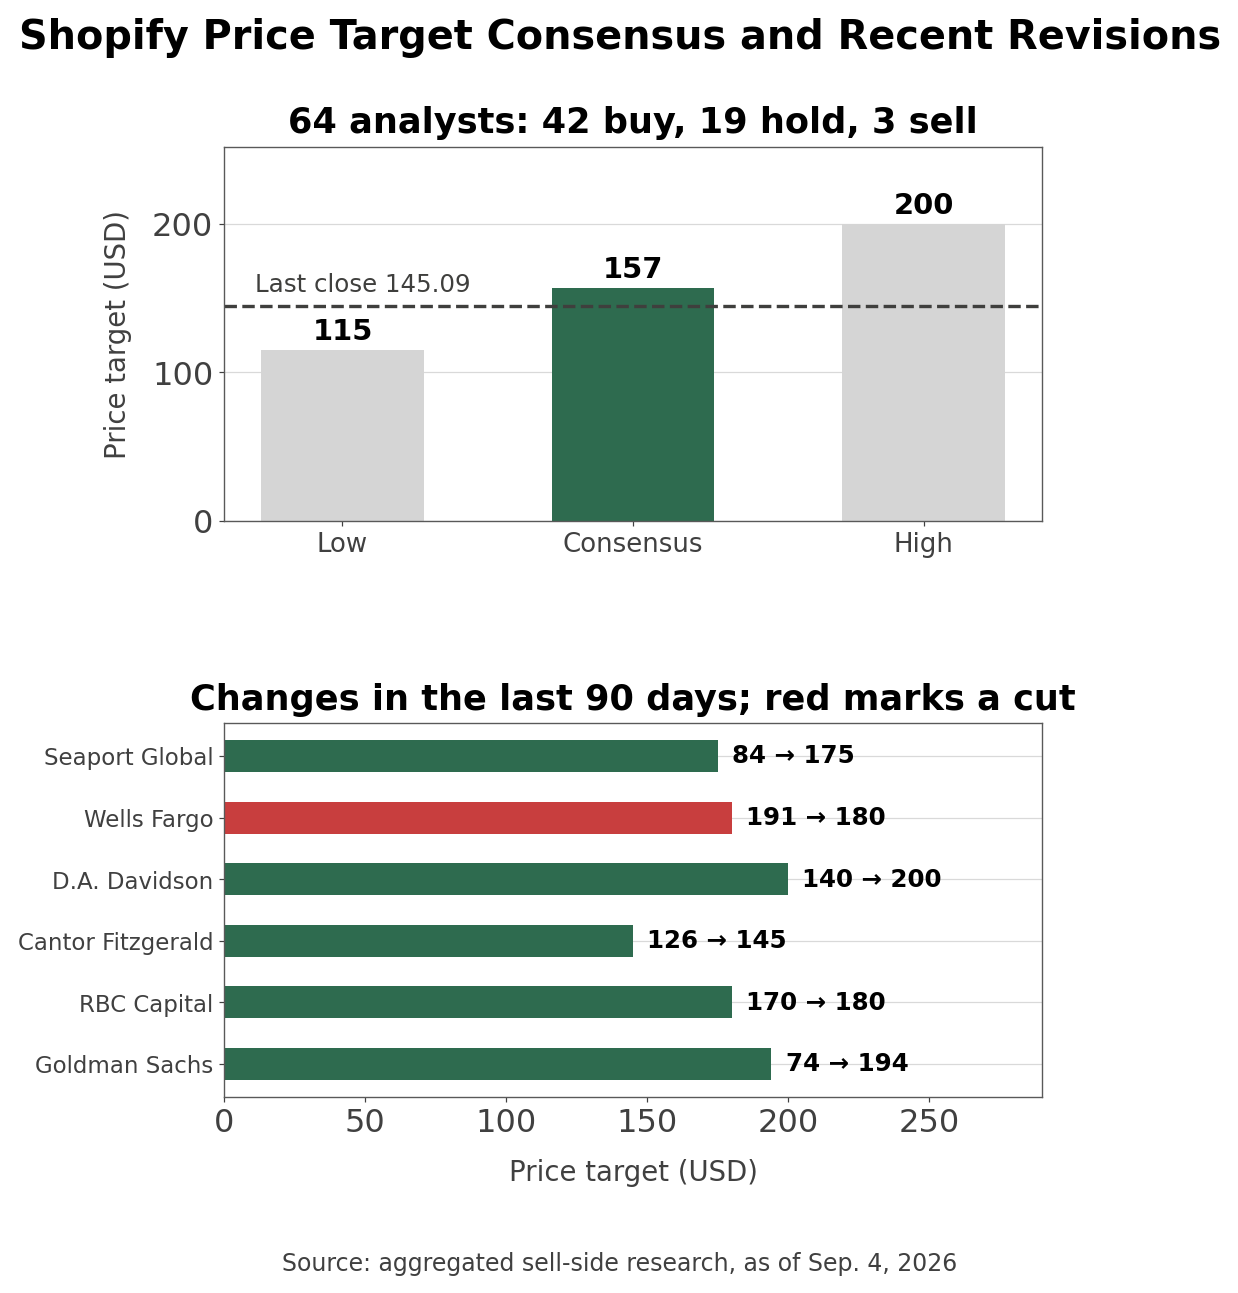
Aggregator cross-check (aggregated sell-side research, as of Sep. 4, 2026): 64 analysts cover the stock, with 42 buy, 19 hold, and 3 sell ratings. The twelve-month consensus price target is $157, or 8.1% above the $145.09 close, with a low of $115 and a high of $200.
Target distribution and the revisions of the last 90 days
There were no rating upgrades in the last 90 days: 15 reiterations and 12 target changes.
Firm
Rating
Target
Seaport Global
Buy
84 → 175
Wells Fargo
Overweight
191 → 180
D.A. Davidson
—
140 → 200
Cantor Fitzgerald
Neutral
126 → 145
RBC Capital
—
170 → 180
UBS
Neutral
130 → 145
Goldman Sachs
Buy
74 → 194
The bunching on August 6 follows the results published the previous afternoon. Two of those firms carried targets of 84 and 74 into the print, which had gone stale rather than bearish, so reading their percentage moves as conviction would overstate things. The $157 consensus and the $115 to $200 spread describe the range better.
Estimates moved up as well. Aggregated sell-side estimates for 2026 earnings per share went from $1.84 ninety days ago to $1.91, and 2027 from $2.33 to $2.45, with 27 upward revisions against 6 downward in the last 30 days. Those estimates are struck on an adjusted basis that excludes equity marks, which is to say the sell side uses the company's measure. The 97.93x P/E on your screen uses the GAAP one. That is why the forward multiple prints at 69.35x.
Bull and Bear Conditions for SHOP Stock
Scenario
Condition
Indicator to check
When · Source
Bull
GMV growth holds in the 30s
Quarterly GMV, year over year
Q3 2026 release
Bull
Free cash flow margin stays at 18% or better
Free cash flow ÷ revenue
Q3 2026 release
Bull
Adjusted net margin holds above 12%
Last line of the reconciliation table
Q3 2026 release
Bear
A drawdown in holdings pushes reported income negative again
Equity marks line
Every quarter
Bear
Transaction and loan losses grow faster than revenue
Losses ÷ revenue, now 3.9%
Q3 2026 release
Bear
P/S returns toward the top of its five-year band
Percentile of the 60-month band
Month-end
Guidance for Q3 2026 is revenue growth in the low thirties, gross profit growth in the mid-to-high twenties, operating expenses at 33% to 34% of revenue, and a free cash flow margin in the high teens to low twenties. The company gave no absolute forecast for any earnings line.
Questions This Analysis Does Not Answer
Which holdings are in the equity portfolio? The balance sheet carries $4,854 million of equity and other investments plus a $559 million equity-method investment, but quarterly disclosure does not break out positions. Which share prices the marks are attached to is not knowable from these filings.
What are the margins inside merchant solutions? Payments, lending, and shipping are not disclosed separately, so the decline in gross margin from 48.6% to 47.7% cannot be attributed to a specific line.
What is the return on the AI spending? Shopify promotes its merchant AI tools and agentic checkout protocol but does not disclose the spend or the revenue attached to them. What is visible stops at R&D of $445 million, or 12.4% of revenue.
Every figure here comes from Shopify's own filings with the US Securities and Exchange Commission. I downloaded all 194 Form 6-K and Form 8-K filings the company has made since 2015, extracted the 45 quarterly earnings releases among them, and parsed the income statements and balance sheets into a continuous series with no missing quarters. Shopify filed as a Canadian foreign private issuer through 2024, so the pre-2025 quarters exist only in those 6-K exhibits and not in the quarterly XBRL data. Where the two overlap, the release figures matched XBRL company facts in all 14 comparable quarters. Multiples were built from month-end closing prices multiplied by diluted share counts, adjusted for the 10-for-1 stock split of June 2022, and the current values agree with aggregator figures within 0.9% on market capitalization, 0.9% on price-to-sales, and 0.7% on price-to-book. Industry figures come from the US Census Bureau via FRED (series ECOMSA and ECOMPCTSA). Analyst counts, price targets, and estimate revisions are aggregated sell-side research as of Sep. 4, 2026. Prices are the Sep. 4, 2026 close, the last completed session before publication. This is research, not investment advice.