- Qualcomm (NASDAQ: QCOM) posted $9.95 billion in fiscal third-quarter revenue, down 4.0% from a year earlier, while five semiconductor peers all grew at double-digit rates. This QCOM stock analysis works through the segment data behind that gap: the handset decline, the automotive and IoT revenue that replaced part of it, the margin the company gave up in the process, two offsetting tax items that distort the reported P/E, and where the shares sit against their own price-to-sales history.
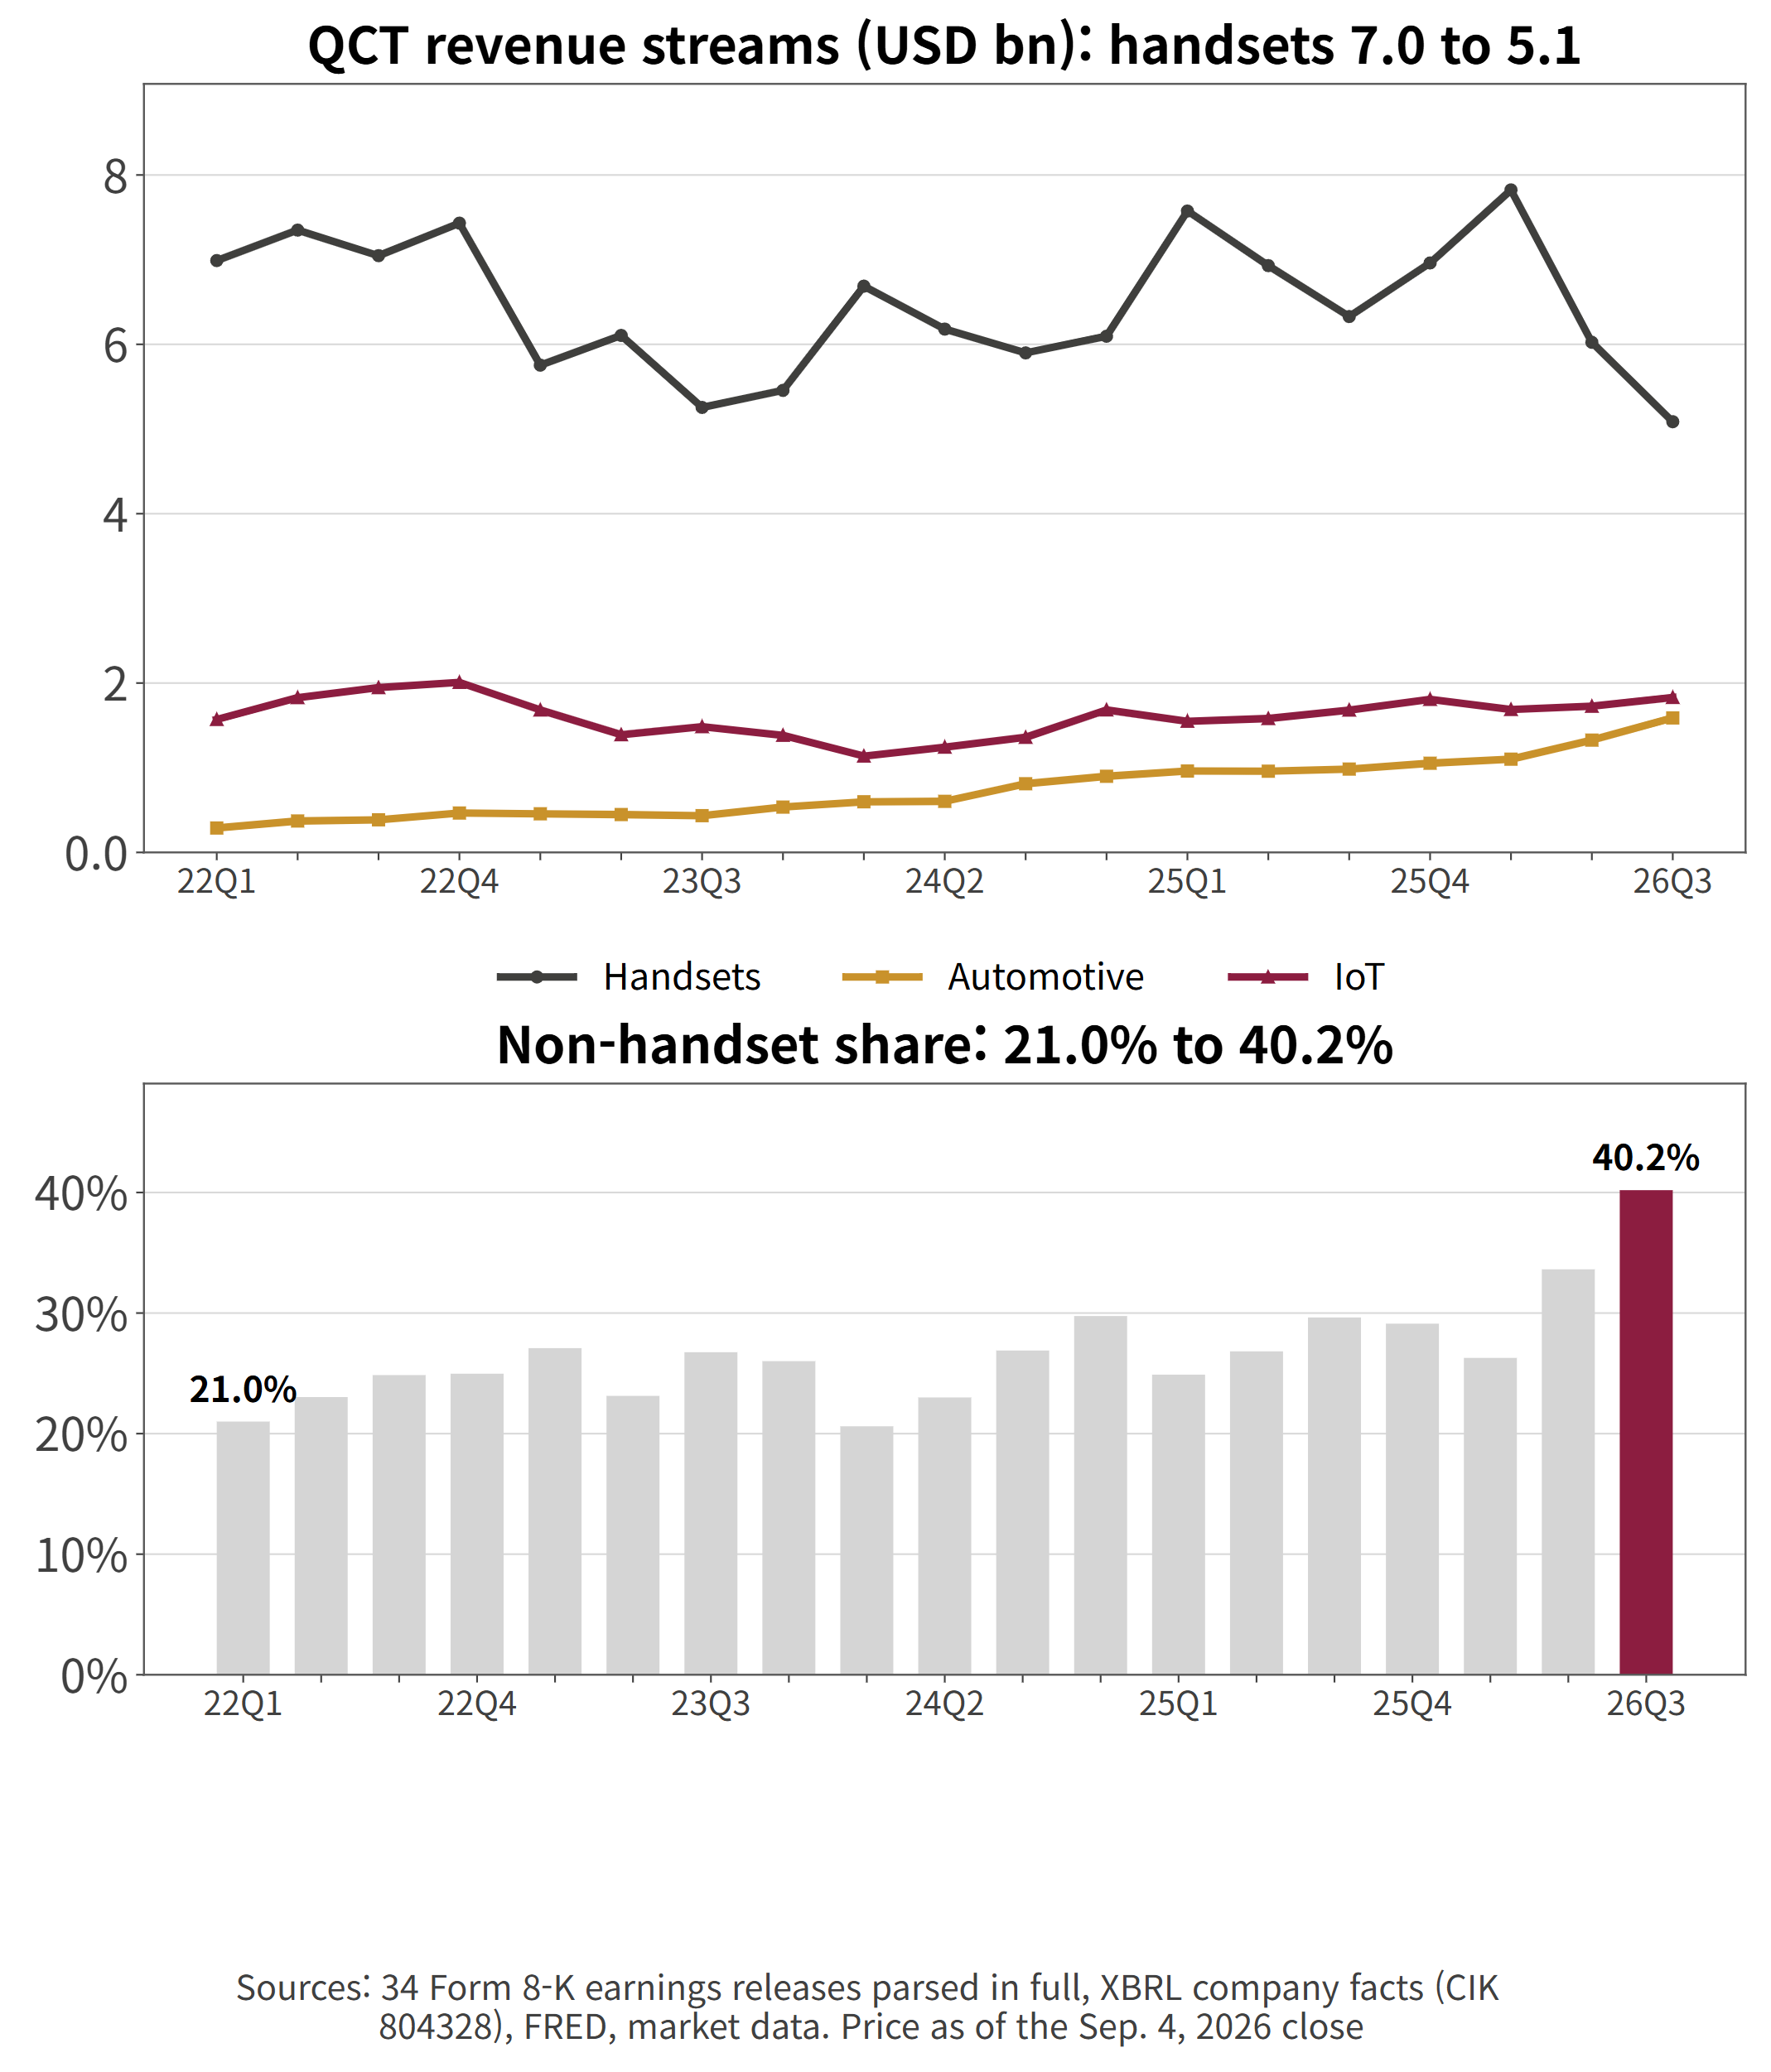
- The transition Qualcomm sells is real. Non-handset revenue inside QCT has gone from 21.0% of the segment to 40.2%. The problem is what happened to margin in the same stretch. QCT earnings before taxes fell from 35.2% of segment revenue to 25.8%, and operating income in the June quarter dropped 41.1% against a 4.0% revenue decline.
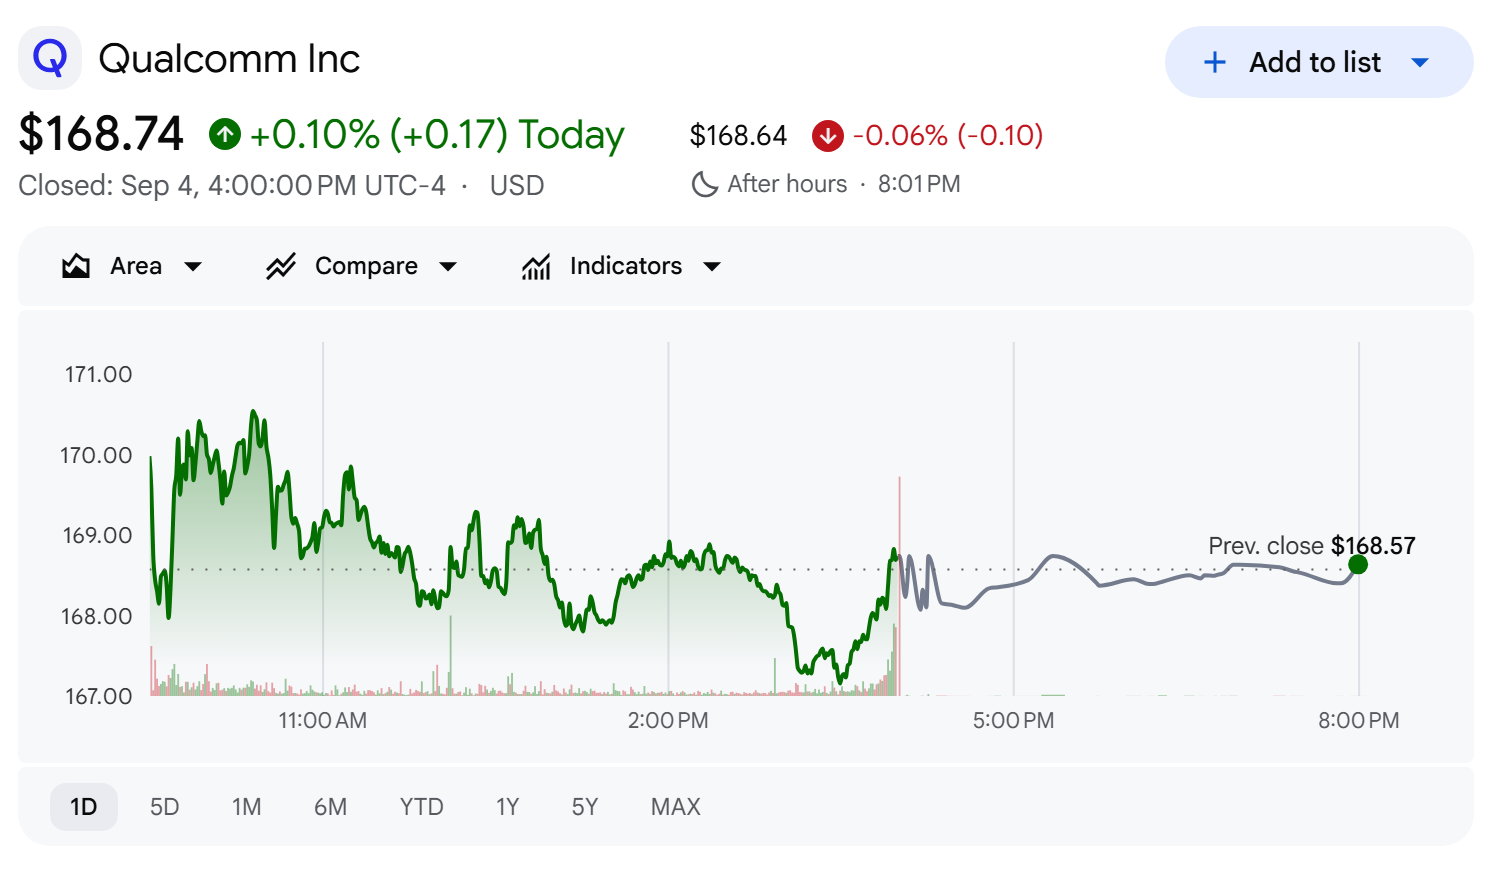
- Market capitalization stands at $180.4 billion. The stock trades at 19.4x trailing GAAP earnings, 6.45x book and 4.09x sales, based on the September 4, 2026 close of $168.74.
61% of the Revenue Came Back, With a Thinner Margin
- The segment table from the July 29 release is the place to start.
| QCT revenue stream | Q3 FY2026 | Q3 FY2025 | Change |
| Handsets | $5,086M | $6,328M | -20% |
| Automotive | $1,588M | $984M | +61% |
| IoT | $1,830M | $1,681M | +9% |
| Total QCT | $8,504M | $8,993M | -5% |
- Company disclosure (Q3 FY2026 earnings release, July 29 2026): Handsets lost $1,242 million. Automotive and IoT together added $753 million. The net decline was $489 million, so roughly 61% of the hole was filled.
- Management led the release with the replacement, not the hole: "Combined QCT Automotive and IoT Revenues Grew 28% Year-Over-Year" and "QCT Automotive Revenues: 23 Consecutive Quarters of Double-Digit Year-Over-Year Growth" both appear above the fold.
- What the headline leaves out is the margin on the revenue doing the replacing. QCT earnings before taxes came in at 26% of segment revenue against 30% a year earlier. Revenue fell 5%; segment profit fell 18%.
Where Did QCT's Margin Go?
- Plotting the margin by quarter shows this is a trend, not a stumble.
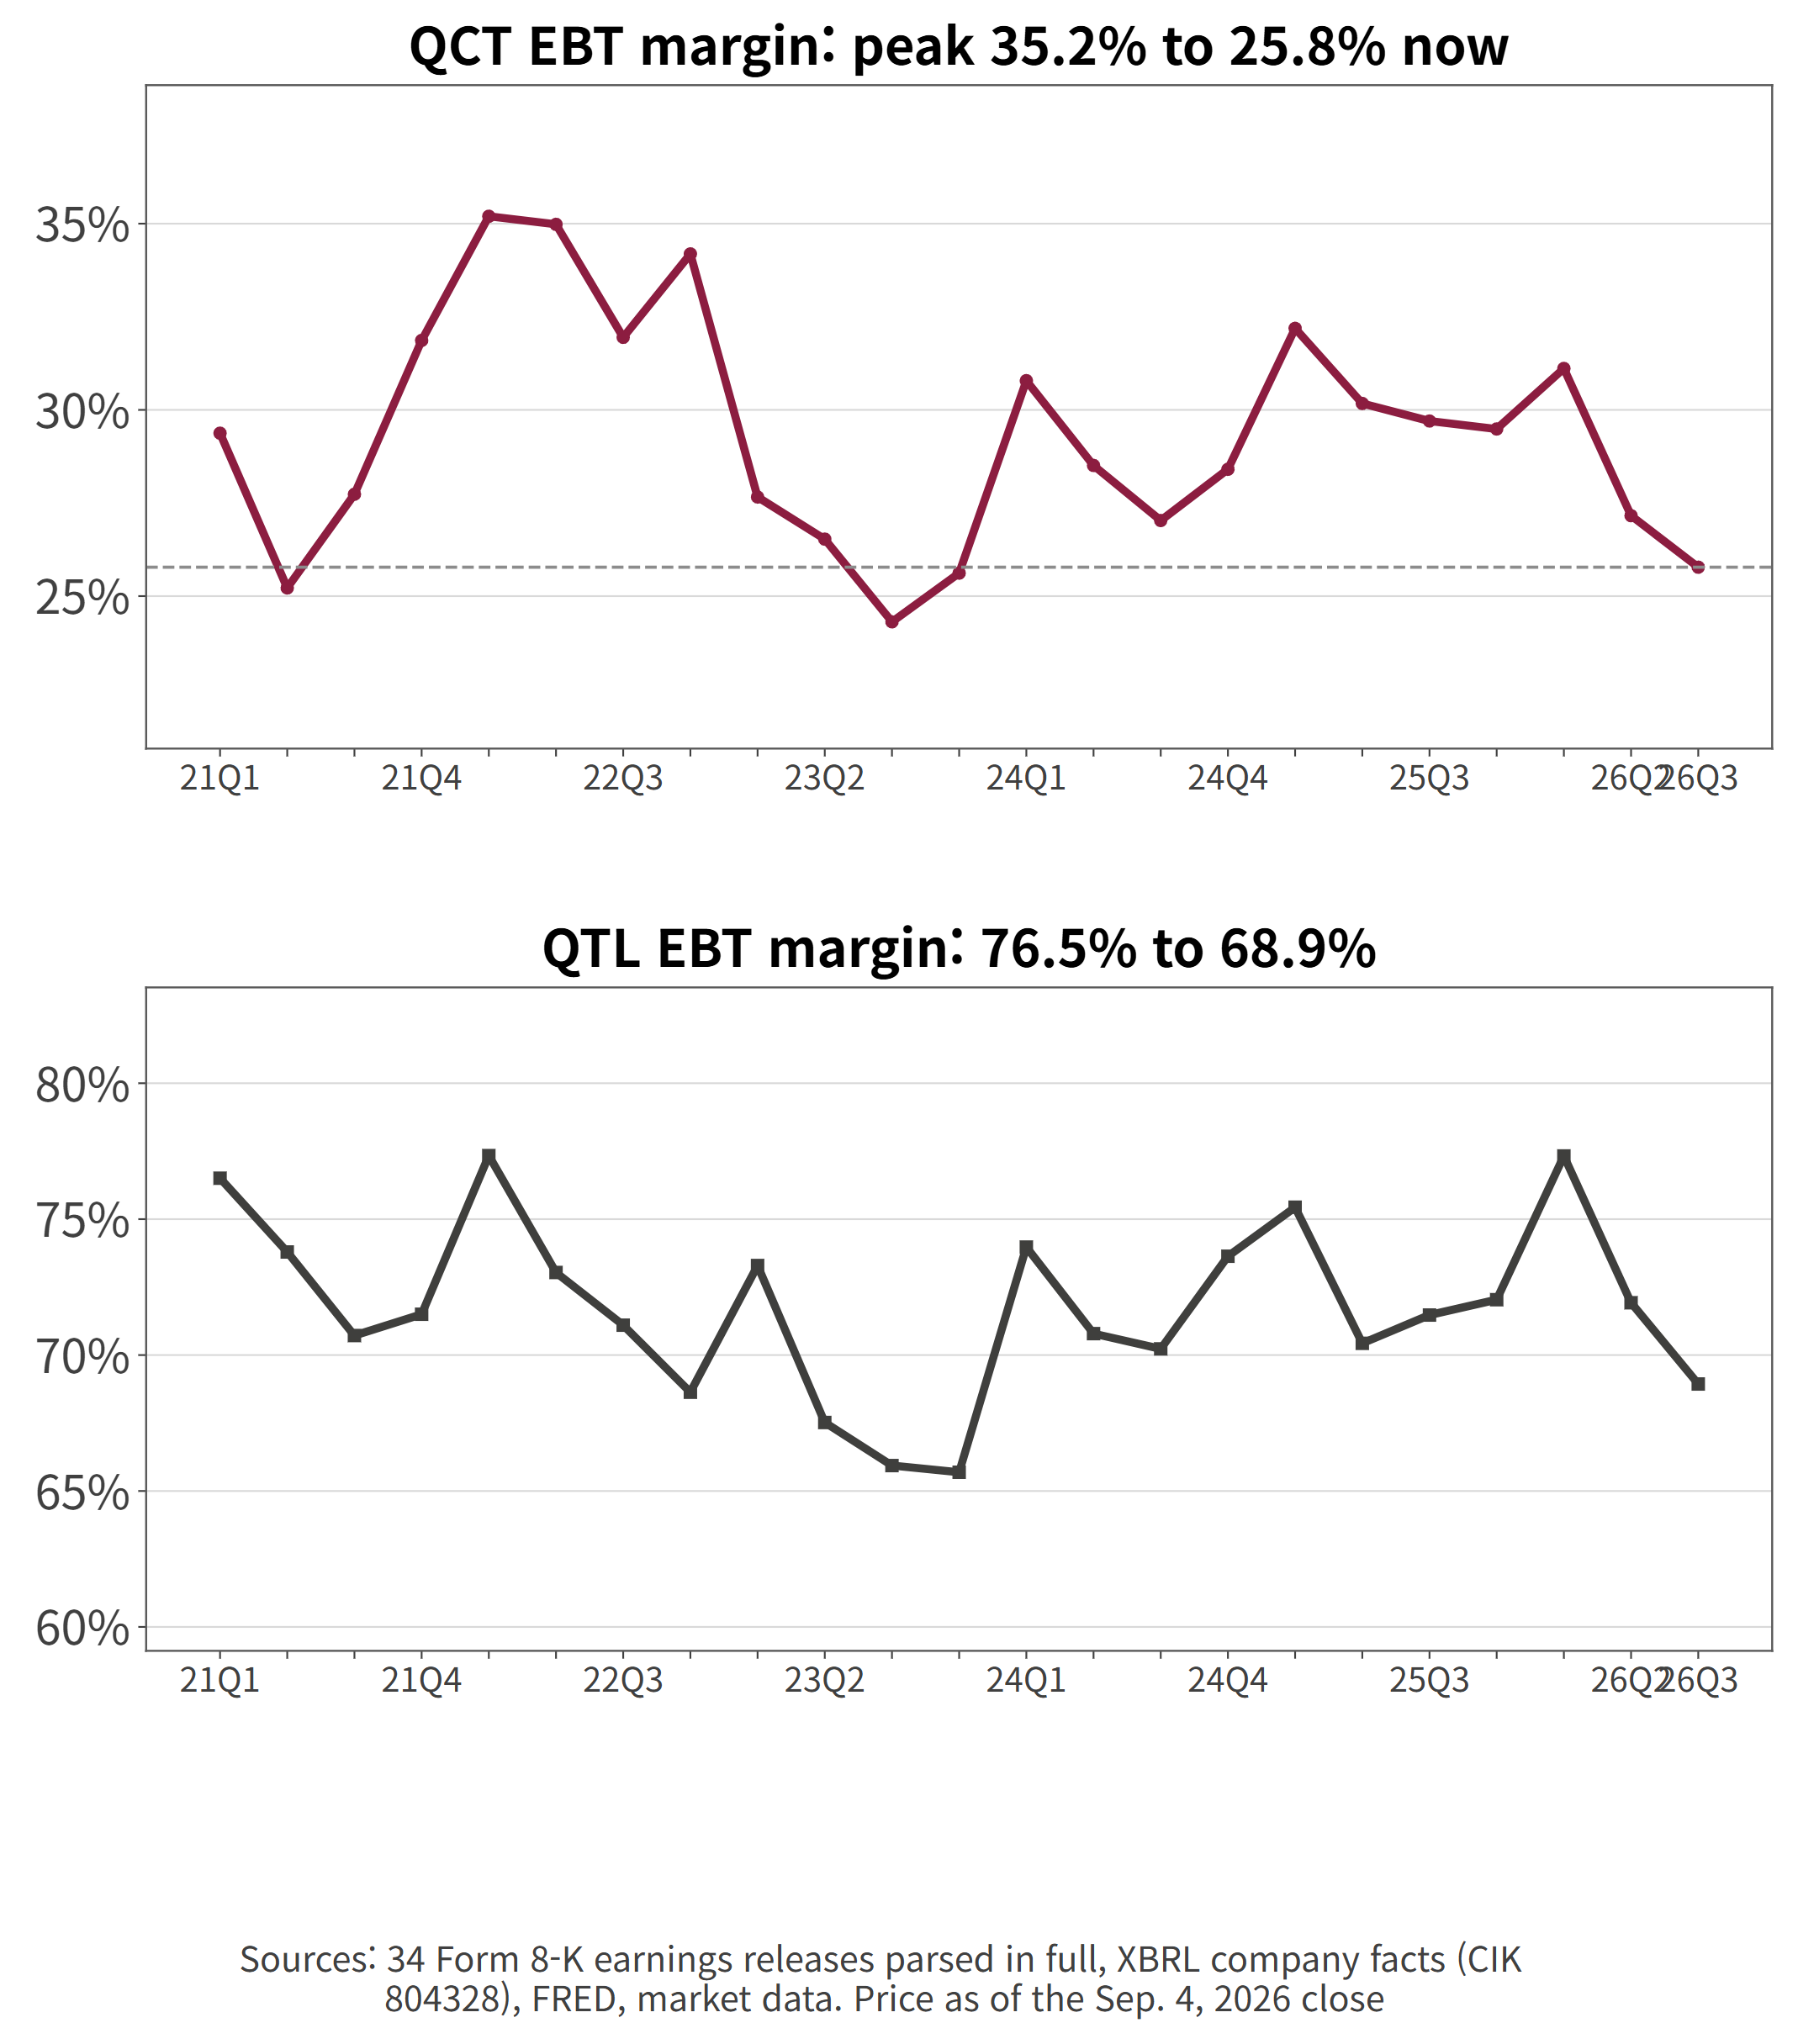
- QCT's pre-tax margin peaked at 35.2% in the first quarter of fiscal 2022. The 25.8% posted in June is the lowest since fiscal 2023's third quarter, when it hit 24.3%. QTL, the licensing segment, has slid too, from 76.5% to 68.9%.
- The company named the cause directly.
- > "The semiconductor industry is experiencing a broad-based increase in input costs, across wafer fabrication, assembly, test, advanced packaging, memory and other materials. We are taking concrete actions to reflect the higher input costs in our product pricing and expect these actions to benefit our gross margins over time as the pricing changes gradually come into effect."
- Filing footnote (8-K business outlook, July 29 2026): Costs rose, price increases are being pushed through, and the benefit arrives on a lag. Chief Executive Cristiano Amon used the phrase "challenging memory and supply environment" in the same document.
- One more line deserves attention. Operating income was $1,626 million while earnings before taxes came to $2,462 million. The bridge between them is investment and other income of $1,014 million, roughly three times the $358 million booked a year earlier.
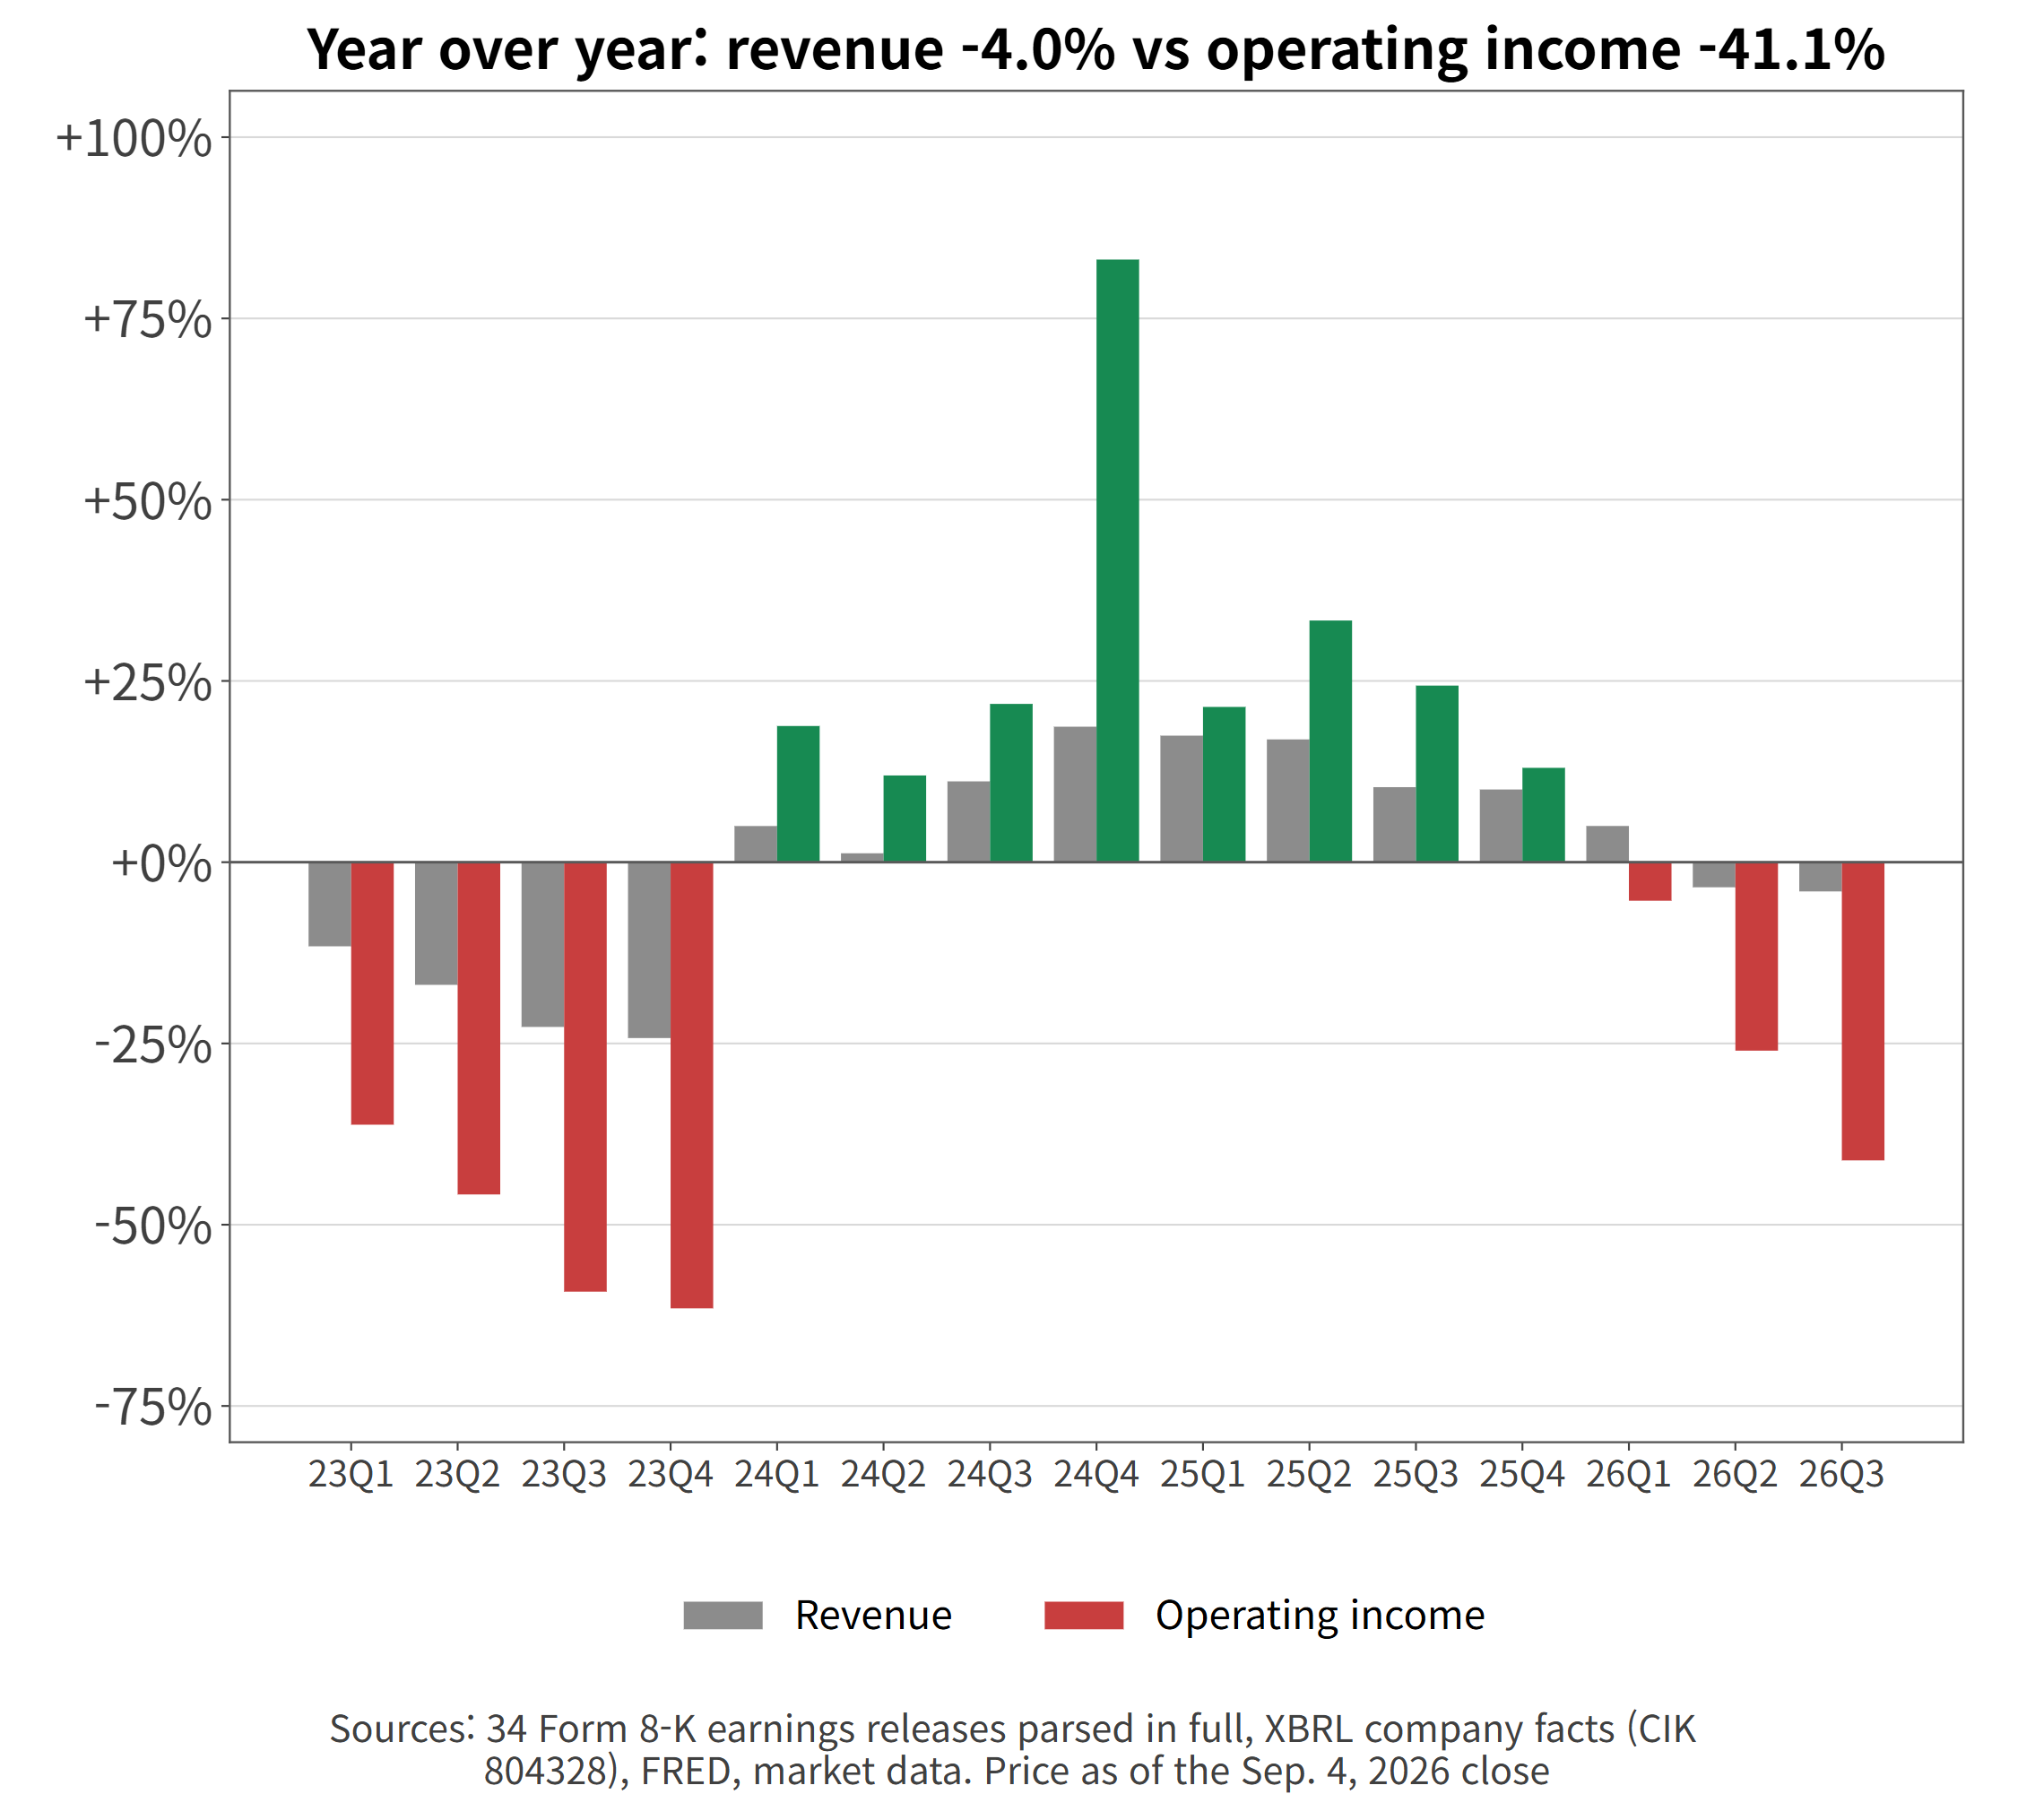
- That is why a 41% drop in operating income became a 17% drop in pre-tax earnings. The $656 million of extra non-operating income did the cushioning, and cushions of that size do not arrive every quarter.
Why the Handset Decline Looks Smaller Than It Is
- Building a clean handset series requires one correction that is easy to miss.
- Filing footnote (8-K earnings release, footnote 2, February 2 2023): "Beginning the first quarter of fiscal 2023, QCT RFFE (radio frequency front-end) revenues, which were previously presented as a separate revenue stream, are now included within our Handsets, Automotive and IoT revenue streams."
- The restatement is large. Handset revenue for the first quarter of fiscal 2022 was reported as $5,983 million at the time. A year later the same quarter appears as $6,989 million. The $1,006 million difference is reallocated RFFE.
- Own calculation (34 earnings releases, FQ3 2018–FQ3 2026): Splicing the old numbers to the new ones makes handsets look like they declined less than they did. The series in this analysis rebuilds 19 quarters on the current basis by reading the prior-year column of each release, and the identity check (handsets plus automotive plus IoT equals total QCT) held within $2 across all 23 tested rows.
- RFFE covers the components around a phone's antenna, a business understood to carry heavy exposure to one large customer. Qualcomm explained the change only as disaggregating "based on the industries and applications in which our products are sold." Nothing in the filings establishes intent. What is verifiable is that the size of RFFE stopped being visible from outside that quarter.
What Does Qualcomm (QCOM) Do?
- Qualcomm started in San Diego in 1985 as a communications research company. Commercializing CDMA gave it a large portfolio of cellular standard-essential patents, and it has run two businesses off that base ever since.
- QCT designs and sells chips. It brought in $8,504 million this quarter, 85% of company revenue, at a 25.8% pre-tax margin. Qualcomm is fabless, so wafers come from TSMC and Samsung Foundry, which is precisely why input-cost inflation lands on its margin rather than someone else's.
- The three streams inside QCT behave differently. Handsets covers Snapdragon mobile processors sold to Android makers such as Samsung, Xiaomi and Oppo. Automotive covers digital cockpit and driver-assistance chips, where design wins convert to revenue years later but stay for a long time once they do. IoT bundles PC processors, industrial modules, wearables and extended-reality devices.
- QTL licenses patents and collects royalties. It generated $1,278 million, 13% of revenue, at a 68.9% pre-tax margin. An eighth of revenue produces close to a third of profit. Royalties are calculated on handset selling prices, so unit volumes and average prices both matter, which is why the licensing disputes with Apple and Huawei were such consequential events in company history.
- The two segments also behave differently in accounting terms. QCT recognizes revenue on shipment and carries inventory and foundry commitments, so cost movements hit margin immediately. QTL recognizes royalties from reported sales with almost no attached cost, which is how it holds a margin near 70%. Company-level margin blends the two.
- The pace of the mix shift accelerated over the last three quarters. Non-handset share moved 26.3%, 33.6%, 40.2% while QCT margin moved 31.1%, 27.2%, 25.8%. Two lines heading in opposite directions.
- One caution belongs here. Mix is not the only thing changing in that window; the input-cost increase the company flagged overlaps it. The filings do not separate the two contributions, and that lack of separation is itself the open question on this stock.
A Peaking Chip Cycle That Skips Smartphones
- Industry data puts Qualcomm's position in sharper relief.
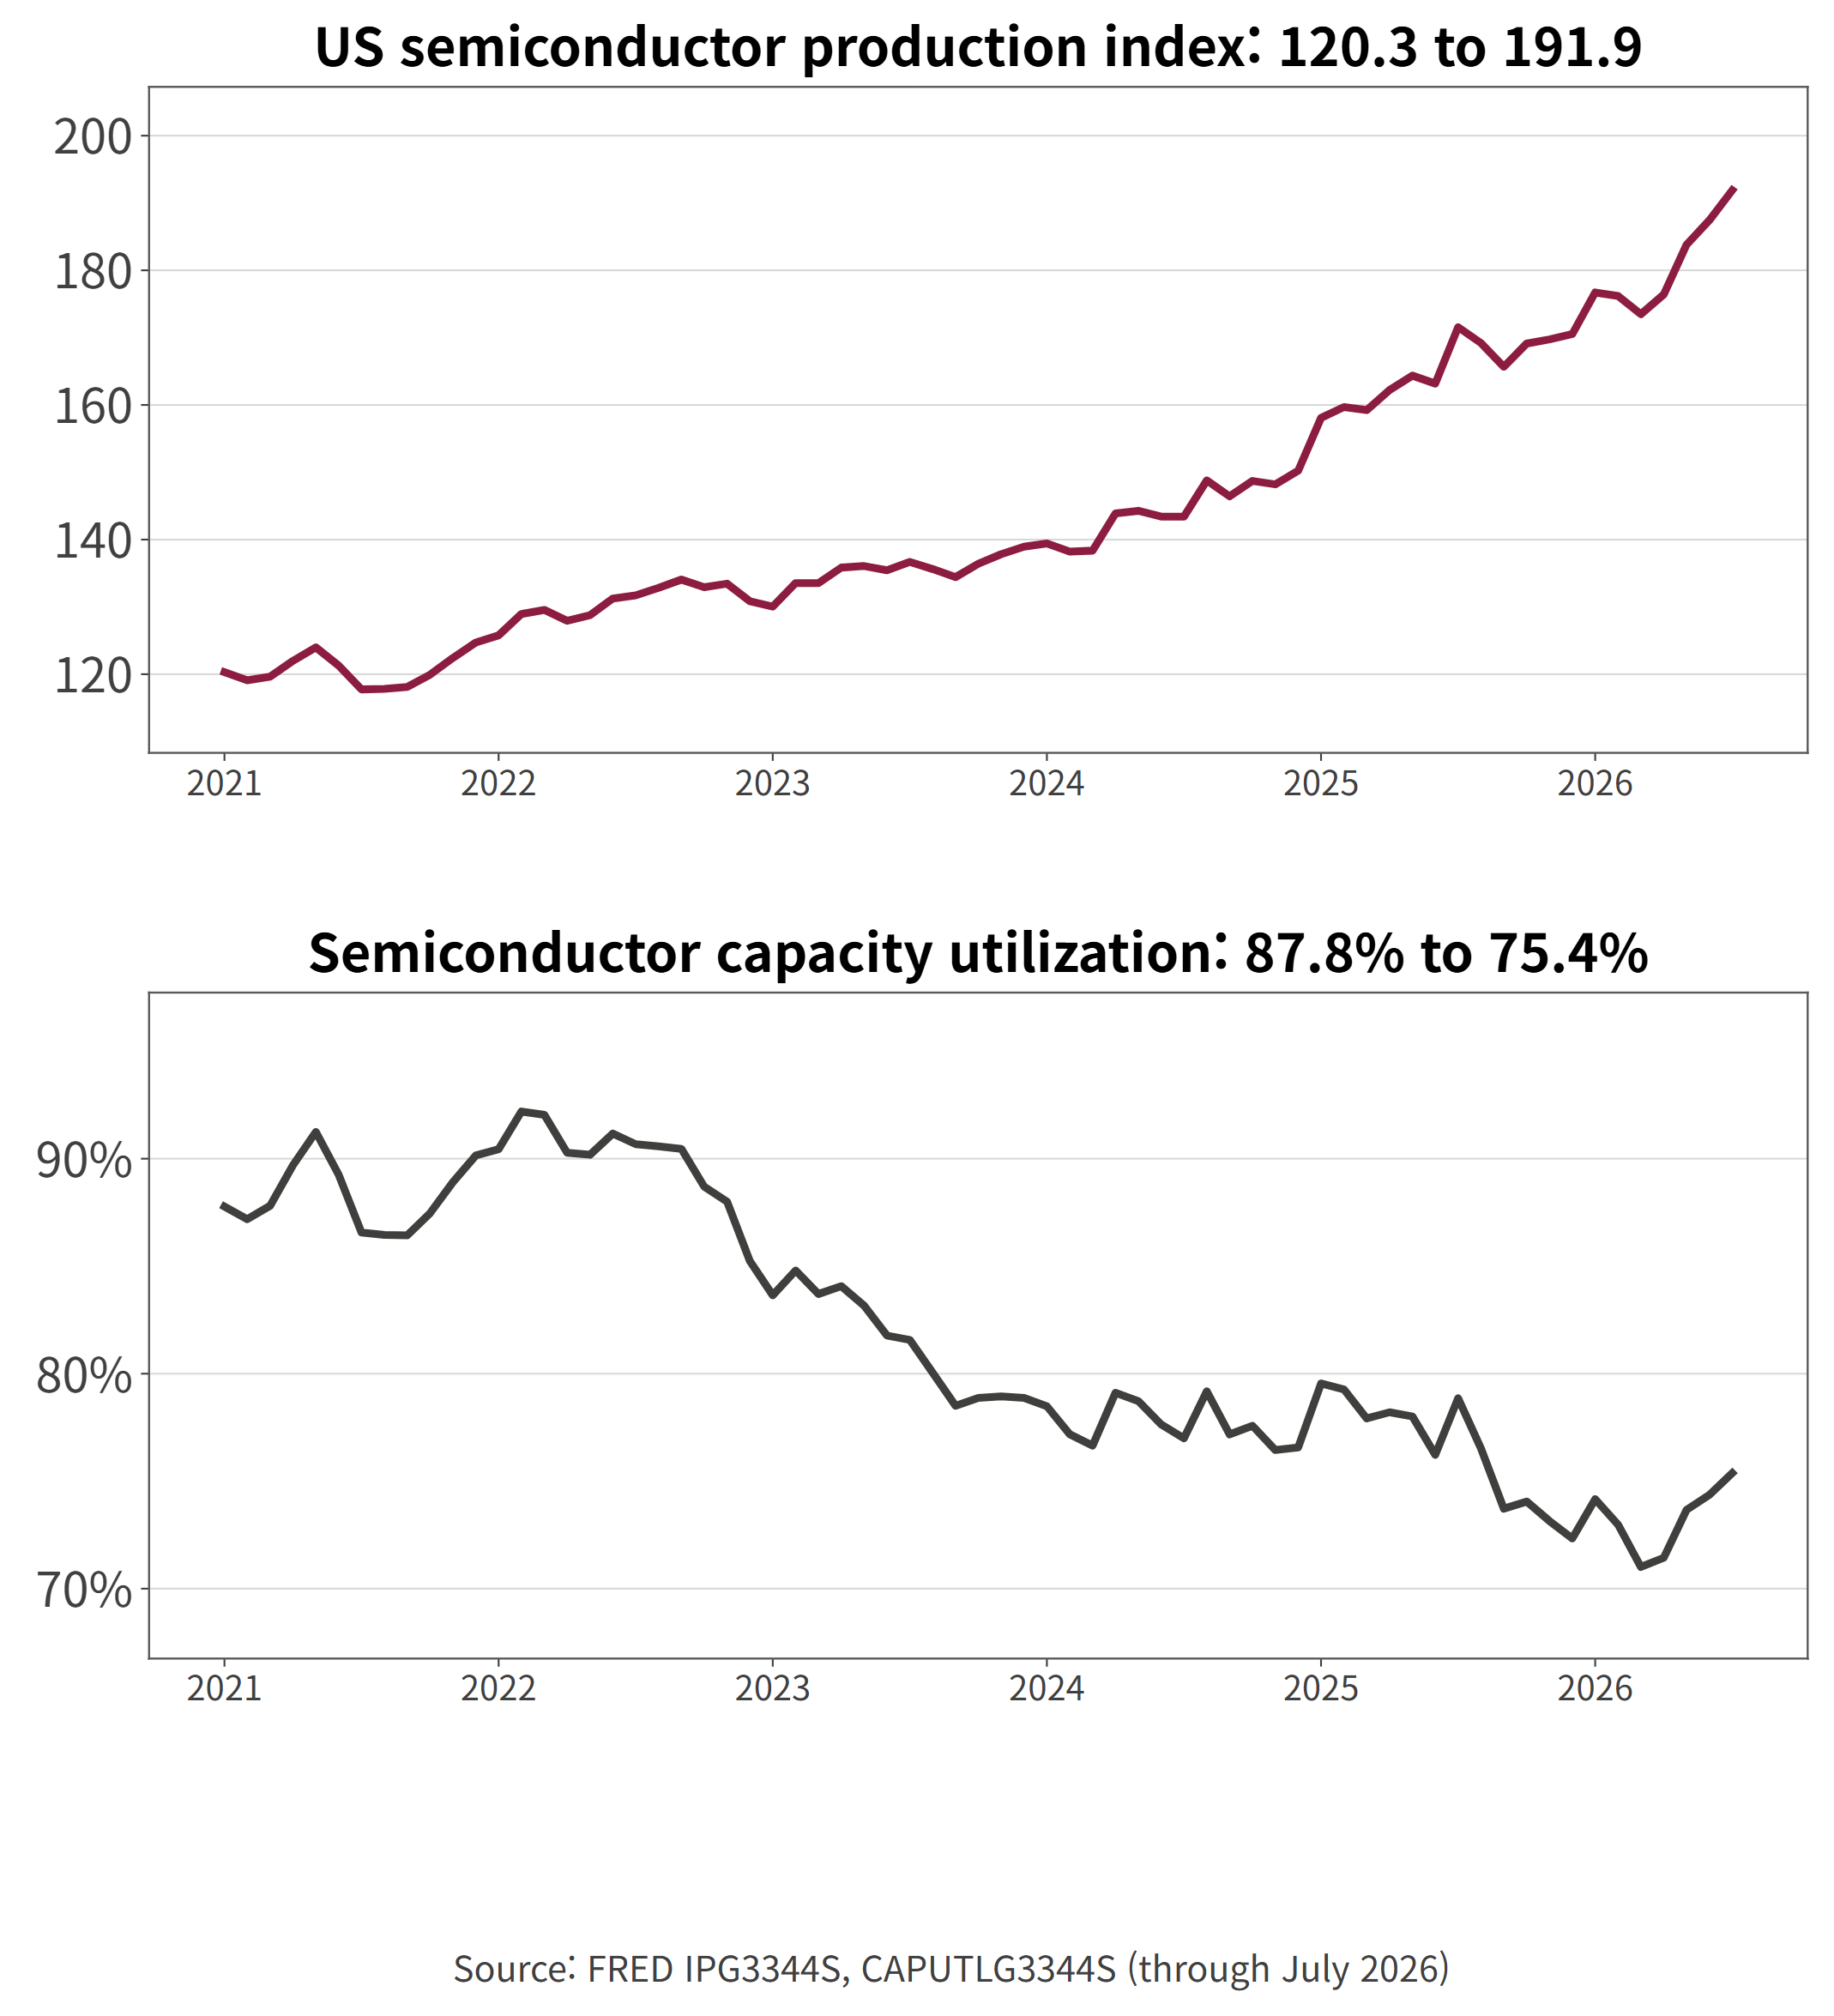
| Indicator | Jan 2019 | Jul 2026 | Note |
| US semiconductor production index | 100.9 | 191.9 | 1.9x in seven and a half years |
| Semiconductor capacity utilization | 74.5% | 75.4% | Capacity grew alongside output |
| Wireless equipment producer price index | 103.2 | 107.3 | +4.0% over the same span |
- Government statistics (FRED IPG3344S, CAPUTLG3344S, PCU334220334220, July 2026): Semiconductor output nearly doubled. Utilization sitting near 75% means capacity expanded about as fast as production did. The industry is running at the top of its cycle.
- Wireless communications equipment prices went up 4.0% across the same period. The last four monthly readings were 107.29, 107.30, 107.29 and 107.29.
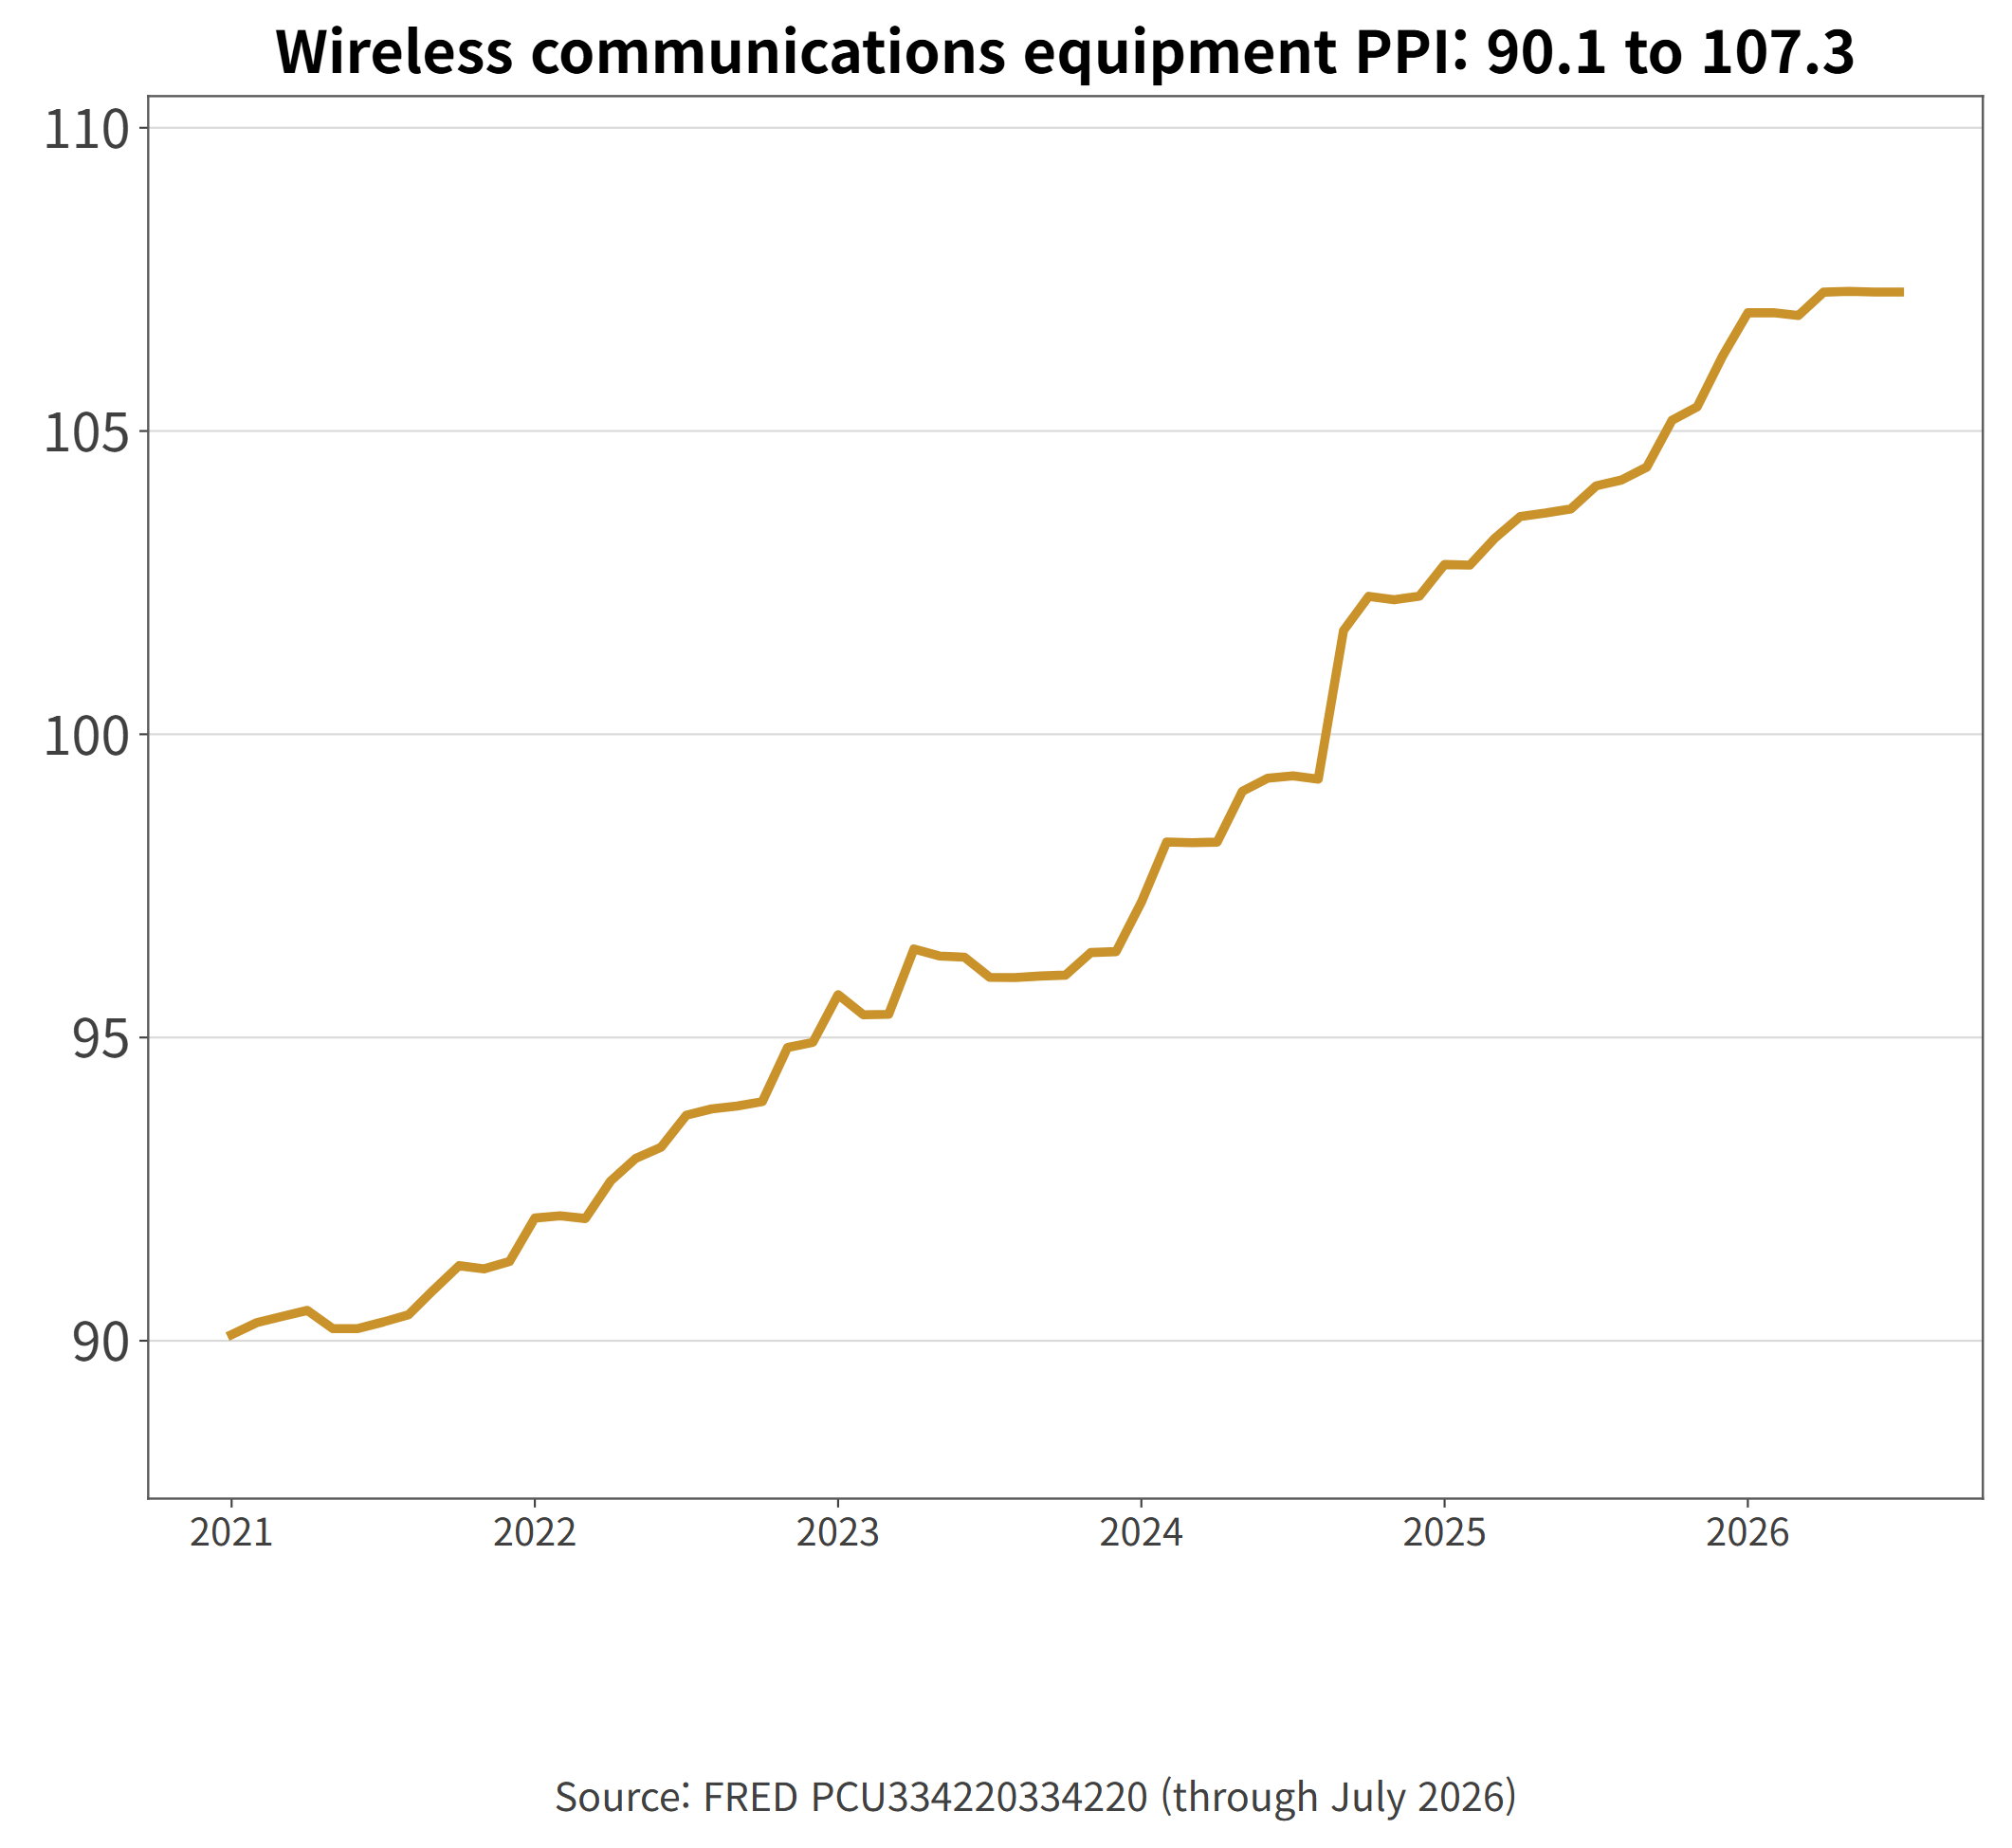
- A hot semiconductor industry and a hot Qualcomm are different propositions. Data center demand is what is driving the production index, and roughly 60% of Qualcomm revenue still attaches to smartphones, a market that has cycled around 1.2 billion units a year for most of a decade. When units stop growing, revenue growth has to come from higher prices per handset or more silicon per handset, and the price index above suggests limited room on the first.
- That is the case for automotive and PCs. Vehicle content per car is rising with electrification and driver assistance, which supports the 23-quarter growth streak the company advertises. Automotive programs also carry long qualification cycles and continuous price-down pressure, so they are structurally unlikely to earn smartphone-processor margins. The same logic sits behind management's repeated emphasis on data center.
- Competition is not moving in Qualcomm's favor either. MediaTek took the mid-range in mobile processors and has been working upward, and it recently paired with Nvidia to extend into data center and PC silicon. Chinese handset makers keep raising the share of in-house designs. Most consequentially, Apple's multi-year migration to its own modem is still under way, a transition Qualcomm has named as a risk factor in its annual reports and one that belongs in any reading of a 20% handset decline.
- Licensing faces a different pressure. QTL royalties rest on standard-essential patents, and every renewal reopens rates and caps. The Huawei agreement entering its renewal window and the segment's China exposure are recurring variables. When an eighth of revenue produces a third of profit, one negotiation can move the company margin.
- By size, mobile application processors have been roughly a $30 billion annual market for years, while automotive silicon is smaller but growing in content per unit. The $40 billion non-handset target Qualcomm set for fiscal 2029 is close to its entire current revenue base, which means hitting it amounts to building a second company in the new lane.
Six Chip Stocks Reported. Only Qualcomm Shrank
- Placed beside peers reporting the same quarter, the contrast is stark.
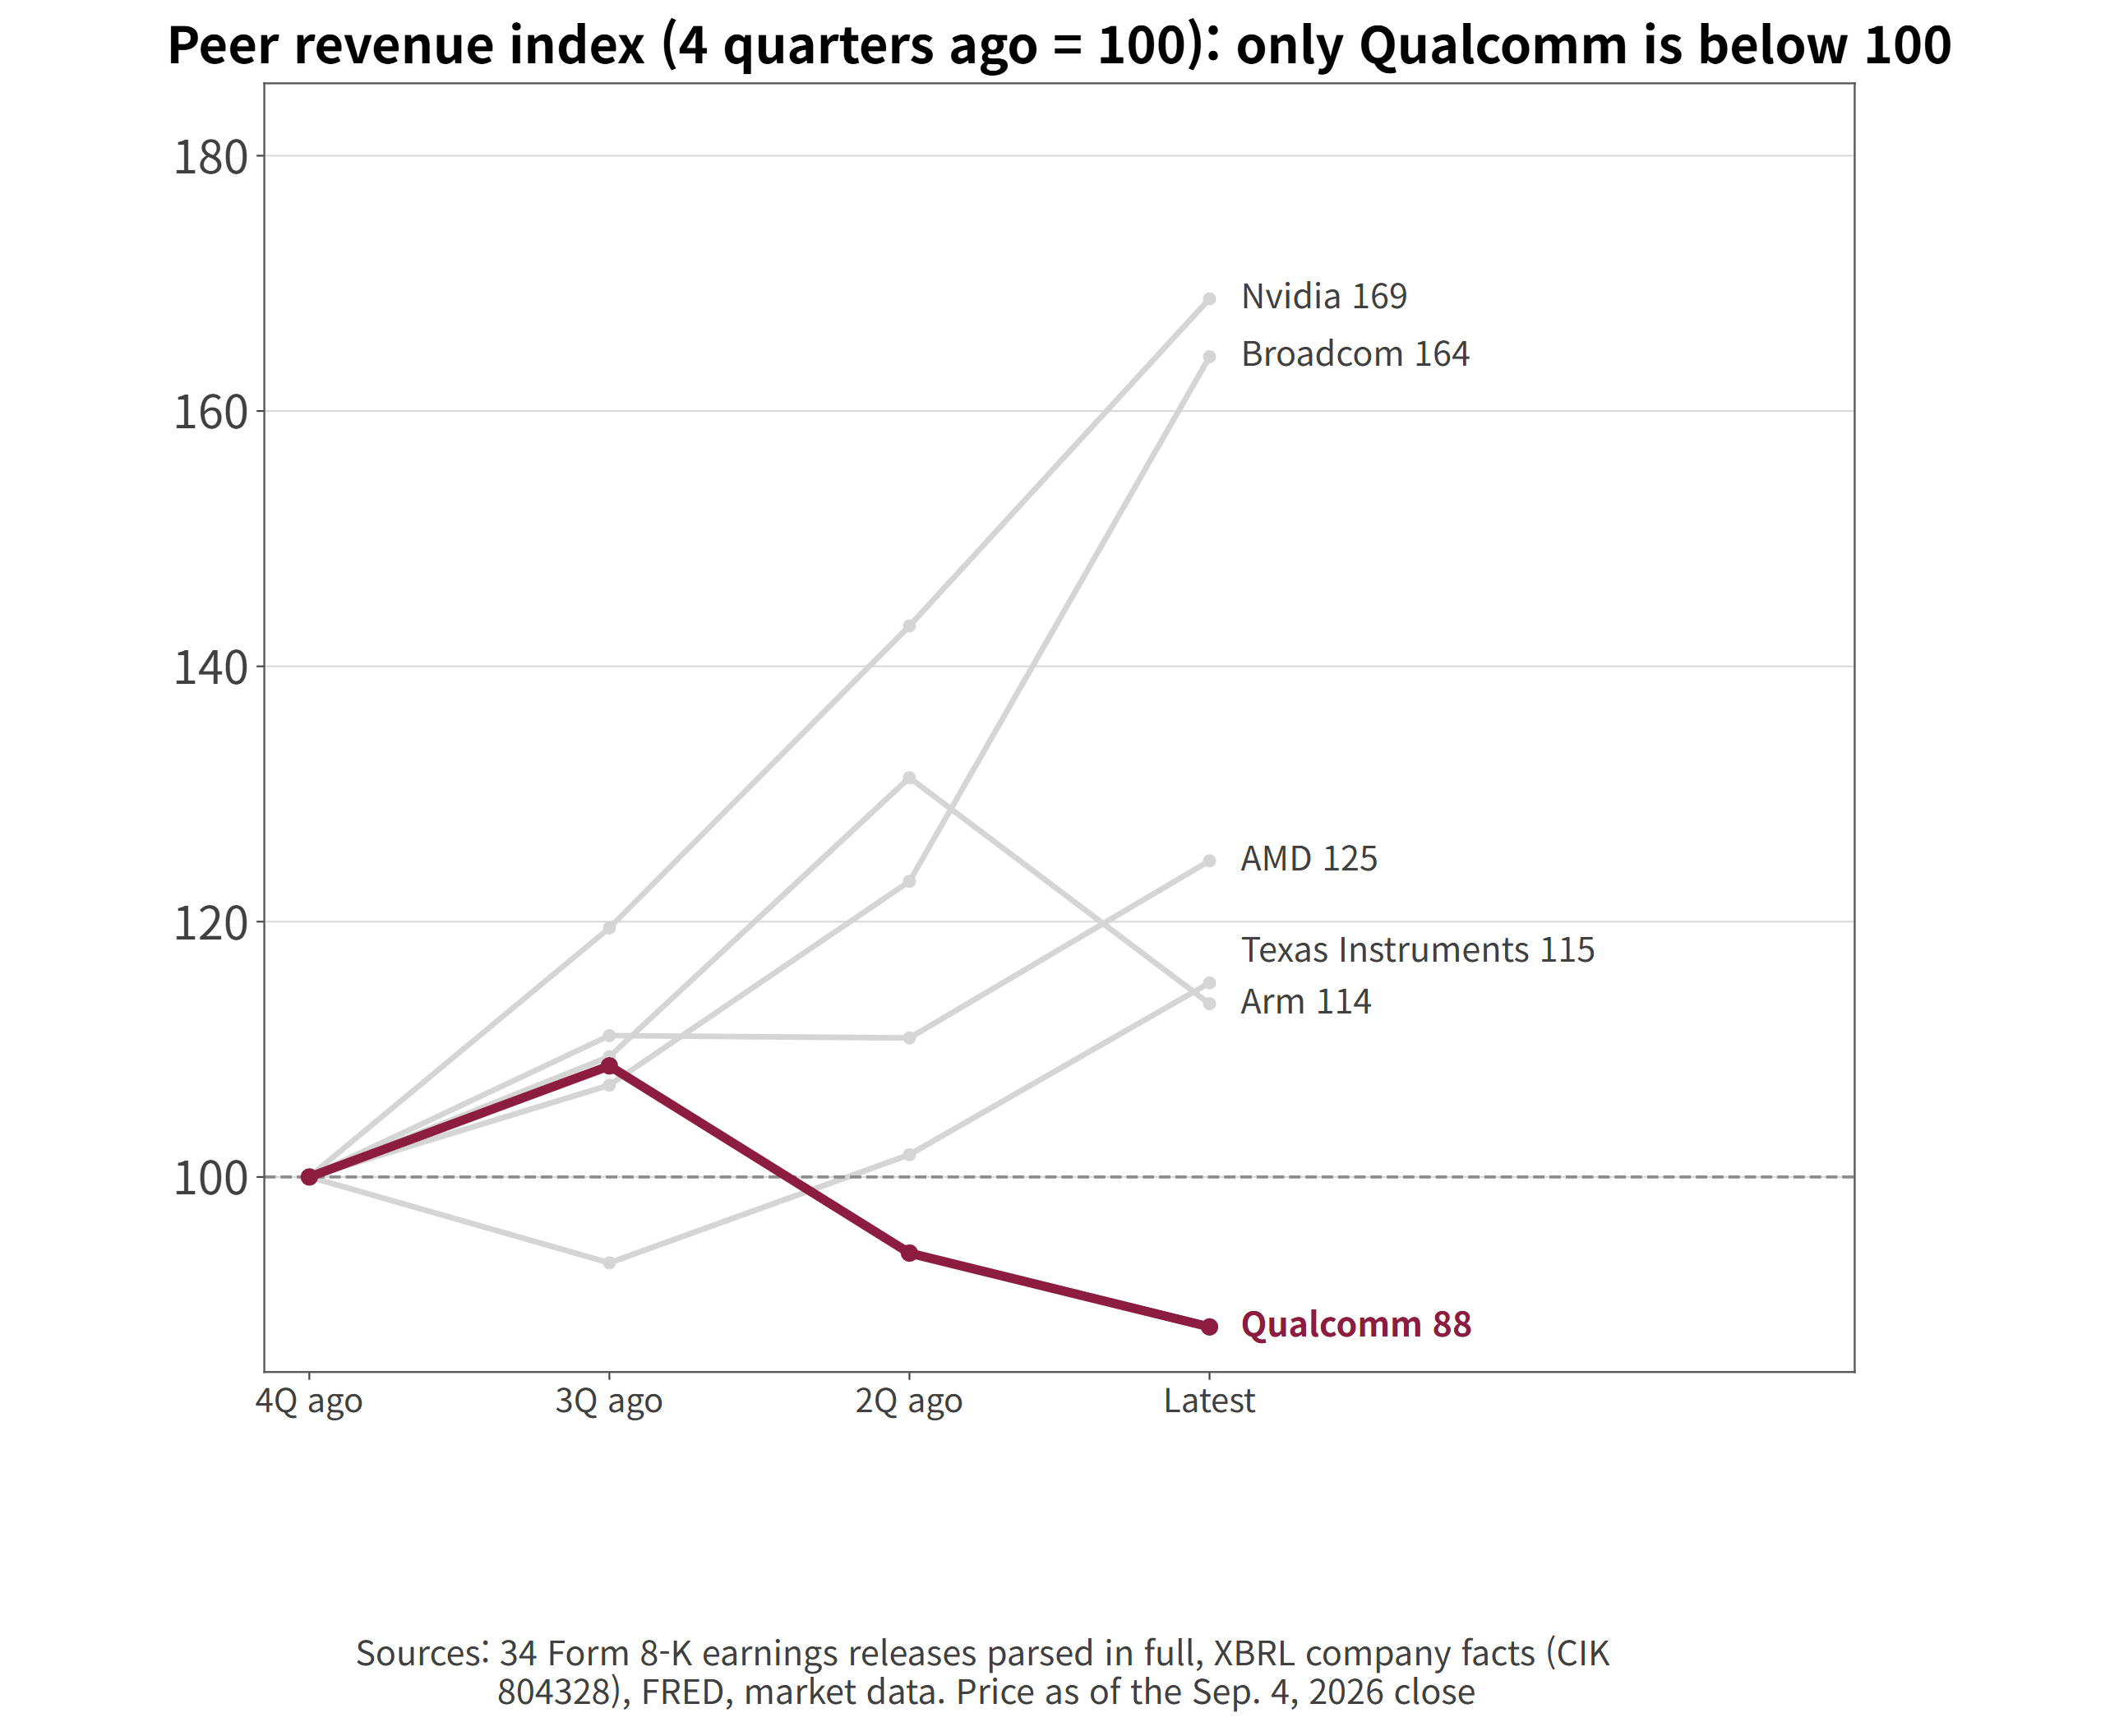
| Company | Quarterly revenue growth | Operating margin | P/E | P/S |
| Nvidia | +105.8% | 66.2% | 29.1 | 18.4 |
| Broadcom | +85.5% | 54.3% | 45.7 | 19.1 |
| AMD | +50.1% | 17.2% | 121.9 | 18.9 |
| Texas Instruments | +22.8% | 42.6% | 39.3 | 12.1 |
| Arm Holdings | +22.4% | 7.6% | 257.3 | 52.2 |
| Qualcomm | -4.0% | 18.5% | 19.6 | 4.1 |
- Aggregated sell-side estimates and market data (latest reported quarter for each company): Qualcomm is the only one of the six with revenue moving backwards, and it carries the lowest multiple on both measures.
- Qualcomm belongs in the mature large-cap bucket with a licensing overlay, and that bucket gets tested on shareholder returns and margin durability rather than growth rate.
| Company | Type | Payout (quarter) | Gross margin | ROIC proxy: pre-tax stability |
| Qualcomm | Mature large cap plus licensing | $2.3B | 53.0% | Distorted by tax items |
| Texas Instruments | Mature large cap | Dividend-led | 61.4% | Stable |
| Broadcom | Mature plus growth | Dividend-led | 74.2% | Stable |
| Arm Holdings | Pure licensing | Minimal | 97.2% | Early-stage |
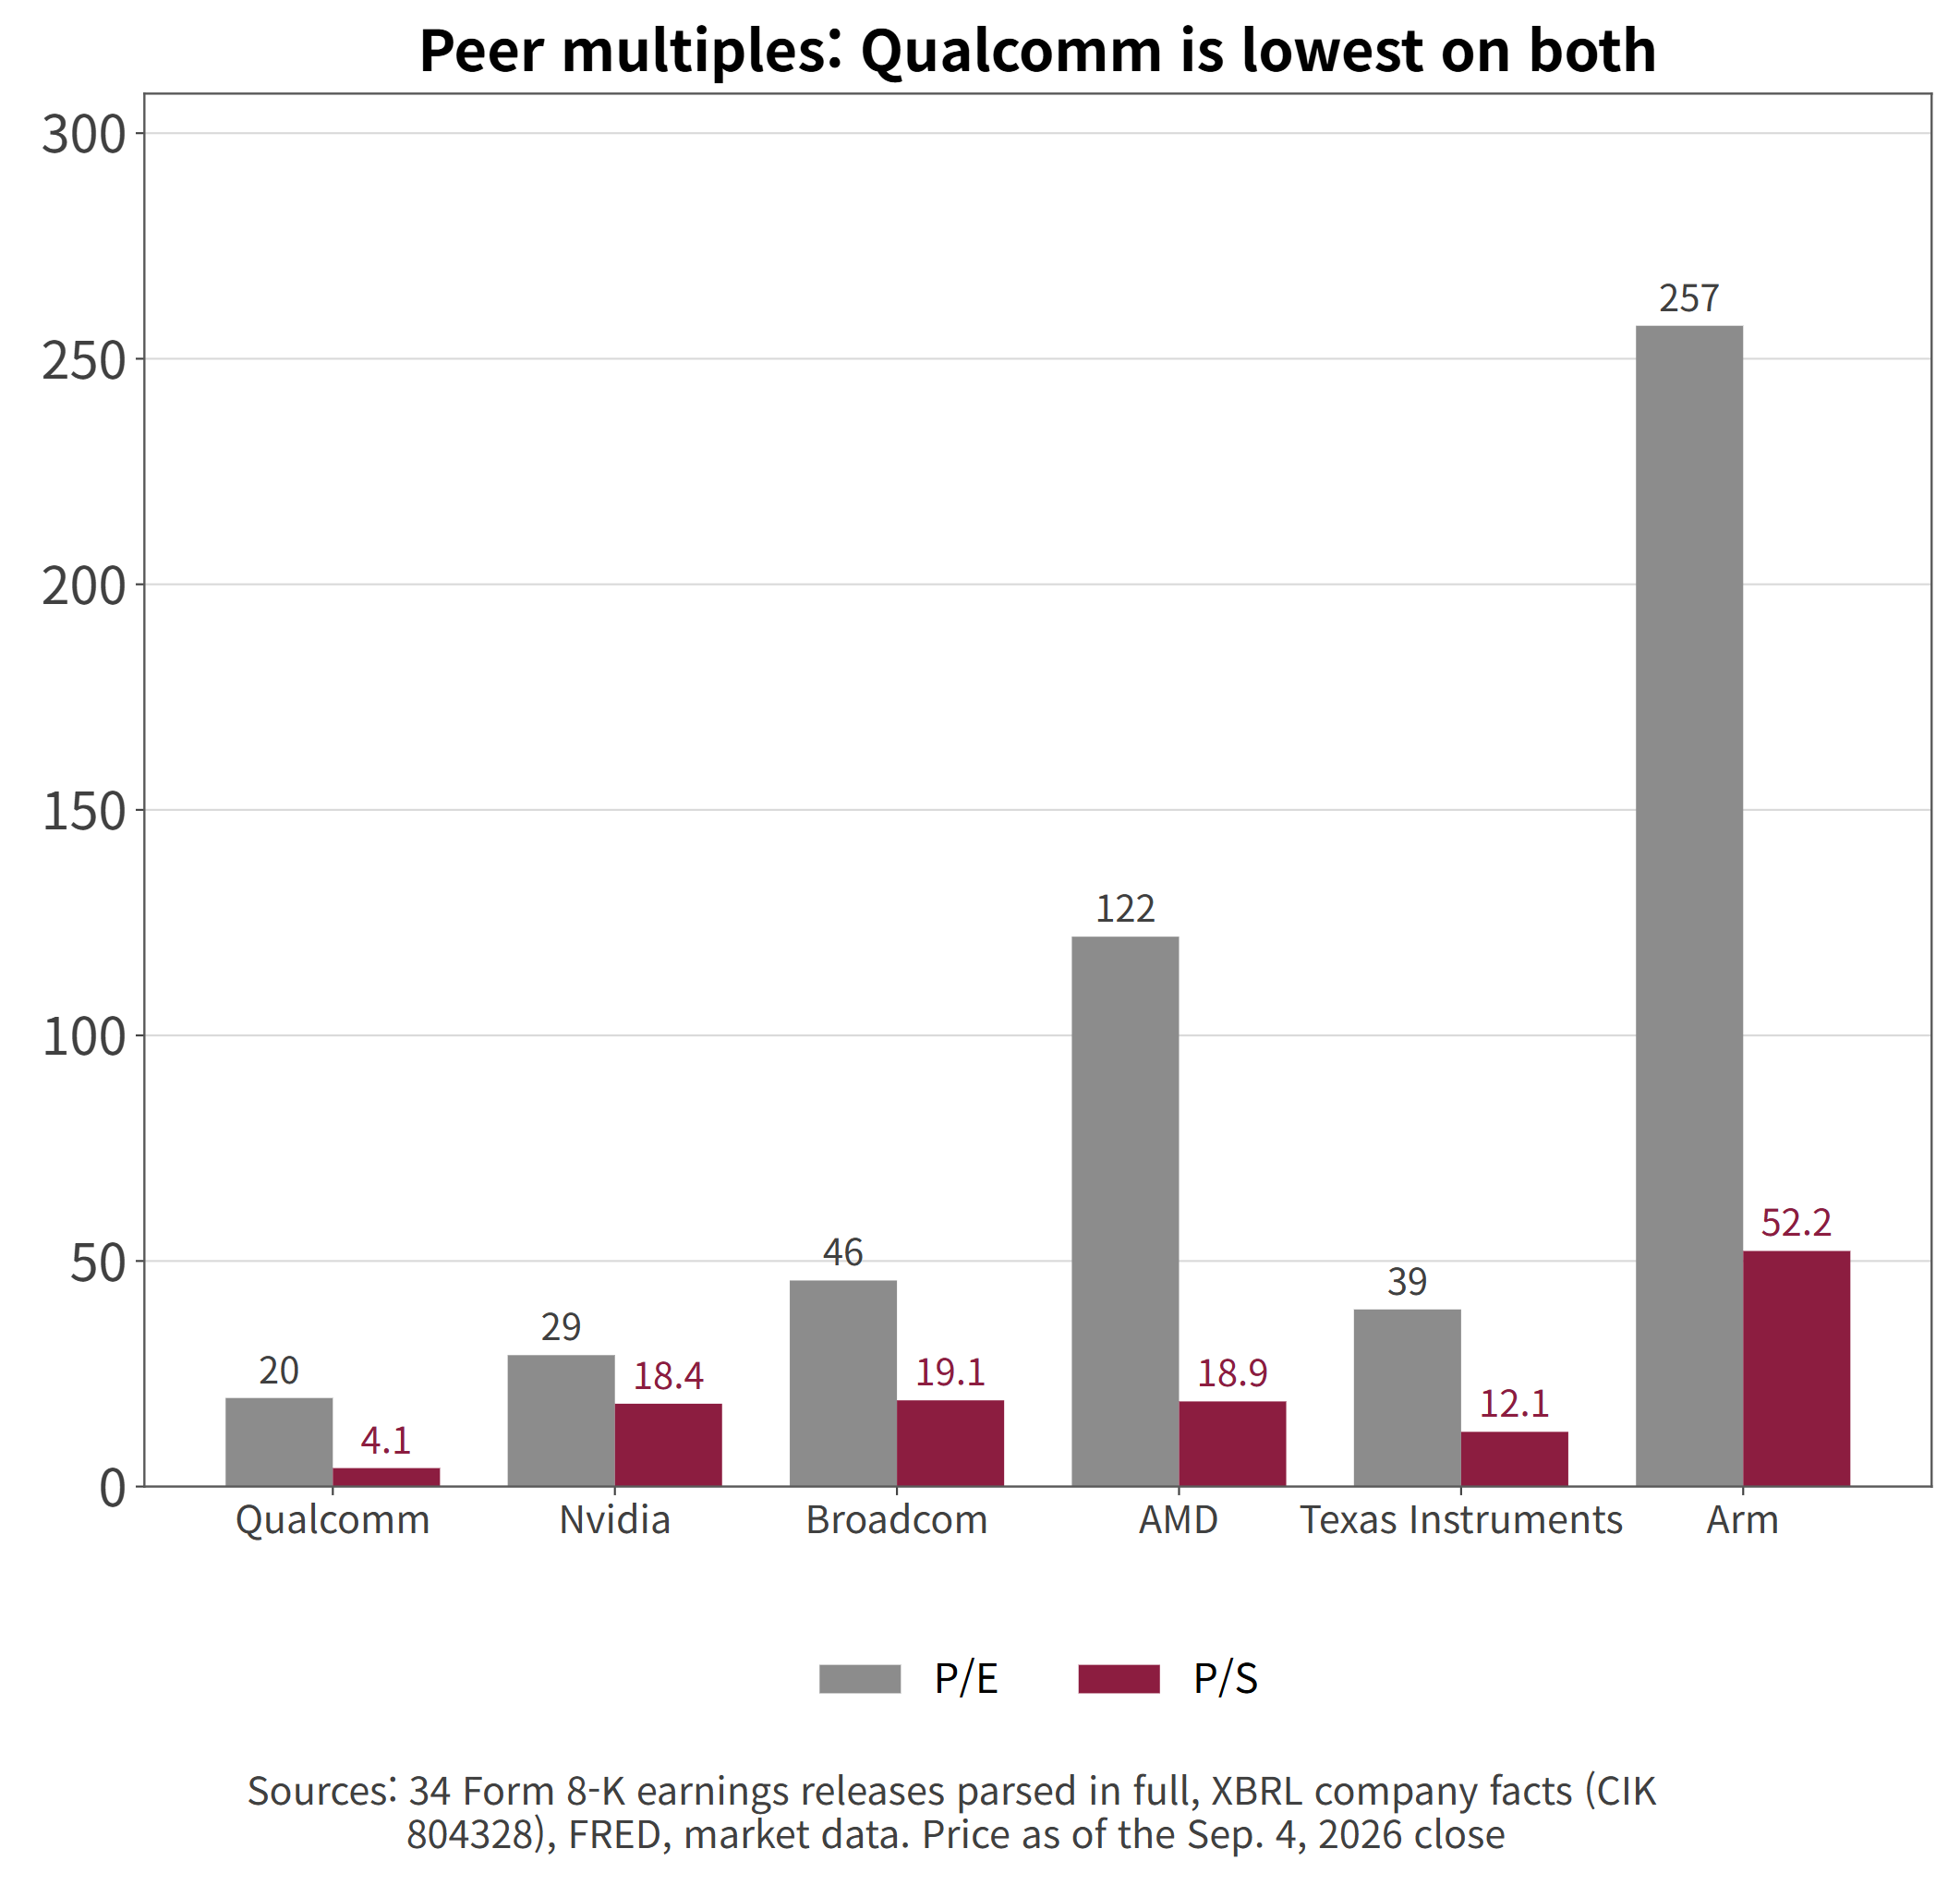
- Arm earns its place in the table for a specific reason. It runs the same licensing model as QTL, posts a 97.2% gross margin, and trades at 52.2x sales. QTL delivers a 68.9% pre-tax margin and is buried inside a company trading at 4.1x sales.
Is Qualcomm Stock Cheap? Only If Earnings Hold
- Against its own history, the stock sits in the middle.
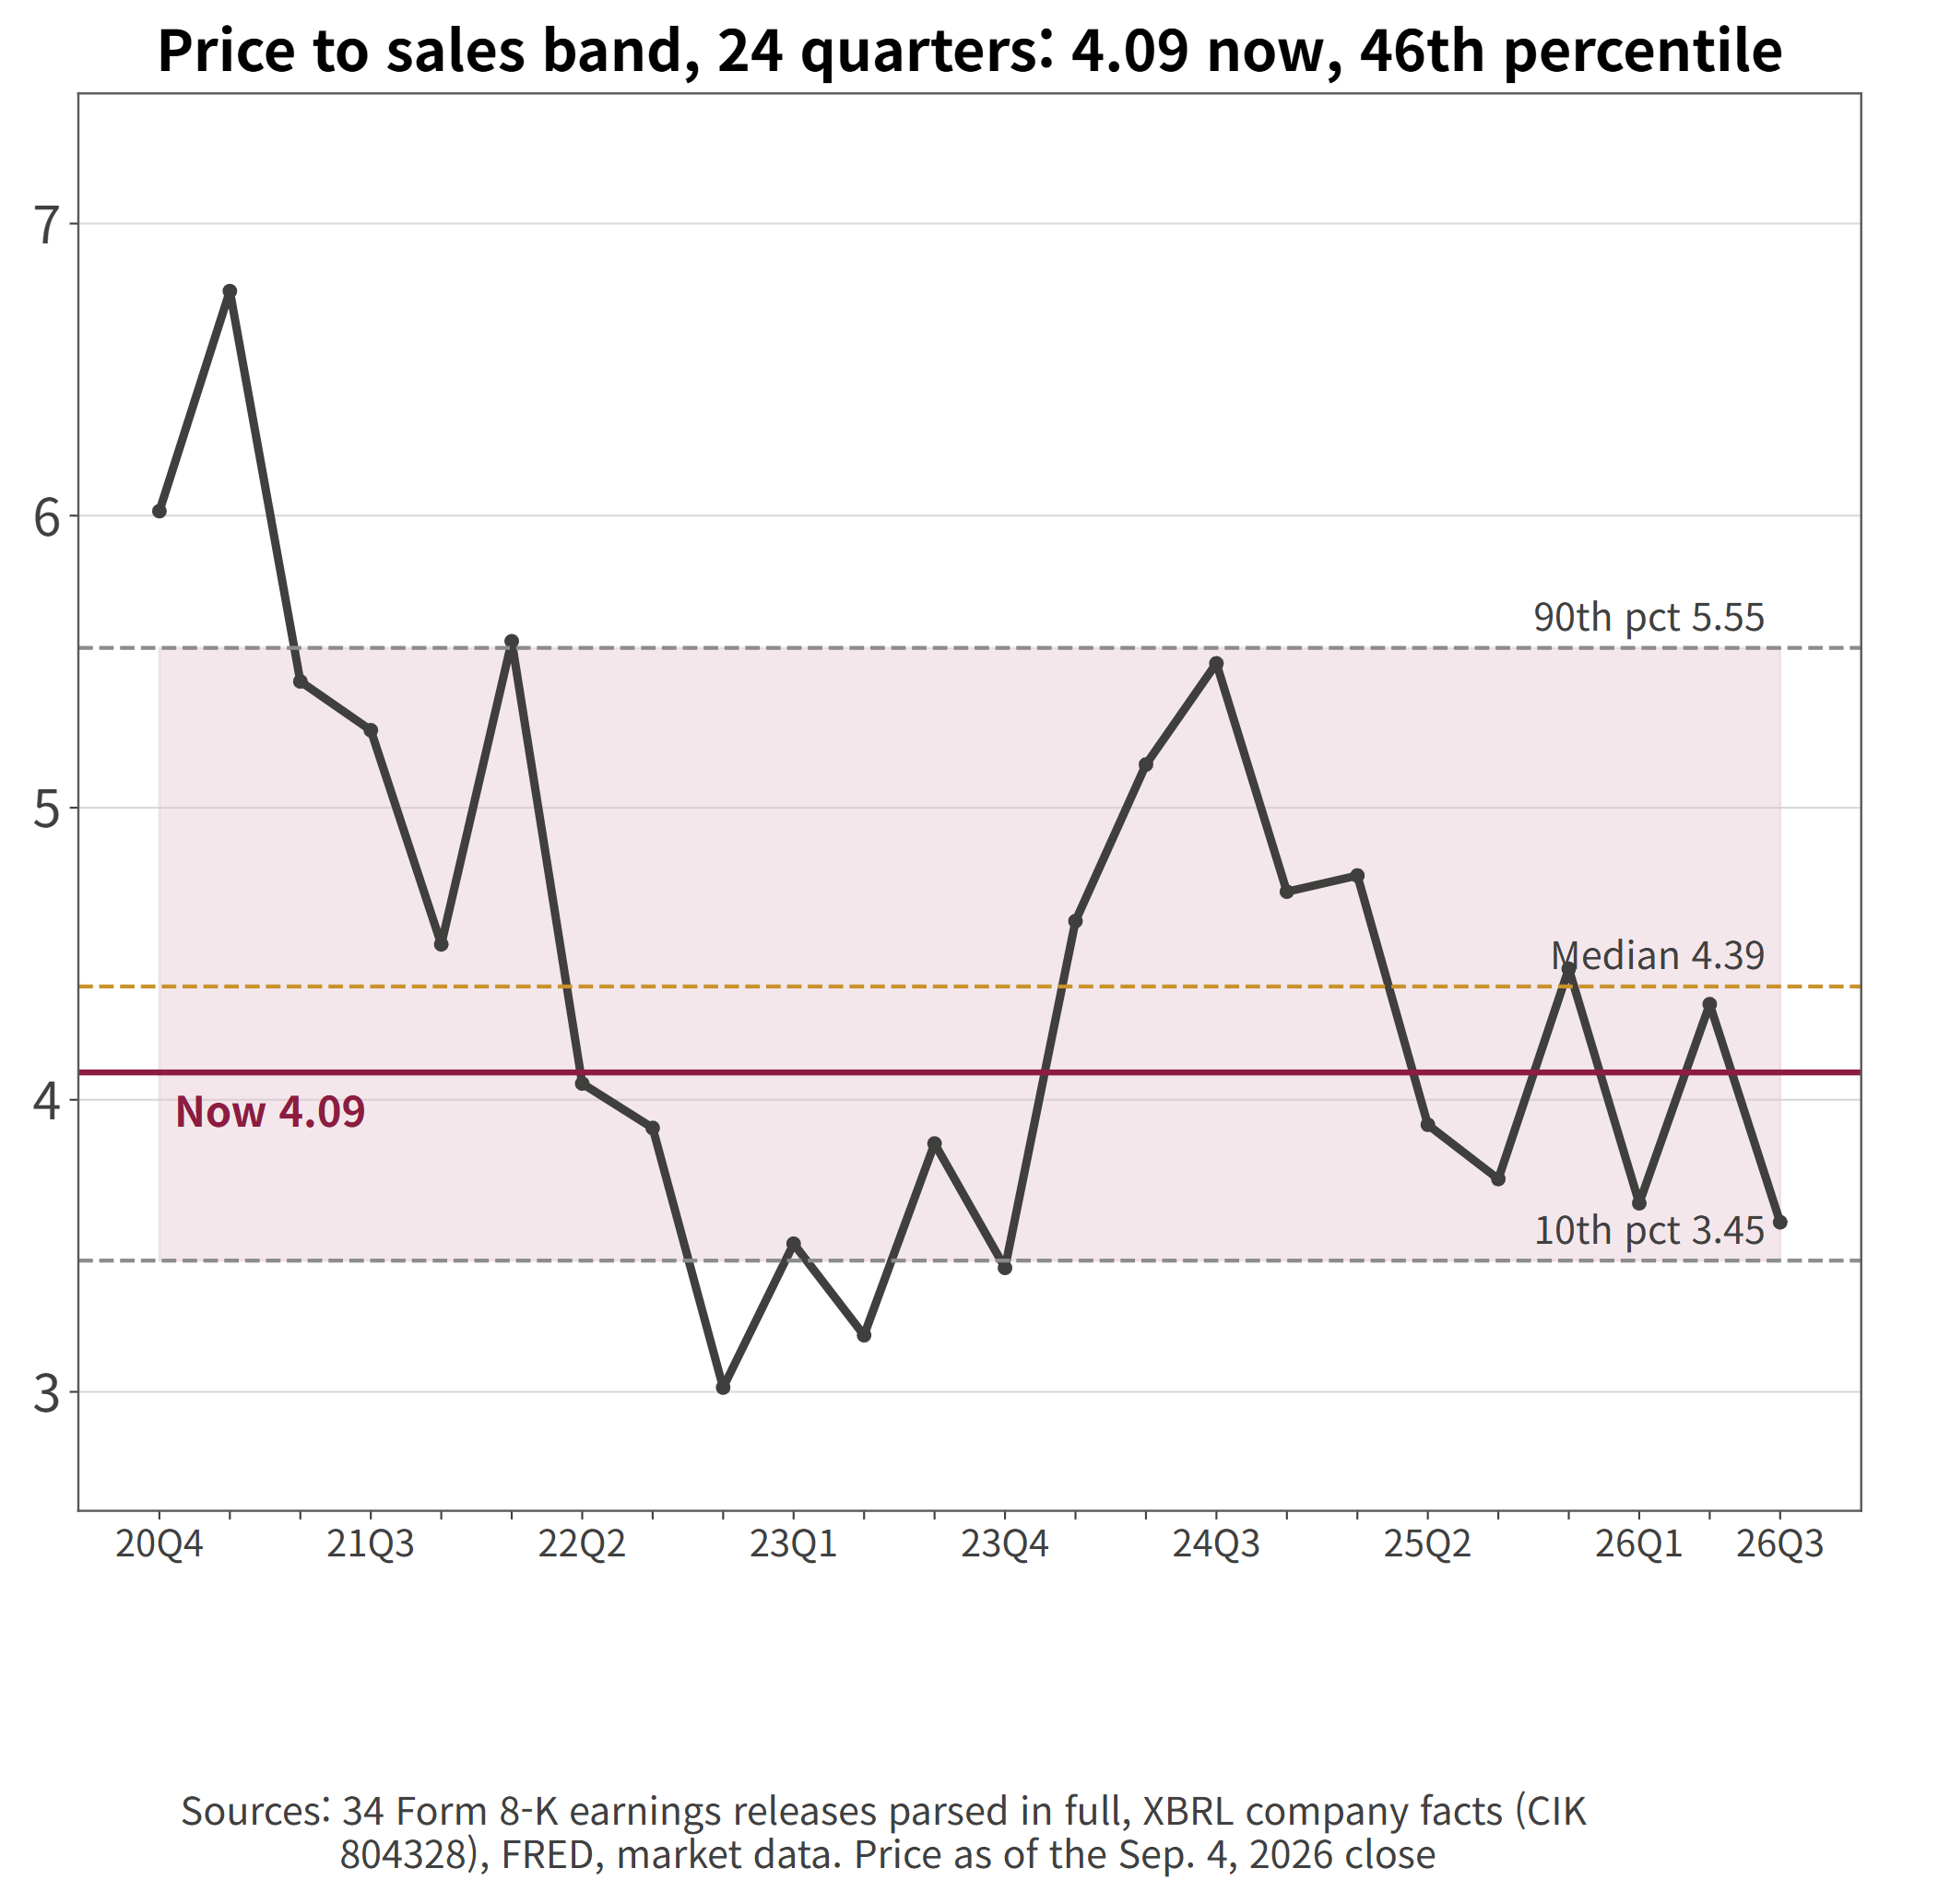
- Across a 24-quarter price-to-sales band, the current 4.09 lands at the 46th percentile, just under the 4.39 median and between a 3.01 low and a 6.77 high.
| Measure | Current | 5-year median | Industry median |
| P/E (non-GAAP basis) | 14.85 | 14.26 | 41.97 |
| P/B | 6.45 | 7.42 | 5.83 |
| P/S | 4.09 | 4.20 | 7.27 |
| EV/EBITDA | 11.62 | 10.95 | 25.64 |
- Aggregated market data (as of the September 4, 2026 close): Roughly in line with its own history, roughly a third of the industry median. Reading that gap as undervaluation requires one assumption: that earnings hold near current levels.
Why the 19.4x P/E Is Not What It Looks Like
- Before leaning on the P/E, it is worth knowing what built it. The 19.4x trailing GAAP figure is not a clean number.
- Company disclosure (Q4 FY2025 earnings release, November 5 2025): "this new tax legislation resulted in a non-cash $5.7 billion charge, or $5.29 per share."
- Company disclosure (Q2 FY2026 earnings release, footnote 2, April 29 2026): "Second quarter of fiscal 2026 GAAP results included a $5.7 billion income tax benefit, or $5.33 per share, resulting from the release of a valuation allowance that was established in the fourth quarter of fiscal 2025."
- The same $5.7 billion landed twice, in opposite directions. Fiscal 2025's fourth quarter showed a net loss despite $2,971 million in pre-tax earnings. Fiscal 2026's second quarter showed $7,370 million of net income on $2,232 million of pre-tax earnings.
- Own calculation (XBRL company facts, CIK 804328): With the two items offsetting, trailing twelve-month GAAP earnings per share works out to $8.75, which is where the 19.4x comes from. That is a residue of tax accounting, not a measure of the operating business.
- This is also why the valuation band in this analysis uses sales rather than earnings. Drawing a P/E band across four quarters of a distorted denominator produces percentiles that mislead. The company did note a durable benefit alongside the charge: it expects an effective tax rate in the 13% to 14% range and lower cash taxes going forward.
QCOM Consensus: Revenue Recovers, Profit Does Not
| Item | FY2025 (actual) | FY2026 (E) | FY2027 (E) | FY2028 (E) |
| Revenue | $44,141M | $42,901M | $44,753M | $52,253M |
| Operating income | $15,453M | $13,209M | $12,512M | $15,376M |
| Operating margin | 35.0% | 30.8% | 28.0% | 29.4% |
| Estimate count | - | 37 | 37 | 27 |
- Aggregated sell-side estimates (in USD): Revenue recovers in fiscal 2027 while operating income falls for a second consecutive year. A window where revenue rises 4.3% and operating profit declines 5.3% is embedded in the forecast, and the implied margin path from 35.0% to 28.0% runs parallel to the QCT margin decline already visible in the filings.
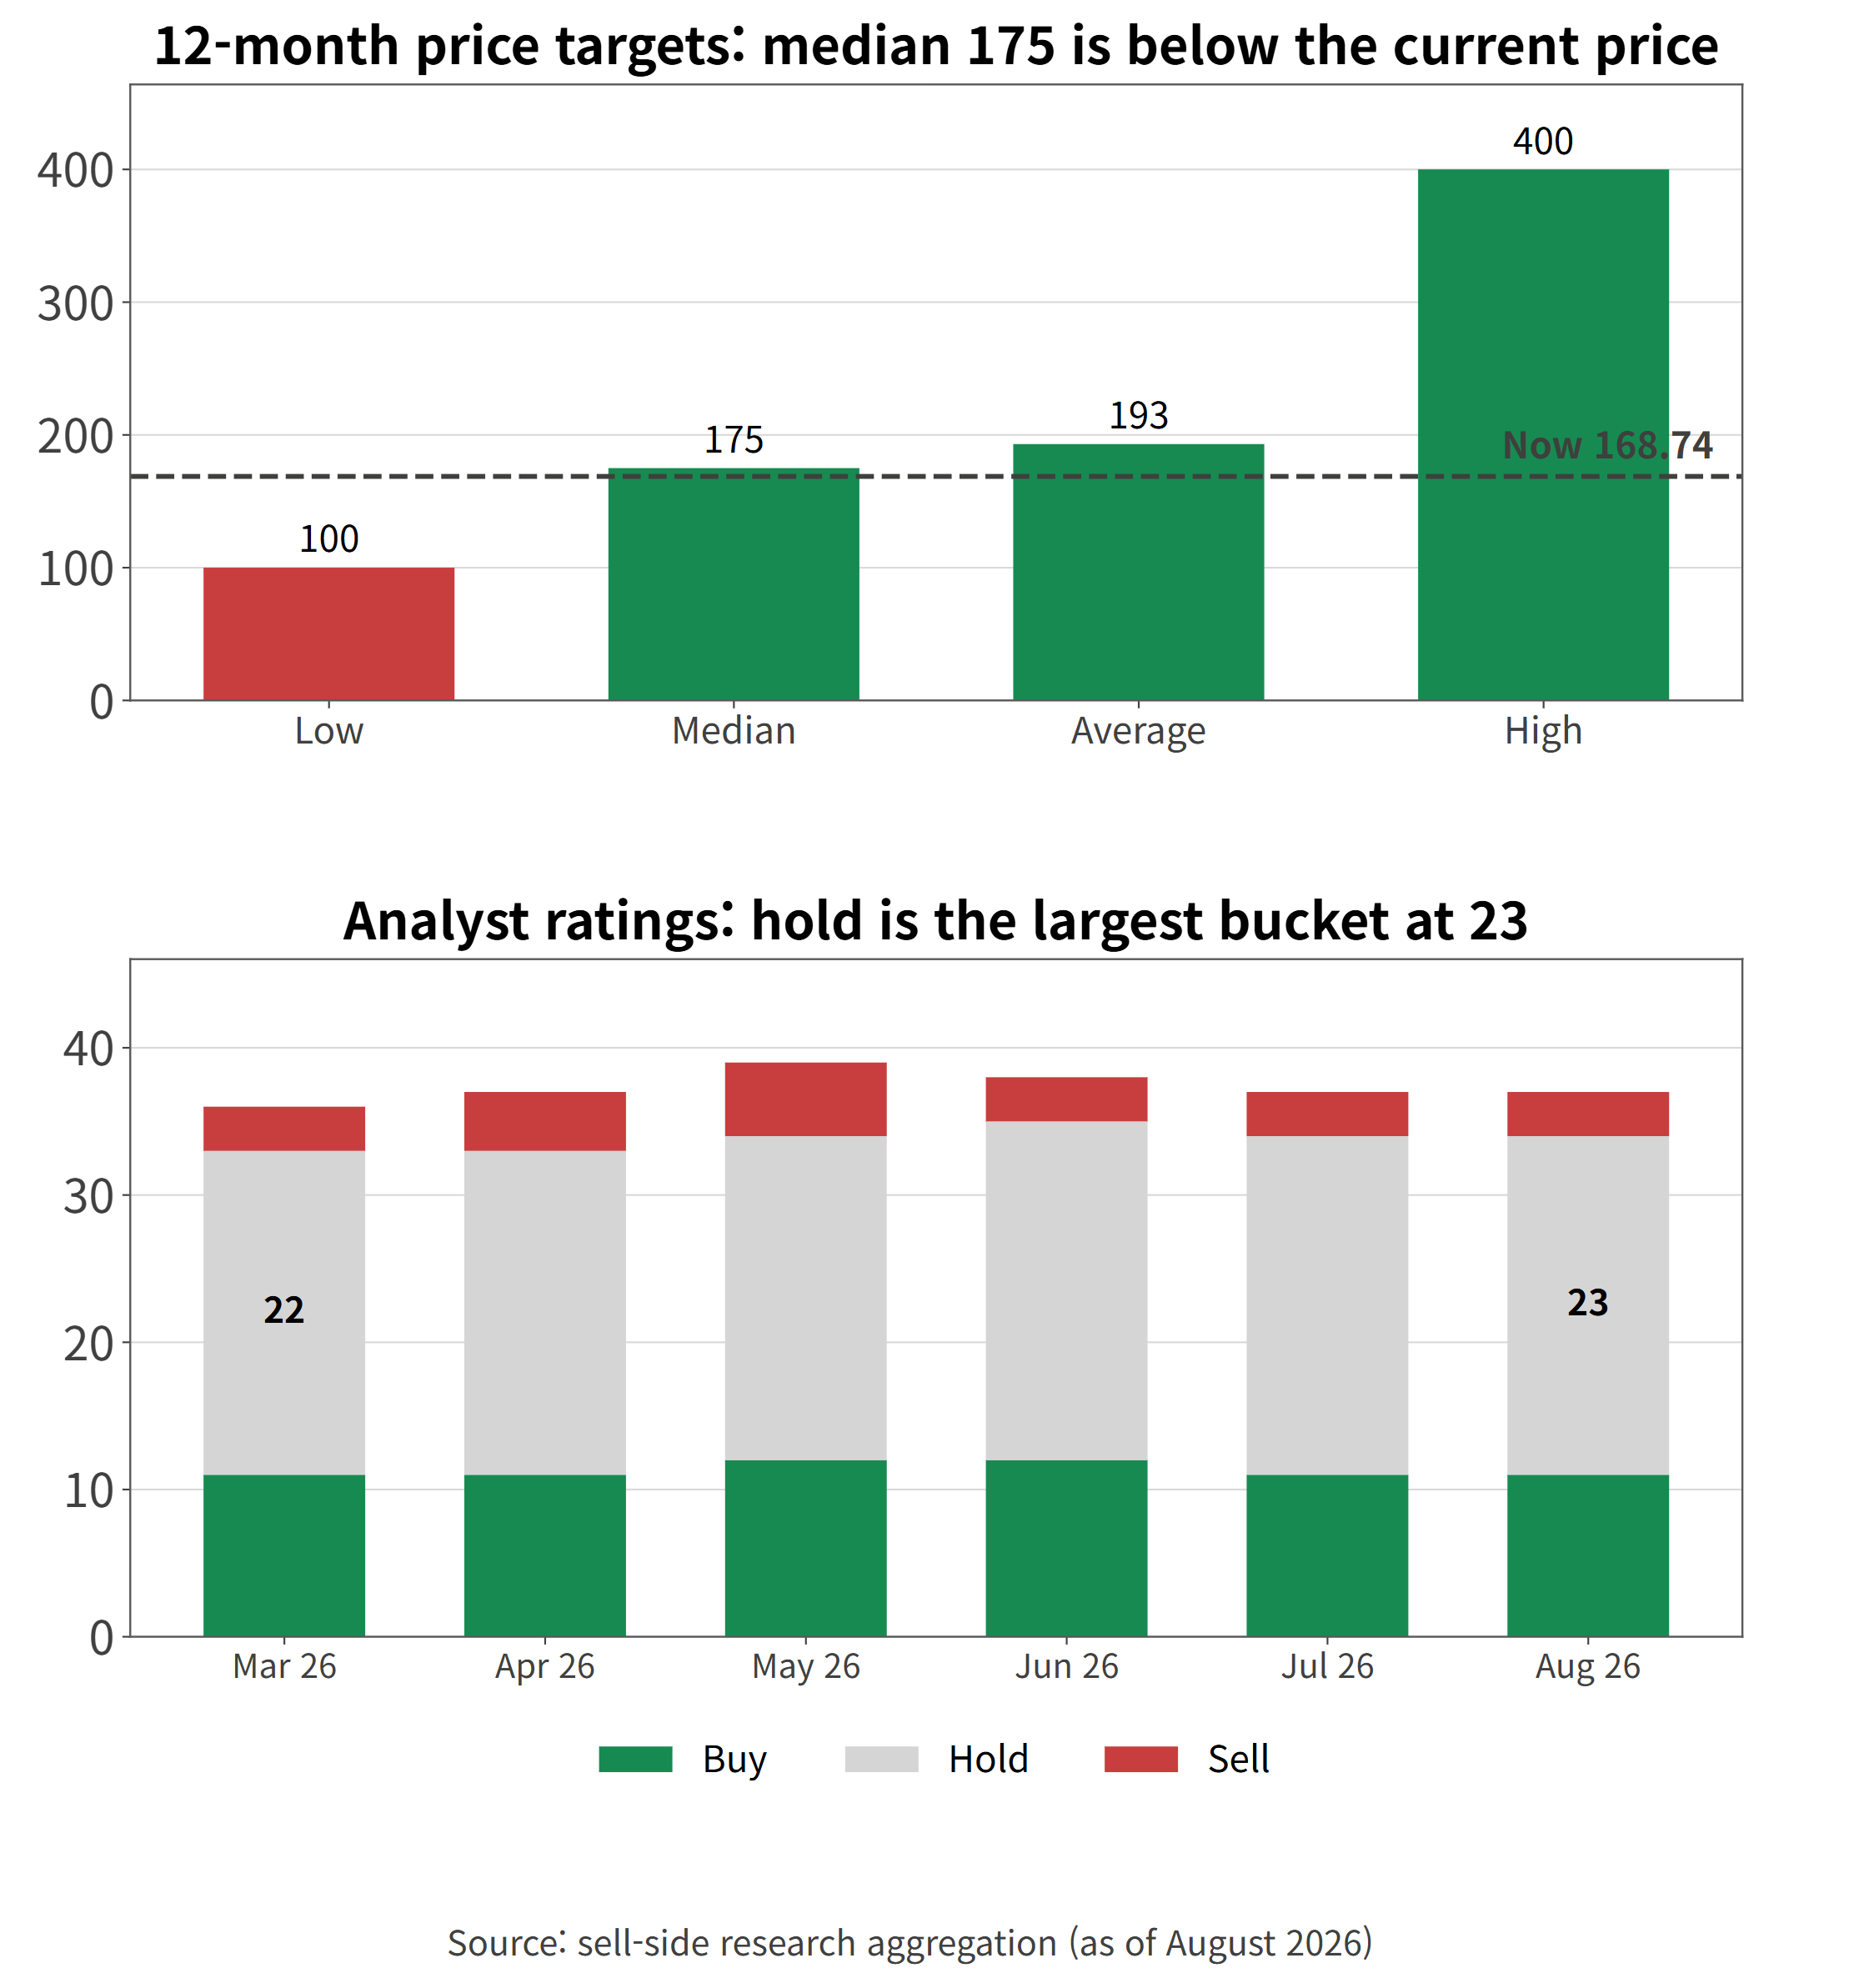
| Firm | Rating | Action | Target | vs. current | Date |
| Citi | Hold | Maintains | $175 | +3.7% | Aug 25, 2026 |
| Bank of America | Sell | Maintains | $180 | +6.7% | Aug 11, 2026 |
| Freedom Capital | Buy | Upgrades | $200 | +18.5% | Aug 7, 2026 |
| J.P. Morgan | Hold | Maintains | $215 | +27.4% | Aug 5, 2026 |
| Argus Research | Buy | Reiterates | $220 | +30.4% | Jul 31, 2026 |
- Aggregated sell-side estimates (as of August 2026): The median target is $175 and the mean is $193.1, though a $100 low against a $400 high makes the mean fragile. Of 37 covering firms, 23 sit at hold.
- Revisions run one way. Over the past 30 days, current-quarter earnings estimates saw 24 downward revisions against 1 upward. On next fiscal year, the split was 27 down against 3 up. Widening to 90 days does not change the direction.
- On the earnings call, Amon said non-handset revenue growth should accelerate from 24% in fiscal 2026 to more than 60% in fiscal 2027. Fourth-quarter guidance is $9.7 to $10.5 billion in revenue and $2.05 to $2.25 in non-GAAP earnings per share; the midpoint implies another year-over-year decline against $11.27 billion a year ago. The company has reported its fourth quarter in early November in past years.
Bull and Bear Conditions for QCOM Stock
| Scenario | Condition | Indicator to check | When · Source |
| Bull | Price increases show up in margin | QCT pre-tax margin back above 26% | Q4 FY2026 release |
| Bull | Non-handset growth accelerates as guided | Automotive plus IoT combined growth near 60% | First half FY2027 |
| Bull | Data center becomes a reported line | A new row in the QCT revenue stream table | Quarterly release |
| Bear | Handset decline widens past 20% | Handset revenue below $5.0B in a quarter | Quarterly release |
| Bear | Input costs outrun price increases | Company non-GAAP pre-tax margin below 27% | Quarterly release |
| Bear | Estimate cuts continue | 30-day down versus up revision count | Monthly |
| Multiple risk | Price-to-sales slides toward the band floor | Approach to 3.45, the 10th percentile | Ongoing |
- Only the items tied to earnings reports carry a datable checkpoint.
Questions This Analysis Does Not Answer
- How much of the handset decline belongs to one customer?
- The filings do not say. Qualcomm reports large-customer concentration as an annual aggregate and leaves it out of quarterly materials. Once RFFE disappeared as a separate stream, the indirect estimate became unavailable too.
- Is mix or input cost the larger driver of the margin decline?
- They cannot be separated from disclosure. The company cited input costs and does not publish segment-level cost detail, which is why this analysis places the two side by side without assigning weights.
- What is data center revenue today?
- There is no separate disclosure. Management includes data center in the non-handset target, but the current figure sits inside IoT. The quarter a separate line appears is itself the thing to watch.
Related Analysis
- TSMC (TSM) Stock: 60% Margins and Guidance It Keeps Beating : Qualcomm is fabless and buys wafers here, so the foundry's pricing power is the other side of the input-cost pressure described above.
- Credo (CRDO) Stock Analysis: GAAP vs Non-GAAP Earnings Gap : Another semiconductor name where the reported and adjusted bottom lines diverge, useful for comparing how each company frames its own numbers.
- Dell (DELL) Stock Analysis: Q2 FY2027 Earnings and Guidance : Sits on the data center demand Qualcomm says it is moving toward, which helps size the opportunity the company is pointing at.
Methodology and Sources
- Segment and revenue-stream series were built by parsing 34 Qualcomm earnings releases filed on Form 8-K between 2018 and 2026, taken from SEC EDGAR. The current quarter figures come from the Q3 FY2026 earnings release. Because the company reallocated RFFE revenue beginning in fiscal 2023, the handset, automotive and IoT series were rebuilt on the current basis using the prior-year column of each release, and every reconstructed row was checked against the reported QCT total.
- Income statement, share count and per-share figures were cross-checked against XBRL company facts for CIK 804328; quarterly values were derived from year-to-date filings and validated against the totals printed in the releases. Industry series are FRED IPG3344S, CAPUTLG3344S and PCU334220334220 through July 2026. Valuation multiples, peer figures, price targets and estimate revisions come from aggregated sell-side research as of August 2026. Prices reflect the September 4, 2026 close of $168.74.
- This is not investment advice. Last updated: September 7, 2026.
Related reading
- Sector RS Rank Sep 25: Cyber Sinks, Hydrogen, Chips Lead (daily brief featuring QCOM)
- NVIDIA (NVDA) Stock Analysis: Guarantees and Cash Flow
- Sumitomo Electric (5802) Stock Analysis: Data Center Optics
- ASML Stock Analysis: The Bookings Line That Went Missing
- US stock analysis index (all company analyses)
- Why Leaders Keep Leading: Reading Sector Rotation Through RS and RRG
반응형
'US Stock Analysis' 카테고리의 다른 글
| American Express (AXP) Stock Analysis: Credit Metrics Reset (0) | 2026.09.10 |
|---|---|
| Applied Materials (AMAT) Stock: 9 Straight Guidance Beats (0) | 2026.09.09 |
| CrowdStrike (CRWD) Stock Analysis: GAAP vs Non-GAAP Results (0) | 2026.09.08 |
| Shopify (SHOP) Stock Analysis: Net Income vs. Equity Gains (0) | 2026.09.07 |
| Casey's (CASY) Stock Analysis: Fuel Margin Drove Q4 Profit (0) | 2026.09.06 |


