Applied Materials (AMAT): fiscal 2026 third quarter results, reported August 13, 2026
Applied Materials (NASDAQ: AMAT) grew trailing twelve-month revenue 7.8% to $30.8 billion, while its market capitalization rose 189.9% over the same year to $360.9 billion. This AMAT stock analysis works through why the trailing figure understates the business, how the company's own guidance record supports the re-rating, what split the 2.9x market cap increase into earnings and multiple, where the growth came from geographically, and how the valuation compares with ASML, Lam Research, KLA and Teradyne.
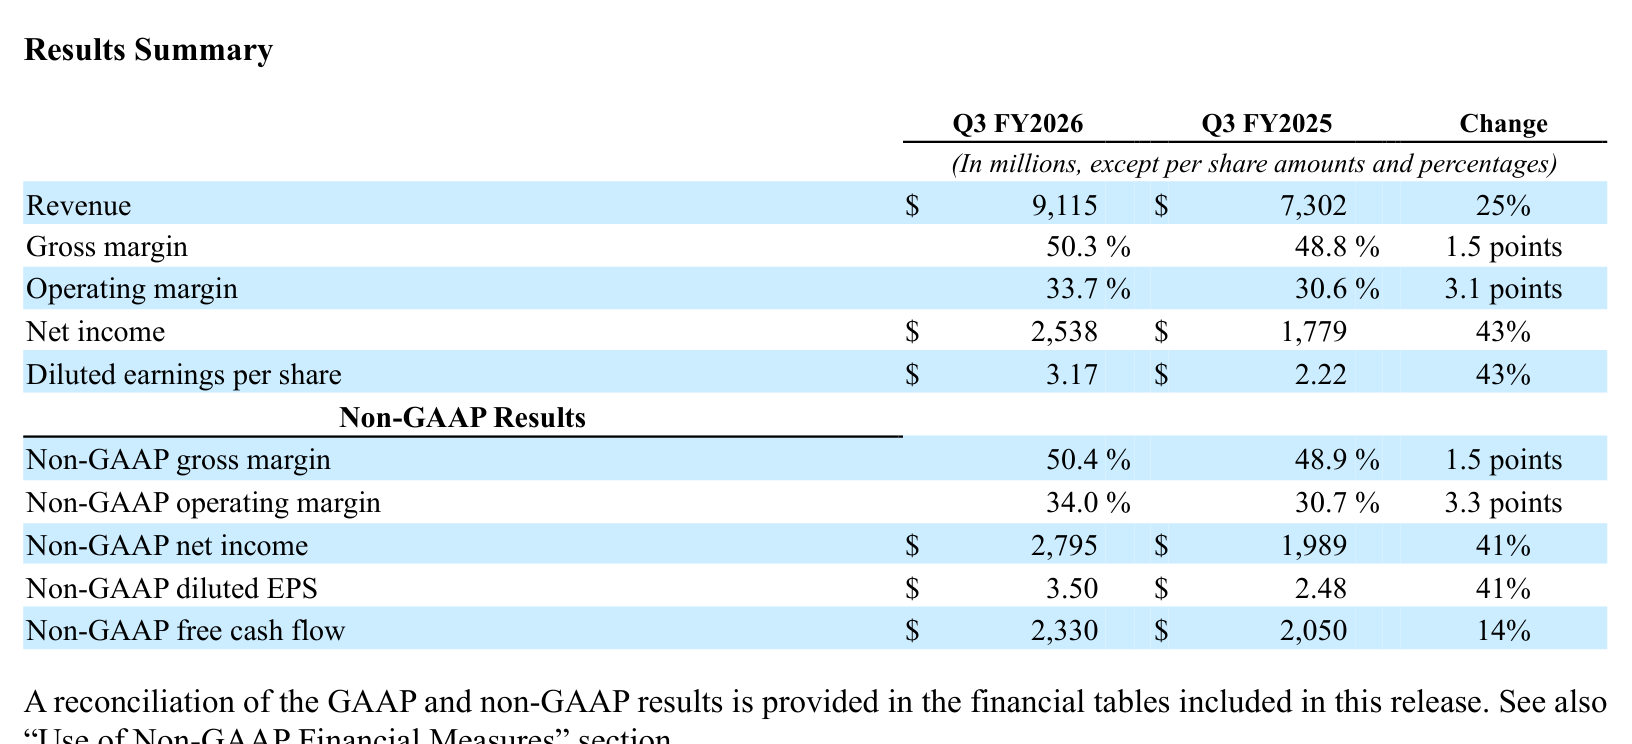
Applied Materials, fiscal 2026 third quarter earnings release, August 13, 2026
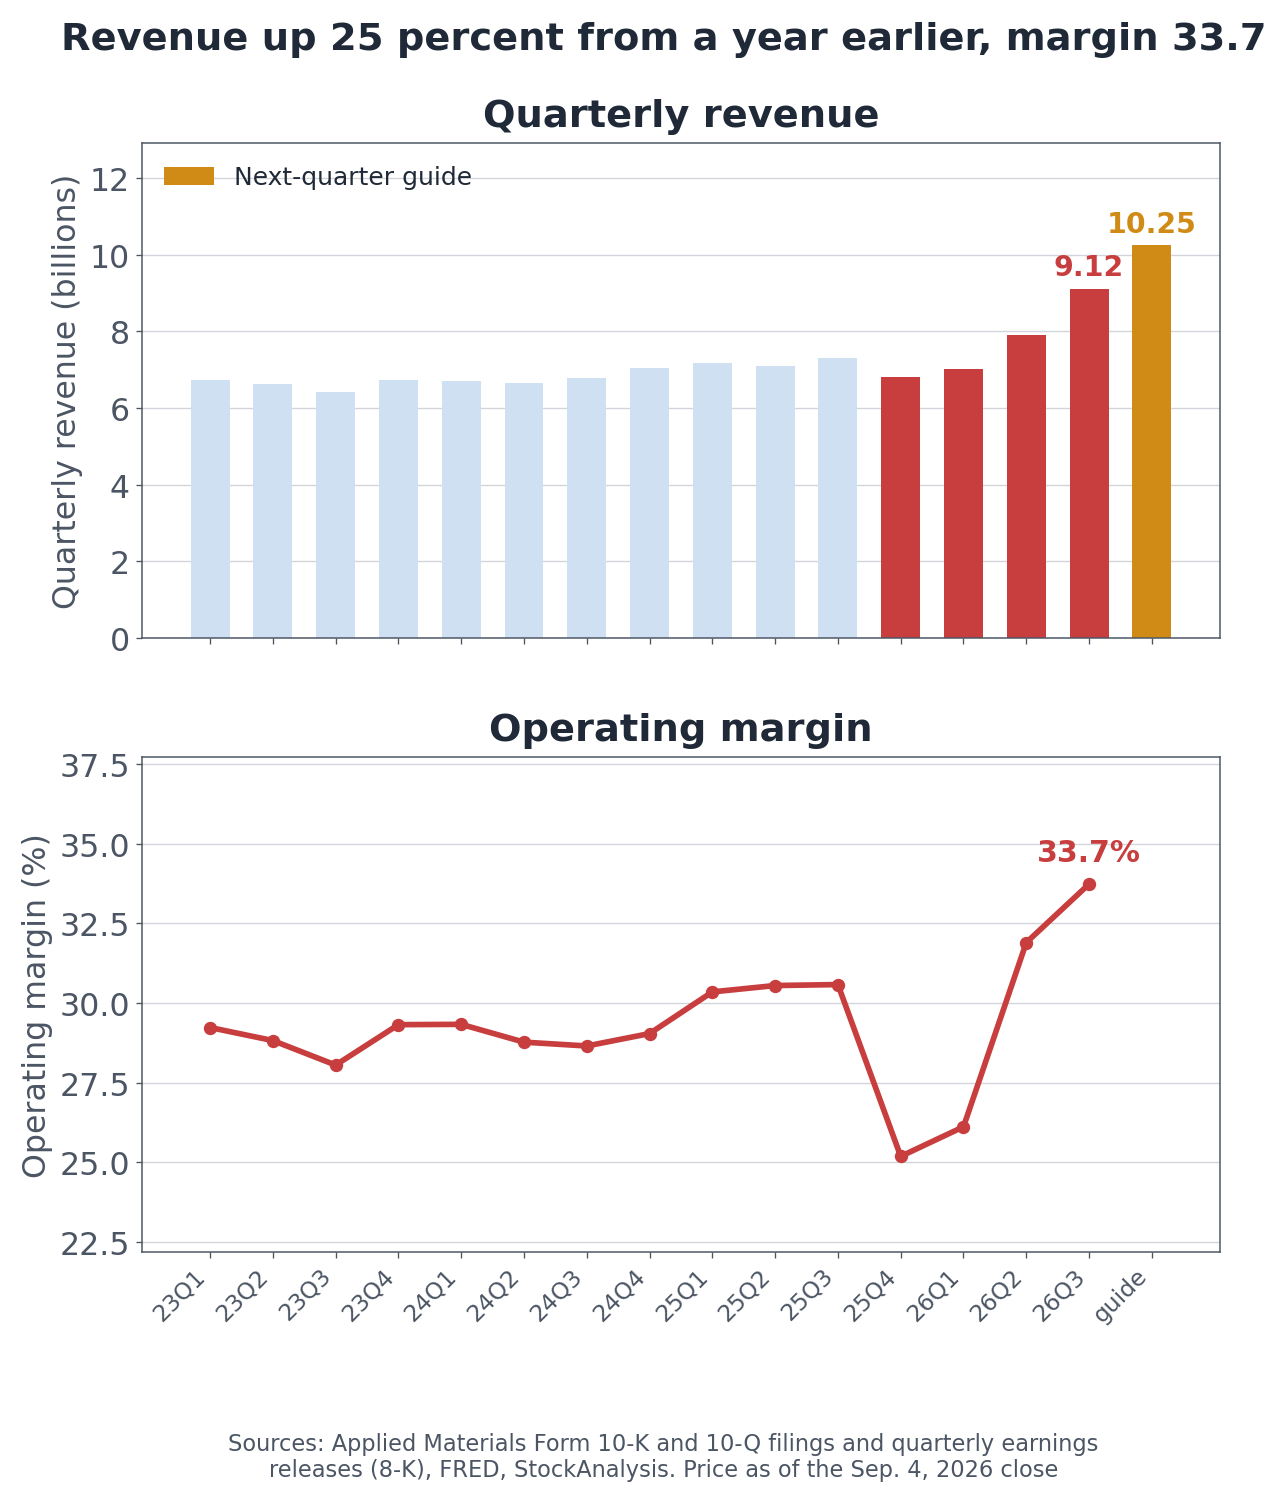
A twenty-fold gap between revenue growth and market value growth usually means the trailing window is measuring the wrong thing. Third-quarter revenue was $9.12 billion, up 25%, and the company guided the fourth quarter to $10.25 billion, up 51%. The trailing four quarters still carry a $6.8 billion quarter inside them.
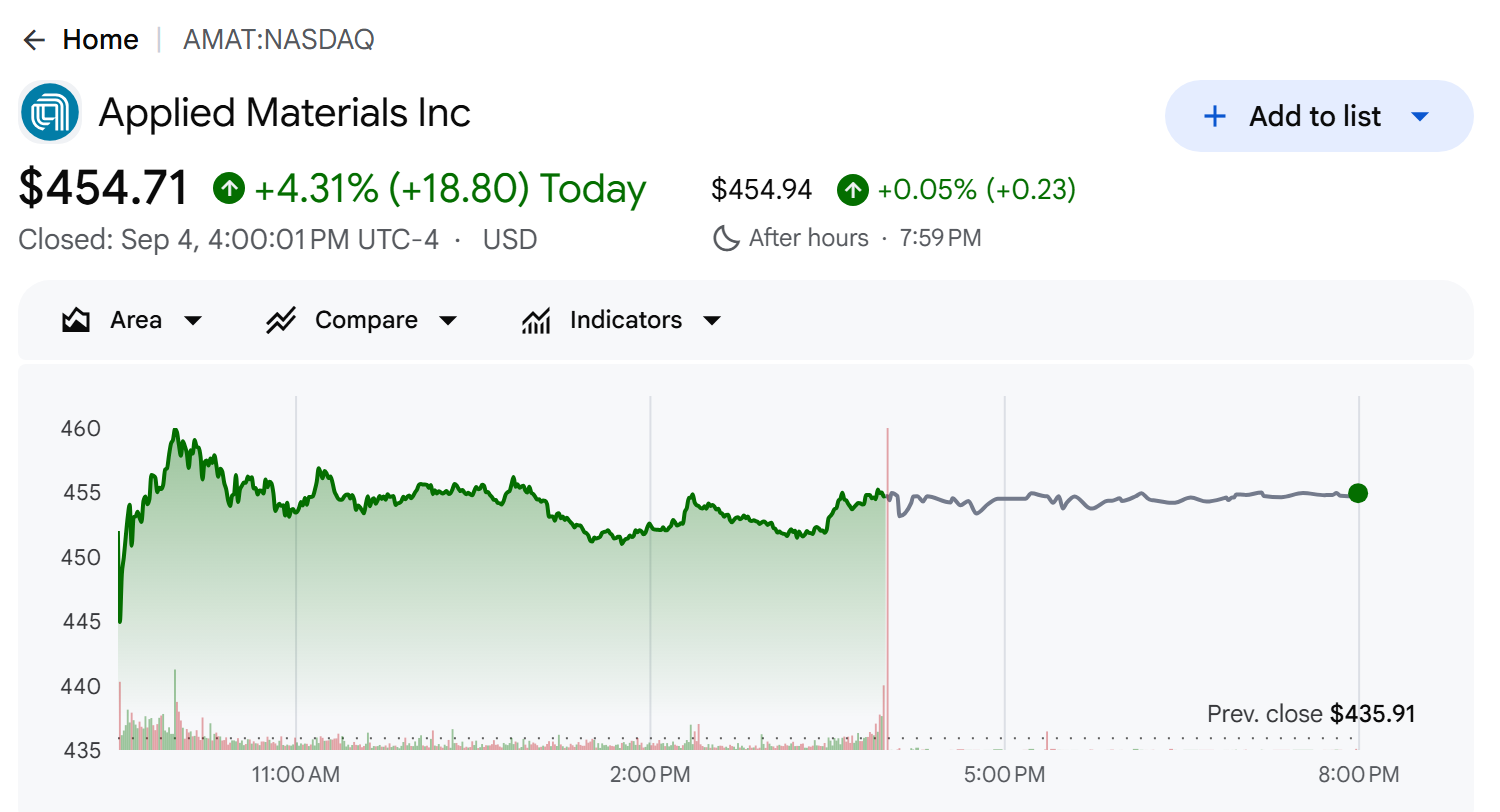
Applied Materials (AMAT) on Google Finance. Closed: September 4, 2026
Three windows, three answers, one company. Trailing four quarters: 7.8%. Latest quarter: 25%. Company guidance for next quarter: 51%.
Quarterly revenue and operating margin
Revenue ran 6.8, 7.0, 7.9 and 9.1 billion dollars across the last four reported quarters, with 10.25 billion guided next. The inflection is recent enough that any twelve-month average is still averaging in the trough.
What Does Applied Materials (AMAT) Do?
Applied sells the machines that build chips. It deposits films onto wafers, etches them away, planarizes surfaces, applies heat treatment, and measures the result. Where ASML concentrates on lithography and Lam Research on etch, Applied spans several process steps under one roof.
Three segments. In the third quarter Semiconductor Systems produced $7.0 billion, up 27%; Applied Global Services, which maintains installed tools and sells parts, produced $1.8 billion, up 22%; and the remainder including Display was $294 million.
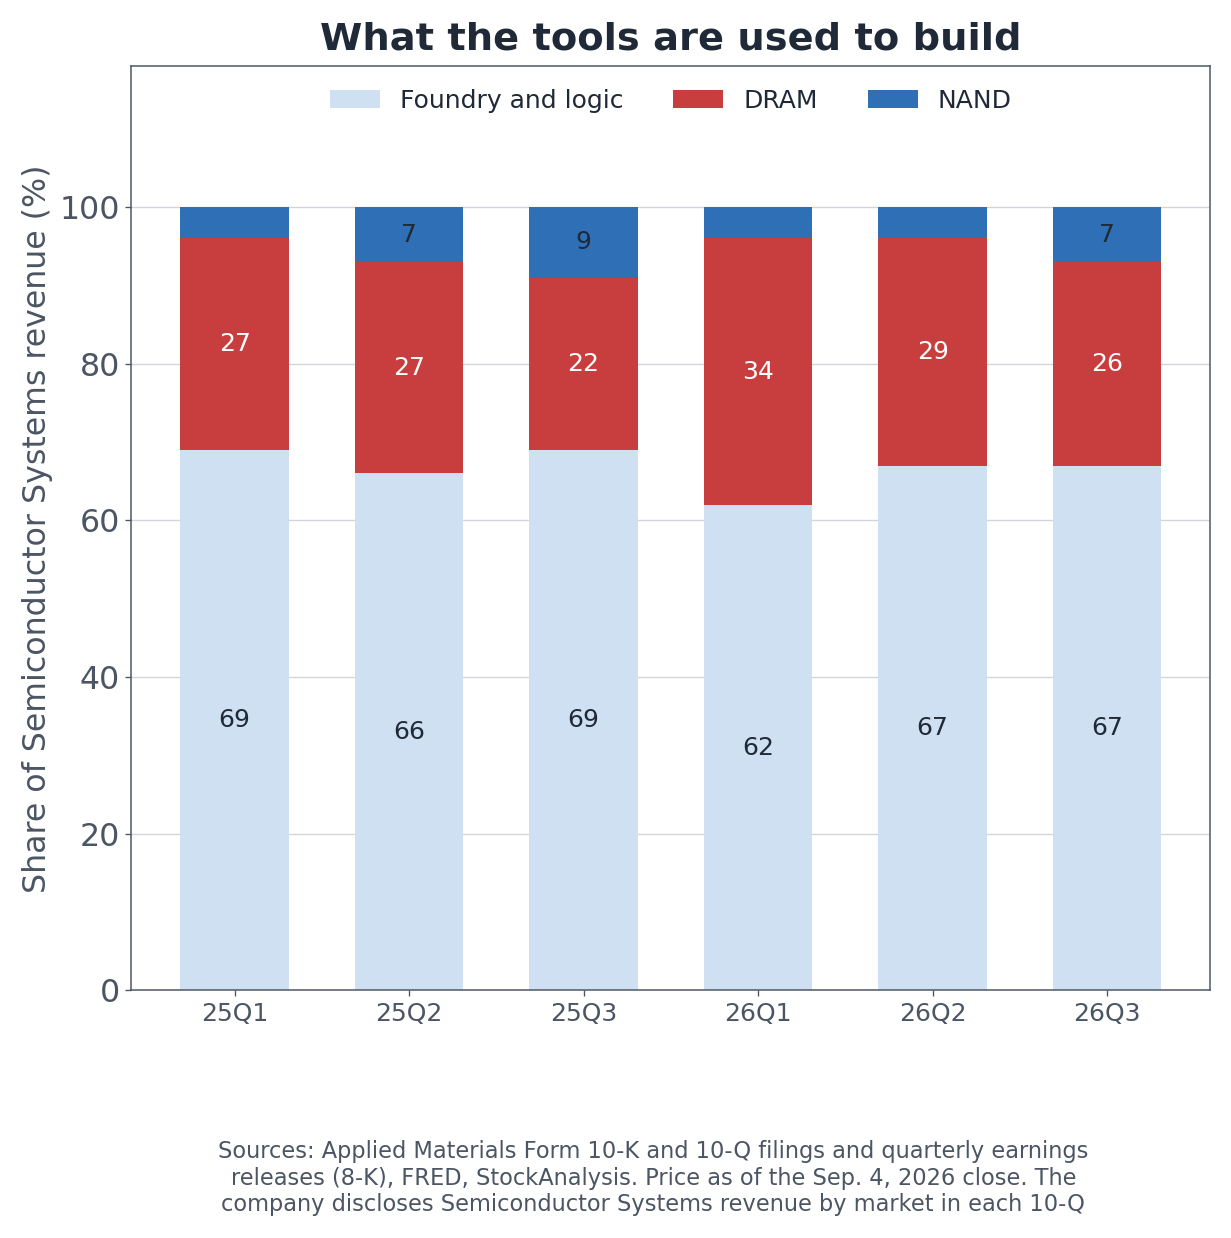
Semiconductor Systems revenue by market
The company discloses which chips its tools go on to build. Foundry and logic take 67%, DRAM 26%, and NAND 7%. A year earlier DRAM was 22%. On the earnings call management said DRAM revenue including HBM packaging rose 52% year over year to a record, and expects a substantial step up in the second half as customers add cleanroom space.
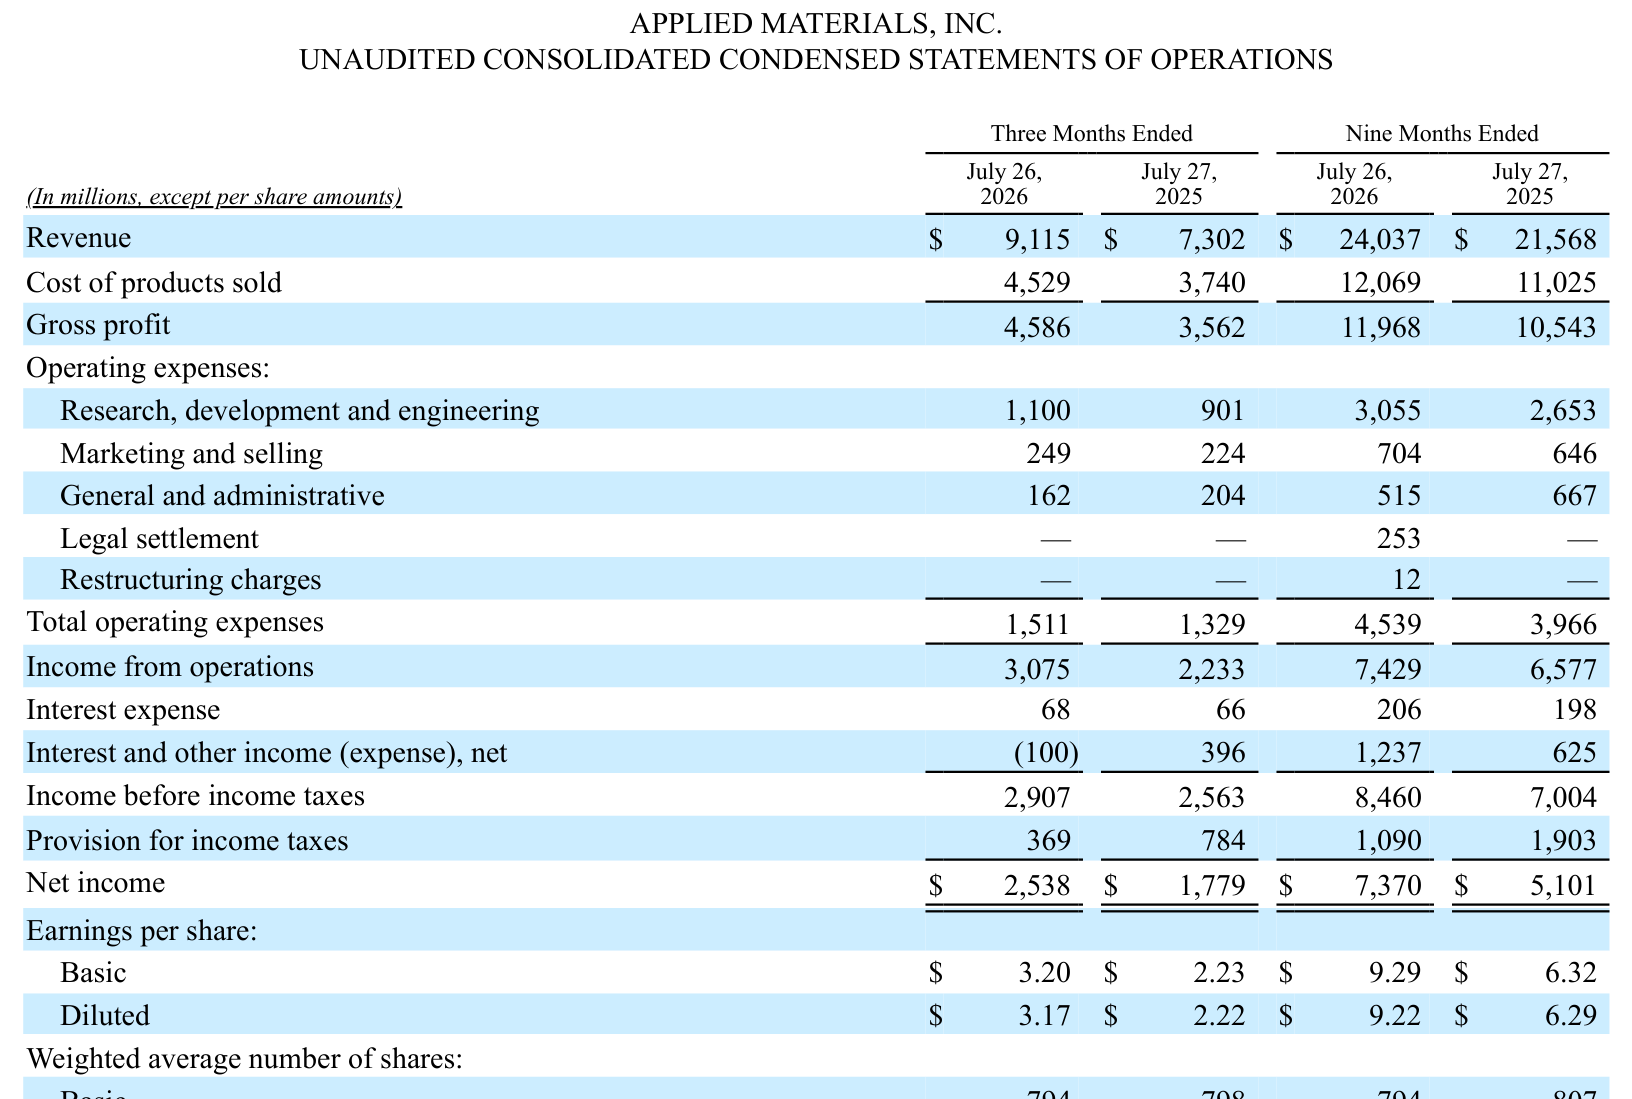
Applied Materials, consolidated statements of operations, fiscal Q3 2026
The Company Raised Its Own Forecast Three Times
Equipment demand follows customer capital budgets, so how a toolmaker describes its own market is effectively next year's revenue sketch. Applied redrew that sketch three times in fiscal 2026.
In February it guided Semiconductor Systems growth to more than 20% year over year. In May it raised that to more than 30%. On the August call Chief Financial Officer Brice Hill said the "greater than 30% that we highlighted last quarter, I would say is now more than that." Chief Executive Gary Dickerson added that the eight-quarter rolling forecasts customers provide show very strong multi-year demand.
Some of that shows up as counted events rather than adjectives. Customers announced more than ten new fab projects in the quarter alone, and some customer conversations now extend to 2030. On that basis Applied said it will build capacity to double quarterly system output from current levels by 2028, and added more than 1,500 manufacturing and support staff during the quarter.
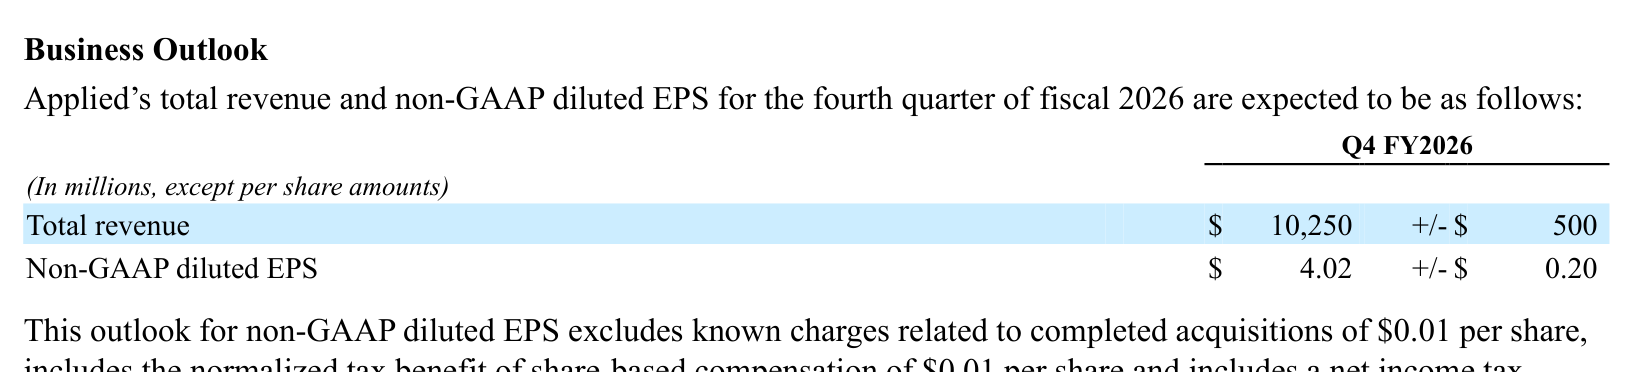
Applied Materials, fiscal 2026 fourth quarter business outlook
The fourth-quarter guide is $10.25 billion plus or minus $500 million in revenue, and $4.02 plus or minus $0.20 in non-GAAP diluted EPS. Year over year that is 51% on revenue and 85% on earnings.
Nine Straight Quarters Above the Guide
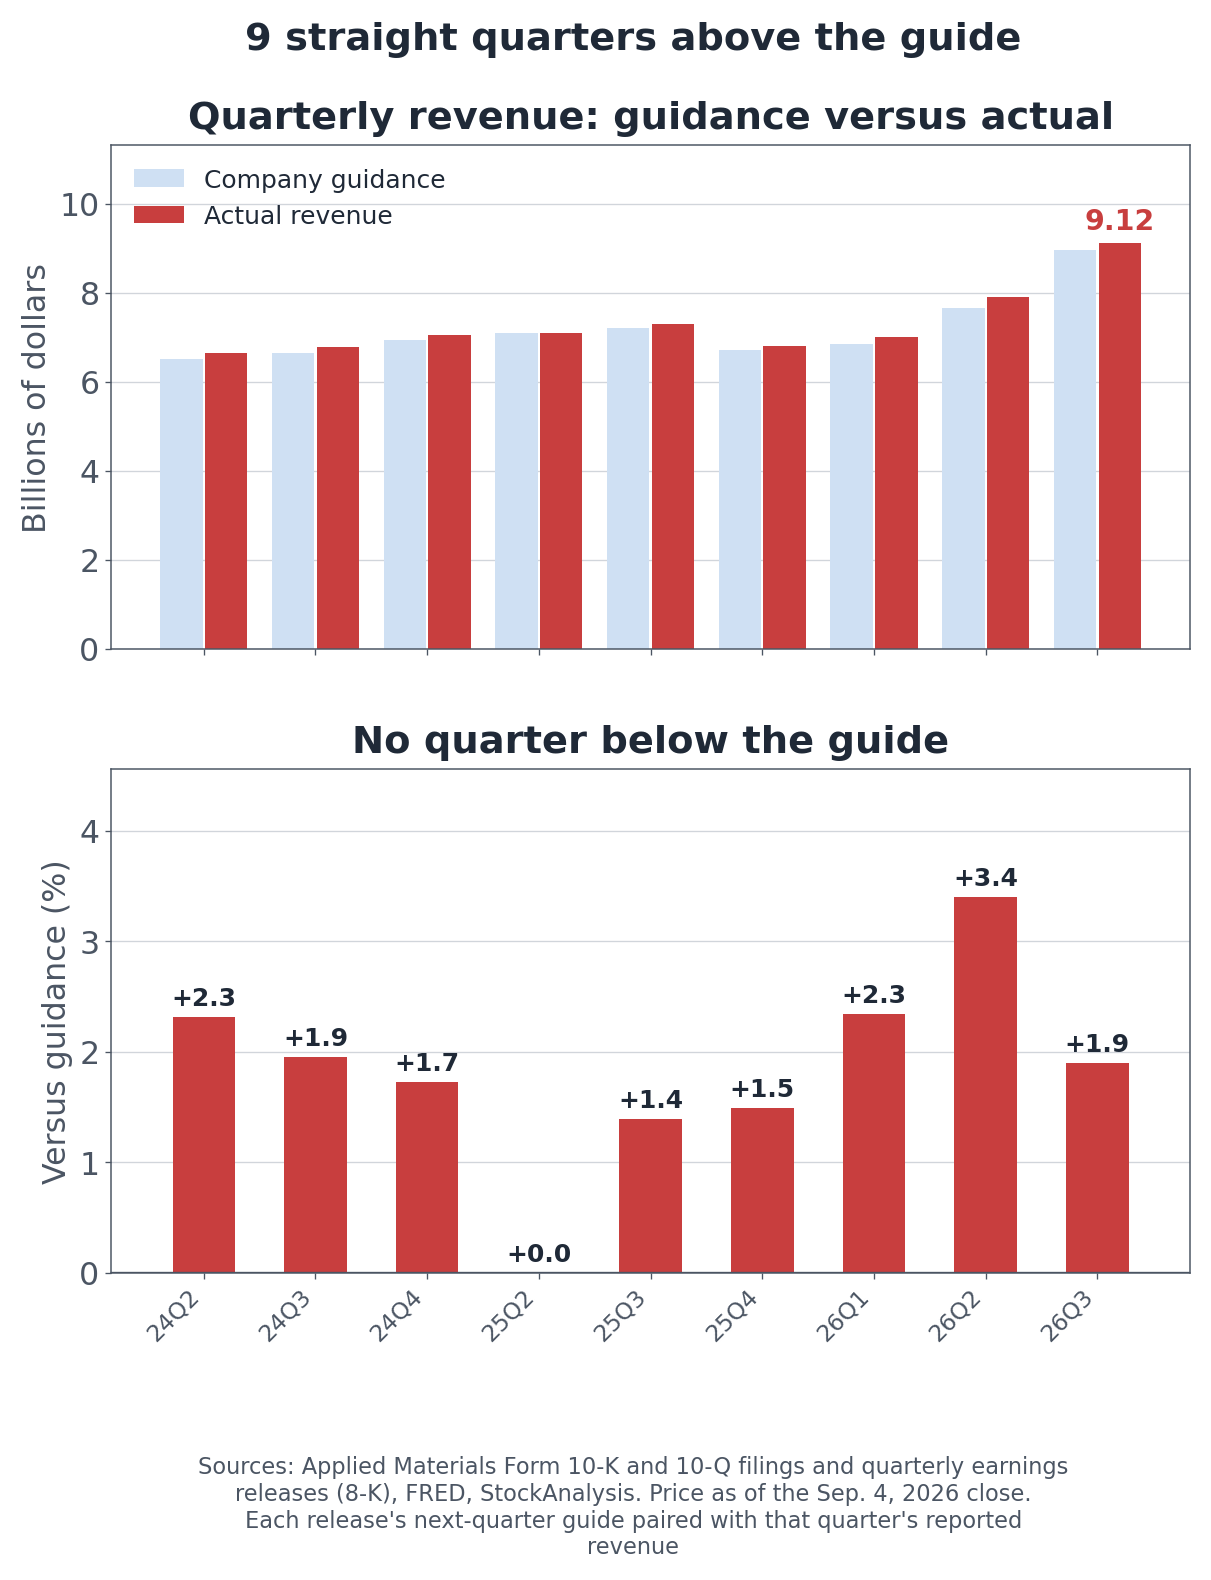
A raised forecast is only as good as the forecaster. I parsed all 13 quarterly earnings releases, pulled the next-quarter revenue guide out of each Business Outlook table, and matched it against what the company actually reported that quarter.
Guided versus actual quarterly revenue, and the beat
Every one of the nine matched quarters came in at or above the guide, by 0.0% to 3.4%.
Quarter
Guide
Actual
Versus guide
Q4 FY25
6,700
6,800
+1.5%
Q1 FY26
6,850
7,010
+2.3%
Q2 FY26
7,650
7,910
+3.4%
Q3 FY26
8,950
9,115
+1.9%
Q4 FY26
10,250
not yet reported
In millions of dollars. Each release's next-quarter guide against that quarter's reported revenue
Non-GAAP EPS beats ran wider, from 2.8% to 9.2% across the same nine quarters. Revenue lands close to the guide and earnings land above it, which says margins keep coming in better than modeled.
Splitting a 2.9x Market Cap Into Two Parts
Market capitalization moves for two reasons: earnings per share change, and the multiple applied to them changes. Trailing EPS is $11.59, up 38.3%, a factor of 1.383. Market cap went up by a factor of 2.899. That leaves 2.096x as re-rating.
Most of the increase in market value came from what the market is willing to pay for a dollar of earnings, not from the dollars themselves. Which is exactly what you would expect if investors are pricing the guided quarters rather than the reported ones.
Why Margins Climbed With Revenue
Operating margin reached 33.7% in the third quarter, up from 25.2% three quarters earlier, and gross margin crossed 50% for the first time at 50.3%.
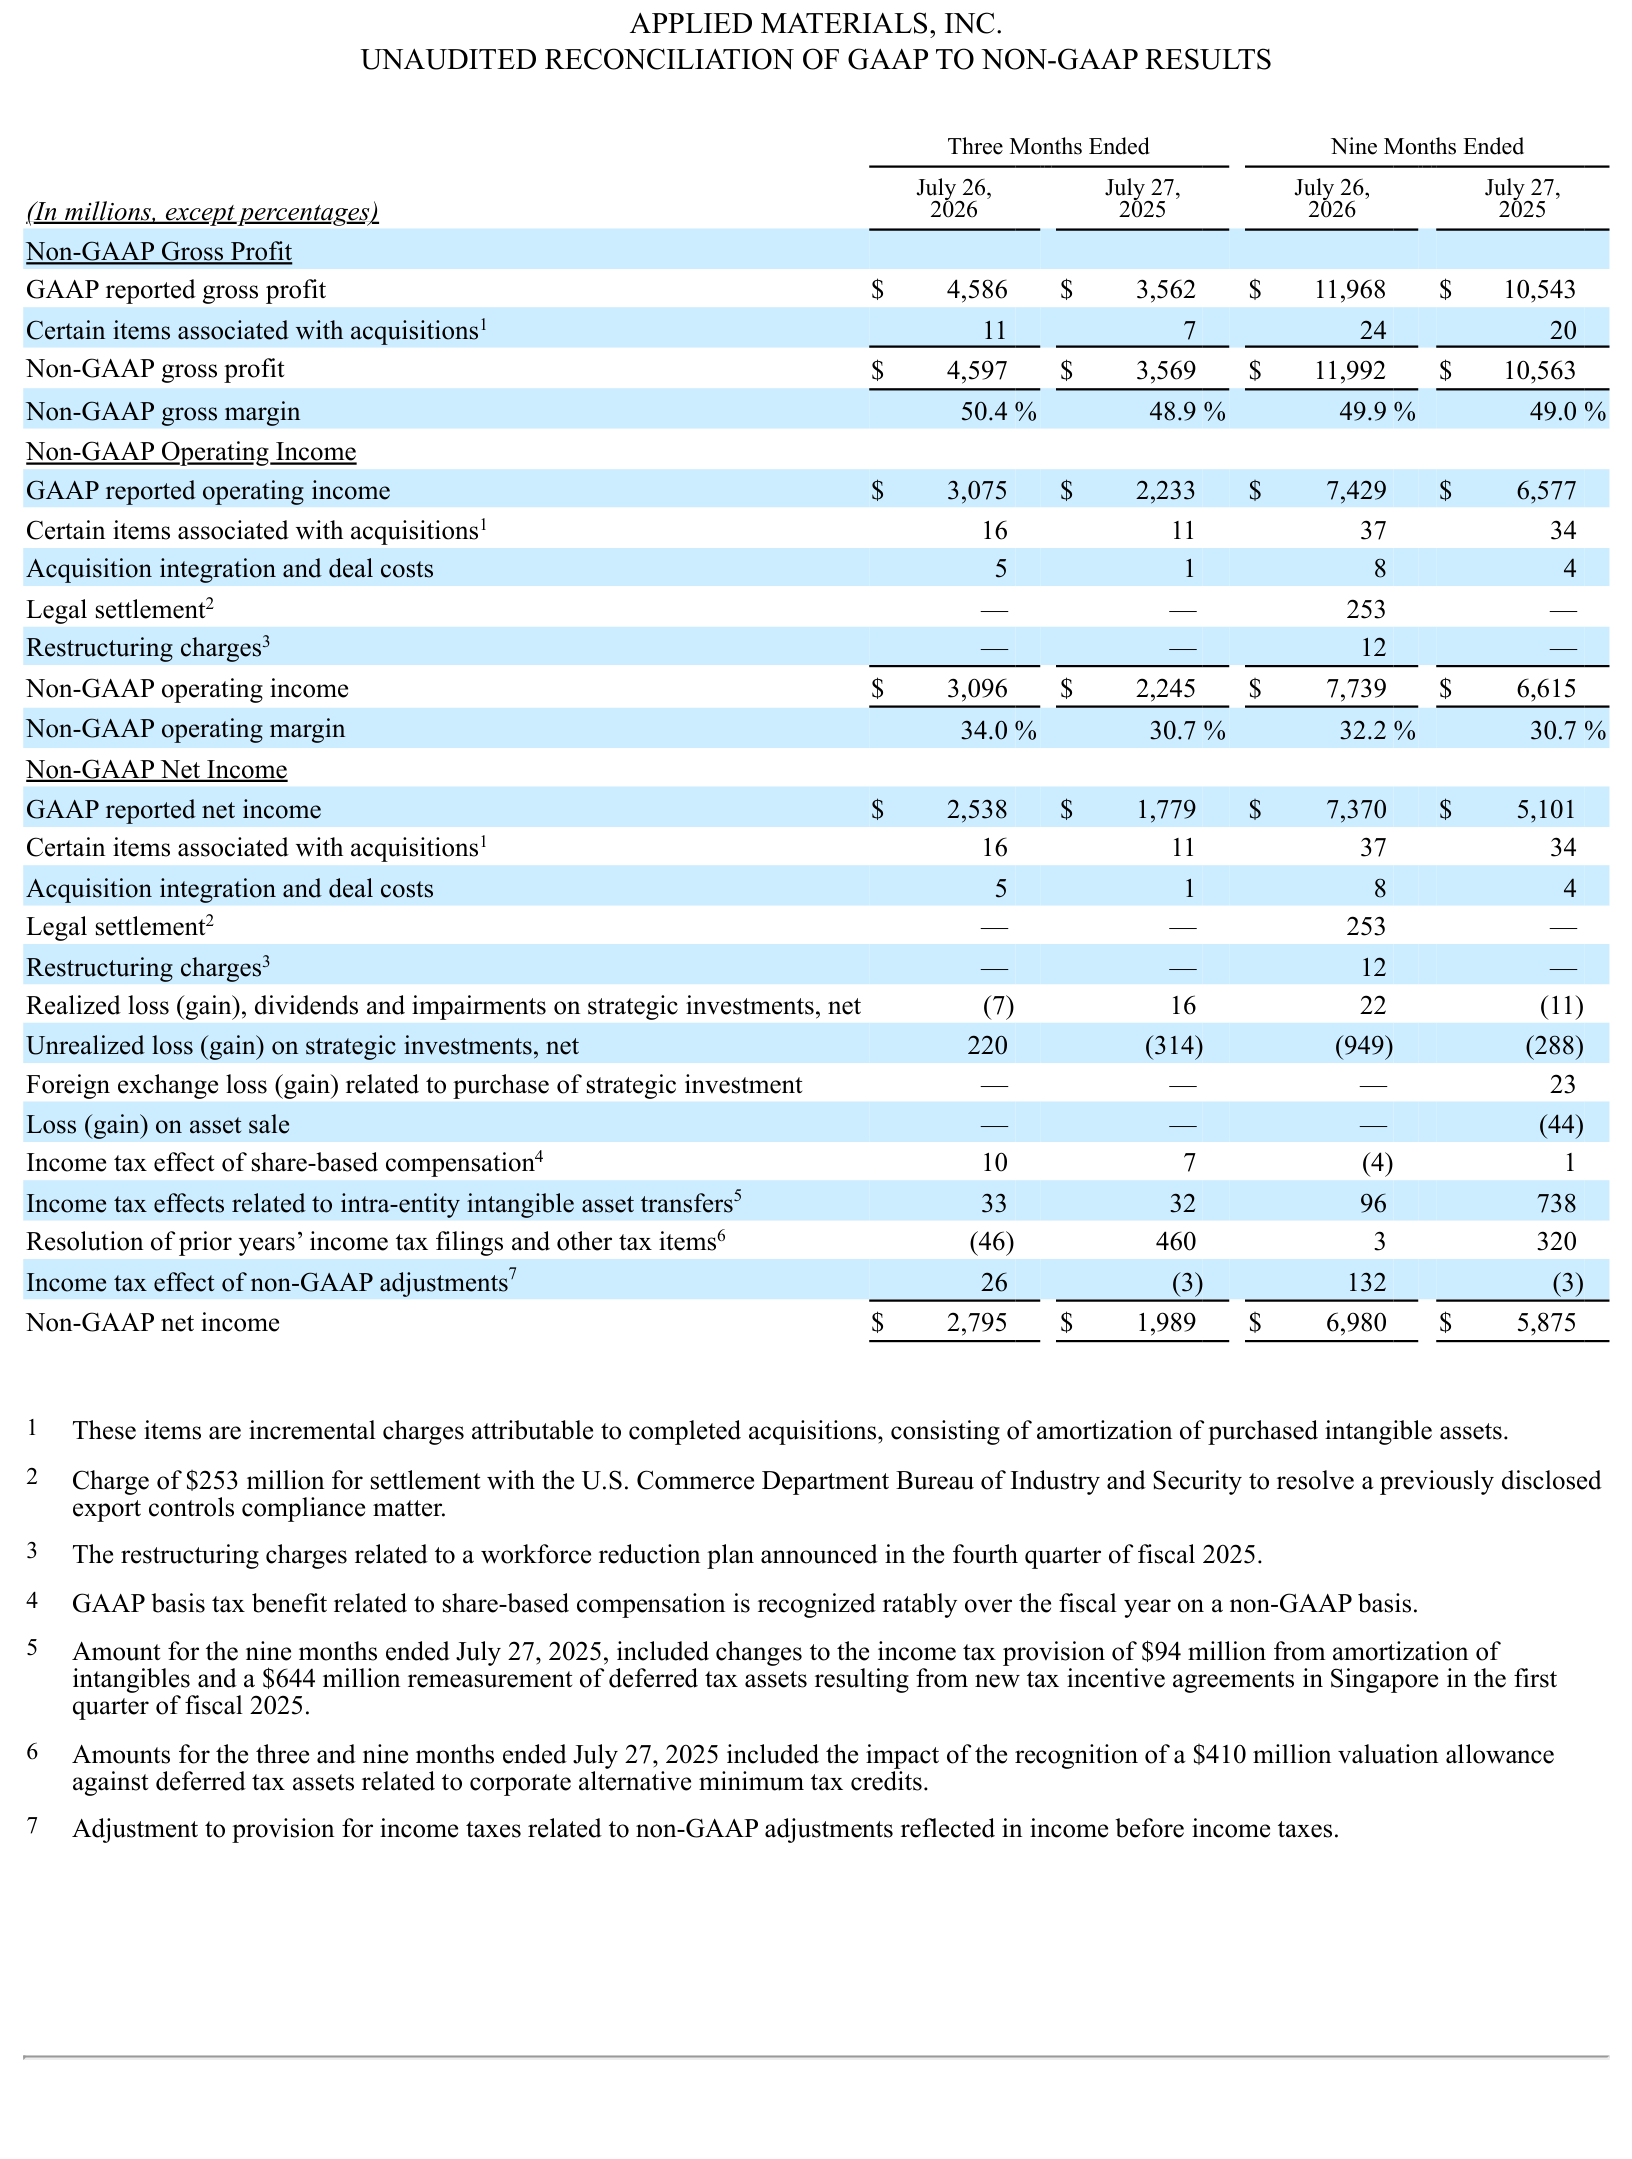
GAAP to non-GAAP reconciliation
The company attributes it to price. On the call Brice Hill said company gross margin has risen roughly 300 basis points over three years, and that one driver was value-based pricing applied across every tool. Input costs rose through the pandemic and supply chain crisis, so Applied reviewed the value of each machine and repriced it.
An analyst pressed on the distinction: every company talks about pricing new tools or expedited service, but Applied was saying prices on the same product were going up. Charging more for a new machine and charging more for the machine you already sold are different claims, and management made the second one.
Two items make the GAAP line noisier than the operating story. The nine-month figures carry a $253 million charge to settle an export controls compliance matter with the U.S. Commerce Department Bureau of Industry and Security, and a $949 million unrealized gain on strategic investments running the other way. Neither came from selling equipment.
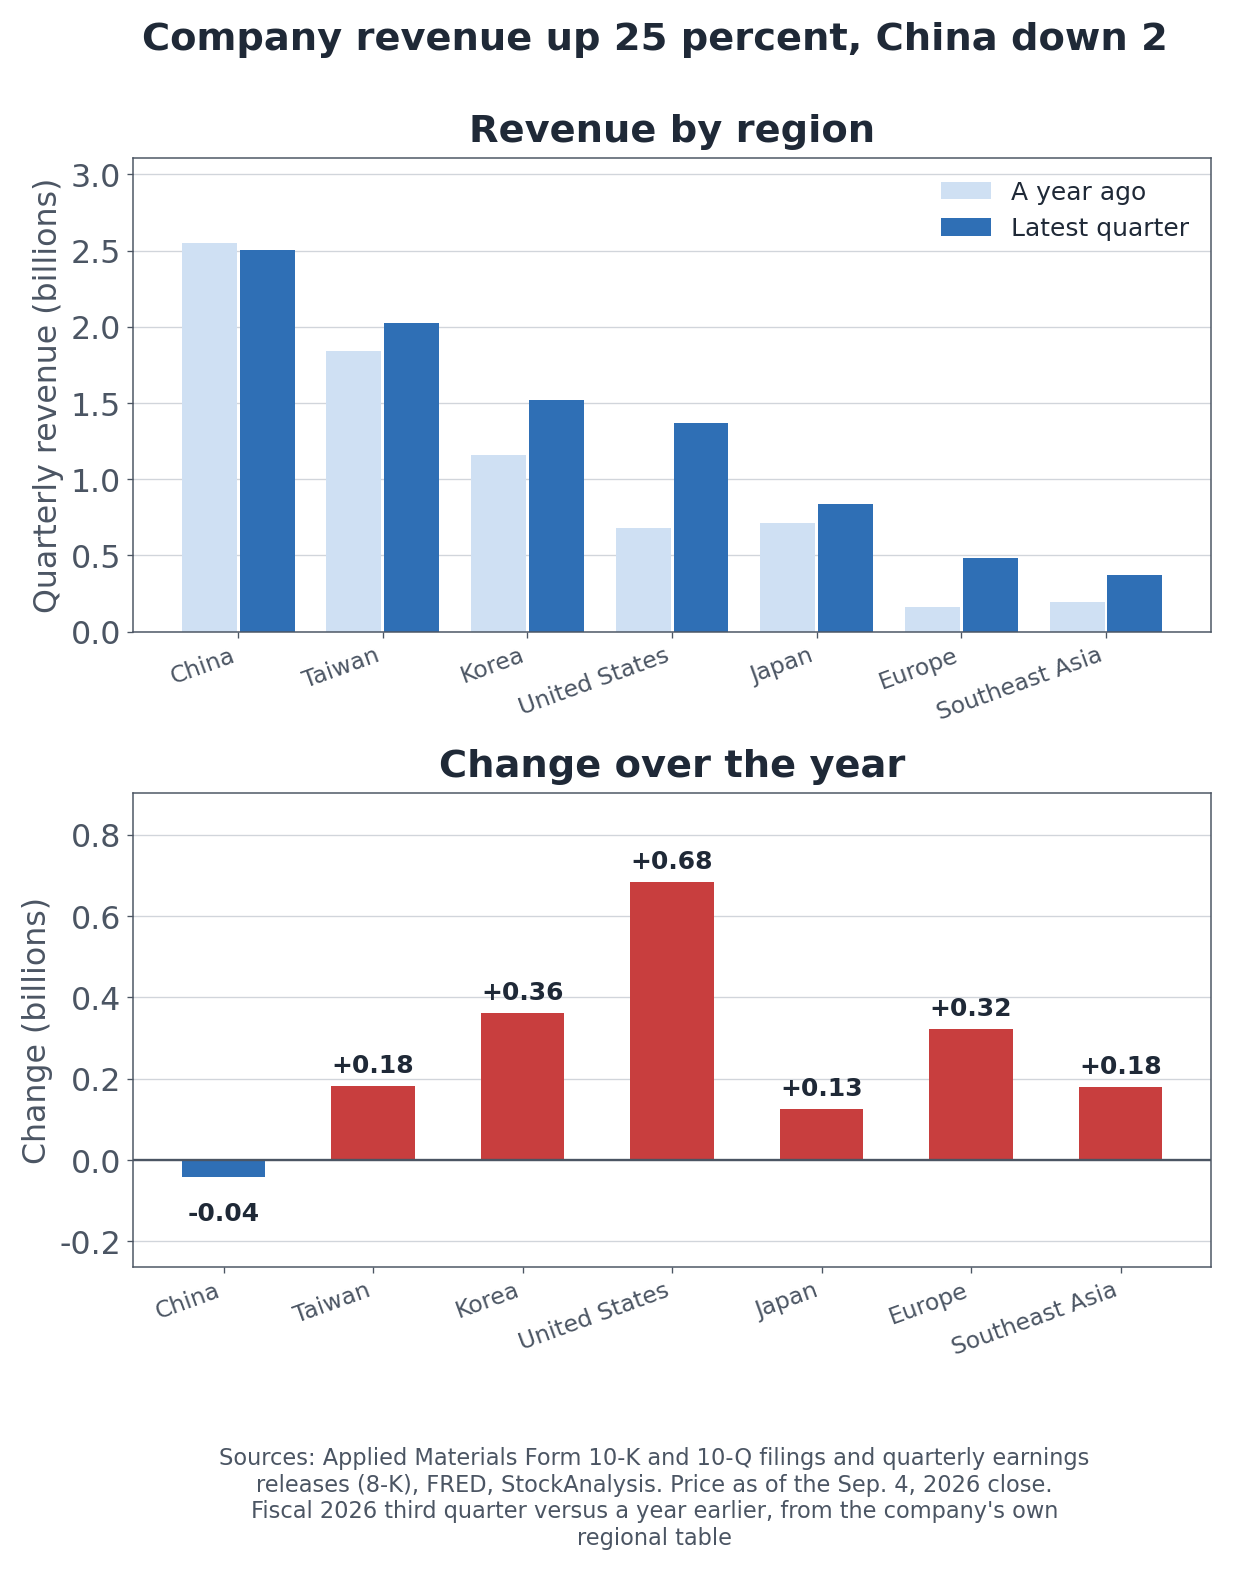
AMAT Revenue by Region: Growth Came From Outside China
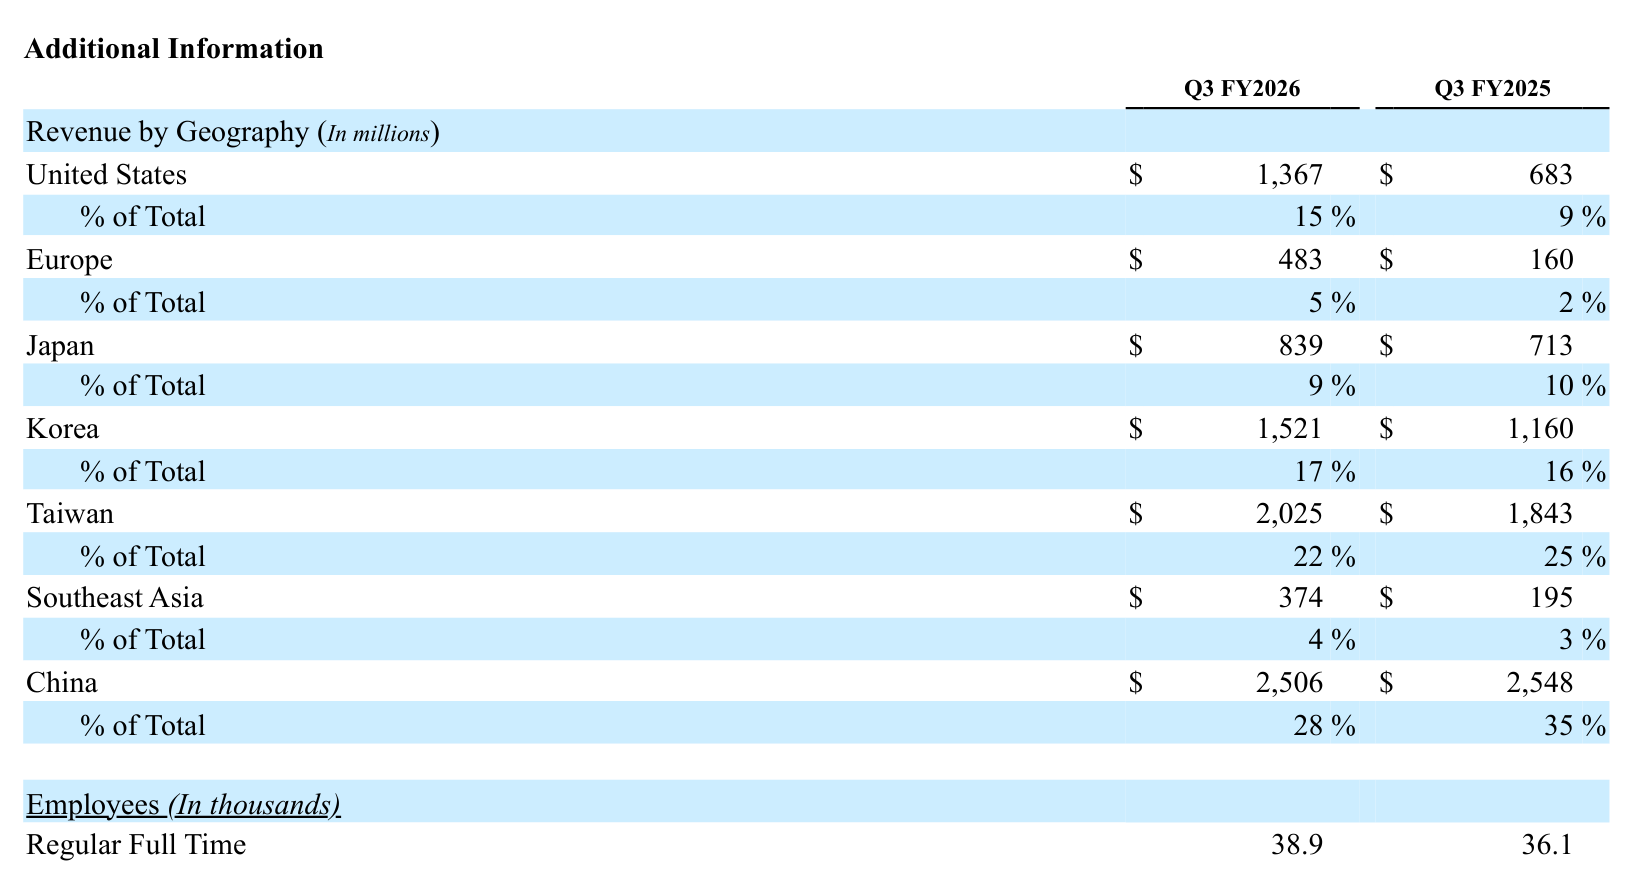
Applied publishes regional revenue in dollars and as a share of total in every release.
Regional revenue and the change over one year
Region
Q3 FY26
Share
Q3 FY25
Share
China
2,506
28%
2,548
35%
Taiwan
2,025
22%
1,843
25%
Korea
1,521
17%
1,160
16%
United States
1,367
15%
683
9%
Japan
839
9%
713
10%
Europe
483
5%
160
2%
Southeast Asia
374
4%
195
3%
In millions of dollars. Shares as published by the company
Total revenue grew by $1.81 billion while China fell $42 million. The entire increase came from outside China. The United States doubled from 683 to 1,367, Europe tripled from 160 to 483, and Southeast Asia nearly doubled.
Applied Materials, revenue by geography
China's share fell from 35% to 28%. On the call management cited 26%, which counts Semiconductor Systems and services only and excludes Display, so the two figures answer slightly different questions. Both point the same way.
Management still expects China revenue to grow this year, led by investment in 28-nanometer foundry logic. That is mature-node work, not leading edge, which is where the export rules draw their line.
Semiconductor Equipment Market Outlook
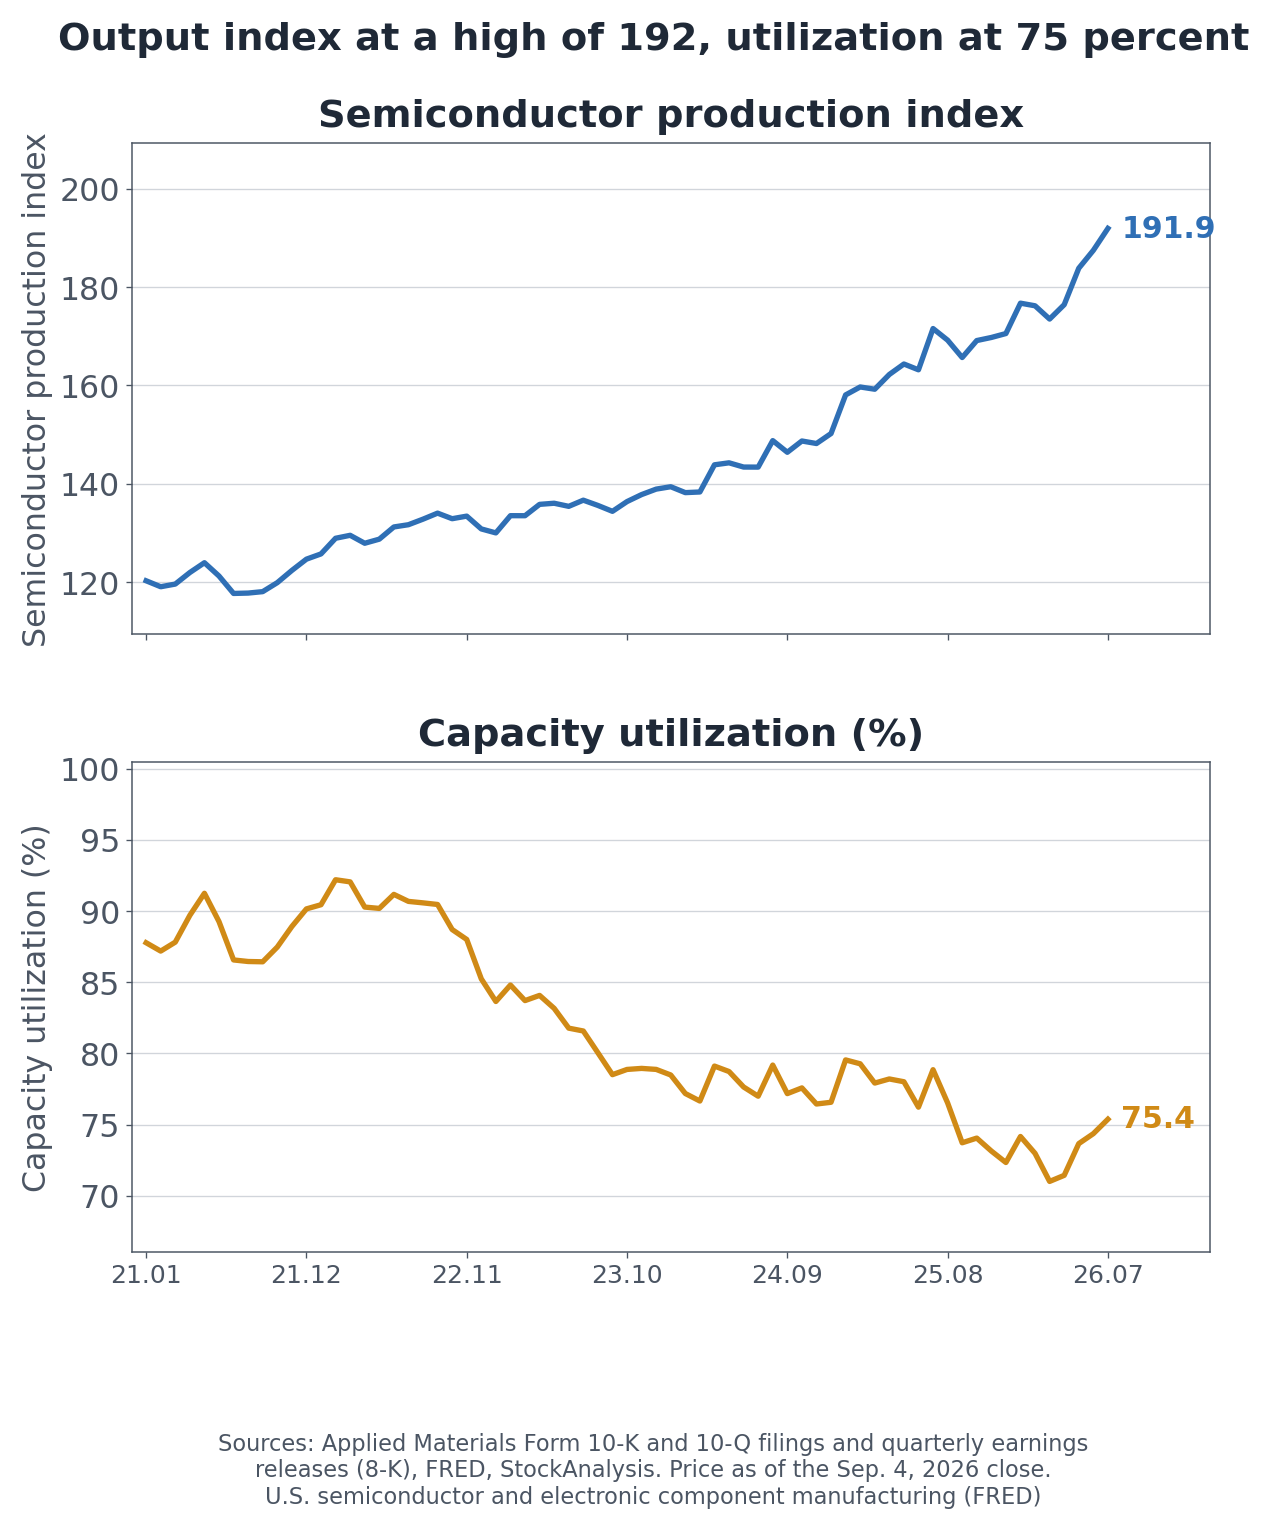
Tool demand sits downstream of chip output. The U.S. semiconductor and electronic component production index reached 191.9 in July 2026, more than 60% above its level five years earlier.
U.S. semiconductor production index and capacity utilization
Capacity utilization in the same industry is 75.4%, down from the low 90s at the end of 2021. Output at a record while utilization sits low means capacity grew faster than production did, and the companies that built that capacity are toolmakers like Applied. If utilization climbs from here it argues for the next investment cycle; if it stays low it argues for overbuild. The same number reads both ways, which is why it is worth checking each quarter rather than deciding once.
Competition splits by process step. ASML is close to a monopoly in lithography, Lam Research leads in etch, KLA in metrology and inspection. Applied is the broad player anchored in deposition, and this quarter it reported records in PVD, CVD and epitaxy on the deposition side and in etch and CMP on the removal side.
Is Applied Materials Stock Expensive? Two Multiples
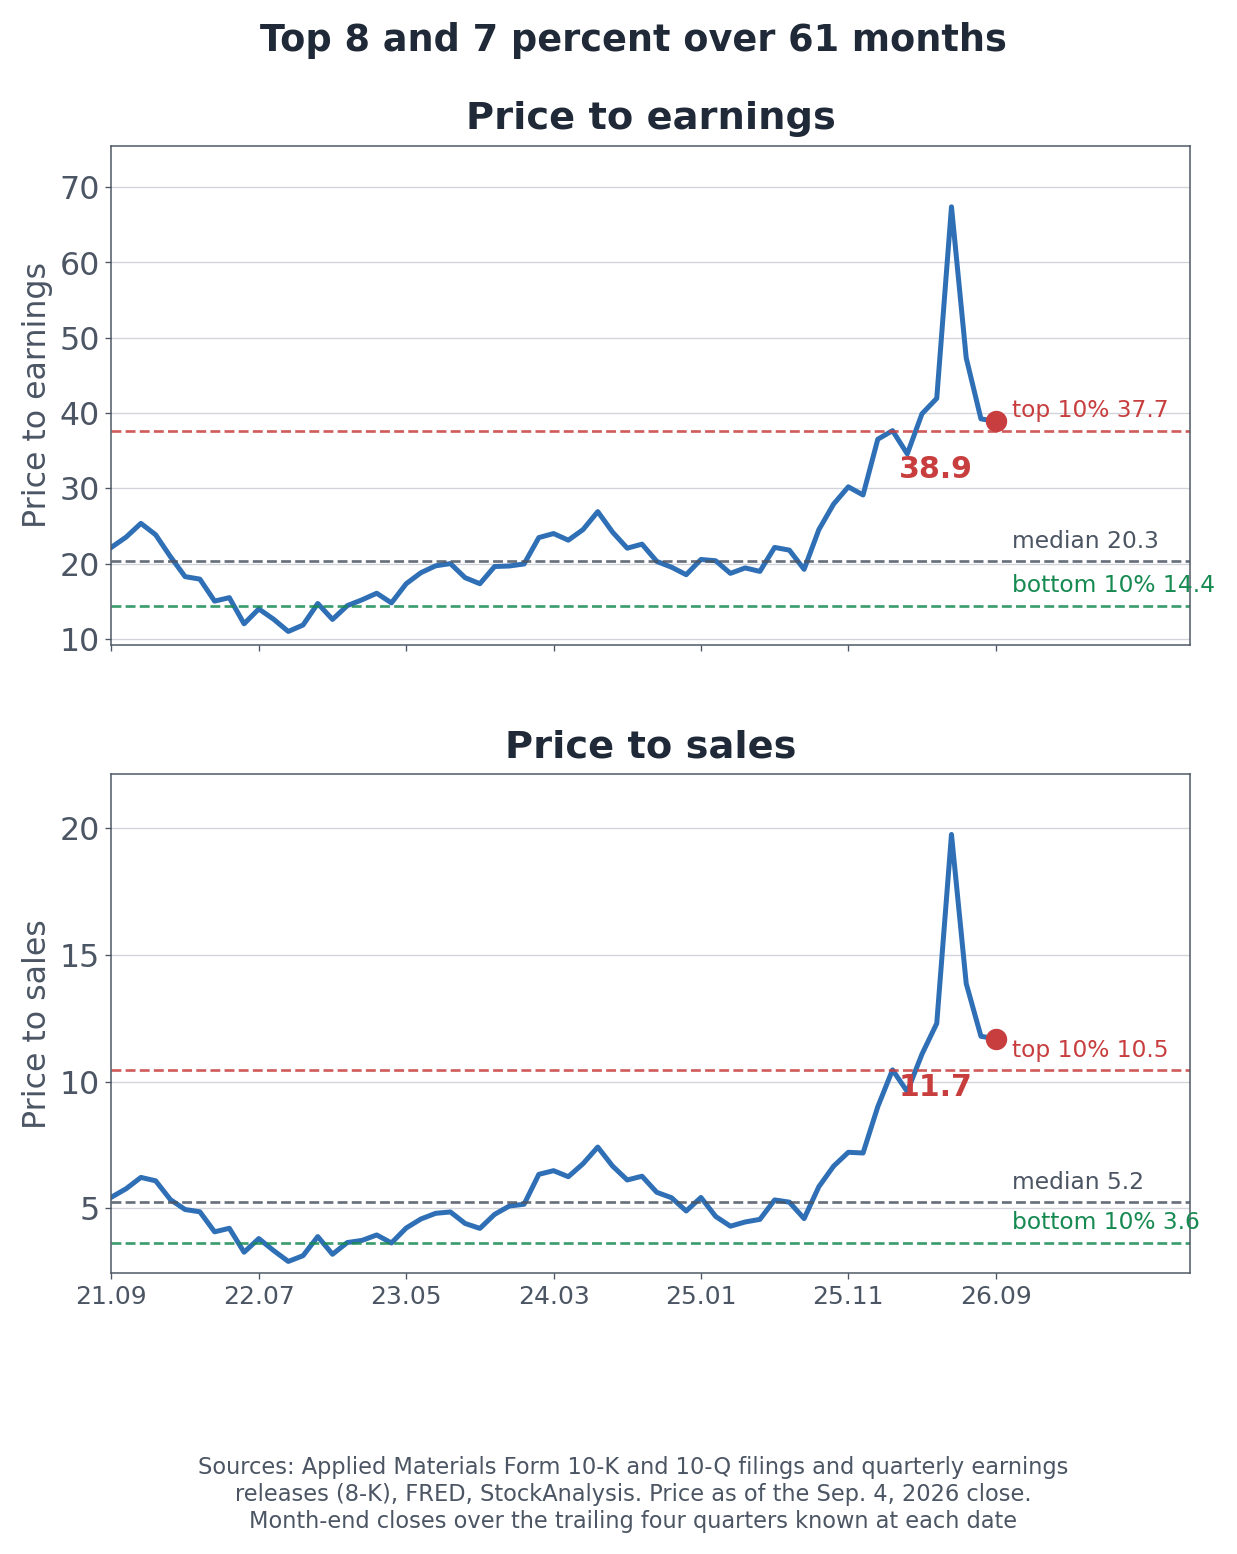
Using the September 4 close of $454.71, I measured multiples over 61 month-end closes, dividing each month's price by the trailing four quarters reported as of that date.
Price to earnings and price to sales over 61 months
Price to earnings is 38.9x against a 20.3x median, in the top 8% of the range. Price to sales is 11.7x against a 5.2x median, top 7%. Price to book is 14.1x, also top 8%.
All three have come down from a peak. In mid-2026 the earnings multiple reached 67.4x and the sales multiple 19.8x. The share price is well below where it stood then, while results kept setting records through the same stretch.
Industry medians tell a different story. One aggregator puts Applied's earnings multiple at 41.7x against a semiconductor equipment industry median of 42.0x. Expensive against its own history, ordinary against its peer group. The two yardsticks are answering different questions rather than contradicting each other.
AMAT Price Targets and Analyst Revisions
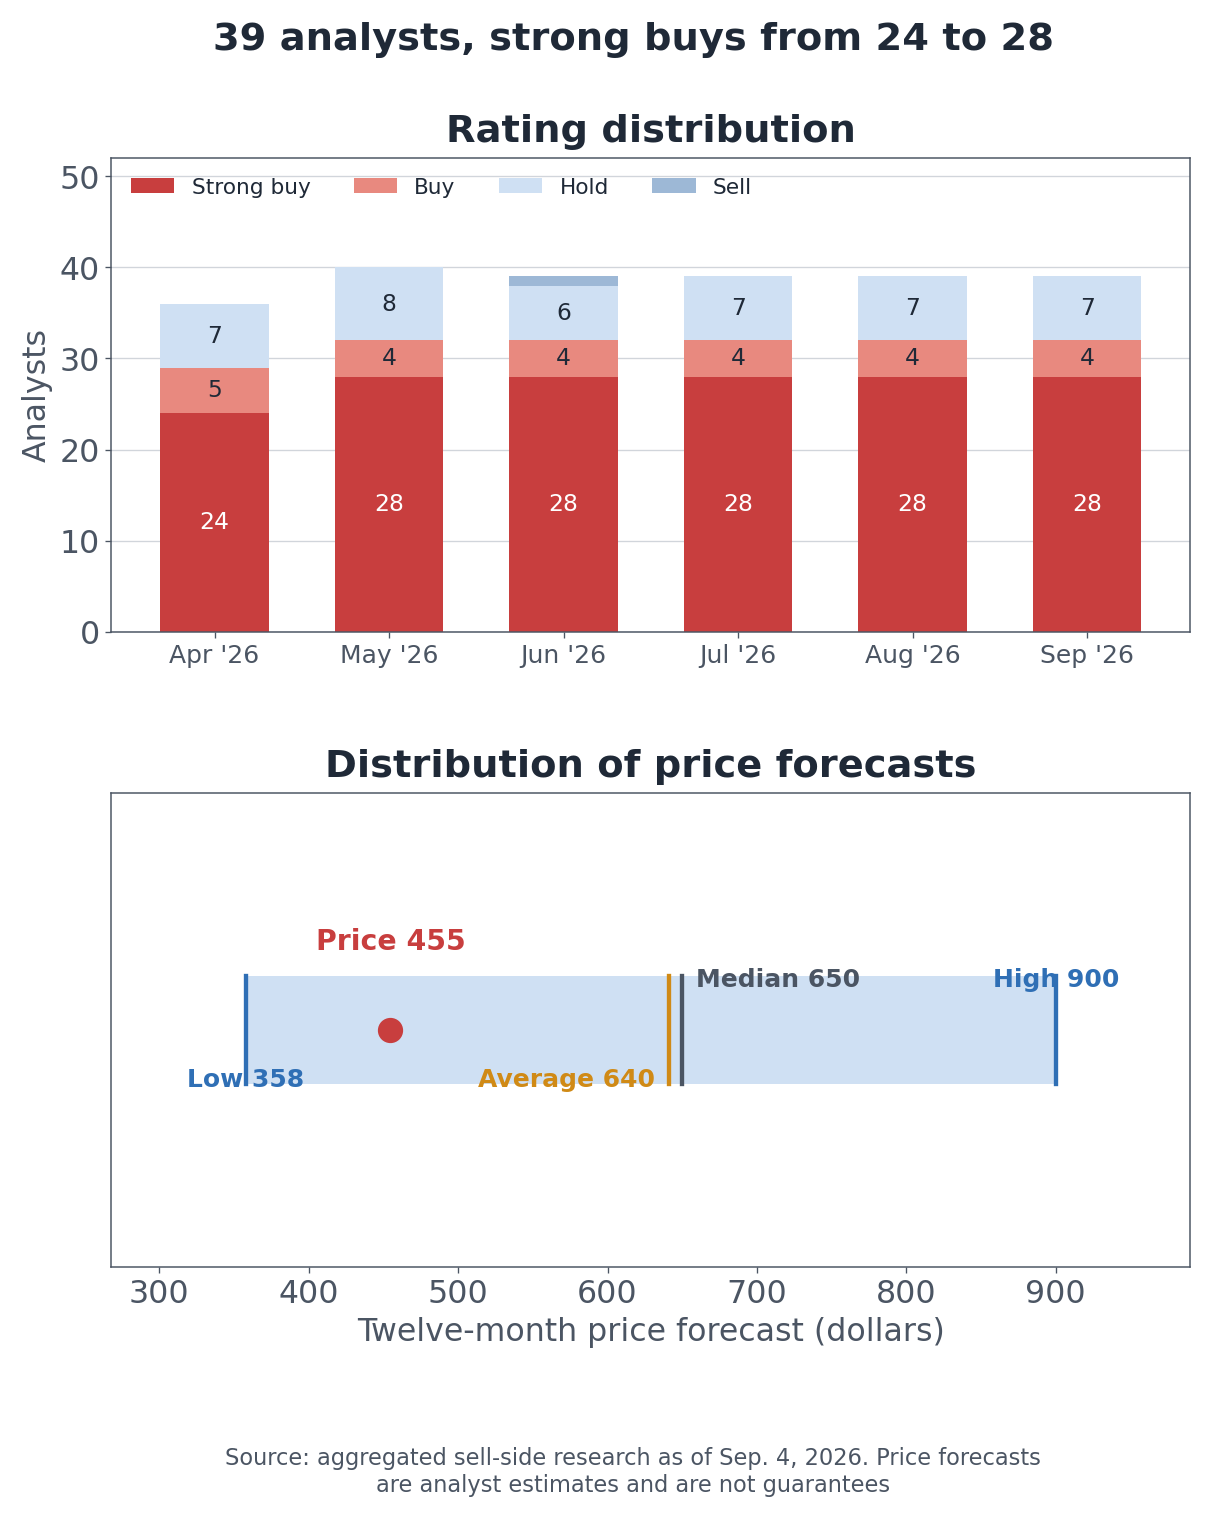
Aggregated sell-side research covering 39 analysts rates the stock a strong buy with an average twelve-month price target of $640.89 and a median of $650. The range runs from $358 to $900. A second aggregator covering 53 analysts averages $628.
Rating distribution and the spread of price targets
Consensus (as of September 4, 2026)
Value
Analysts covering
39 (second aggregator: 53)
Average / median price target
$640.89 / $650
Target range
$358 to $900
Fiscal 2026 revenue estimate
$34.25B (+20.8%)
Fiscal 2027 revenue estimate
$46.13B (+34.7%)
Fiscal 2026 EPS estimate
$12.79 (+35.8%)
Strong buy ratings went from 24 in April to 28 in September, with sell ratings essentially absent. Over the last 90 days there were zero rating upgrades, 15 reiterations and 12 target changes: analysts are leaving the call alone and moving the number.
Firm
Date
Rating
Prior target
New target
Bernstein
September 3
Buy, maintained
$700
$700
Goldman Sachs
September 1
Buy, maintained
$670
$670
UBS
September 1
Buy, maintained
$675
$695
Mizuho Securities
August 25
Buy, reiterated
$650
$590
Argus Research
August 18
Buy, maintained
$500
$600
Source: aggregated sell-side research. Price targets are analyst estimates and are not guarantees of future performance.
The consensus revenue estimates close the loop on the opening question: +20.8% this fiscal year and +34.7% next. Those describe the same company whose trailing revenue grew 7.8%.
AMAT Valuation vs. ASML, Lam Research, KLA and Teradyne
Company (Ticker)
Latest quarterly revenue
P/E
P/S
P/B
Applied Materials (AMAT)
$9.12B
39.2x
11.7x
14.1x
ASML
$9.33B
54.0x
16.3x
26.3x
Lam Research (LRCX)
$6.72B
53.4x
16.6x
30.9x
KLA (KLAC)
$3.66B
50.7x
17.9x
38.2x
Teradyne (TER)
$1.33B
49.0x
12.5x
16.2x
Applied belongs in the cyclical bucket with mature large-cap characteristics, so the tests that matter are margin quality, shareholder payout, and where the company sits in the cycle.
Deep comparison
Operating margin
ROE
Payout (dividend yield)
Revenue index (12Q)
Applied Materials
33.7%
41.1%
0.47%
116
ASML
37.1%
53.9%
0.45%
137
Lam Research
37.4%
65.1%
0.34%
133
KLA
42.5%
87.5%
0.50%
129
Teradyne
33.2%
36.5%
0.15%
156
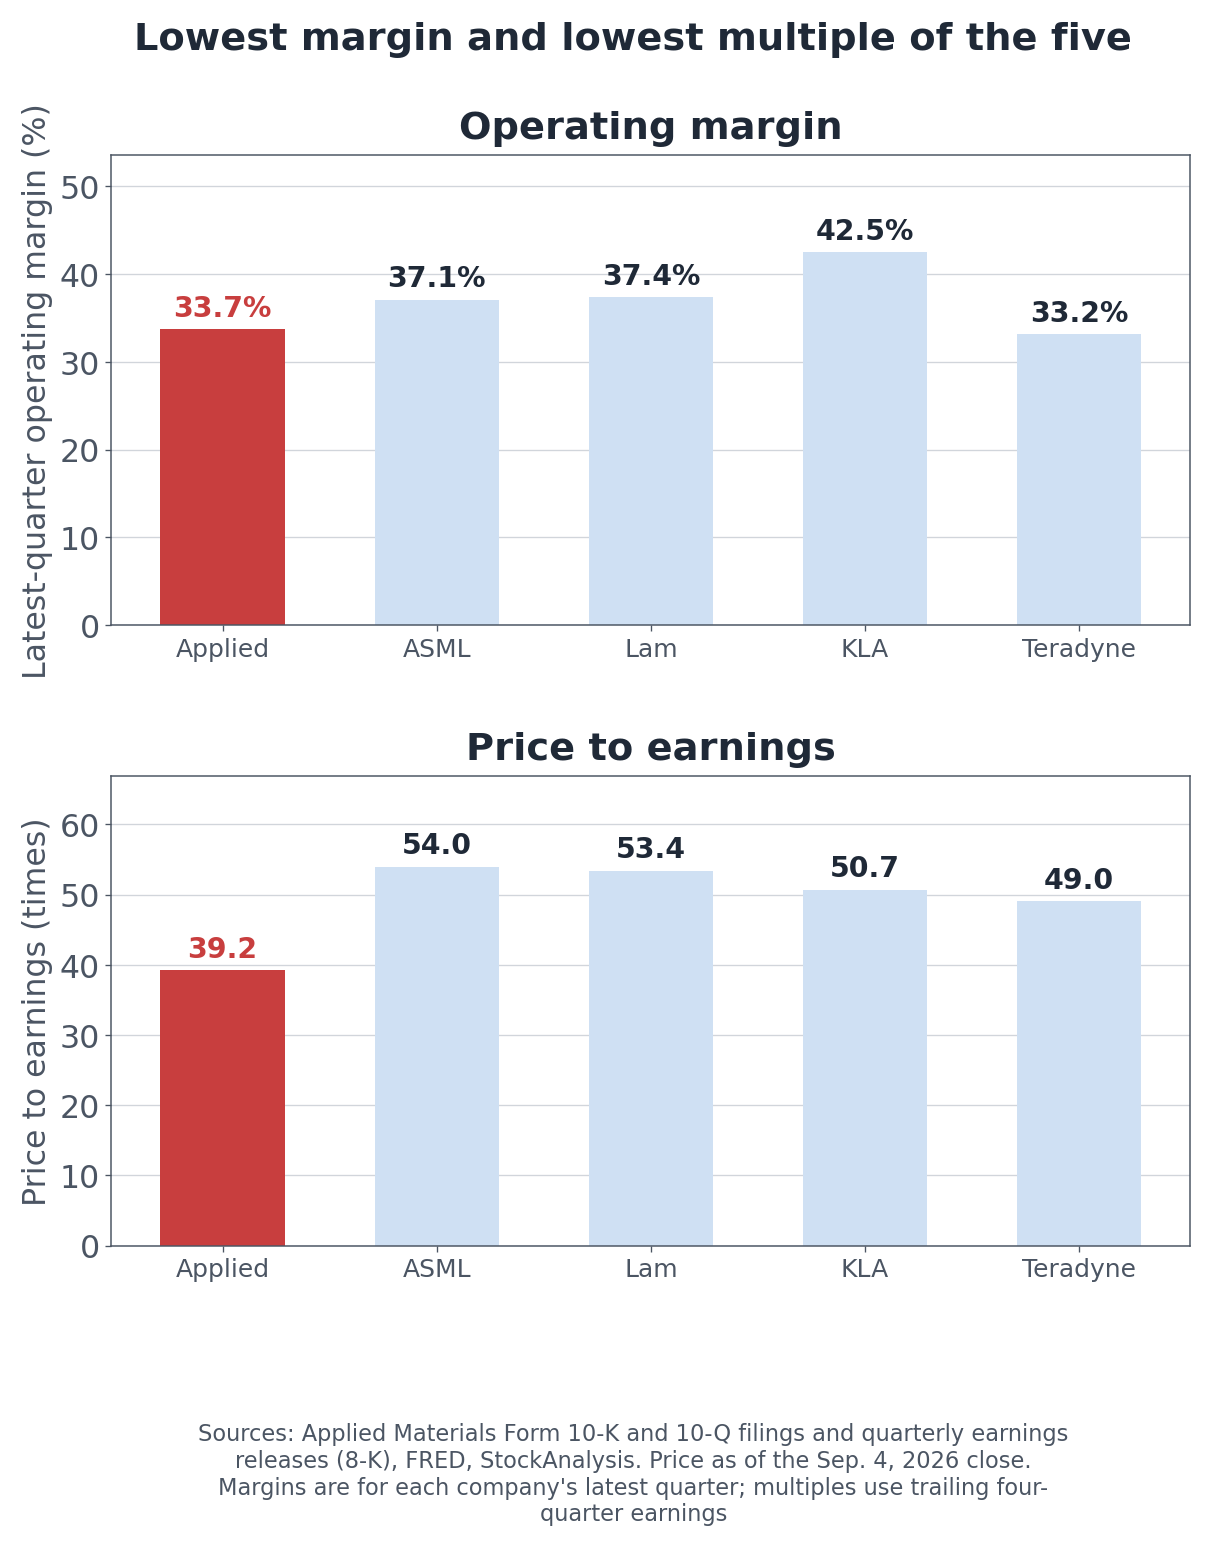
Operating margin and price to earnings across five equipment makers
Applied carries the lowest earnings multiple of the five at 39.2x, and close to the lowest operating margin at 33.7%. KLA earns 42.5% and trades at 50.7x; ASML earns 37.1% and trades at 54.0x. In this group the multiple ordering broadly follows the margin ordering, and Applied sits where its margin puts it.
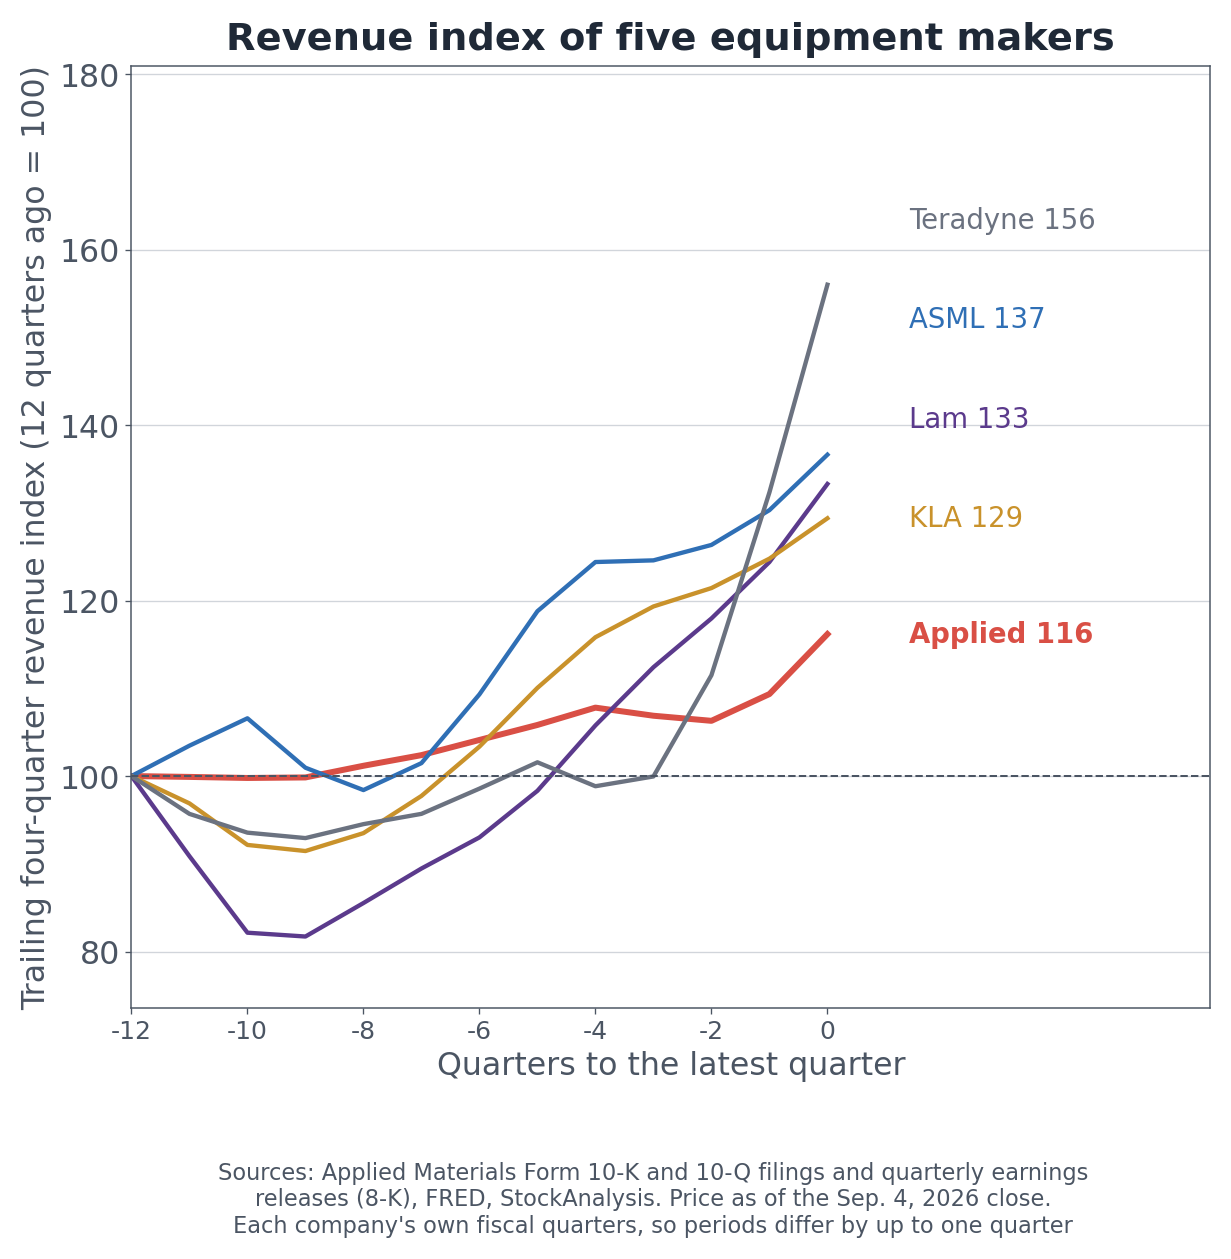
Trailing four-quarter revenue index for five equipment makers
Cycle position points the same direction. Indexing trailing four-quarter revenue to 100 twelve quarters ago gives Teradyne 156, ASML 137, Lam 133, KLA 129 and Applied 116. Applied recovered last. Read the other way, that is also the company whose acceleration started most recently, and the reason for the low multiple and the room ahead are the same fact.
Key Risks and What to Watch in November
The first risk is the cycle itself. Band amplitude over 61 months is 6.1x on earnings and 6.8x on sales, against roughly 2x for the mature large caps covered in this series. The 61-month low on the earnings multiple was 11.0x, which is how far this industry can travel.
The second is China and regulation. China is still 28% of revenue, and the nine-month accounts carry that $253 million export controls settlement. The rules currently separate mature nodes from leading edge, so the character of China revenue is changing rather than simply shrinking.
The third is the weight of the forecast. A guided +51% quarter and consensus at +34.7% next year are already in the price. Nine consecutive beats are the evidence behind that trust, but a record does not guarantee the tenth.
Three things to watch:
Fourth quarter and fiscal year results in mid-November. Clearing $10.25 billion makes it ten straight. A first miss would itself be the story.
The DRAM share of Semiconductor Systems. It moved from 22% to 26% over the year, and management expects a substantial second-half step up. That share is the HBM cycle's thermometer.
China revenue and its share. Whether the dollar figure holds near $2.5 billion and whether the share falls below 28%. Management expects China revenue to grow this year, so that forecast gets tested too.
The distance between 7.8% and 2.9x is the market pricing the next four quarters instead of the last four. Nobody knows those four quarters better than the company does, and the company has been right about them nine times running. The tenth arrives in November.
Figures come from Applied Materials' SEC filings (Form 10-K for fiscal 2025 and Form 10-Q for fiscal Q3 2026), the quarterly earnings releases filed as 8-K exhibits, and the fiscal Q3 2026 earnings call. All 13 earnings releases available in the company's recent filing history were parsed in full to build the guidance-versus-actual series; the guidance wording changes across years, so three separate formats were handled. Regional and market-mix figures come from the segment tables in each report. Industry data are the Federal Reserve Bank of St. Louis series for U.S. semiconductor and electronic component production and capacity utilization. Valuation multiples divide each month-end close by the trailing four quarters reported as of that date, across 61 months. Consensus figures are aggregated sell-side estimates as of September 4, 2026, cross-checked against a second aggregator. Peer metrics use each company's own fiscal quarters, so periods can differ by up to one quarter.
This article is for information only and is not investment advice. Last updated: September 6, 2026.