Growing 12.7% at 14x Trailing Earnings
- Adobe (NASDAQ: ADBE) grew fiscal Q2 2026 revenue +12.7% year over year to $6.62 billion, yet the stock trades at 14.2x trailing GAAP earnings, the bottom 5% of its own 60-month range. This ADBE stock analysis works through what the company deleted from its own filings, how its two reporting segments actually grew, why only the asset multiple still sits above the industry median, and what the sell-side has done with price targets in the ten days since the CEO announcement.
- Here is the part that does not show up in a screener. Between fiscal Q3 2025 and fiscal Q1 2026, Adobe removed the words "Creative Cloud" from its quarterly earnings releases and swapped its reporting structure from products to customer groups. On September 2, 2026, the board named Anil Chakravarthy, who runs the customer experience side of the house, as the next chief executive. The same day, the president of the Creativity and Productivity business told the company he was leaving.
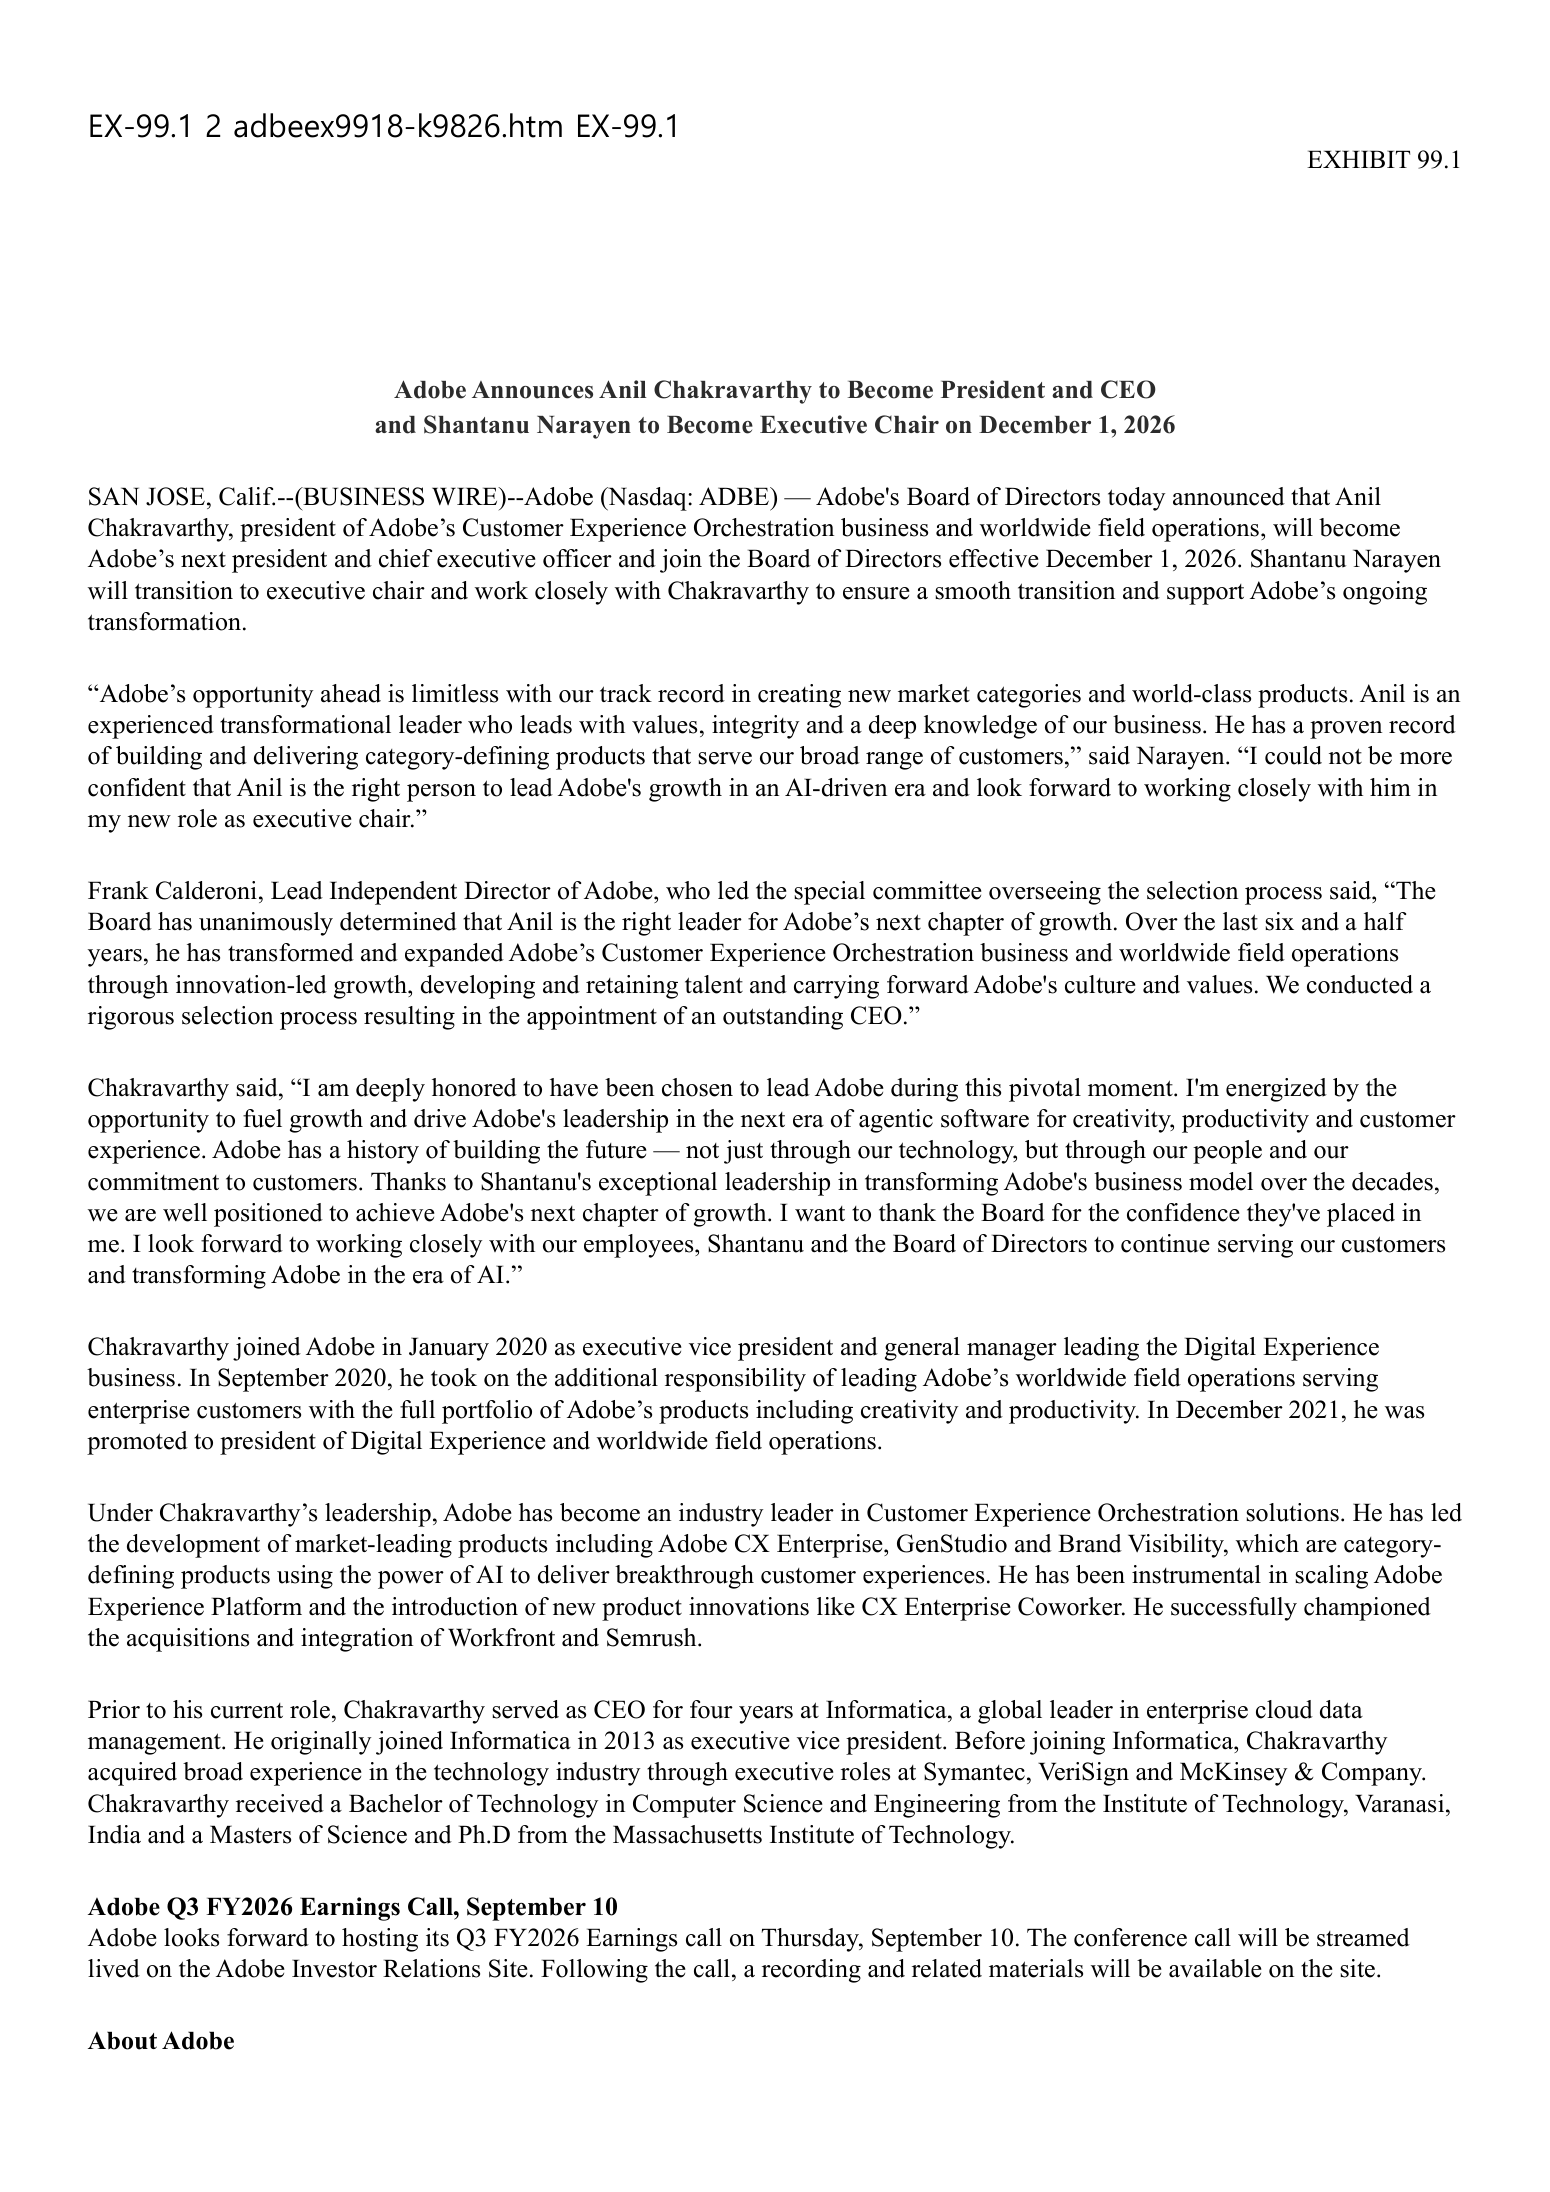
- The names and the people point one way. The revenue points the other. Digital Media, the segment whose name disappeared, compounded at 11.2% a year from fiscal 2022 to fiscal 2025. Digital Experience, the segment that supplied the new leadership, compounded at 9.9%.
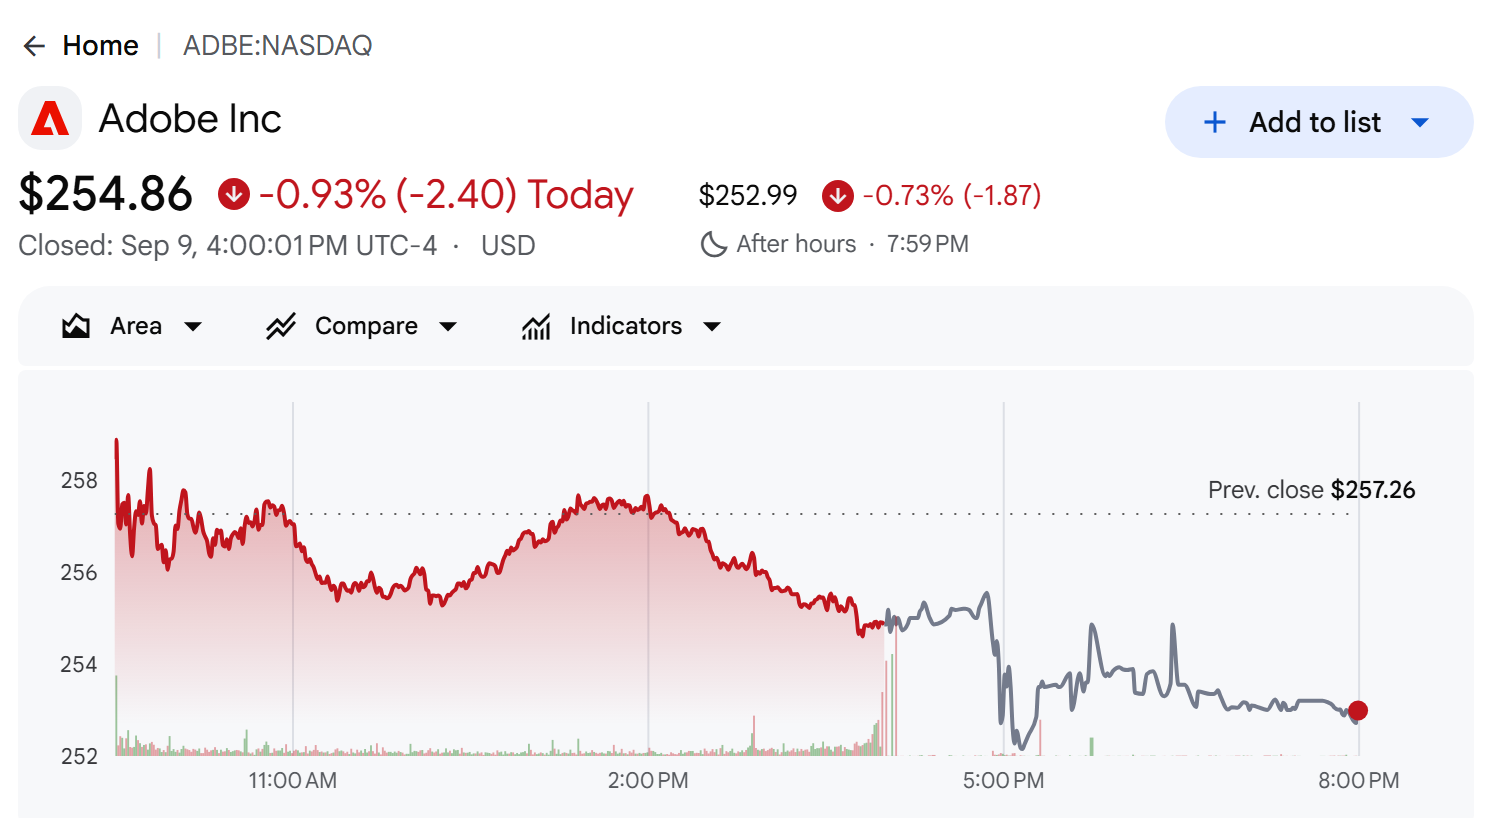
- Market capitalization is $101.3 billion, price to earnings 14.2x, price to sales 4.07x, price to book 8.91x. All figures are as of the September 9, 2026 close of $254.86, and all multiples use GAAP trailing twelve month (TTM) results unless stated otherwise.
- One timing note before the numbers. Adobe reports fiscal Q3 2026 on September 10, 2026, the day after this analysis is dated. Everything below is pre-print.
What Adobe Erased From Its Earnings Releases
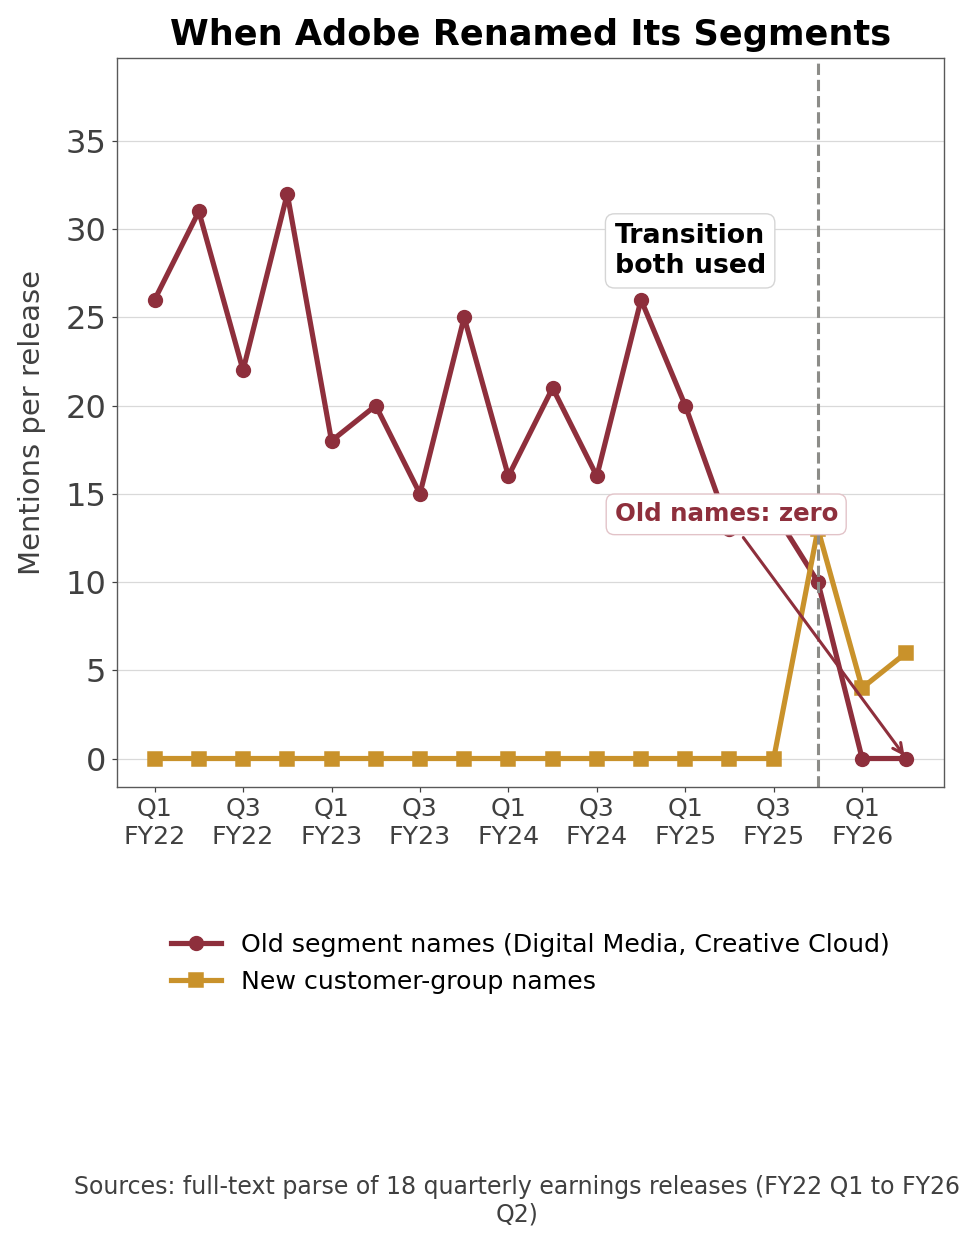
- Own calculation (18 quarterly earnings releases, fiscal Q1 2022 to fiscal Q2 2026): I counted how many times each segment name appears in each document. "Creative Cloud" and "Document Cloud" together show up nine times in the fiscal Q1 2022 release.
- By the fiscal Q3 2025 release, both terms appear zero times. The segment names themselves lasted one quarter longer. The fiscal Q4 2025 release is the only document in the series that carries both systems side by side: the old segment names ten times, the new customer group names thirteen. From fiscal Q1 2026 onward, the old segment names appear zero times, and they have stayed at zero for two consecutive quarters.
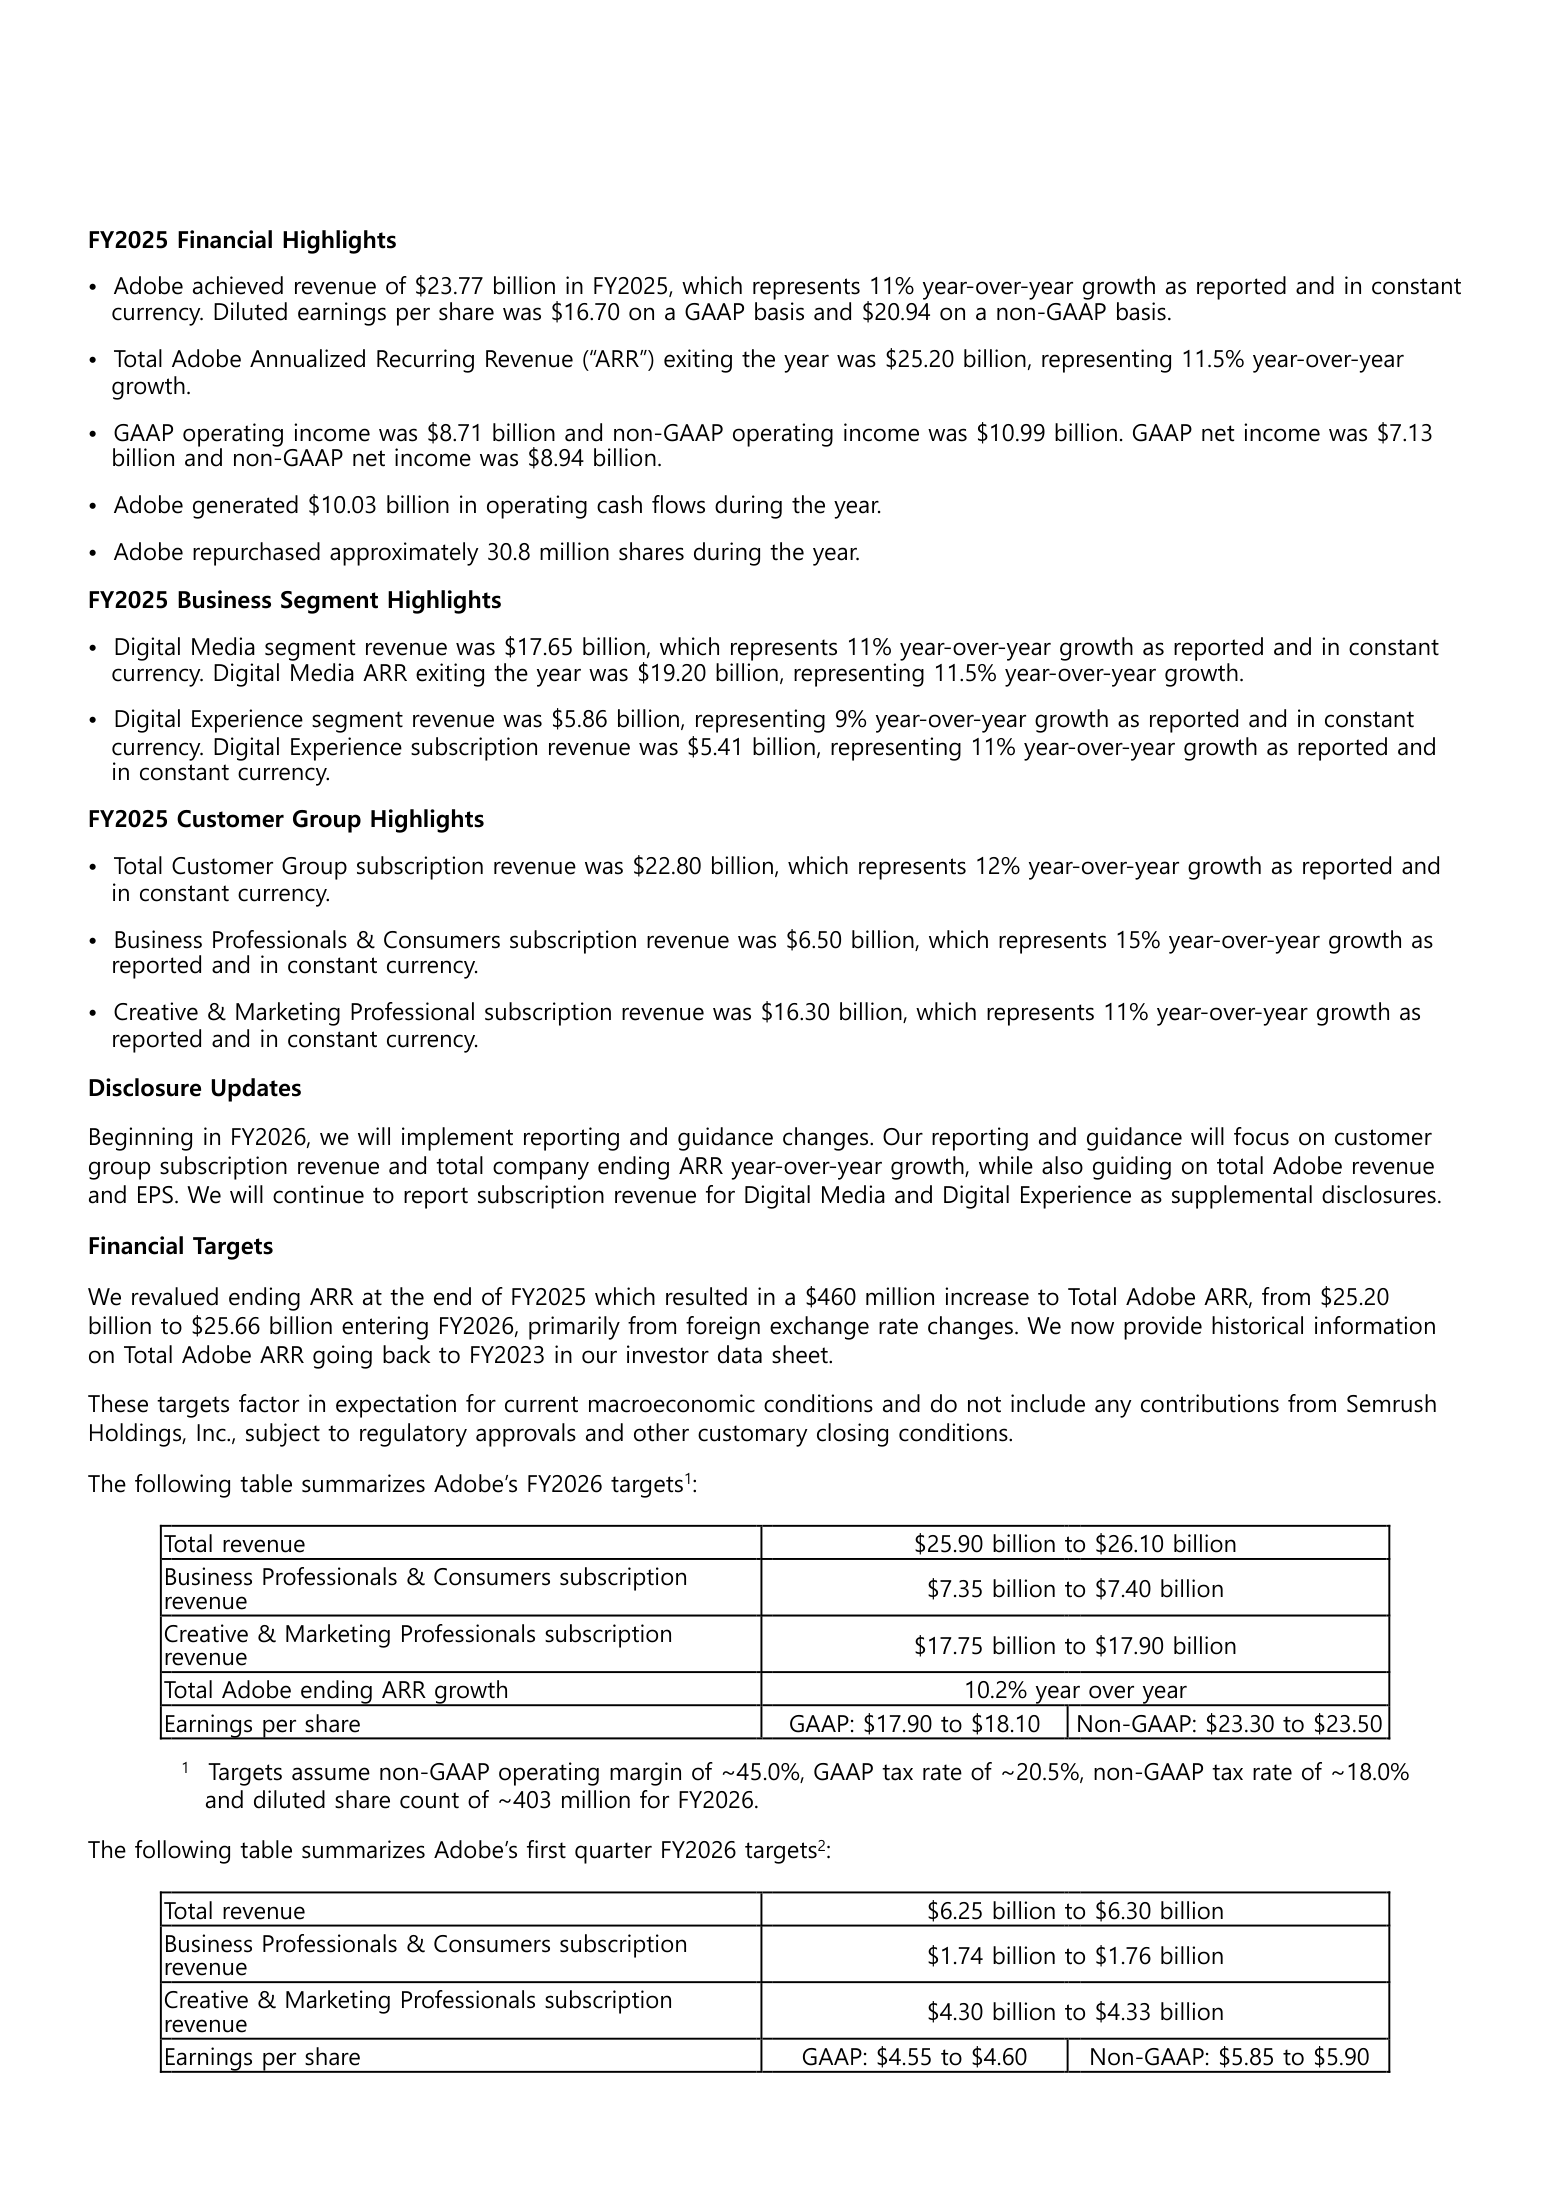
- Filing footnote (fiscal Q4 2025 earnings release, "Disclosure Updates" section, December 10, 2025): Adobe wrote the transition down itself. Reporting and guidance would move to customer group subscription revenue and total company ending ARR growth, and Digital Media and Digital Experience subscription revenue would continue "as supplemental disclosures."
- Supplemental is the operative word. The company did not stop reporting the old cut. It moved the old cut off the main stage. The original text sits on the SEC site (fiscal Q4 2025 earnings release, Exhibit 99.1).
- The same section carries a second item. Adobe revalued ending ARR at the close of fiscal 2025 from $25.20 billion to $25.66 billion, a $460 million increase it attributed mainly to foreign exchange. The fiscal 2026 target of +10.2% ARR growth is measured off that raised base. Rebasing is routine. Rebasing in the same paragraph that sets the growth target is worth remembering.
Which Segment Actually Grew Faster?
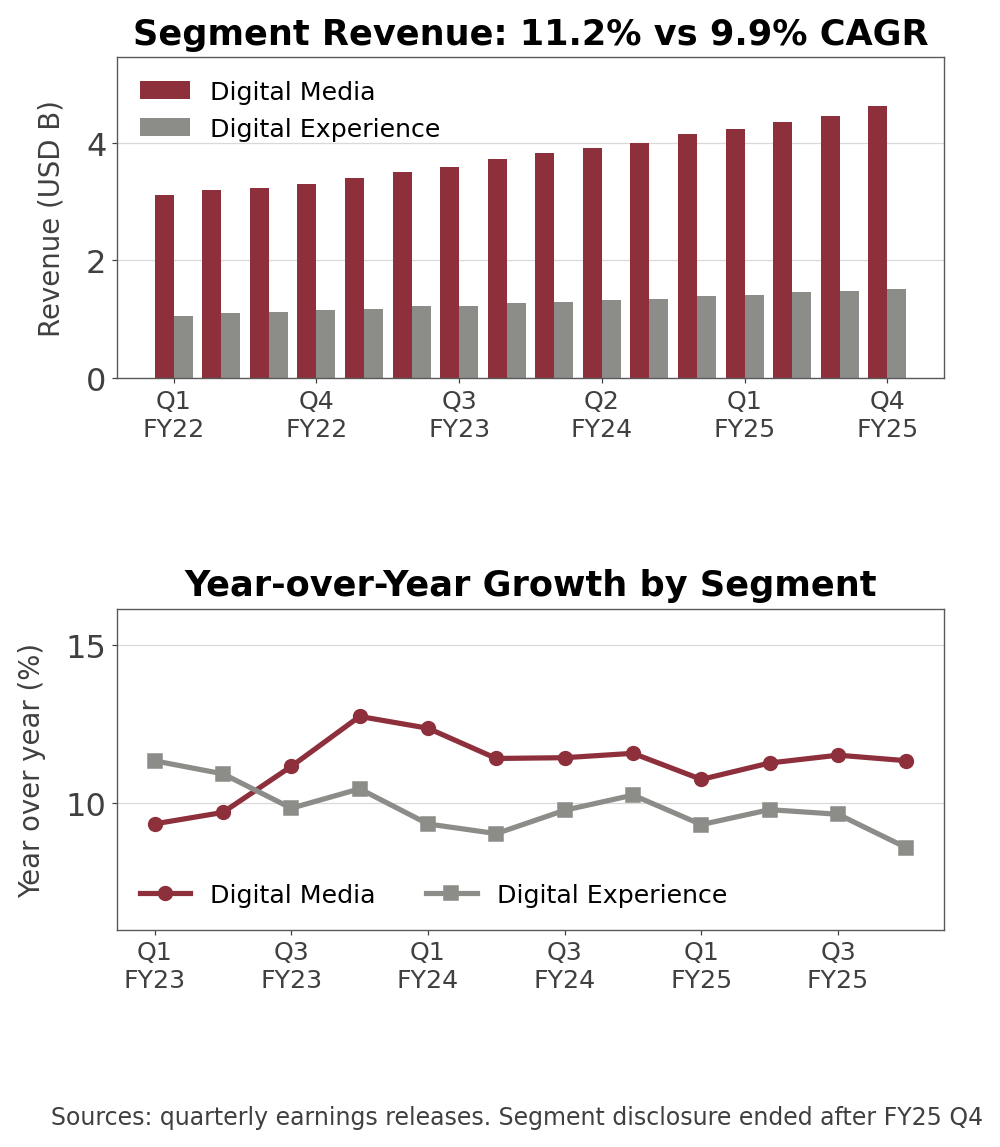
- If a company retires a segment name because that segment is struggling, the story writes itself. Adobe's numbers do not cooperate.
- Company disclosure (fiscal Q4 2025 earnings release, December 10, 2025): Fiscal 2025 Digital Media revenue was $17.65 billion and Digital Experience revenue was $5.86 billion.
- Growth was +11% and +9% respectively. Stretch the window to three years and the gap holds: Digital Media went from $12.84 billion to $17.65 billion, a 11.2% annual rate, while Digital Experience went from $4.42 billion to $5.86 billion, or 9.9%. The faster segment never traded places with the slower one in any of those three years.
| Segment | Fiscal 2022 | Fiscal 2025 | 3-year CAGR |
| Digital Media (Creative and Document) | $12.84B | $17.65B | 11.2% |
| Digital Experience | $4.42B | $5.86B | 9.9% |
| Total Adobe | $17.61B | $23.77B | 10.5% |
- Digital Media's share of total revenue also rose over the same stretch, from 73.0% to 74.6%. So the reorganization is not the consequence of a fading business. It is closer to a change in the story the company wants to tell. Cut by product, Creative is three quarters of Adobe. Cut by customer, the label "Creative and Marketing Professionals" folds the marketing organization in beside it. Same dollars, different box.
What Does Adobe (ADBE) Sell Today?
- Adobe now splits subscription revenue into two customer groups.
- Company disclosure (fiscal Q2 2026 earnings release, June 11, 2026): Creative and Marketing Professionals subscription revenue was $4.54 billion and Business Professionals and Consumers subscription revenue was $1.85 billion, for total customer group subscription revenue of $6.39 billion.
- Growth was +13% and +16%, or +14% combined. Against total revenue of $6.62 billion, subscriptions are 96.6% of the company. Adobe is a subscription business with a rounding error attached.
- The first group is the designer and marketer paying for Creative Cloud and Photoshop. The second is the office worker or individual paying for Acrobat and Adobe Express. The smaller group grows three percentage points faster, and it happens to be the group where AI features bolt on most easily.
- Contract backlog tells a consistent story. Ending ARR was $27.10 billion at the close of fiscal Q2 2026, and remaining performance obligations (RPO, contracted revenue not yet recognized) stood at $22.27 billion with 67% due inside twelve months. A year earlier RPO was $19.69 billion, so the backlog grew +13.1%, roughly in line with revenue. Of the $27.10 billion in ARR, about $480 million came from the acquired Semrush business, a figure Adobe disclosed rather than left to inference.
The Sentence That Was in the 8-K but Not the Press Release
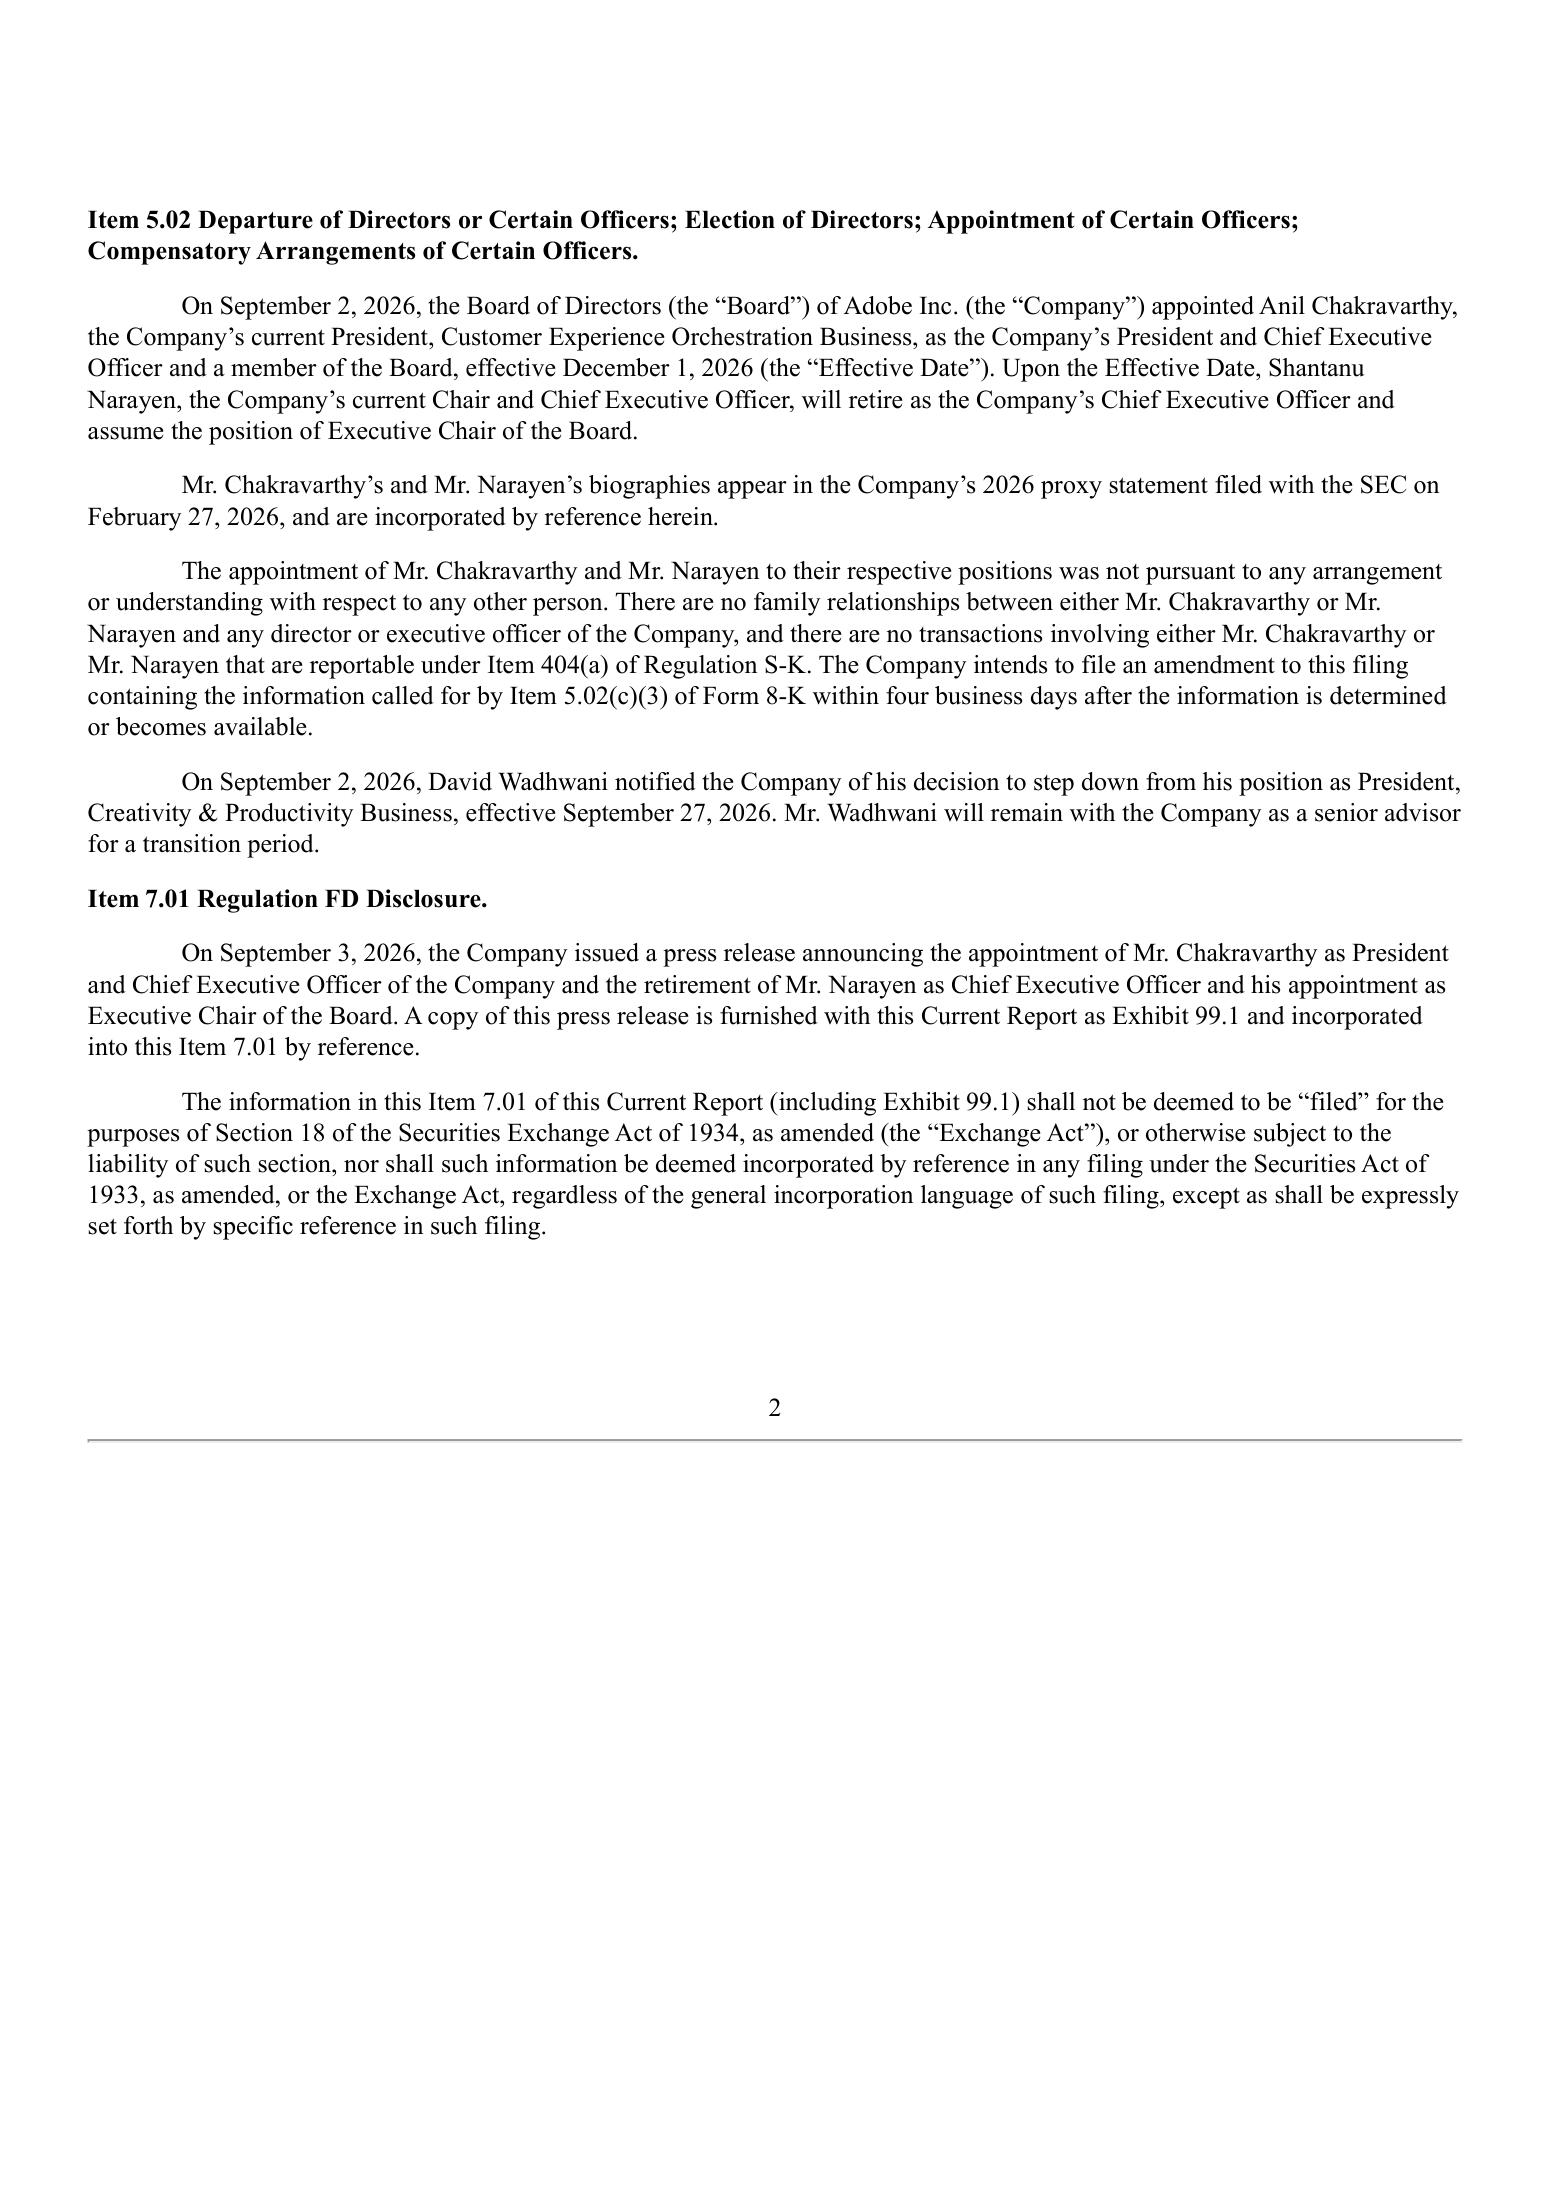
- On September 2, 2026, Adobe's board named Anil Chakravarthy president and chief executive officer effective December 1, 2026. Shantanu Narayen, CEO since 2007, becomes executive chair on the same date.
- Company disclosure (press release, September 3, 2026): Chakravarthy joined Adobe in January 2020 to run the Digital Experience business and added worldwide field operations that September. His current title is president of the Customer Experience Orchestration business. Lead independent director Frank Calderoni said the board "has unanimously determined that Anil is the right leader for Adobe's next chapter of growth."
- That is where the press release ends. The 8-K filed on the same matter carries one more paragraph.
- Filing footnote (Form 8-K, Item 5.02, filed September 8, 2026): Also on September 2, David Wadhwani, president of the Creativity and Productivity business, notified the company he would step down effective September 27, 2026, staying on as a senior advisor through a transition period. That sentence does not appear in the September 3 press release (Form 8-K filed September 8, 2026).
- Wadhwani had been the public face of the creative business for years and a name mentioned in succession talk. The person promoted came from customer experience. The person leaving came from creative.
- Own calculation (daily closes, August 25 to September 9, 2026): The stock closed at $285.75 on September 3, the day of the press release, and at $254.86 on September 9.
- Day by day: September 3 +2.13%, September 4 -6.73%, September 8 -3.47% on the day the 8-K was filed, and September 9 -0.93%. Measured from the August 31 close of $292.79, that is -12.95%, or roughly $15 billion of market value in seven sessions.
- One caution belongs here. The largest single decline, September 4, has no Adobe filing attached to it. The 8-K arrived four sessions later. The sequence is verifiable; the causation is not, and this analysis does not assert it.
Three Executive Seats Changed in Fourteen Weeks
- Put the leadership changes on one line and the scale looks different.
- Company disclosure (fiscal Q2 2026 earnings release, June 11, 2026): Chief financial officer Dan Durn departed the company on June 15, 2026. His replacement was not a permanent hire. Steve Day, previously CFO of Adobe's Customer Experience Orchestration business unit, became interim chief financial officer.
- June 15, the CFO leaves. September 2, the CEO succession is decided, and the head of the creative business gives notice the same day. Fourteen weeks, three seats.
- Nothing in the filings links the three events, and this analysis will not invent a link. What an investor can say is narrower and still useful: the heads of finance, strategy, and product all changed inside a quarter and a half, an interim CFO is presenting the results, and that arrangement runs until December 1.
- There is one more detail. Steve Day came from the same organization as the incoming CEO.
- Read as strategy, the direction converges. The ground Adobe can most easily defend in an AI market is not the individual creative tool, where substitutes appear monthly and prices keep falling, but the enterprise marketing stack, where customer data and workflow raise the cost of switching. Recutting the segments by customer and picking a CEO from that organization both lean toward the defensible side.
- The revenue has not moved with them. Creative and Marketing Professionals subscription revenue of $4.54 billion is 71% of all subscription revenue. The organization has turned toward one side of the house while the money still sits on the other, and closing that distance is the job the new team inherits.
Application Software Producer Prices Are Falling
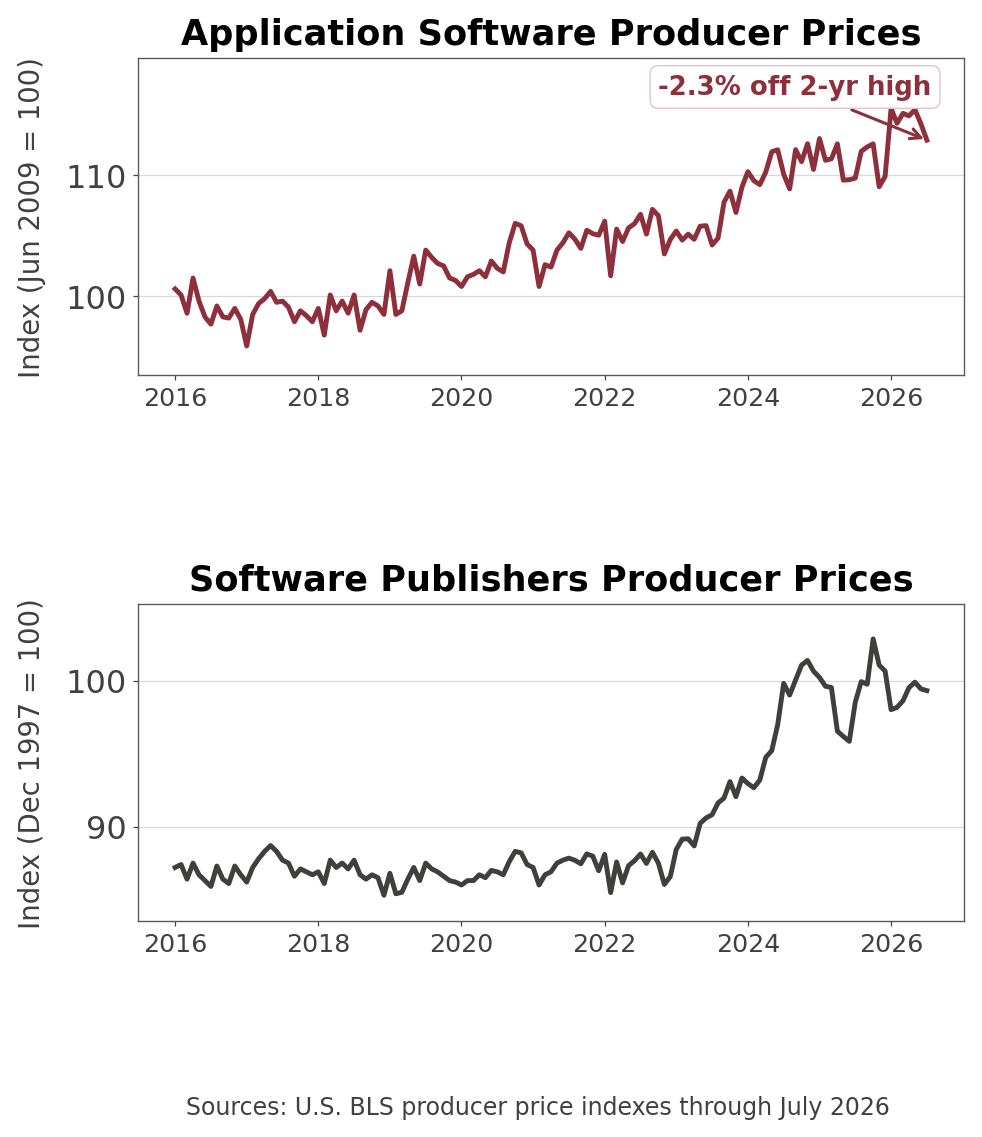
- Step outside the company for a moment. What Adobe sells has a price, and the government tracks it.
- Official statistics (U.S. Bureau of Labor Statistics producer price index WPU3421, July 2026): The producer price index for application software publishing stands at 112.85. Two months earlier, in May 2026, it was 115.36.
- That is -2.2% in two months and -2.3% below the two-year high. Over five years the index is +7.3%, well behind U.S. consumer prices over the same stretch, which means software has gotten cheaper in real terms.
- Official statistics (producer price index PCU511210511210, July 2026): For software publishing as a whole the index reads 99.31 against a December 1997 base, so nominal prices in this industry have gone essentially nowhere in nearly thirty years.
- These are quality-adjusted indexes, not price tags. Ship more capability at the same price and the index falls. In a period when generative AI is being layered into every software product, an index that keeps drifting down says vendors are adding capability without being able to charge for it.
- Adobe's own growth is consistent with that. Fiscal Q2 2026 revenue grew +12.7%, or +11% in constant currency, and management has attributed growth to customer count and tier mix rather than price. The government series does not contradict that account.
ADBE Valuation vs. Salesforce, Intuit and Autodesk
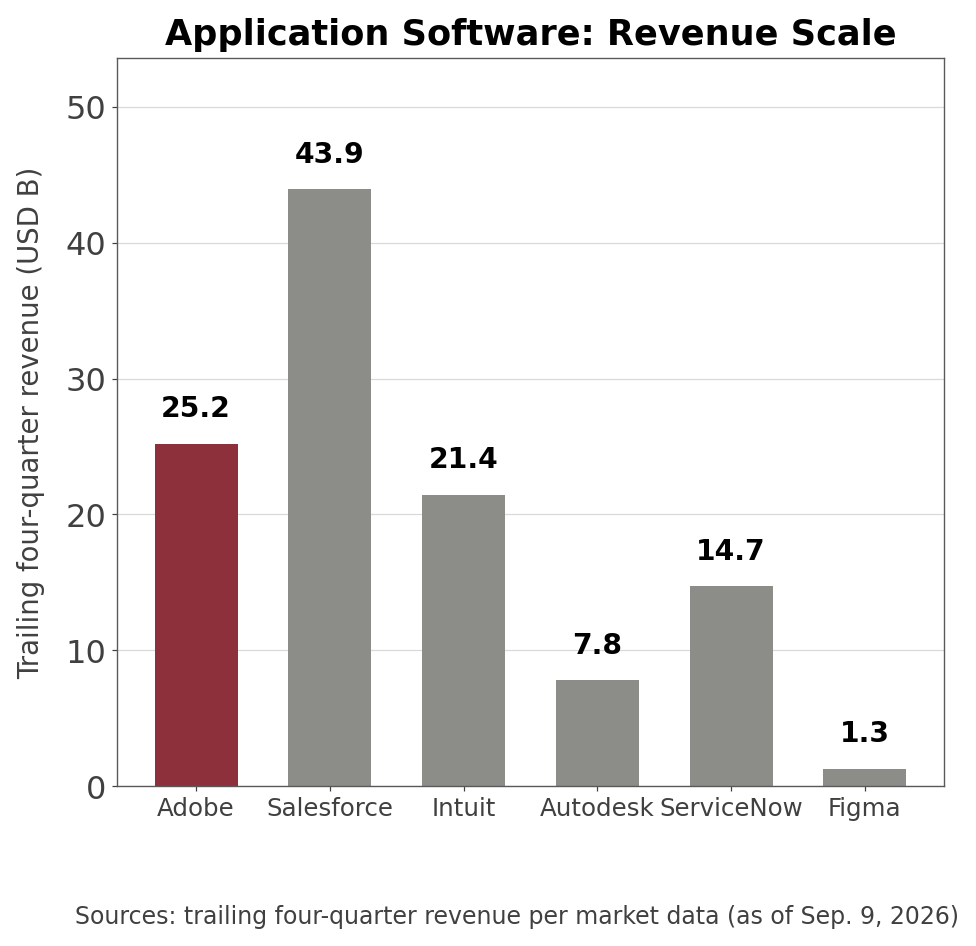
- The comparison set is three mature subscription businesses (Salesforce, Intuit, Autodesk) and two names where the multiple is attached to growth (ServiceNow, Figma).
| Company (Ticker) | Market cap | TTM revenue | Revenue growth | Forward P/E |
| Adobe (ADBE) | $101.3B | $25.2B | +12.7% | 9.82x |
| Salesforce (CRM) | $200.9B | $43.9B | +10.8% | 17.01x |
| Intuit (INTU) | $85.9B | $21.5B | +13.7% | 12.98x |
| Autodesk (ADSK) | $43.2B | $7.8B | +16.1% | 15.90x |
| ServiceNow (NOW) | $135.6B | $14.7B | +24.0% | 28.94x |
| Figma (FIG) | $11.7B | $1.3B | +48.2% | 81.07x |
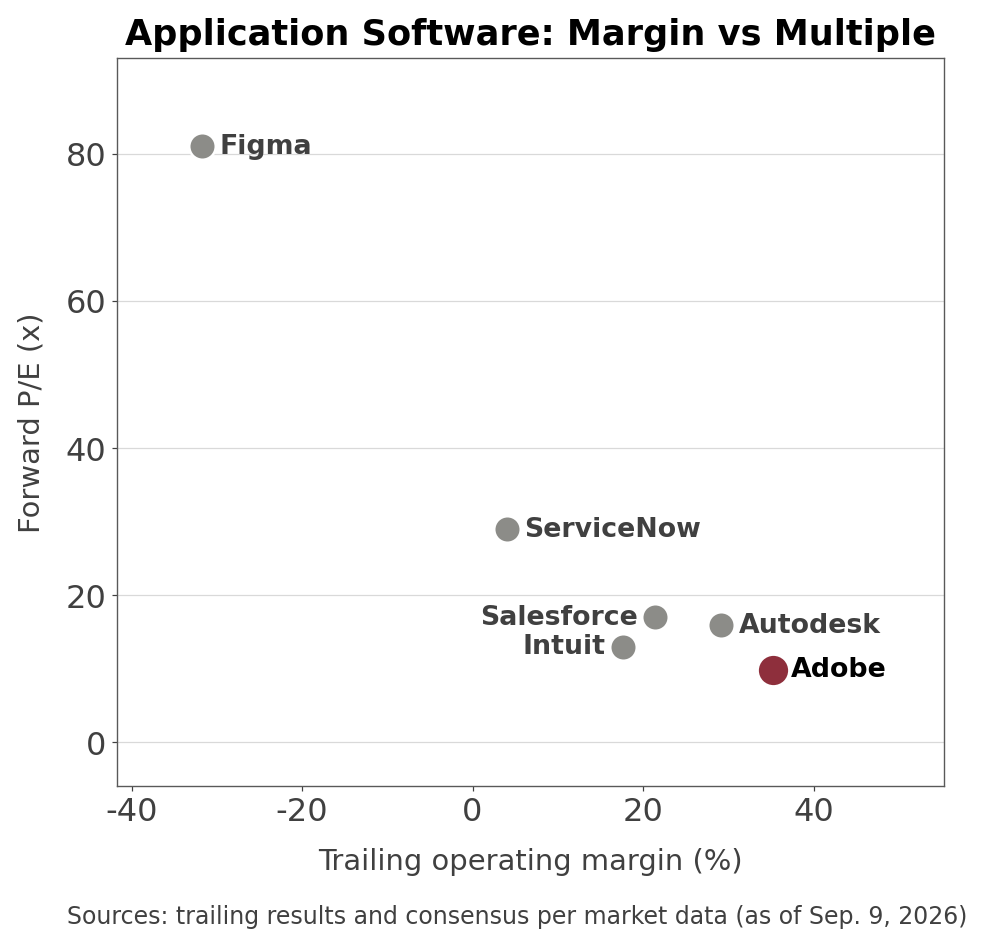
- Adobe carries the lowest forward multiple of the six. It also carries the highest operating margin.
| Company (Ticker) | TTM operating margin | P/S | P/B | Rule of 40 (growth + margin) |
| Adobe (ADBE) | 35.3% | 4.02x | 8.83x | 48.0 |
| Salesforce (CRM) | 21.4% | 4.57x | 5.34x | 32.2 |
| Intuit (INTU) | 17.6% | 4.00x | 4.50x | 31.3 |
| Autodesk (ADSK) | 29.2% | 5.54x | 12.76x | 45.3 |
| ServiceNow (NOW) | 4.1% | 9.20x | 10.83x | 28.1 |
| Figma (FIG) | -31.7% | 9.15x | 7.90x | 16.5 |
- On the Rule of 40, the standard software screen of growth plus operating margin, Adobe scores 48.0, the highest in the group. The company with the best score trades at the lowest forward multiple.
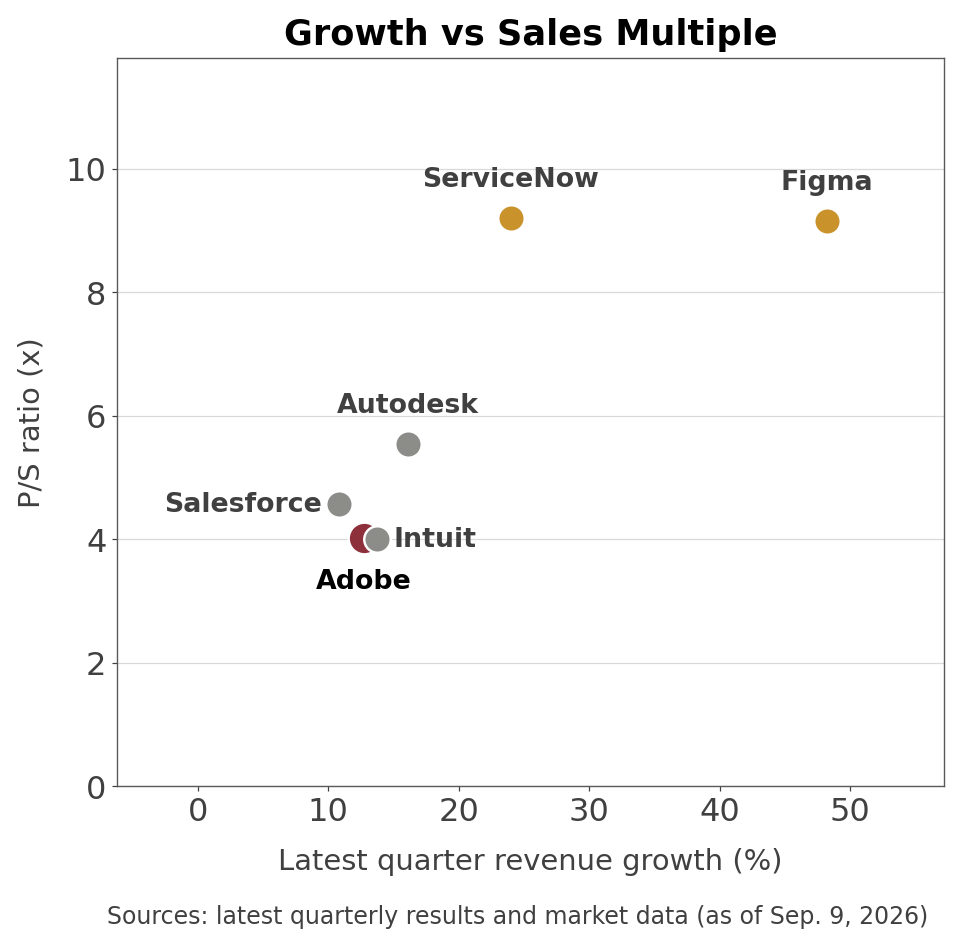
- Growth against the sales multiple tells the same story from another angle. Adobe grows +12.7% and Intuit grows +13.7%, close enough to call even, and their price-to-sales ratios are 4.02x and 4.00x, also even. Adobe earns nearly twice the operating margin on each of those revenue dollars and receives the same price for them.
- What the market is pricing is not the current profit. It is the durability of that profit. When AI tools that generate images and documents are being handed out cheaply, the question is whether a 35% operating margin on creative software survives the decade. The multiple is the market's answer.
Is Adobe Stock Cheap? Three Multiples, Three Bottom Deciles
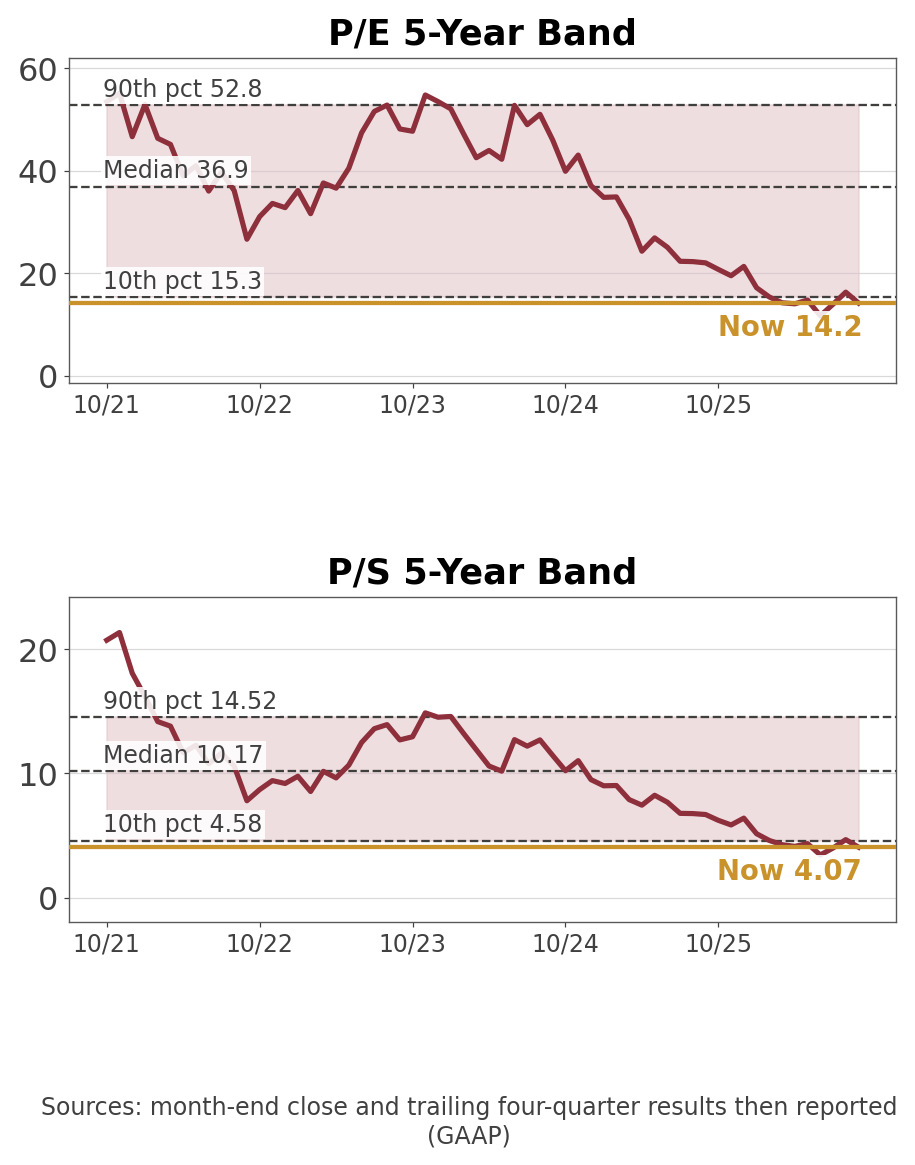
- Own calculation (month-end closes matched to the trailing four quarters reported at each date, last 60 months): Price to earnings is 14.2x against a 60-month median of 36.9x and a 10th-percentile line of 15.3x.
- That puts the current reading in the bottom 5% of the window, which is to say the multiple has been lower in only three of the last sixty month-ends, and two of those three were June and July of this year.
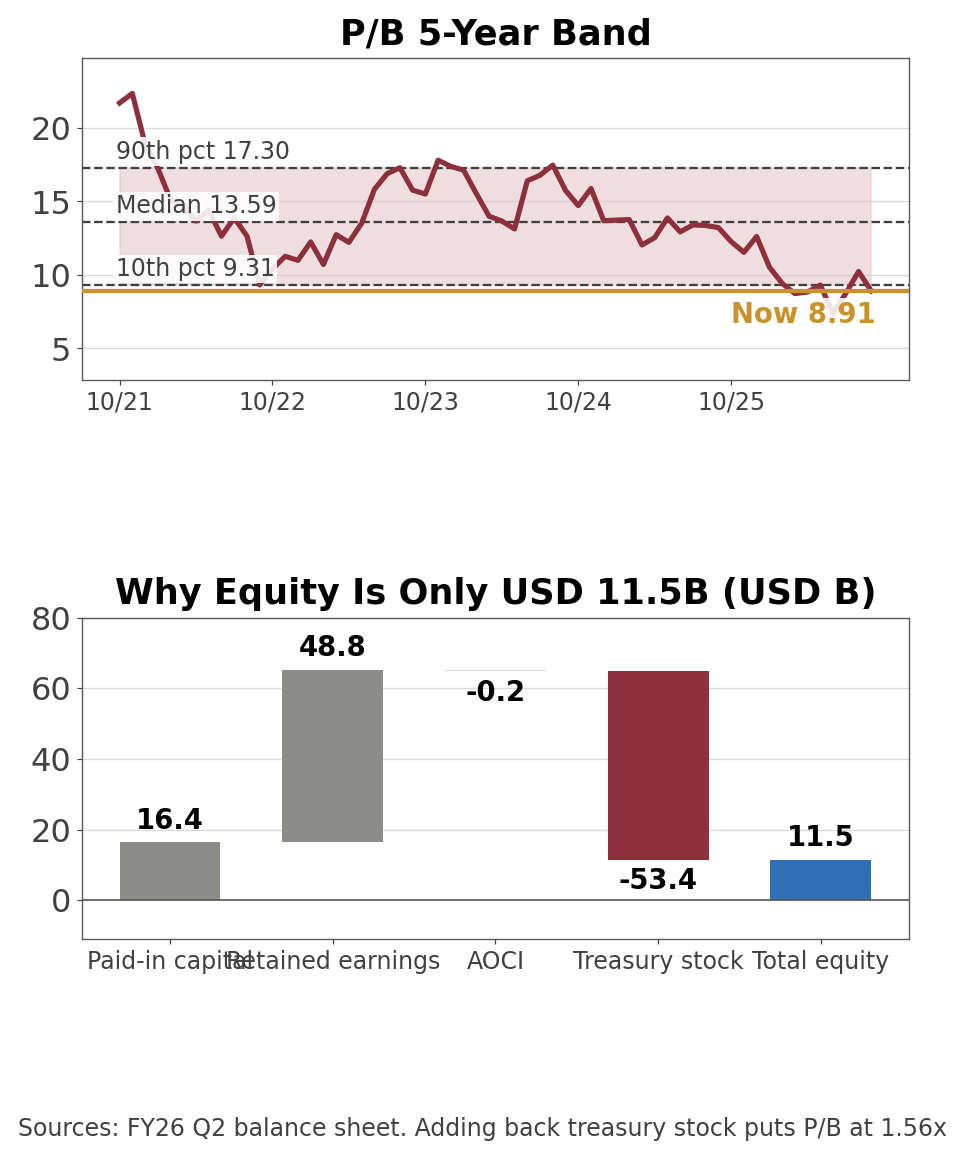
- Price to sales is 4.07x against a median of 10.17x and a 10th-percentile line of 4.58x, the bottom 3%. Price to book is 8.91x against a median of 13.59x and a 10th-percentile line of 9.31x, the bottom 7%. All three sit below their own bottom-decile lines at once.
- The bands are usable, which is not automatic. Over 60 months the ranges span 4.72x, 6.19x and 3.03x respectively, all under the 8x threshold at which a band stops meaning anything, and the denominators are steady: trailing net income varies 1.53x, revenue 1.67x, and book equity 1.44x. No single charge is driving these readings.
- Aggregator cross-check (as of September 9, 2026): One data provider shows Adobe's P/E at 11.27x on a non-GAAP basis against this analysis's 14.2x GAAP figure, and puts the industry median at 19.14x. Either way Adobe screens below its industry.
- Except on one measure. Price to book at 8.91x sits above the industry median of 5.37x. Earnings and sales multiples are below the industry; the asset multiple is above it.
Why Only the Asset Multiple Sits Above the Industry
- The answer is in the denominator.
- Filing footnote (fiscal Q2 2026 balance sheet, as of May 29, 2026): Total stockholders' equity is $11.52 billion against total assets of $29.93 billion, or 38% of assets.
- Sitting in that same statement is treasury stock at cost of -$53.42 billion, a negative line more than four times the size of the equity it reduces and the largest single number on Adobe's balance sheet.
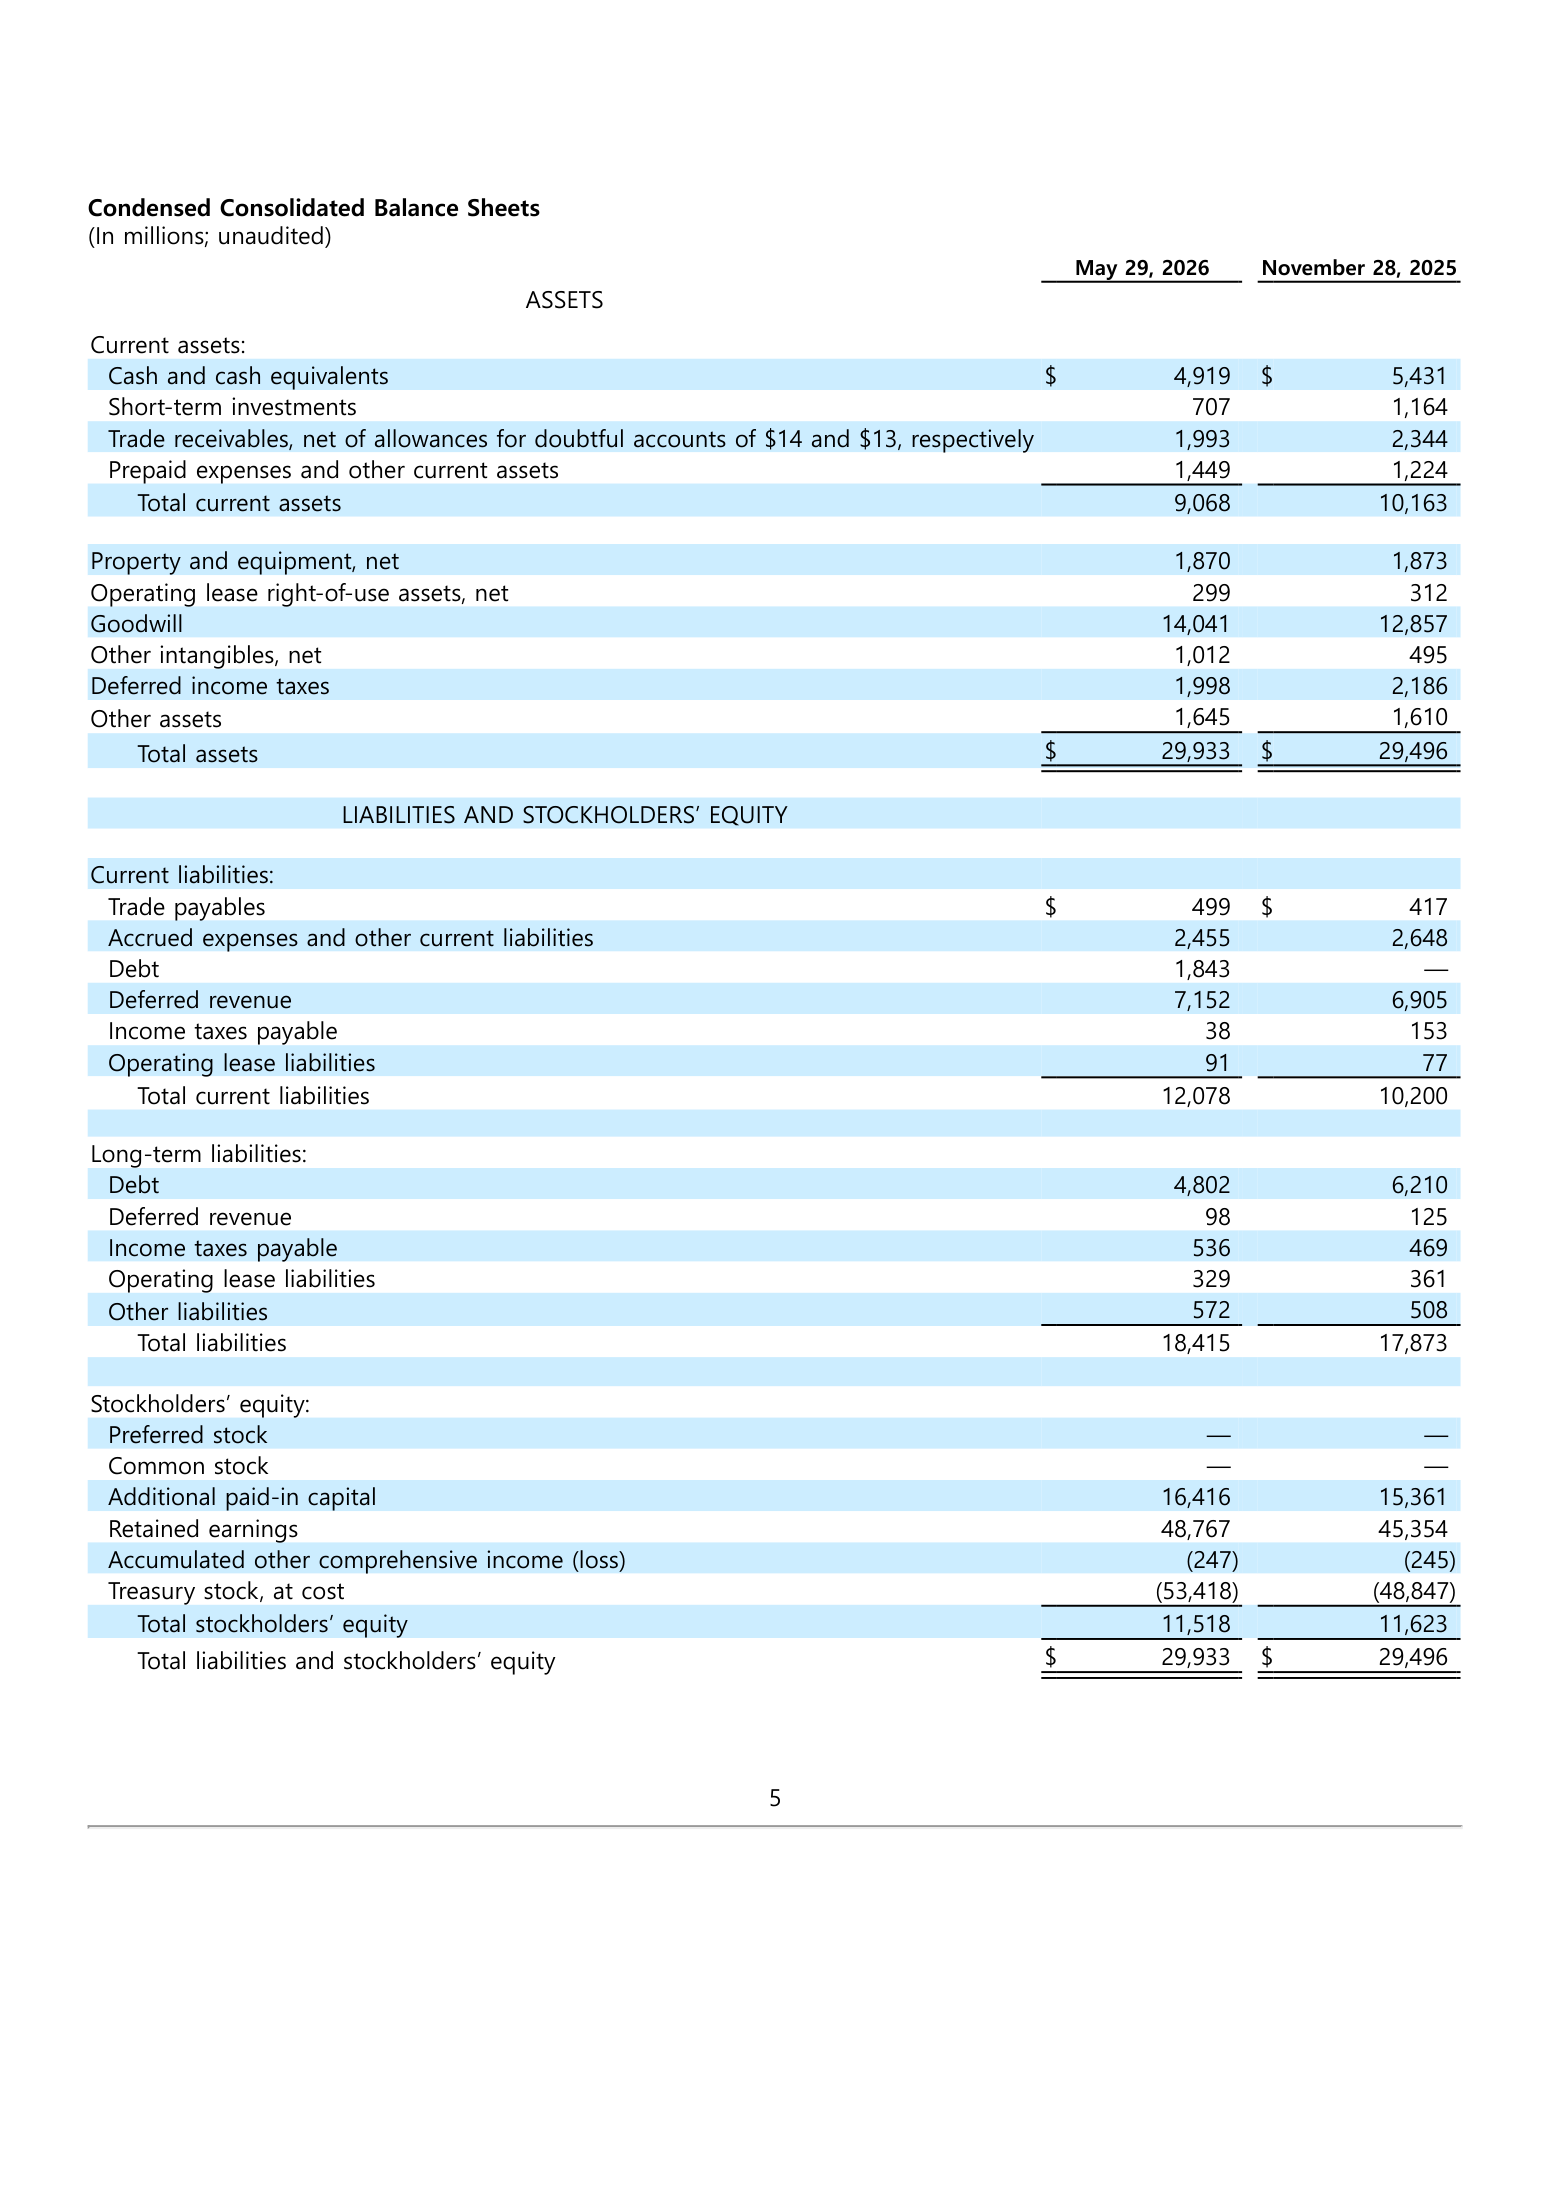
- The build is straightforward. Additional paid-in capital of $16.42 billion plus retained earnings of $48.77 billion comes to $65.18 billion; subtract accumulated other comprehensive loss of -$0.25 billion and treasury stock of -$53.42 billion and $11.52 billion remains. Adobe has repurchased more of its own stock than it has retained in earnings over its entire history.
- Own calculation (treasury stock added back): Reverse the buybacks and shareholders' equity would be roughly $64.9 billion rather than $11.52 billion.
- On that denominator price to book comes to 1.56x instead of 8.91x, which is far below the 5.37x industry median rather than well above it. The multiple moves by a factor of nearly six without a single dollar of enterprise value changing hands.
- So Adobe's price-to-book premium is not a statement about value. It is the arithmetic of two decades of repurchases erasing the book. Using an asset multiple on this company stops being informative.
- The pace has not slowed. Treasury stock rose from $48.85 billion at the end of fiscal 2025 to $53.42 billion at the close of fiscal Q2 2026, meaning $4.57 billion of stock bought back in six months. Over the same six months additional paid-in capital rose $1.06 billion, and stock-based compensation for those two quarters was $0.51 billion plus $0.53 billion, or $1.04 billion. The two figures are effectively the same number. Roughly 22.8% of the buyback went to offsetting shares the company had just issued.
Gross Margin Rose While Operating Margin Fell
- There is a story circulating that Adobe's gross margin is collapsing. The filings say otherwise.
- Own calculation (XBRL quarterly tags, fiscal Q1 2022 to fiscal Q2 2026): Fiscal Q2 2026 gross margin was 89.2%, against 89.1% in the same quarter a year earlier and 88.0% four years ago in fiscal Q1 2022.
- Gross margin is +120 bps over four years. This is not a company whose unit economics are eroding, and the argument that AI is crushing creative software pricing has not reached this line yet. What fell is everything below it: operating margin went from 37.1% to 33.8%, or -330 bps.
| Line | Fiscal Q1 2022 | Fiscal Q2 2026 | Change |
| Gross margin | 88.0% | 89.2% | +120 bps |
| R&D as % of revenue | 16.4% | 18.1% | +170 bps |
| Other operating costs as % of revenue | 34.5% | 37.3% | +280 bps |
| Operating margin | 37.1% | 33.8% | -330 bps |
- The 120 basis points gross margin earned were given back four hundred and fifty basis points lower down. The most recent quarter is the heaviest of the series: other operating costs at 37.3% of revenue is the highest reading in four years apart from the quarter that carried the $1.0 billion Figma termination fee.
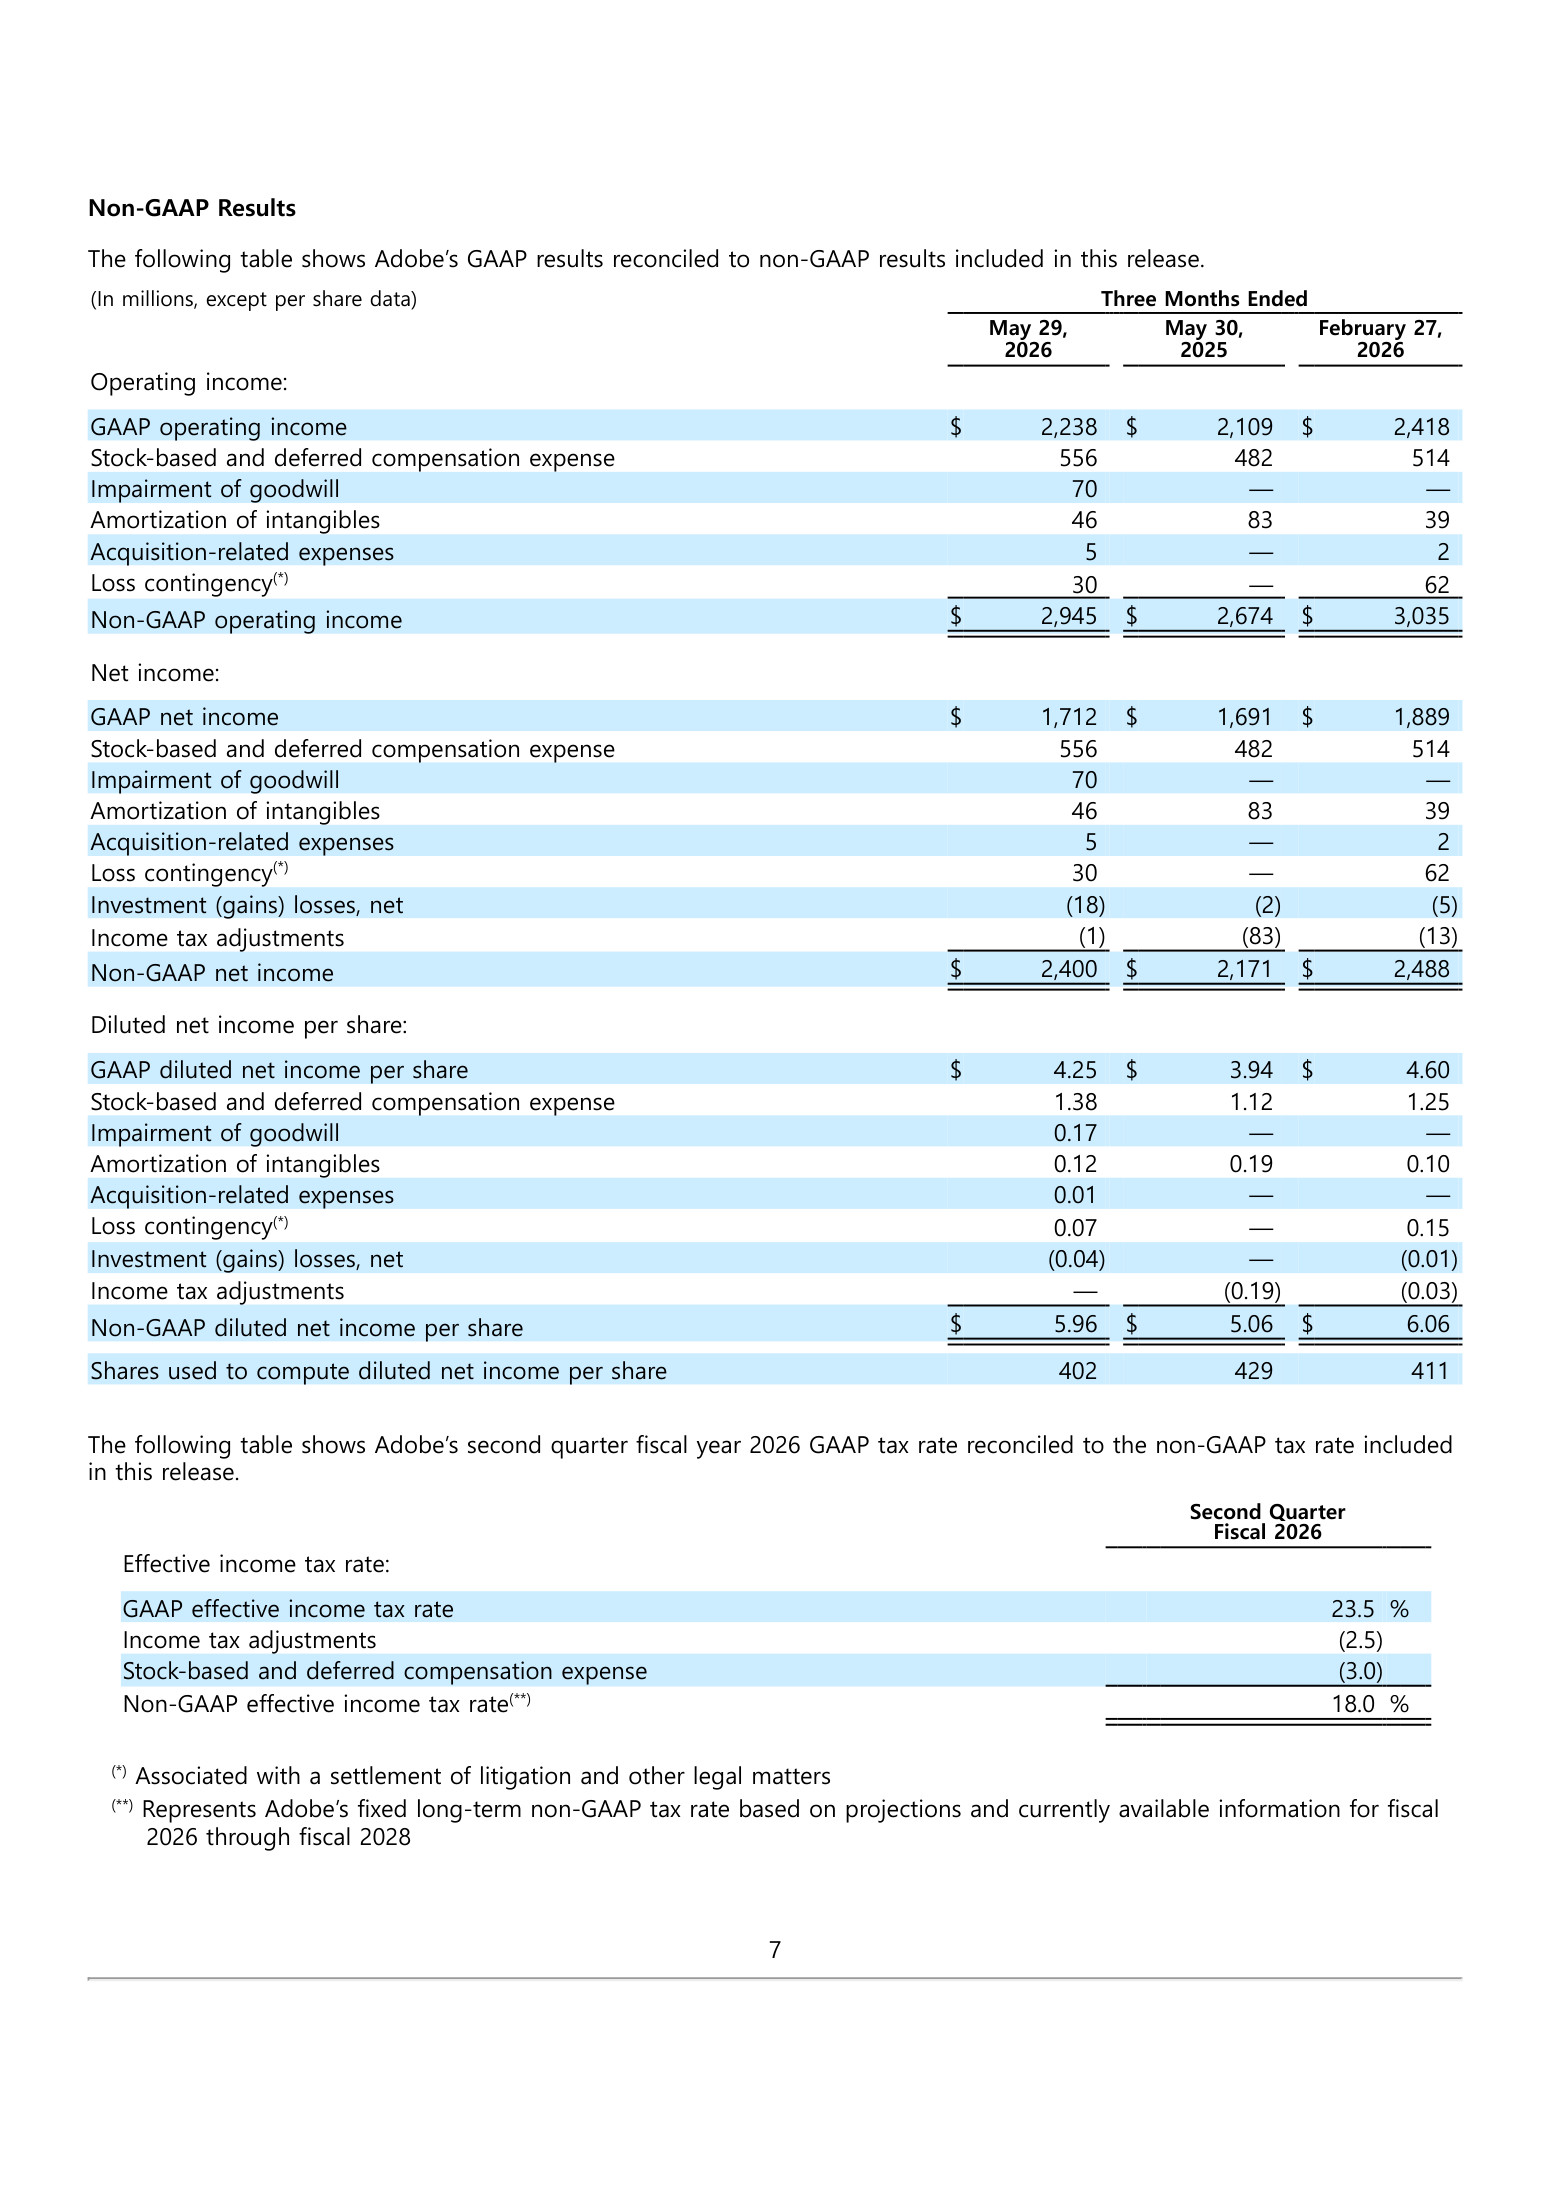
- Filing footnote (fiscal Q2 2026 GAAP to non-GAAP reconciliation, June 11, 2026): The quarter carried one non-recurring item, a $70 million goodwill impairment on the Publishing and Advertising reporting unit worth $0.17 per share.
- Strip it out and other operating costs still run 36.3% of revenue against 34.8% a year earlier, +150 bps higher. A larger line sits in the same table: stock-based and deferred compensation of $556 million, which is 79% of the $707 million that lifts GAAP operating income of $2.24 billion to non-GAAP operating income of $2.95 billion. Against revenue that is 8.4%, up from 8.2% a year ago.
- Company disclosure (fiscal 2026 guidance, June 11, 2026): Adobe prints the gap in its own table. The fiscal 2026 GAAP operating margin target is 35.0% and the non-GAAP target is 45.0%.
- Of that ten point spread, the company attributes 8.5 points to stock-based compensation. EPS guidance comes in two versions as well, $17.90 to $18.00 on a GAAP basis and $24.35 to $24.45 on a non-GAAP basis. At $254.86 the stock trades at 14.2x the first and 10.4x the second, and which number an investor uses decides the entire valuation argument.
Where Did 84% of Adobe's EPS Growth Come From?
- Operating margin fell and earnings per share rose. Those two facts need reconciling.
- Own calculation (fiscal Q2 2026 versus fiscal Q2 2025): Diluted EPS went from $3.94 to $4.25, net income from $1,691 million to $1,712 million, and diluted shares from 428.9 million to 402.5 million.
- In growth terms that is EPS +7.9%, net income +1.2%, and share count -6.2%. Put the three side by side and the source of the EPS growth does not need a calculation.
| Component | Arithmetic | Per share | Share of growth |
| Fiscal Q2 2025 EPS | 1,691 / 428.9 | $3.94 | base |
| Contribution from net income | (1,712 - 1,691) / 428.9 | +$0.05 | 16% |
| Contribution from share count | 1,712 x (1/402.5 - 1/428.9) | +$0.26 | 84% |
| Fiscal Q2 2026 EPS | 1,712 / 402.5 | $4.25 | total |
- Eighty-four percent of the increase came from the denominator.
- The buyback program explains it. Adobe repurchased 30.8 million shares in fiscal 2025, 1.76 times the 17.5 million bought the prior year, and has kept the pace in fiscal 2026 with 8.1 million shares in Q1 and 8.5 million in Q2.
- Filing footnote (Form 10-Q cover page share counts): Shares outstanding were 410.5 million on January 9, 2026, 404.2 million on March 20, and 397.5 million on June 11, 2026.
- That is -3.2% in five months. Hold that pace and the count drops below 370 million within two years, and EPS keeps climbing even if net income does not. Company guidance assumes about 399 million diluted shares for fiscal 2026.
- How to read this is a matter of judgment. A business generating this much free cash buying its own stock at 14x earnings is textbook capital allocation. The caution is narrower: rising EPS is not by itself evidence that the business improved. The 6.7 point gap between EPS growth of +7.9% and net income growth of +1.2% is exactly that distinction.
Revenue Grew 12.7%; Operating Cash Flow Did Not
- The cash behind $4.57 billion of buybacks has to come from somewhere.
- Company disclosure (fiscal Q4 2025 earnings release, December 10, 2025): Adobe generated $10.03 billion in operating cash flow in fiscal 2025, a figure it described as a record.
- Against revenue of $23.77 billion, 42.2% of the top line converted to operating cash. A company earning a 35% operating margin and converting 42% of revenue to cash, trading at 14x earnings, will buy its own stock, and that is what the balance sheet shows.
- One line in the most recent quarter breaks the pattern.
- Filing footnote (fiscal Q2 2026 statement of cash flows, quarter ended May 29, 2026): Net cash provided by operating activities was $2,165 million, against $2,191 million in the same quarter a year earlier.
- Revenue grew +12.7% while operating cash flow came in at -1.2%. In a subscription software business those two numbers rarely move in opposite directions, which makes the cause worth checking rather than assuming.
- The build: net income of $1,712 million plus non-cash charges of $193 million depreciation, $534 million stock compensation and $70 million goodwill impairment gives $2,509 million, from which about $344 million of working capital drains out to reach $2,165 million. The deferred revenue swing was -$223 million against -$156 million a year earlier.
- Own calculation (stock compensation as a share of operating cash flow): Of the $2,165 million in operating cash flow, $534 million is stock-based compensation.
- That is 24.7% of the reported figure, and it is compensation the company settled in shares and then added back as a non-cash charge.
- A quarter of reported operating cash flow is compensation the company paid in stock and added back, while it spent $4.57 billion of actual cash in the half buying that stock off the market. Seen from the cash flow statement, this is the same fact the balance sheet showed earlier.
- One quarter is not a trend. Adobe's fiscal Q2 is not a renewal-heavy quarter and deferred revenue swings between periods. But if fiscal Q3 and Q4 print the same direction, cash becomes the line to watch rather than revenue growth.
Adobe Price Targets and Analyst Revisions
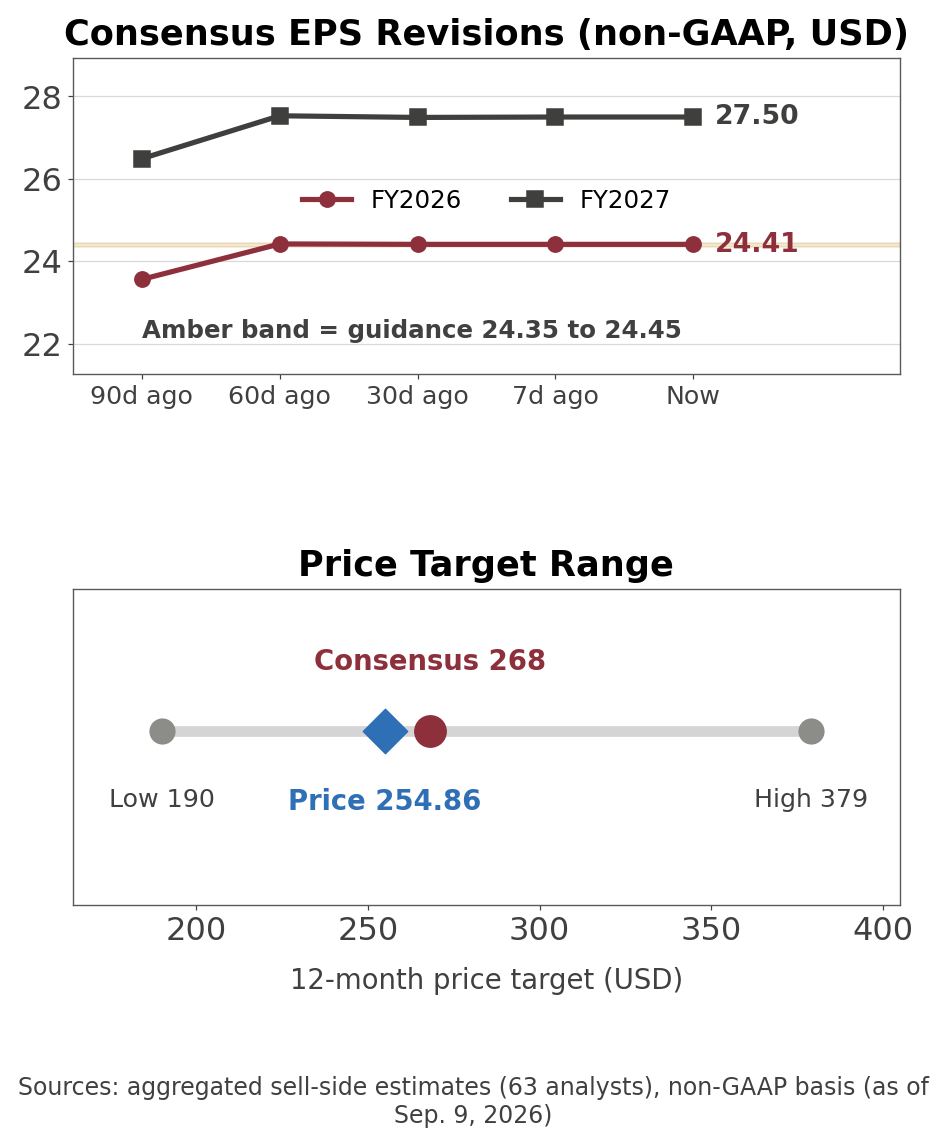
- Aggregator cross-check (aggregated sell-side research, as of September 9, 2026): The fiscal 2026 non-GAAP EPS consensus among 63 analysts is $24.41, against $23.56 ninety days ago.
- That is a +3.6% revision. Fiscal 2027 moved from $26.49 to $27.50, or +3.8%. Company guidance is $24.35 to $24.45, so consensus sits in the middle of the range Adobe gave. Over the last thirty days the revision count is zero upgrades and one downgrade.
- Price targets have not moved in one direction. The twelve-month consensus target is $268, +5.2% above the current price, with individual targets spread from $190 to $379. The ten days from August 30 to September 9 are the interesting part.
| Date | Firm | Target change | Move |
| 2026-08-30 | Jefferies | $230 to $285 | +24% |
| 2026-09-02 | RBC Capital | $350 to $315 | -10% |
| 2026-09-03 | Barclays | $250 to $295 | +18% |
| 2026-09-08 | Mizuho | $245 to $260 | +6% |
| 2026-09-09 | Stifel | $200 to $225 | +13% |
- The pattern is in the starting points. The four firms that raised targets all started between $200 and $250. The one that cut started at $350. The bears are marking up and the bull is marking down, and ratings split almost evenly at thirty buys and twenty-seven holds. Consensus is converging rather than turning.
- Company disclosure (fiscal Q2 2026 earnings release and conference call, June 11, 2026): Shantanu Narayen said Adobe "delivered record revenue of $6.62 billion in Q2 reflecting strong AI-driven demand across our customer groups and we are raising our full-year fiscal 2026 revenue and non-GAAP EPS targets on the strength of that performance."
- Three months later the board handed the job to someone else. On the same earnings call, the president of the creative business and the president of the customer experience business both presented, and the interim CFO who replaced Dan Durn came from the latter.
- Adobe reports fiscal Q3 2026 on September 10, 2026, the day after this analysis is dated. Guidance is revenue of $6.67 billion to $6.72 billion, GAAP EPS of $4.40 to $4.45 and non-GAAP EPS of $6.05 to $6.10. Consensus sits at $6.08, inside that range. Adobe has beaten consensus in seven of the last eight quarters, though the average surprise is 0.0%, so the beats are narrow.
What Would Change the Thesis
| Scenario | Condition | Indicator to check | When and source |
| Upside | Creative and Marketing subscription revenue holds double digits | Guidance of $4.61B to $4.64B met | Fiscal Q3 2026 earnings release |
| Upside | Other operating costs retrace | Below 36% of revenue | Fiscal Q3 2026 earnings release |
| Upside | ARR growth target holds | Total Adobe ending ARR +10.2% | Fiscal Q4 2026 earnings release |
| Upside | The incoming CEO commits to the creative franchise | First earnings call after December 1 | Fiscal Q1 2027 |
| Downside | Customer group growth slips to single digits | Creative and Marketing below +13% | Quarterly earnings release |
| Downside | Stock compensation climbs past 8.5% of revenue | GAAP to non-GAAP operating margin spread | Quarterly reconciliation table |
| Downside | Executive departures continue before the handover | Further Form 8-K Item 5.02 filings | Ongoing |
| Downside | Software producer prices keep falling | BLS series WPU3421 | Monthly, mid-month |
- The first of these arrives one day after this analysis is dated. Revenue and EPS are unlikely to stray far, since the guidance range is narrow. The lines that matter are other operating costs and the split between the two customer groups.
Related Analysis
- Shopify (SHOP) Stock Analysis: Net Income and Equity Gains — another company that tells investors, in its own footnote, which part of its net income to ignore.
- CrowdStrike (CRWD) Stock: GAAP vs Non-GAAP — the same stock-compensation gap that separates Adobe's two EPS guidance figures, in a company where it is wider.
- Credo (CRDO) Stock Analysis: GAAP vs Non-GAAP Earnings Gap — how far apart two sets of books can sit when a company is growing fast enough to pay in equity.
Methodology and Sources
- Segment and customer group figures come from Adobe's quarterly earnings releases furnished on Form 8-K; I parsed all eighteen releases from fiscal Q1 2022 through fiscal Q2 2026 in full and counted segment terminology in each document. Consolidated financials come from SEC XBRL company facts (CIK 796343), and the release figures were cross-checked against the XBRL tags across twenty-six data points with no discrepancies. Valuation bands use sixty month-end closes matched to the trailing four quarters that had actually been reported at each date, on a GAAP basis. Share counts come from Form 10-Q cover pages. Industry price indexes are U.S. Bureau of Labor Statistics series WPU3421 and PCU511210511210 through July 2026. Peer figures and consensus estimates are aggregated sell-side research and market data. Prices are as of the September 9, 2026 close; the Google Finance card is captured September 10, 2026. This is analysis of public filings, not investment advice. Last updated: September 10, 2026.
#Adobe #ADBE #AdobeStock #ADBEStockAnalysis #CreativeCloud #SubscriptionSoftware #ShareBuybacks #USStocks #StockAnalysis #EquityResearch #GlobalStockBrief
Related reading
'US Stock Analysis' 카테고리의 다른 글
| Uber (UBER) Stock Analysis: Gross Bookings vs Revenue Gap (0) | 2026.09.11 |
|---|---|
| ASML Stock Analysis: The Bookings Line That Went Missing (0) | 2026.09.11 |
| Texas Instruments (TXN) Stock Analysis: FCF vs Capex (0) | 2026.09.10 |
| American Express (AXP) Stock Analysis: Credit Metrics Reset (0) | 2026.09.10 |
| Applied Materials (AMAT) Stock: 9 Straight Guidance Beats (0) | 2026.09.09 |


