Texas Instruments (TXN) Stock Analysis: FCF vs Capex
by Global Stock Brief2026. 9. 10.
Texas Instruments (NASDAQ: TXN) posted trailing-twelve-month free cash flow of $6.53 billion in Q2 2026, seven times the $940 million trough of two years ago. This TXN stock analysis takes that number apart using the company's own reconciliation table: how much of the recovery its operations actually produced, what the company added to the definition of free cash flow in Q1 2025, when it quietly stopped quoting the margin it used to advertise, and why three valuation multiples call the stock expensive while the one measure management says it manages to calls it cheap.
Texas Instruments is unusually explicit about how it wants to be judged. Its 10-K states that long-term growth in free cash flow per share is the ultimate measure of value creation. So this piece follows that single measure across 54 quarters.
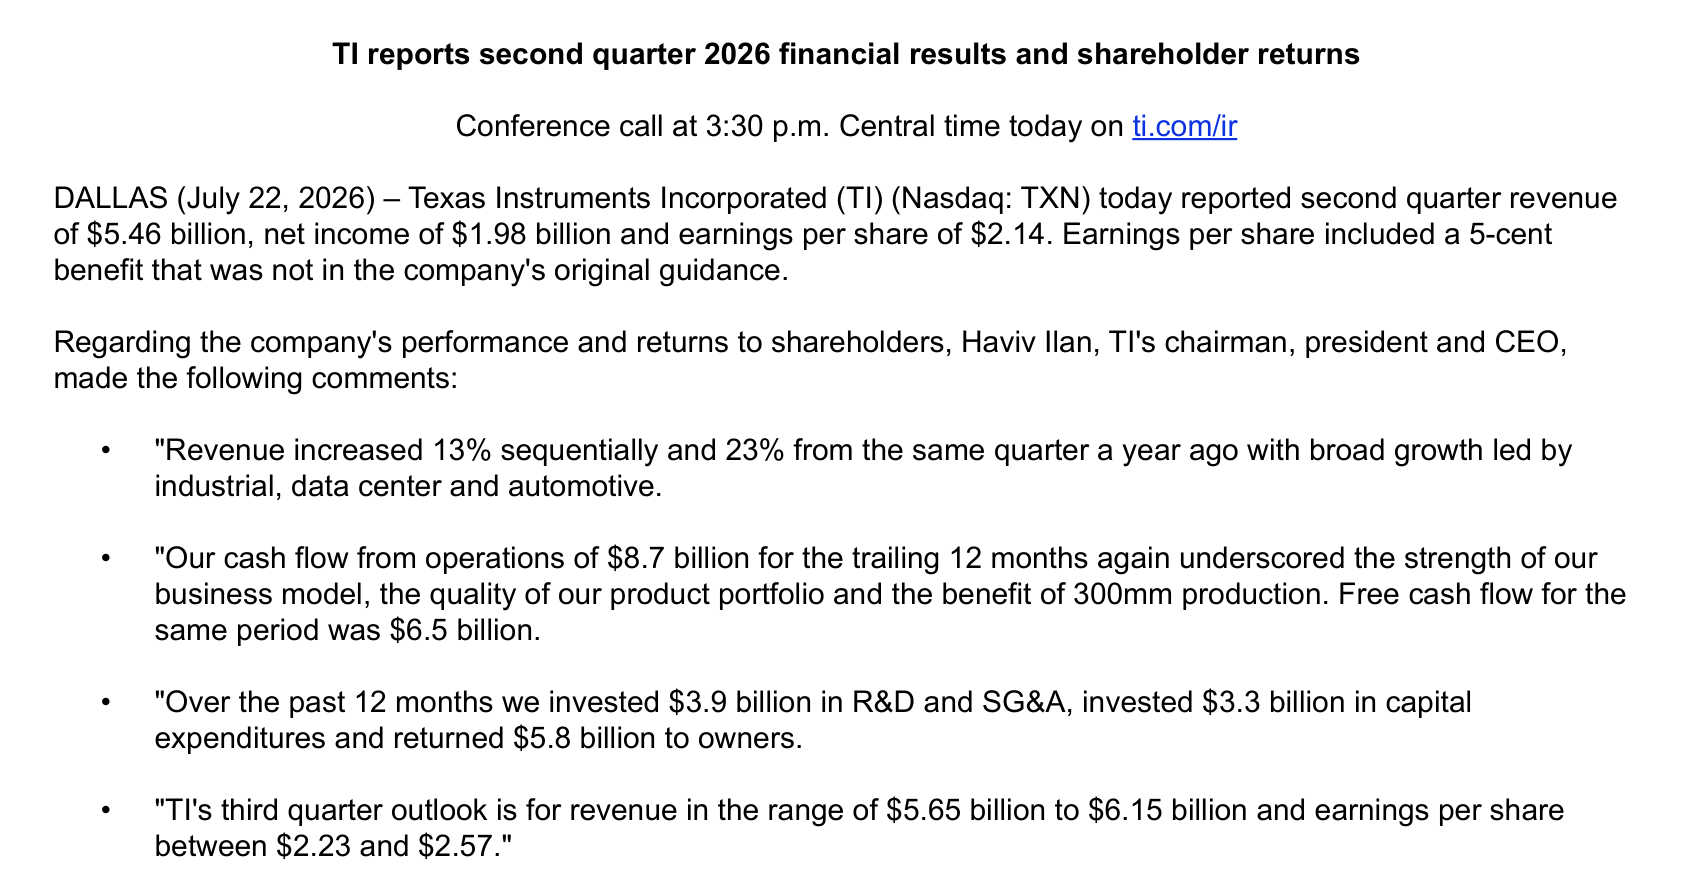
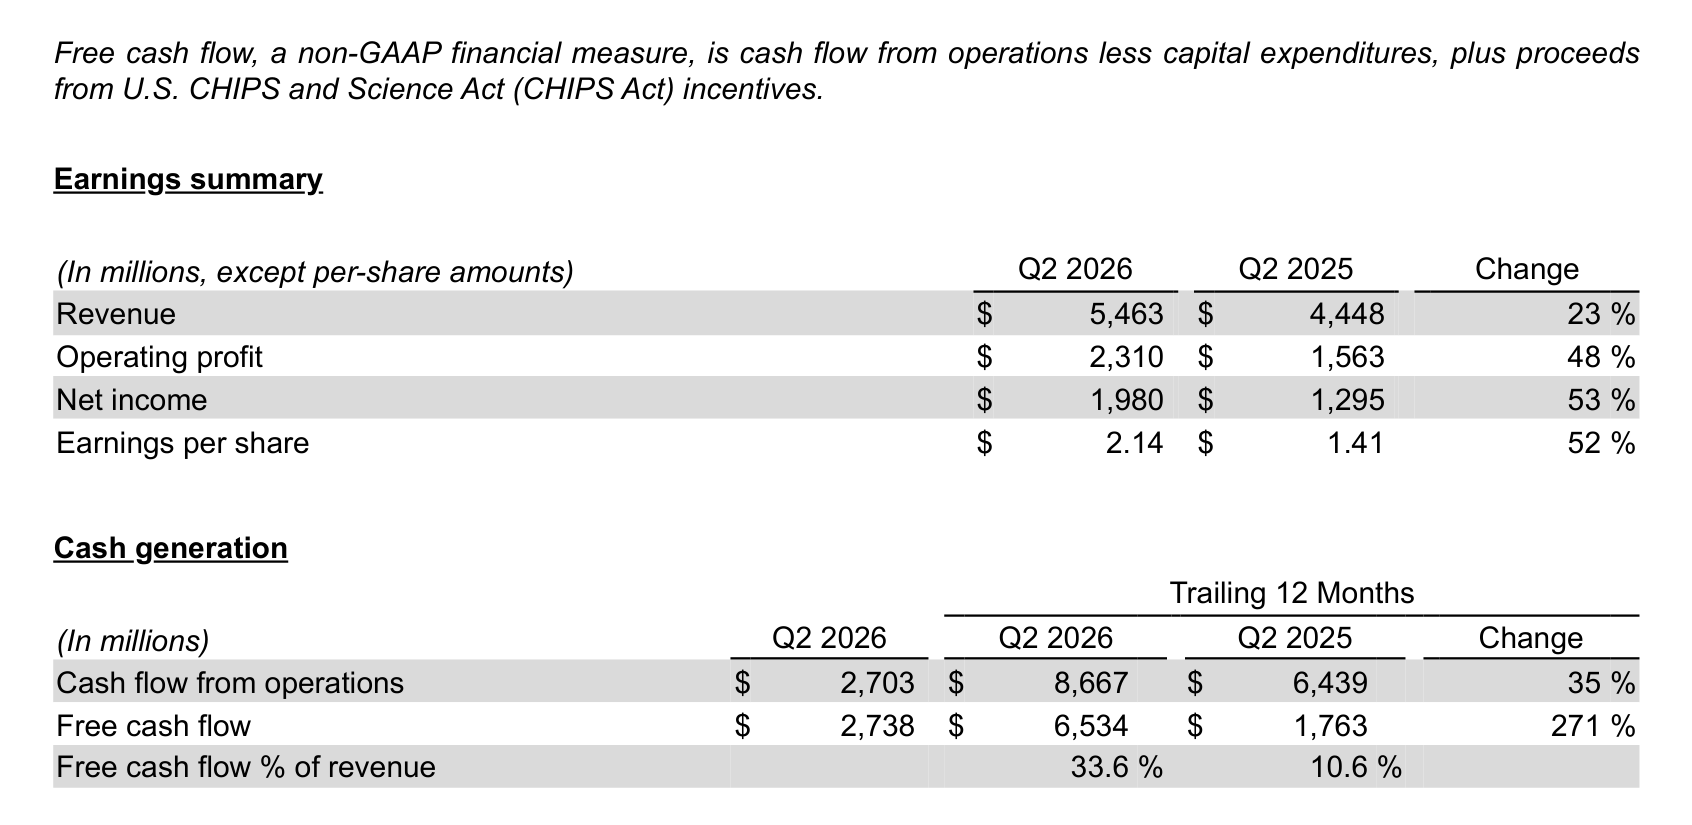
Texas Instruments Q2 2026 earnings release, page 1: the four sentences the company leads with
Market capitalization is $237.8 billion. The fiscal year ends in December, so Q2 2026 covers April through June. Unless stated otherwise, profit figures are US GAAP and multiples use trailing-twelve-month (TTM) denominators.
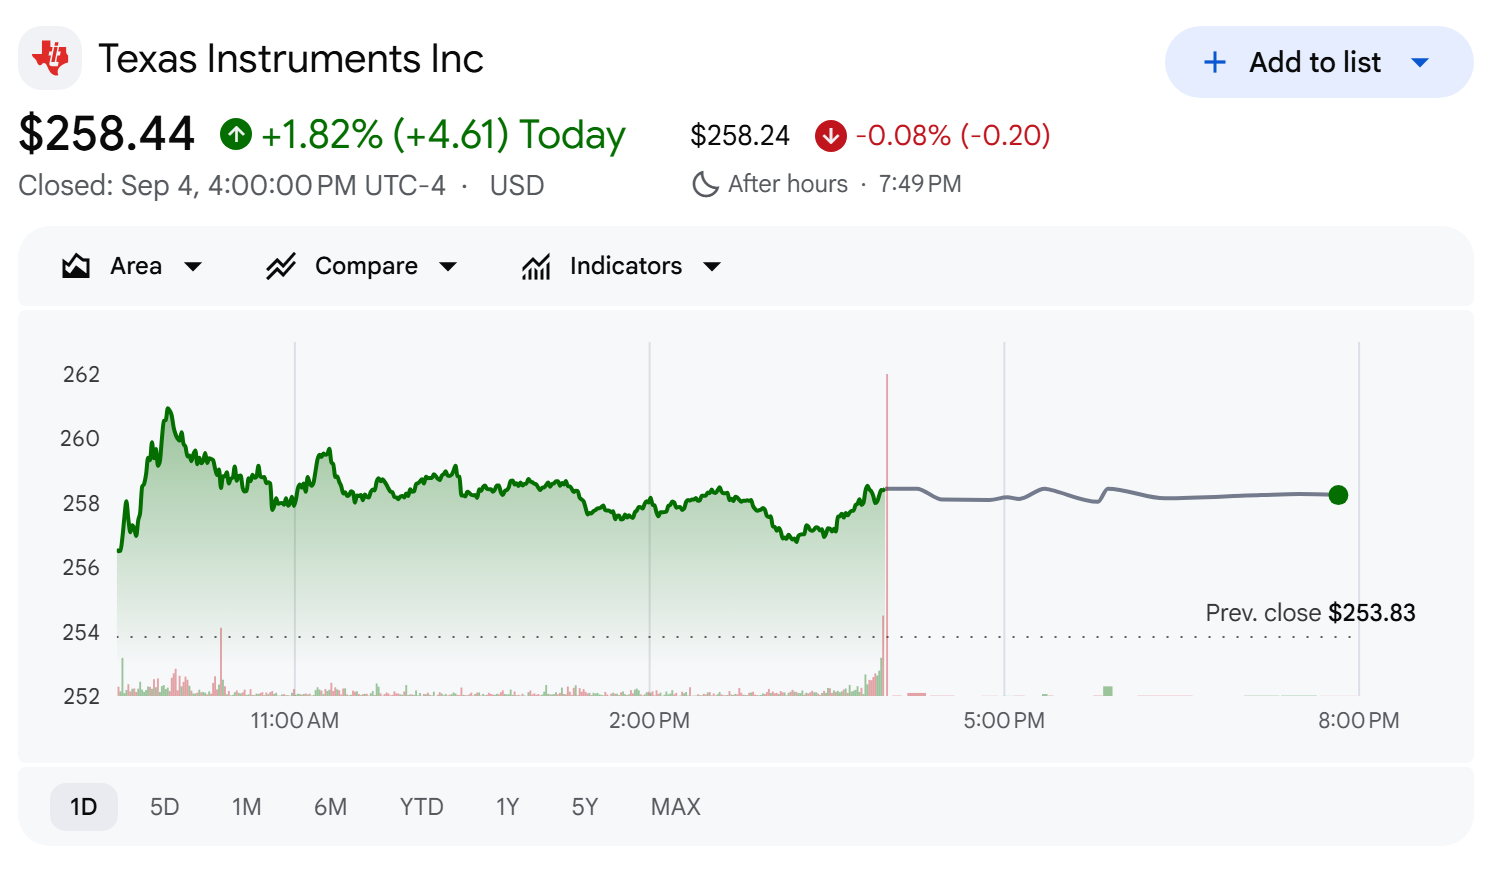
TXN share price, Google Finance, close of Sep. 4, 2026
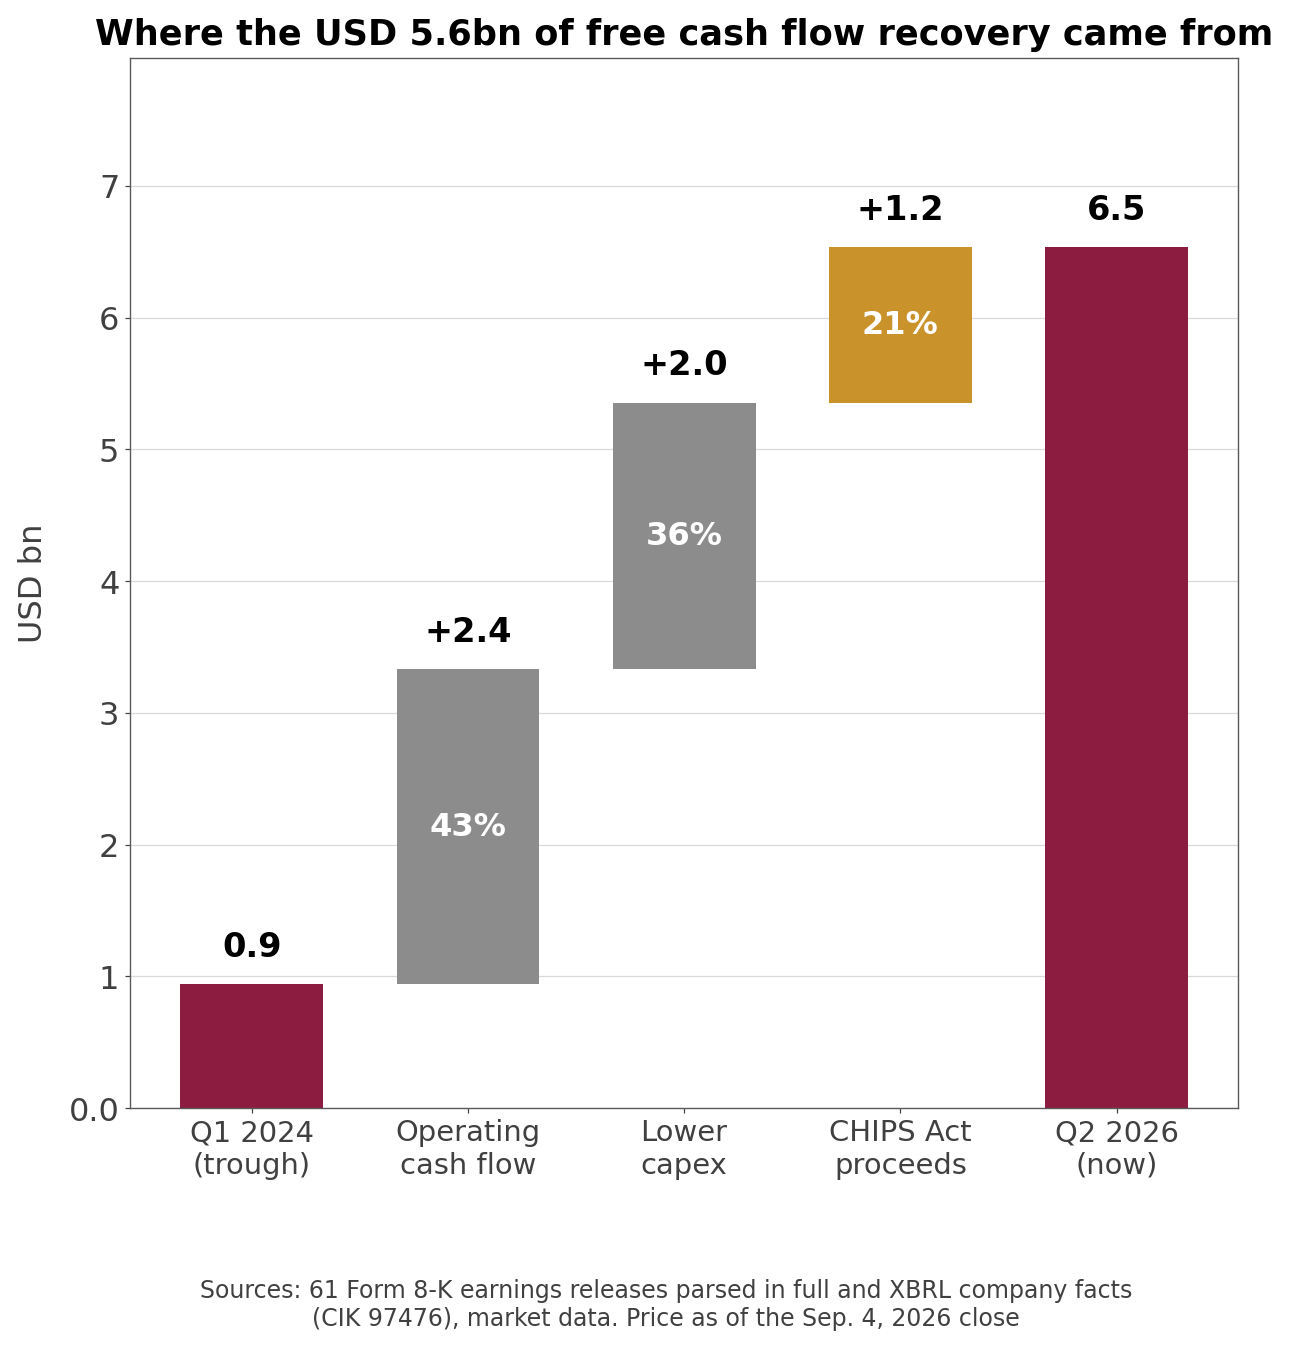
Only 43% of the Free Cash Flow Recovery Came from Operations
Company disclosure (Q2 2026 earnings release, July 22, 2026): "Our cash flow from operations of $8.7 billion for the trailing 12 months again underscored the strength of our business model, the quality of our product portfolio and the benefit of 300mm production. Free cash flow for the same period was $6.5 billion."
Own calculation (61 Form 8-K earnings releases, Q1 2013 to Q2 2026): I pulled every earnings release the company has filed since 2013 and rebuilt the "Cash generation" table it prints each quarter into a 54-quarter series. No quarter is missing, and the table's own identity, free cash flow equals operating cash flow less capital expenditures, holds in every one of them.
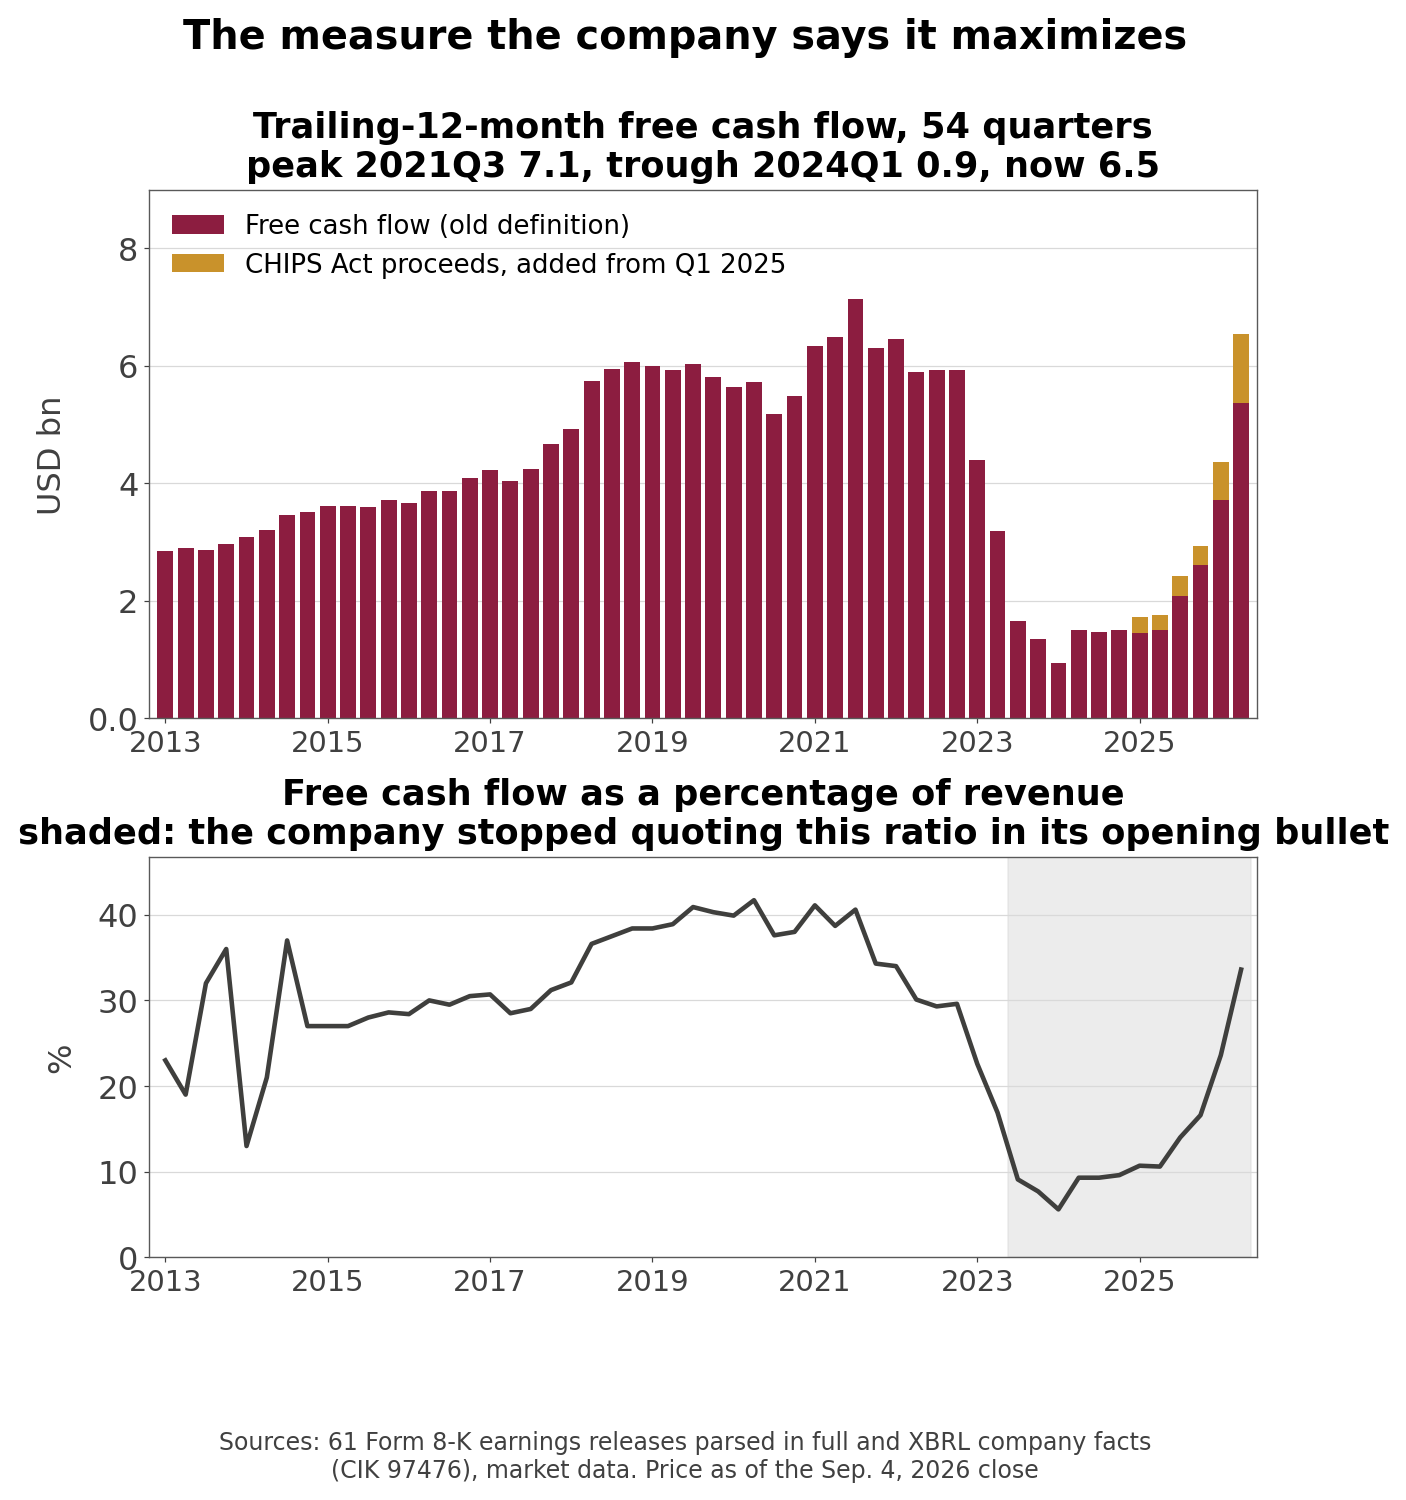
Trailing-12-month free cash flow across 54 quarters
The shape is simple. The peak was $7.13 billion in Q3 2021. The trough was $940 million in Q1 2024, a fall of 86.8%. This quarter it is $6.53 billion.
So what rebuilt it? The company's own non-GAAP reconciliation answers in three lines.
Where the $5.59 billion of recovery came from
Operating cash flow went from $6.28 billion to $8.67 billion, worth $2.39 billion. Capital expenditures fell from $5.34 billion to $3.31 billion, worth another $2.03 billion. And CHIPS Act proceeds contributed $1.18 billion. The three sum to $5.59 billion, which is exactly the total increase.
As shares of the recovery: 42.7%, 36.2% and 21.1%. Less than half of it came from the operating business. The rest is money not spent and money received.
The Sentence Texas Instruments Changed in Q1 2025
That third line deserves a closer look, because CHIPS Act proceeds were not part of this calculation until recently.
Filing footnote (non-GAAP reconciliation, Q2 2026 release): "Free cash flow is calculated as cash flows from operating activities (also referred to as cash flow from operations) less capital expenditures, plus proceeds from CHIPS Act incentives."
The company's non-GAAP reconciliation, with the CHIPS Act line in it
In the 2023 releases the same footnote read differently: "Free cash flow was calculated by subtracting capital expenditures from the most directly comparable GAAP measure, cash flows from operating activities." Running the definition sentence across all 61 releases pins the change to a single quarter. Texas Instruments changed the definition of free cash flow in Q1 2025. You can read the current wording in the Q2 2026 earnings release itself.
The effect is visible in this quarter's table. Operating cash flow of $8.67 billion less capex of $3.31 billion is $5.36 billion; adding $1.18 billion of direct CHIPS Act receipts gets to the reported $6.53 billion. A second footnote adds that operating cash flow itself includes $433 million of CHIPS Act investment tax credit used to reduce income taxes payable.
Together that is $1.61 billion, the same figure the chief financial officer gave on the earnings call when he said the trailing-twelve-month free cash flow "includes $1.6 billion of CHIPS Act incentives, both investment tax credits and direct funding." It is 24.7% of the reported number.
Free cash flow per share, before and after the definition change
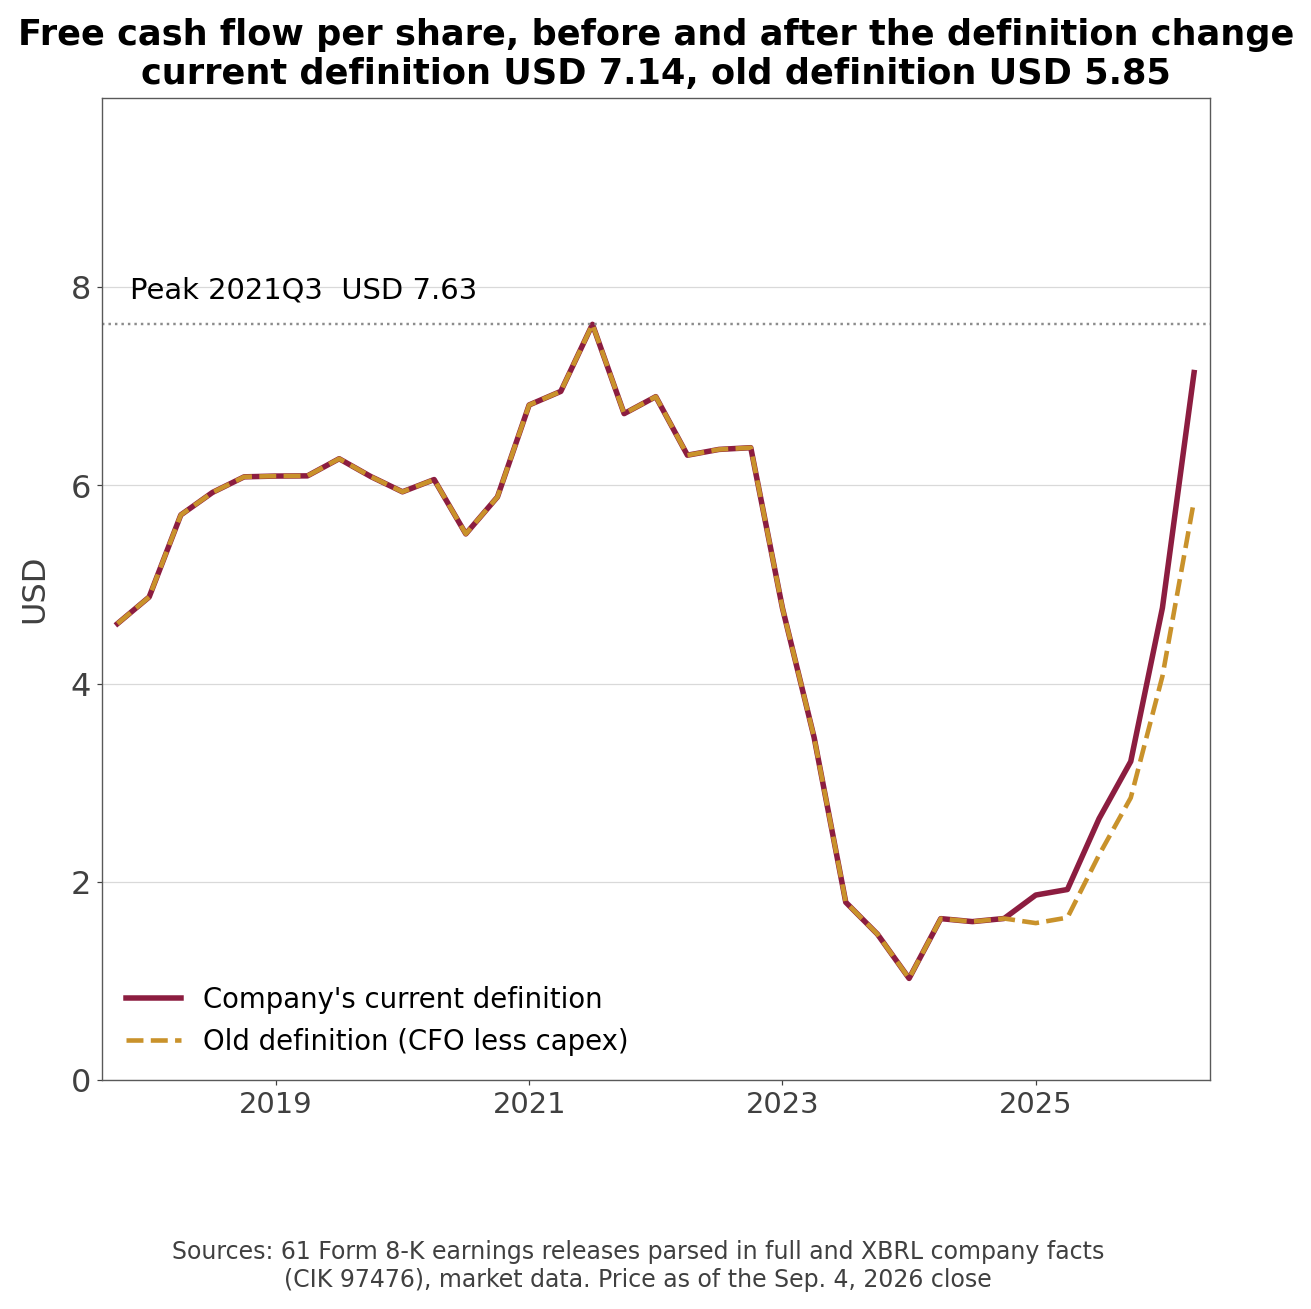
What the company says it maximizes is not the total but the figure per share. On that basis it is $7.14, still below the $7.63 peak of Q3 2021. On the old definition it is $5.85, or 23.3% below that peak. Five years on, the company's chosen yardstick has not made a new high.
The Percentage the Company Stopped Quoting
Parsing every release turns up more than numbers. It also shows when a sentence disappeared.
Own calculation (CEO commentary bullets, 54 quarters): from Q1 2020 through Q2 2023 the company followed the free cash flow figure with its margin every single quarter, in the form "free cash flow for the same period was $5.6 billion and 40% of revenue."
The Cash generation table the company repeats each quarter, under the definition sentence
The phrase disappears with the Q3 2023 release. Trailing free cash flow margin that quarter was 9.1%, the first single-digit reading in the series.
It has not come back. Margin is 33.6% this quarter and the CEO bullet still stops at "free cash flow for the same period was $6.5 billion."
What a company chooses to advertise, and what it quietly drops, is information. The hand that wrote 40% stopped writing at 9%, and at 33.6% it has not picked the phrase back up.
The Capex Cycle That Made the Rest of It
The 36.2% of the recovery that came from lower capital spending has a specific cause, and the company describes it plainly.
Filing footnote (fiscal 2025 Form 10-K, capital allocation): "In this period, we allocated about $24 billion to capital expenditures to support future revenue growth, which will be a greater component of free cash flow per share growth going forward, as we are near completion of our six-year elevated capital expenditures cycle."
Twenty-four billion dollars over six years, and by the company's own account the cycle is nearly done. The fiscal 2025 Form 10-K carries that sentence. The numbers agree: trailing capex has fallen from a peak of $5.34 billion in Q1 2024 to $3.31 billion, or from 31.8% of revenue to 17.0%.
Depreciation runs the other way. Over the same span it went from $1.26 billion to $2.12 billion, up 69%, and capex divided by depreciation has come down from 4.25x to 1.56x. Net property, plant and equipment is $11.9 billion against $2.5 billion in early 2017, so more depreciation is still ahead. Management framed Q3 gross margin around a 70% to 85% incremental fall-through excluding depreciation, which is a way of saying depreciation is now heavy enough to need excluding.
What Does Texas Instruments Sell?
The company makes analog chips and embedded processors. Analog parts handle continuous signals such as voltage, current, sound and light, and the contest there is not leading-edge process nodes but catalog breadth, product longevity and manufacturing cost. That is why owning 300mm wafer capacity is the core of the argument.
Segment
Q2 2026 revenue
Share
Year over year
Operating profit
Operating margin
Analog
$4.37bn
79.9%
+26.4%
$1.99bn
45.6%
Embedded Processing
$0.79bn
14.4%
+16.1%
$0.17bn
21.3%
Other
$0.31bn
5.7%
-2.2%
$0.15bn
48.4%
Analog is 80% of revenue at a 45.6% operating margin; embedded runs at less than half that. Company-wide trailing operating margin is 37.3%.
Revenue of $5.46 billion was up 13% sequentially and 23% year over year, with management pointing to industrial, data center and automotive. Trailing revenue of $19.45 billion is still 3.7% below the Q3 2022 peak of $20.19 billion. Inventory closed at $4.6 billion, or 196 days, down 13 days from the prior quarter.
Guidance for Q3 is revenue of $5.65 billion to $6.15 billion and earnings per share of $2.23 to $2.57.
US Factory Construction Has Rolled Over
The end of this capex cycle is not company-specific.
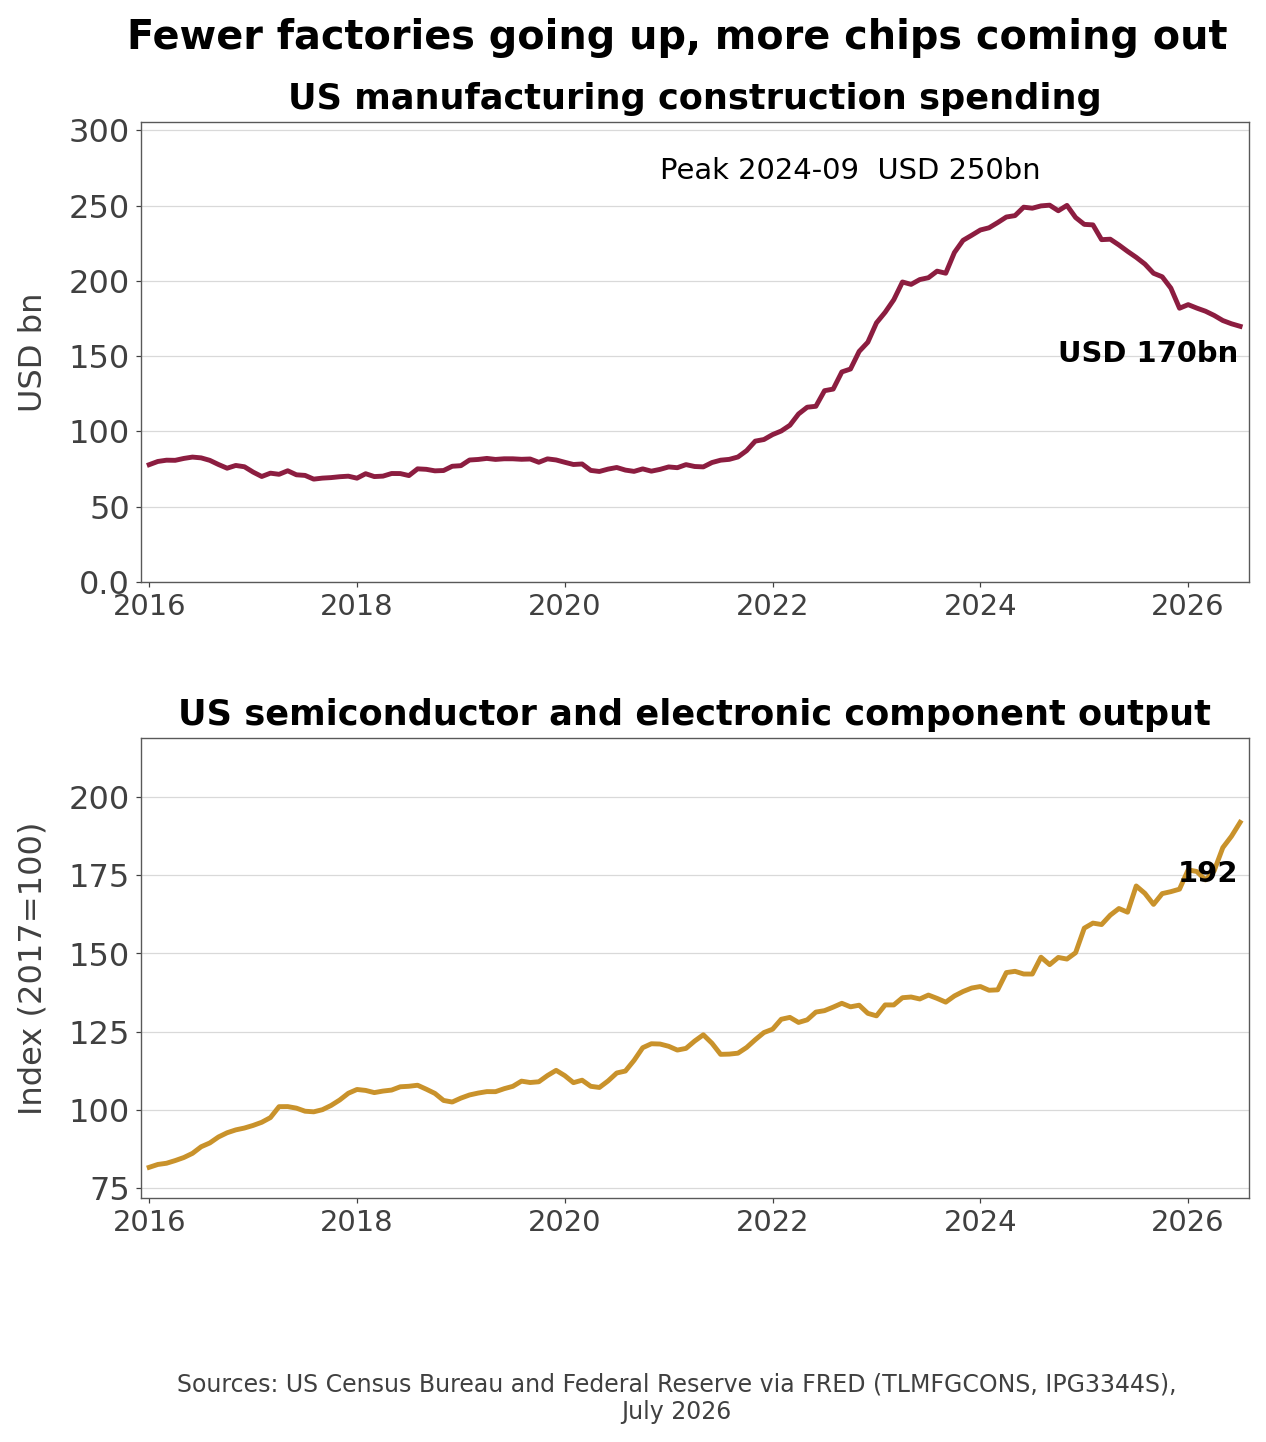
Official statistics (FRED TLMFGCONS, IPG3344S and PCU334413334413, July 2026): US manufacturing construction spending rose from $94.6 billion in December 2021 to $250.2 billion in September 2024, then fell back to $169.8 billion, or 32.1% below the peak.
US manufacturing construction spending and semiconductor output
Measure
July 2026
Year earlier
vs. end-2021
Manufacturing construction spending
$169.8bn
$215.6bn
+79.5%
Semiconductor and component output index
191.9
171.6
+53.9%
Semiconductor producer price index
29.0
29.8
-3.6%
Fewer factories going up, more output coming out, and prices falling. That combination defines the industry.
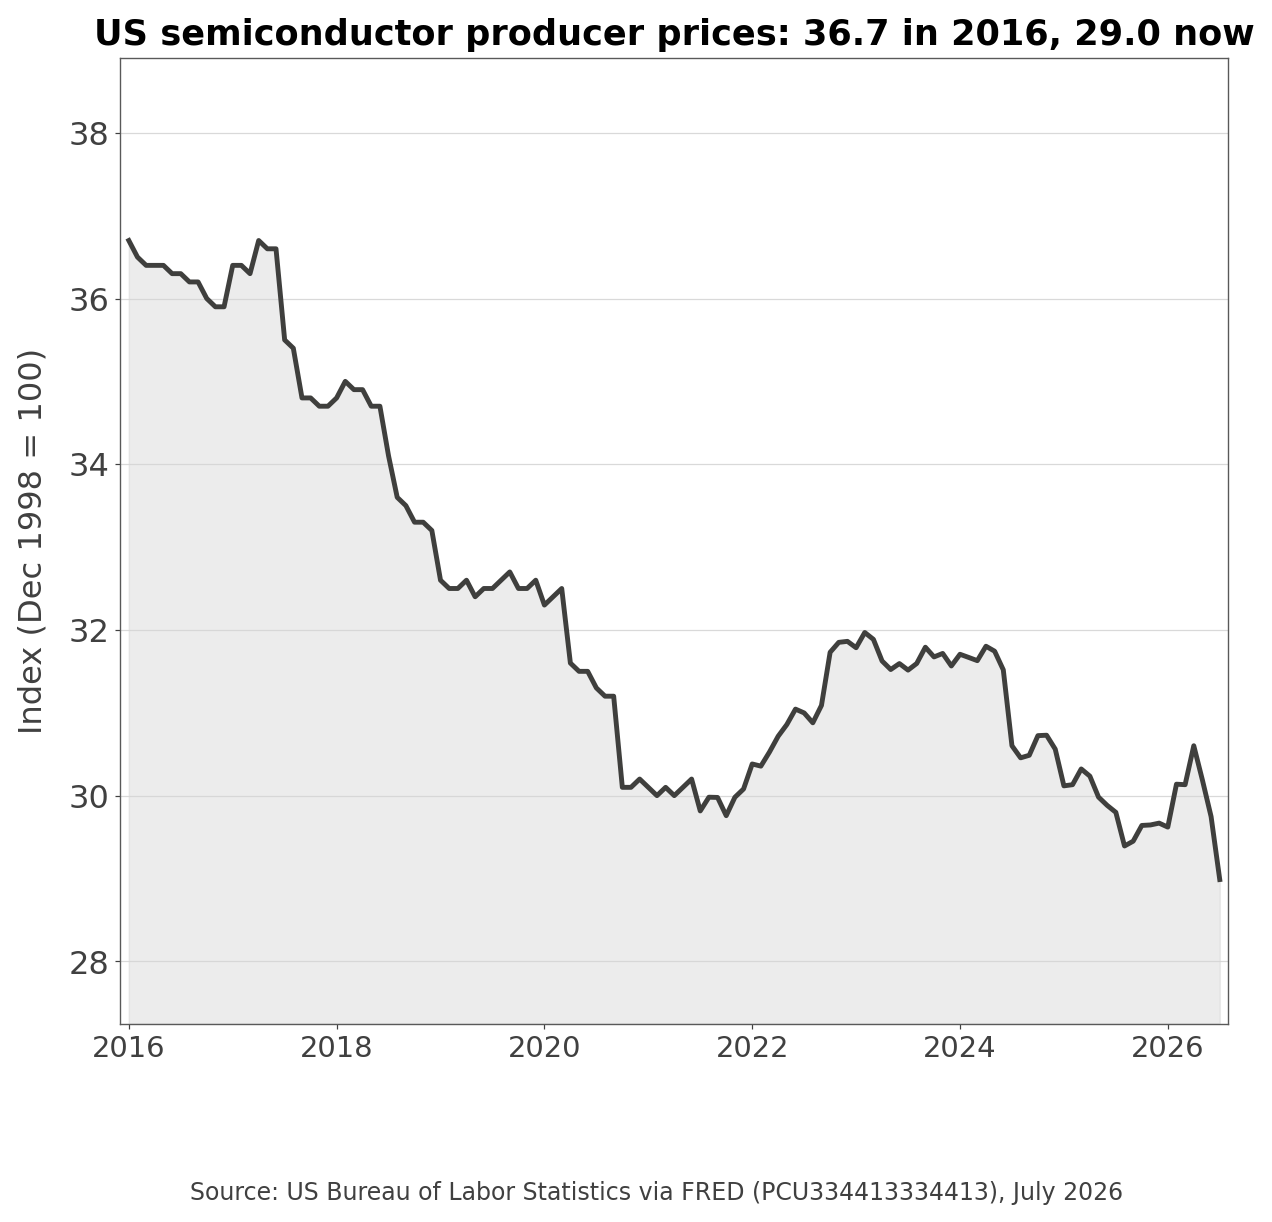
US semiconductor producer prices over a decade
The producer price index has gone from 36.7 in 2016 to 29.0, down 21.0% over ten years. Semiconductors are a volume business, which is exactly why the ability to run your own fabs cheaply becomes the margin. That is what the $24 billion bought.
The complication is that the government paid for a meaningful share of it. The CHIPS Act pays through both tax credits and direct funding, and the $1.61 billion inside trailing free cash flow is the result. As the building finishes, that line shrinks with it. What remains is added capacity on one side and the demand to fill it on the other, and the output index at 191.9 says the first half has already arrived.
Three Multiples Say Expensive, One Says Cheap
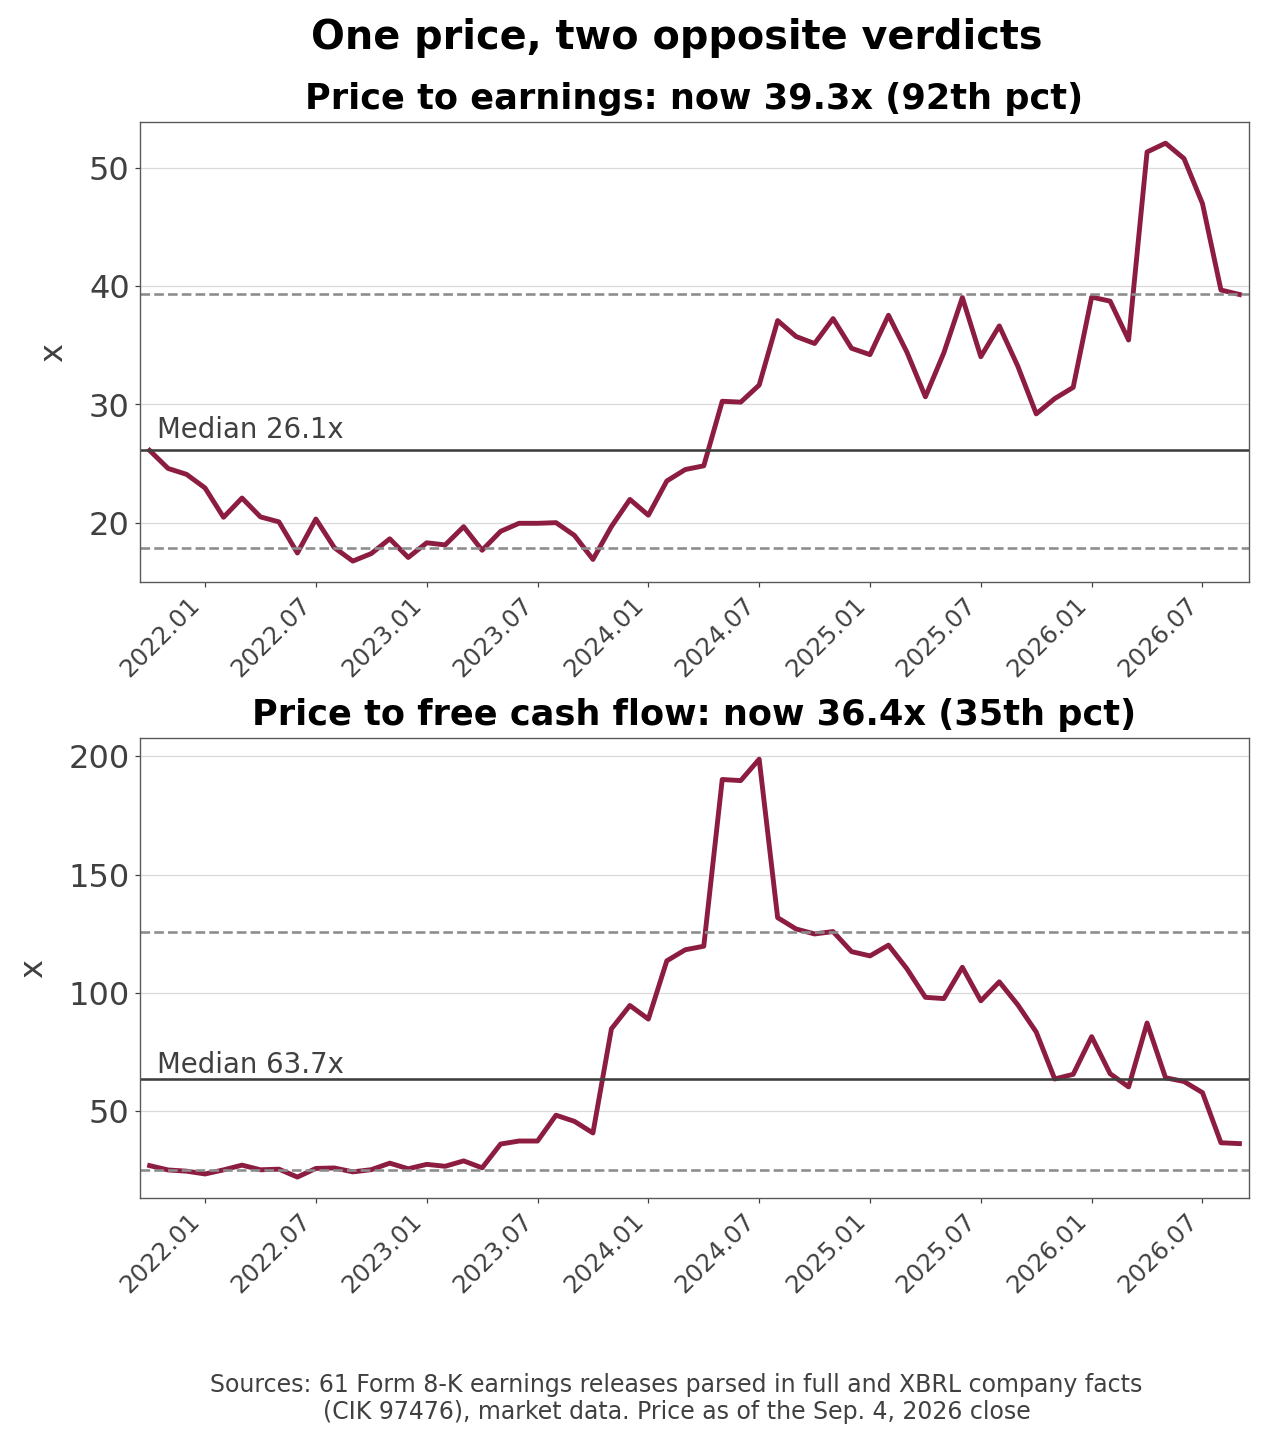
Aggregator cross-check (as of Sep. 4, 2026): I built 60 months of month-end market capitalization from closing prices times diluted share counts and computed the multiples directly. Against aggregator figures, price-to-earnings differs by 0.13%, price-to-sales by 0.02% and price-to-book by 0.79%.
Price to earnings and price to free cash flow over 60 months
Measure
Now
60-month median
Percentile
Price to earnings
39.3x
25.5x
92nd
Price to sales
12.2x
9.4x
90th
Price to book
13.2x
10.8x
85th
Price to free cash flow
36.4x
63.2x
35th
Three measures sit near the top decile and the fourth sits at the 35th percentile. The denominator explains it. Free cash flow collapsed to $940 million two years ago and is only now recovering, so the 63.2x median is itself inflated by that hole. In July 2024 this multiple reached 198.8x.
There is a second split. Two aggregators show price to free cash flow at 44.3x rather than 36.4x, because they use the old definition of operating cash flow less capital expenditures. Same price, same day, and the 7.9-point gap comes entirely from one sentence of definition.
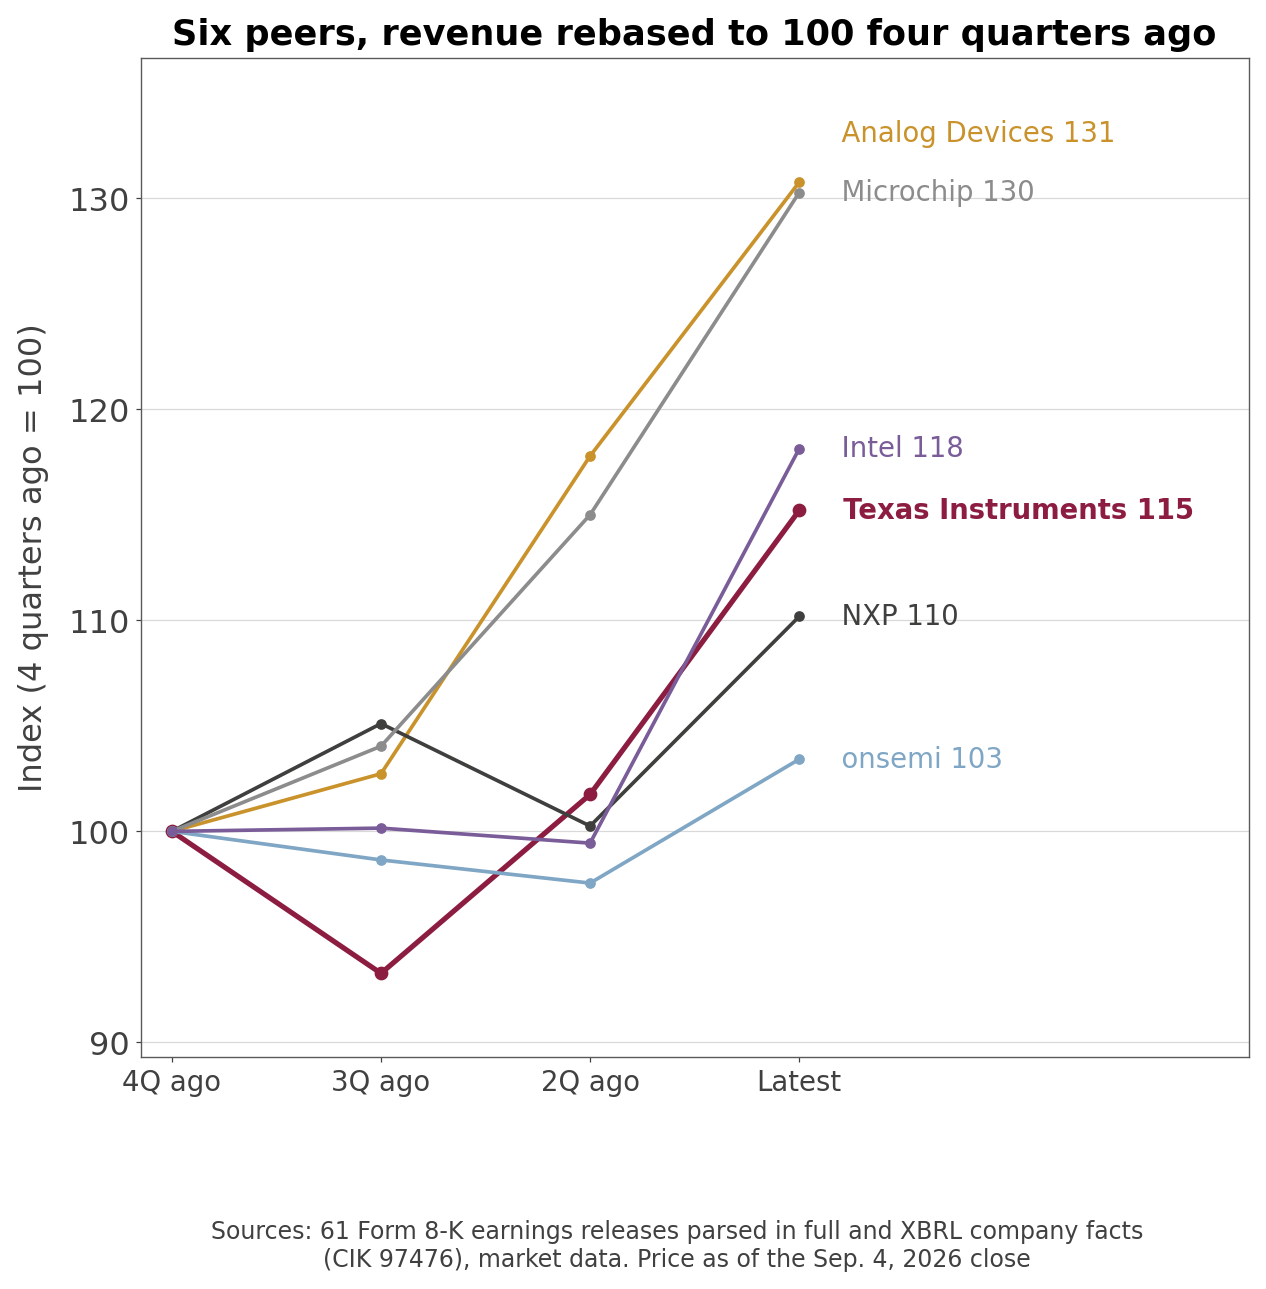
Six peers, revenue rebased to 100 four quarters ago
Company (Ticker)
Latest revenue
Year over year
Operating margin
P/S
P/B
Texas Instruments (TXN)
$5.46bn
+22.8%
42.6%
12.1x
13.1x
Analog Devices (ADI)
$4.02bn
+39.6%
39.5%
12.6x
5.2x
NXP (NXPI)
$3.50bn
+19.5%
30.4%
4.4x
5.0x
Microchip (MCHP)
$1.49bn
+38.1%
23.9%
7.9x
6.2x
onsemi (ON)
$1.60bn
+9.2%
19.5%
4.7x
4.0x
Intel (INTC)
$16.13bn
+25.4%
12.2%
8.8x
5.5x
Operating margin of 42.6% leads all six. Revenue recovery ranks fifth: rebased to 100 four quarters ago, Analog Devices is at 131 and Microchip at 130 while Texas Instruments is at 115.
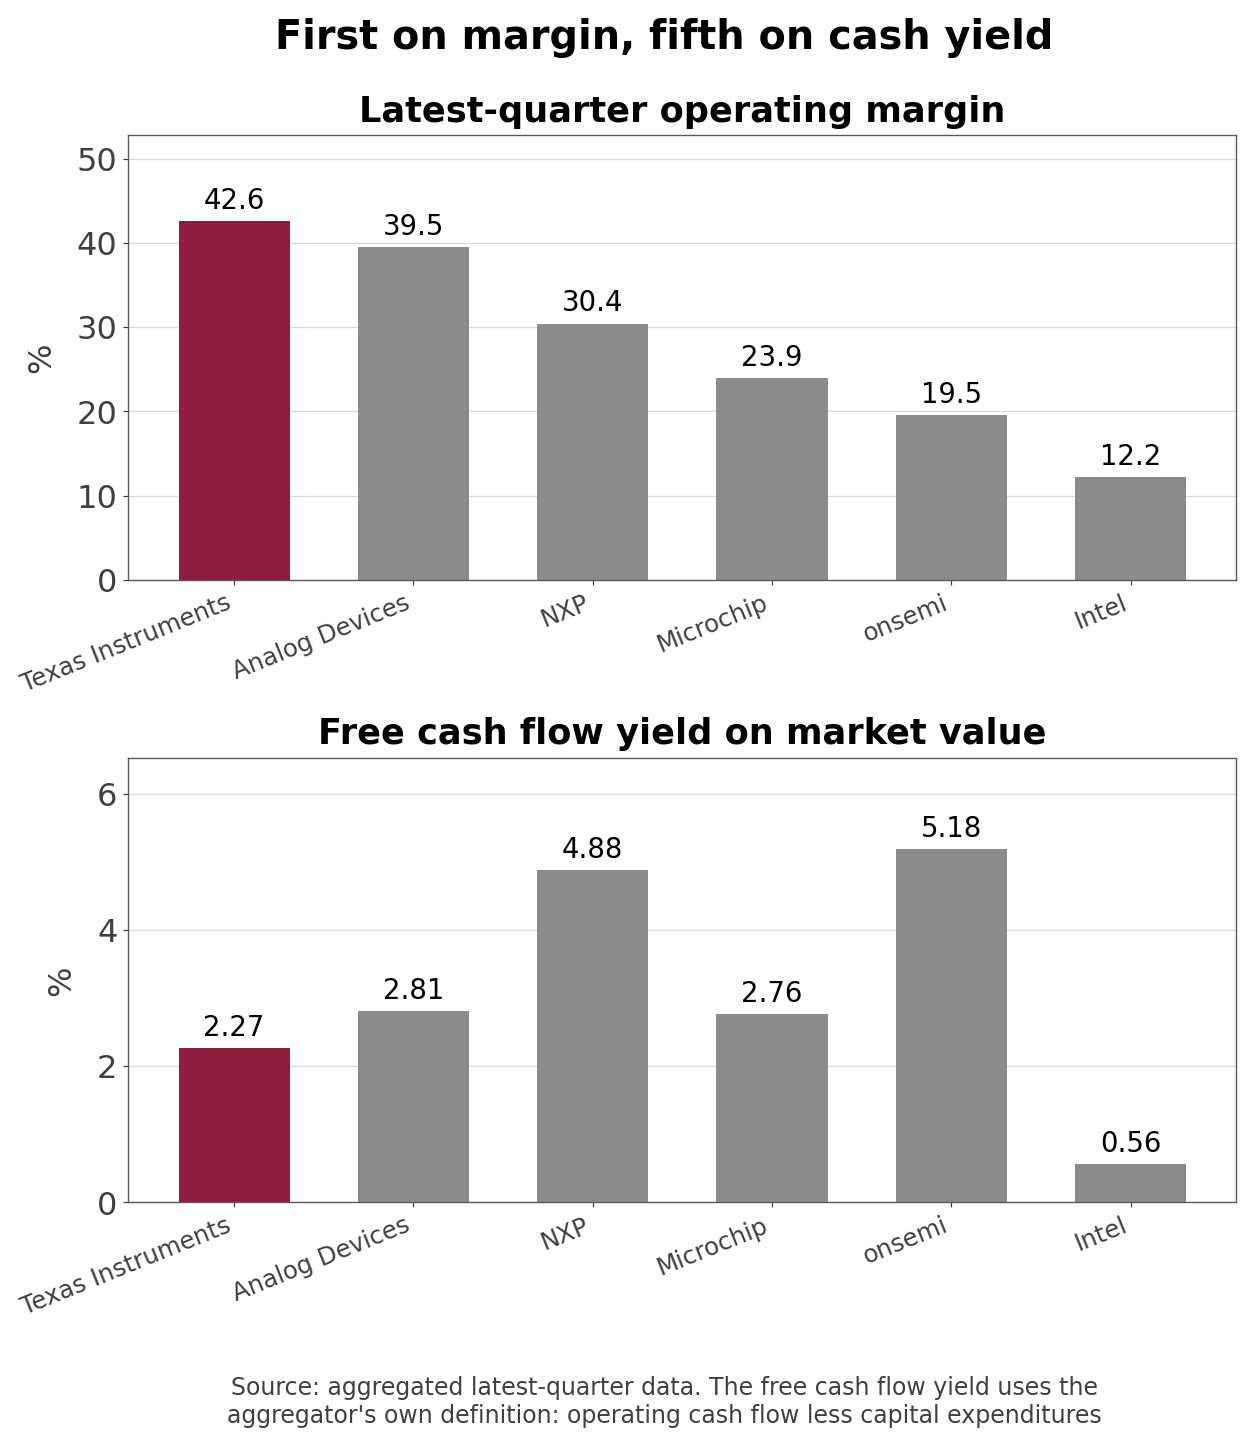
First on margin, fifth on cash yield
Company (Ticker)
Free cash flow yield
P/E
Forward P/E
Texas Instruments (TXN)
2.27%
39.3x
26.7x
Analog Devices (ADI)
2.81%
43.0x
22.8x
NXP (NXPI)
4.88%
19.4x
13.6x
Microchip (MCHP)
2.76%
109.3x
18.8x
onsemi (ON)
5.18%
47.7x
19.2x
Intel (INTC)
0.56%
loss-making
57.6x
Free cash flow yield of 2.27% ranks fifth of six. First on margin and fifth on cash yield in the same company says the market has already paid for the earnings.
Intel is here as a control. It made the same capex-plus-subsidy bet on the largest scale, and it carries a $503.4 billion market value on a trailing net loss of $11.29 billion. That is what the market currently pays for the trade Texas Instruments is finishing.
TXN Price Targets and Analyst Revisions
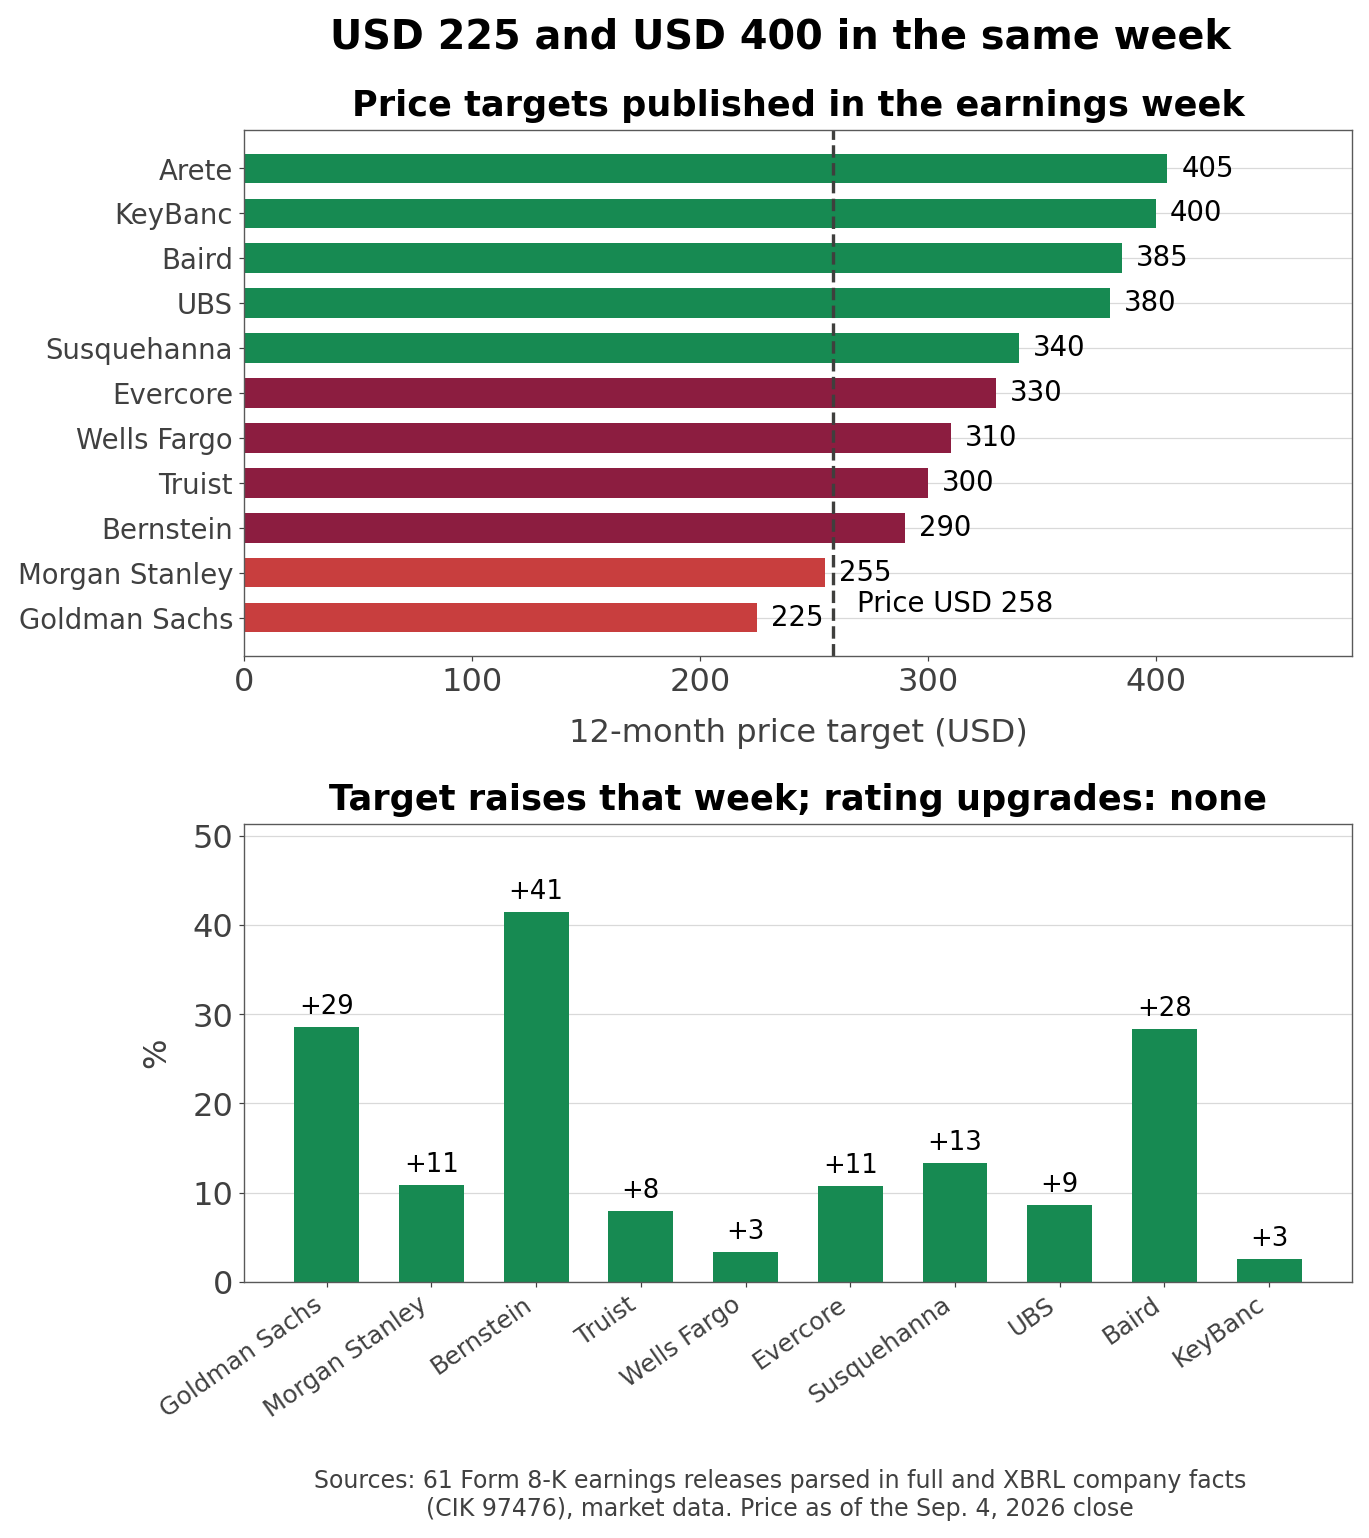
Aggregator cross-check (aggregated sell-side research, as of Sep. 4, 2026): across 36 analysts the twelve-month target averages $324.71 with a median of $340, a low of $225 and a high of $400. A second aggregator polling 65 analysts shows a $269 consensus, but its low still carries a stale $175 target, which drags the average down. Two services measuring the same thing differently is worth noting alongside the numbers.
Target distribution and the revisions of the earnings week; no rating upgrades
Date
Firm
Rating
Price target
2026-07-29
Arete Research
maintained
$405
2026-07-23
KeyBanc
maintained
390 → 400
2026-07-23
Robert W. Baird
maintained
300 → 385
2026-07-23
UBS
Buy
350 → 380
2026-07-23
Evercore ISI
Outperform
298 → 330
2026-07-23
Bernstein
Market Perform
205 → 290
2026-07-23
Morgan Stanley
Underweight
230 → 255
2026-07-21
Goldman Sachs
Sell
175 → 225
The day after the July 22 results more than ten firms raised targets at once. Rating upgrades over the last 90 days: zero. Fifteen reiterations and thirteen target changes.
Goldman Sachs lifted its target 29% and kept a Sell. Bernstein lifted its own 41% and kept Market Perform. These are marks catching up to the price rather than changes of conviction. With the stock at $258.44, the week's range ran from $225 to $400, and Arete Research added $405 a week later.
Earnings estimates move only one way. Over the last 30 days there were 25 upward revisions to this year's EPS and none downward.
Bull and Bear Conditions for TXN Stock
Scenario
Condition
Indicator to check
When · Source
Bull
Capex falls below 15% of revenue
Capital expenditures in the reconciliation
Q3 2026 release
Bull
Trailing revenue clears the $20.2bn record
Quarterly revenue
Q3 2026 release
Bull
Free cash flow margin holds 30% without CHIPS Act receipts
Non-GAAP reconciliation
Q3 2026 release
Bear
Rising depreciation caps gross margin again
Quarterly gross margin
Q3 2026 release
Bear
CHIPS Act receipts drop sharply and free cash flow stalls
CHIPS Act line in the reconciliation
Q3 2026 release
Bear (multiple)
Earnings recover but the 92nd-percentile P/E does not hold
Price to earnings versus the 60-month band
Monthly
Guidance for Q3 is revenue of $5.65 billion to $6.15 billion and EPS of $2.23 to $2.57. CHIPS Act receipts are not guided separately.
Questions This Analysis Does Not Answer
How much CHIPS Act money is still to come?
The company discloses quarterly receipts and tax credits after the fact but not the remaining total or the schedule by year. The reconciliation cannot tell you what is left.
How much did the 300mm transition cut unit costs?
Management cites the benefit of 300mm production every quarter without disclosing cost by wafer size or the share of output it represents. The 61% gross margin is as far as the filings go.
How large is the data center business?
Industrial, data center and automotive were named as the drivers of this quarter's growth, but the company reports three segments by product type only. End-market revenue is outside the disclosure.
Every company figure here comes from filings with the US Securities and Exchange Commission. I downloaded all 311 Form 8-K filings Texas Instruments has made, identified the 61 quarterly earnings releases among them, and parsed the "Cash generation" table and the CEO commentary bullets from each. The quarter label appears in three different formats across that span (4Q13, 1Q16 and Q2 2020), so all three were handled; no quarter between Q1 2013 and Q2 2026 is missing, and the table's internal identity was checked in every one. The non-GAAP definition sentence was extracted separately from each release to date the Q1 2025 change. Quarterly income statement figures come from XBRL company facts; capital expenditures and depreciation were rebuilt from year-to-date cash flow tags by differencing the quarterly, half-year, nine-month and annual layers, then checked against the capex and operating cash flow the company prints in its own release table, which matched in every quarter. Multiples were built from month-end closing prices times diluted share counts. Industry figures come from the US Census Bureau, the Federal Reserve and the Bureau of Labor Statistics via FRED. Analyst counts, price targets and estimate revisions are aggregated sell-side research as of Sep. 4, 2026. Prices are the Sep. 4, 2026 close, the last completed session before publication. This is research, not investment advice.