ASML (ASML) Q2 2026 Earnings: Record Margin, Missing Line
ASML Holding NV (NASDAQ: ASML) reported second-quarter 2026 net sales of $10.9 billion equivalent, or €9.33 billion, with an operating margin of 37.1%, the highest in twelve quarters. The summary table at the top of that press release no longer carries a line the company had published for twenty straight quarters: net bookings. This ASML stock analysis works through what disappeared, what the company said instead, and which numbers still let an investor check the claim.
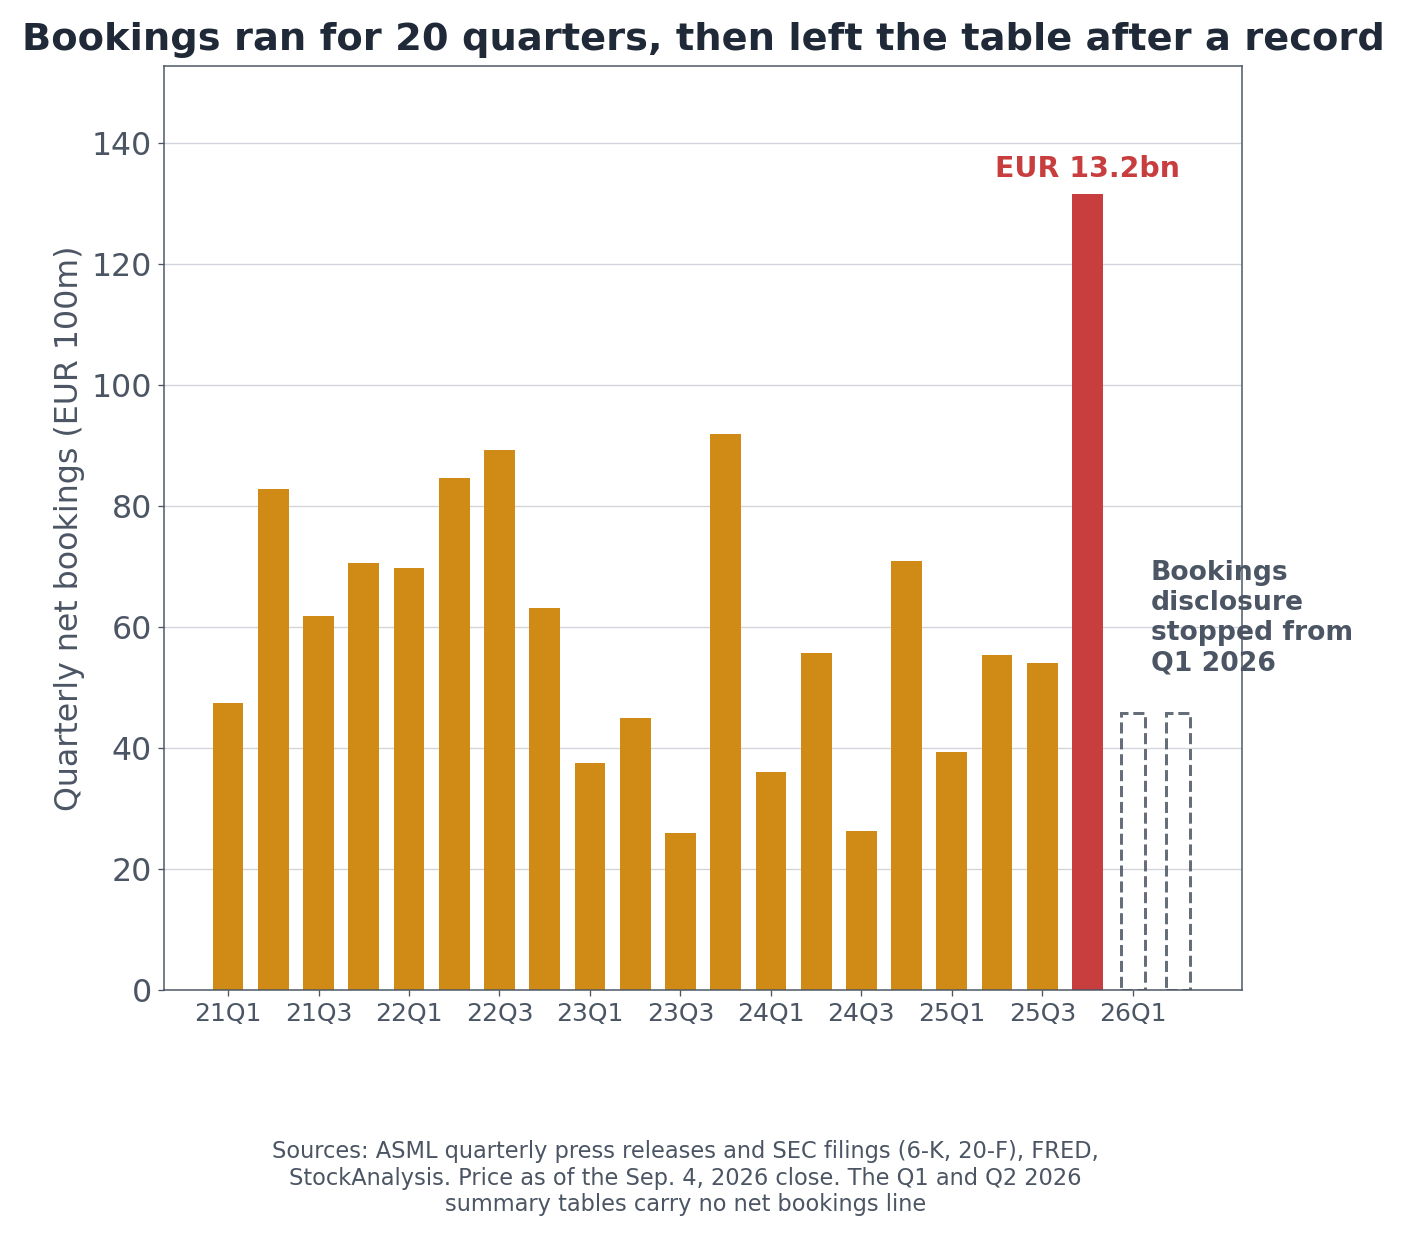
Here is the part worth pausing on. The last bookings figure ASML published was €13.16 billion for the fourth quarter of 2025, the largest of the twenty quarters on record. The line vanished from the very next release.
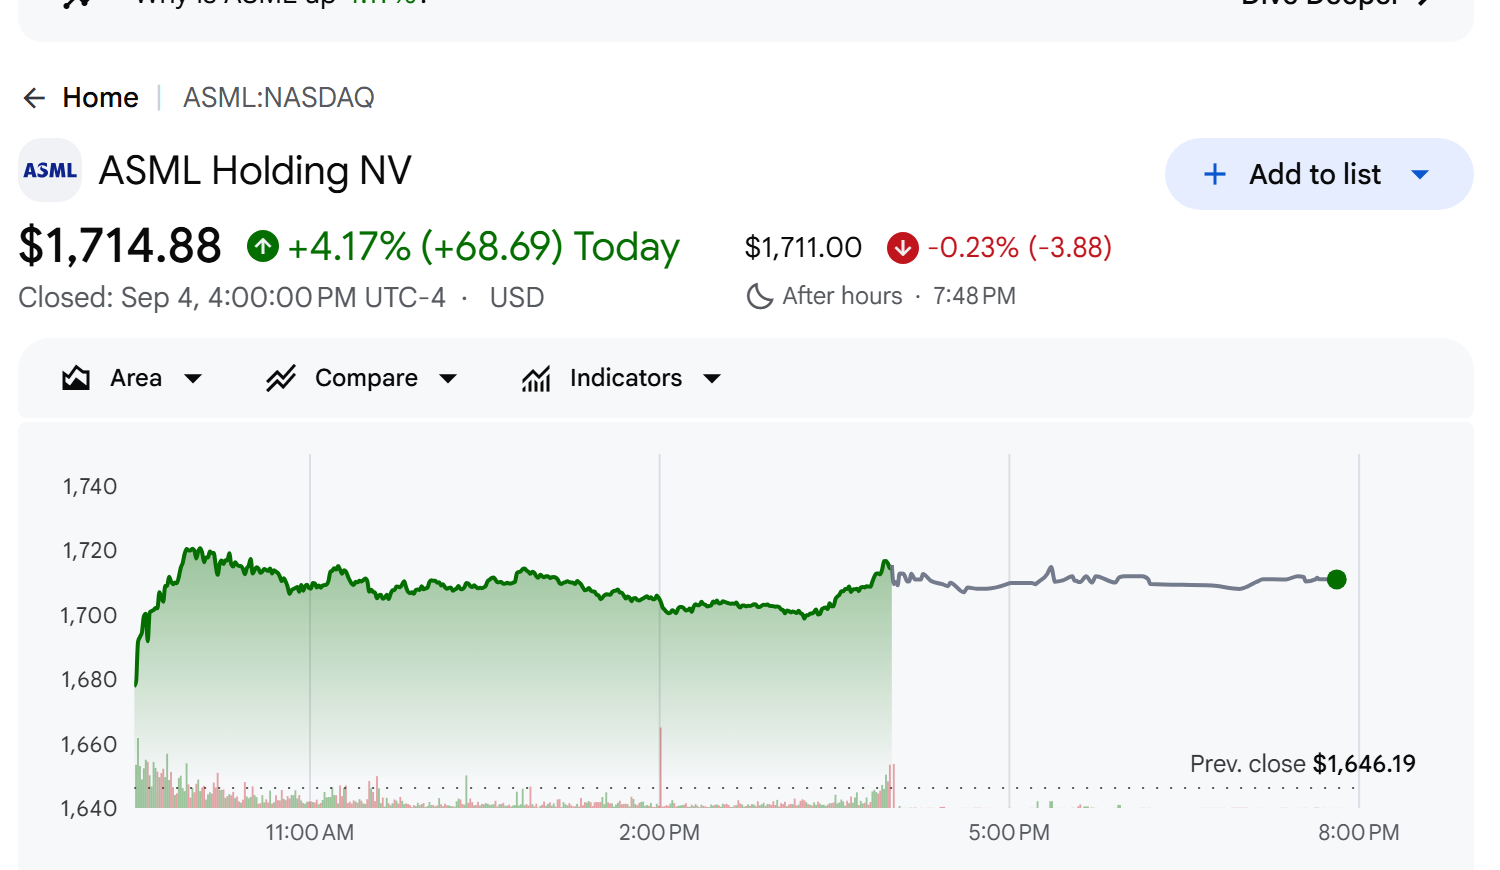
ASML Holding NV (ASML) on Google Finance, September 4, 2026 close
The stock closed at $1,714.88 on September 4, up +4.17% on the day and +123.42% over twelve months. Market capitalization is $654.9 billion on 384.1 million shares. The company reports in euros and trades in dollars, which matters for every multiple below.
Item
Q2 2026
Q2 2025
Change
Total net sales
€9,326m
€7,692m
+21.3%
System sales
€6,564m
€5,596m
+17.3%
Installed Base Management sales
€2,762m
€2,096m
+31.8%
Gross margin
54.0%
53.7%
+0.3pt
Operating margin
37.1%
34.6%
+2.5pt
Net income
€2,918m
€2,290m
+27.4%
EPS (basic)
€7.59
€5.90
+28.6%
Source: ASML second-quarter 2026 press release, filed on Form 6-K July 15, 2026. System sales are total net sales less Installed Base Management sales.
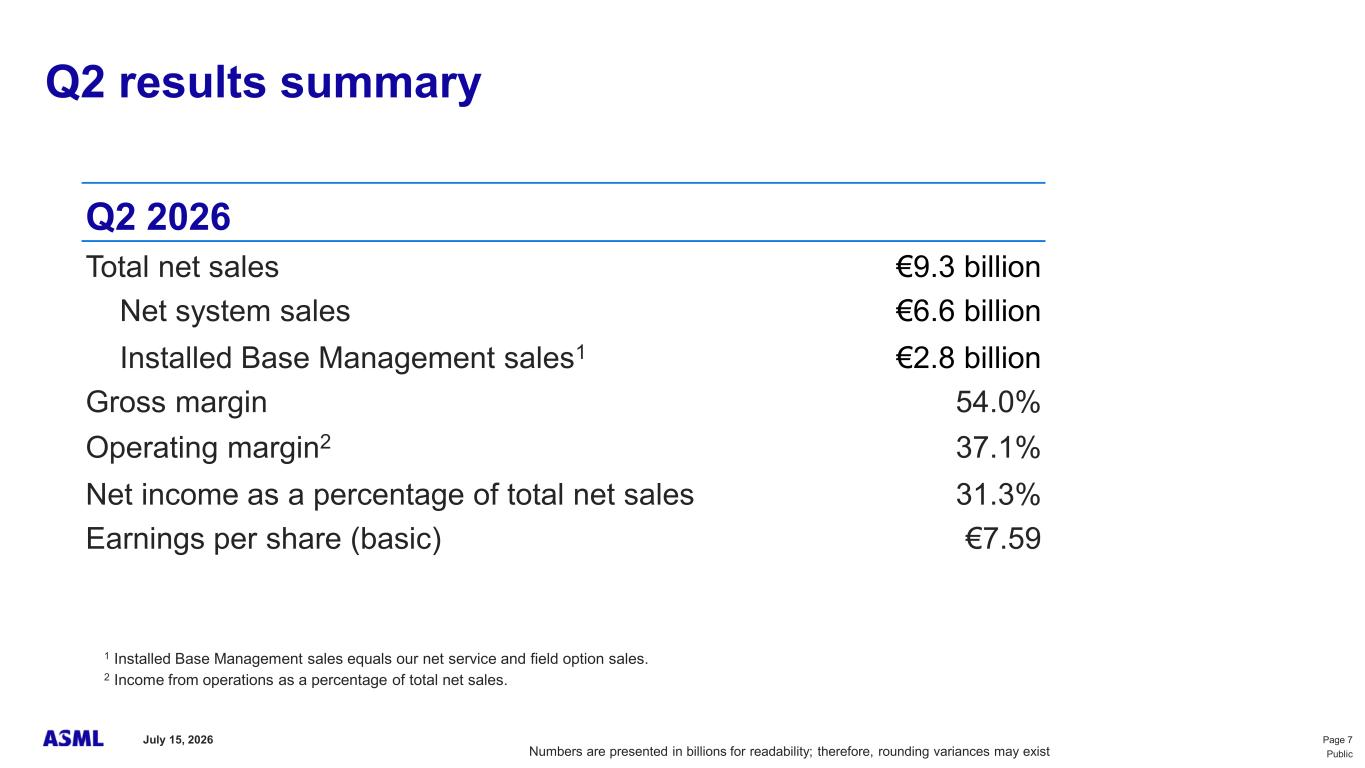
ASML second-quarter 2026 results summary, from the company's earnings presentation
Gross margin of 54.0% came in above the 51% to 52% the company had guided. CEO Christophe Fouquet attributed the beat to "higher than expected Installed Base Management sales." The upside came from machines already installed, not from machines newly shipped.
What Does ASML Do? Two Revenue Streams, One Monopoly
ASML sells lithography systems and then sells the service and performance upgrades that keep those systems running. The company calls the second stream Installed Base Management.
In the second quarter, systems brought in €6.56 billion and services €2.76 billion. The service share of 29.6% is the highest across twenty-two quarters; three years ago it was 18.8%. Services carry higher margin and, unlike systems, do not depend on winning a new order.
The systems side splits into EUV and DUV. Extreme ultraviolet tools pattern the most advanced logic and memory layers, deep ultraviolet tools handle everything below. ASML is the only company in the world that builds EUV. On the second-quarter call, management said it plans to raise low-NA EUV output roughly 30% for 2027 and is studying another 30% for 2028.
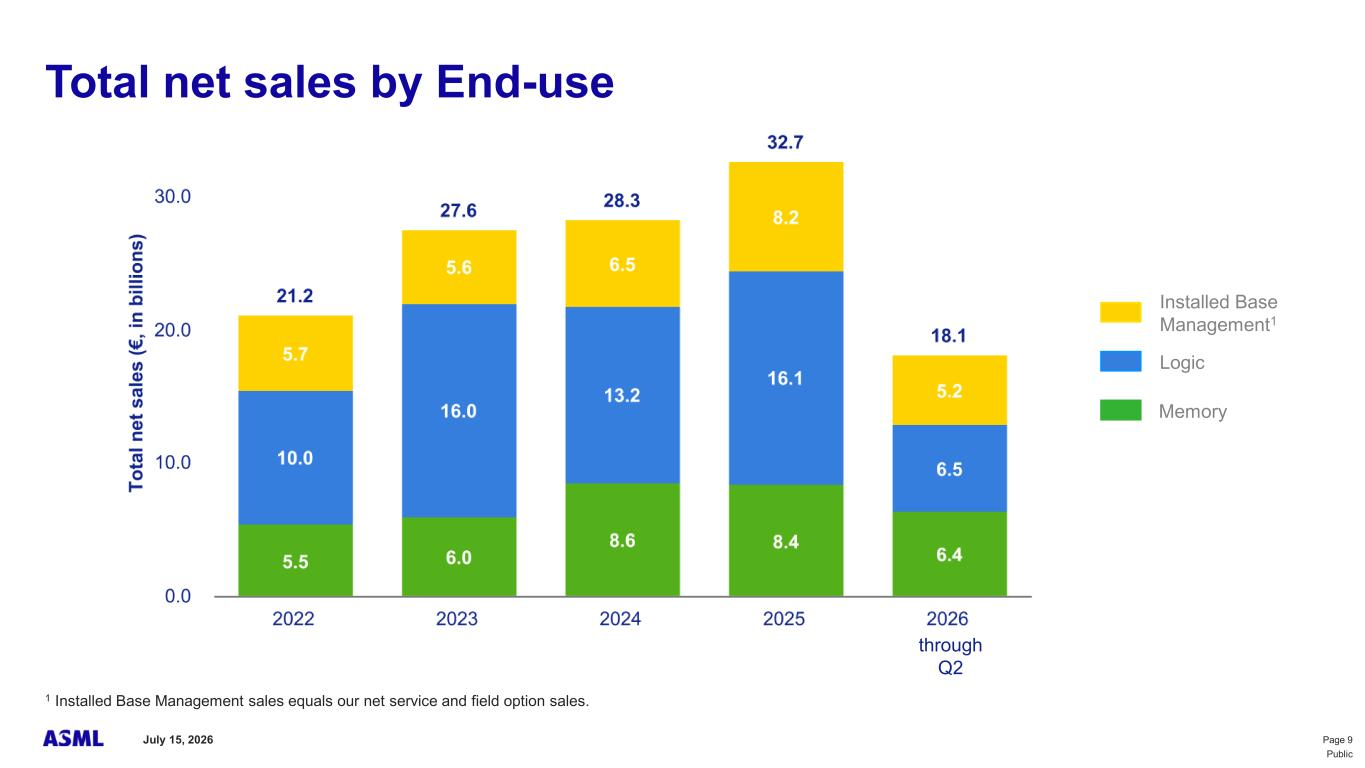
ASML net sales by end use, from the company's earnings presentation
The customer list is short: TSMC, Samsung and Intel in leading-edge logic, SK Hynix and Micron in memory. Management repeated on the call that China should account for around 20% of annual net sales.
The Bookings Number Disappeared After Twenty Quarters
From the first quarter of 2021 through the fourth quarter of 2025, ASML printed net bookings in the summary table of every quarterly press release. Twenty consecutive quarters. The first-quarter 2026 release does not have it. Neither does the second.
ASML quarterly net bookings across twenty-two quarters, absent from the summary table from Q1 2026
The timing is what makes it worth noticing. The final published figure, €13.16 billion for the fourth quarter of 2025, was the highest of the twenty. Of that, €7.4 billion was EUV, and year-end backlog stood at €38.8 billion. The company called it a "record order intake" in that same release.
Neither 2026 release explains the change. What replaced the number is language. The first-quarter release says order intake continues to be very strong; the second says order intake remained extremely strong. CFO Roger Dassen told analysts that "our backlog continues to grow across a diverse customer base."
There is a fair case for the company here. Quarterly bookings swing violently: from €2.60 billion in the third quarter of 2023 to €13.16 billion in the fourth quarter of 2025, a five-fold range. A handful of large contracts crossing a quarter boundary moves the whole figure, and that volatility has moved the stock before. Dropping a noisy quarterly disclosure is defensible.
The difficulty is what fills the gap. Investors watched bookings because it was the only public number that pointed six to twelve months ahead. An adjective cannot be plotted.
ASML Sold 33 Fewer Systems and Grew Revenue Anyway
With bookings gone, the remaining disclosures have to carry the load. Unit count and revenue per unit come first.
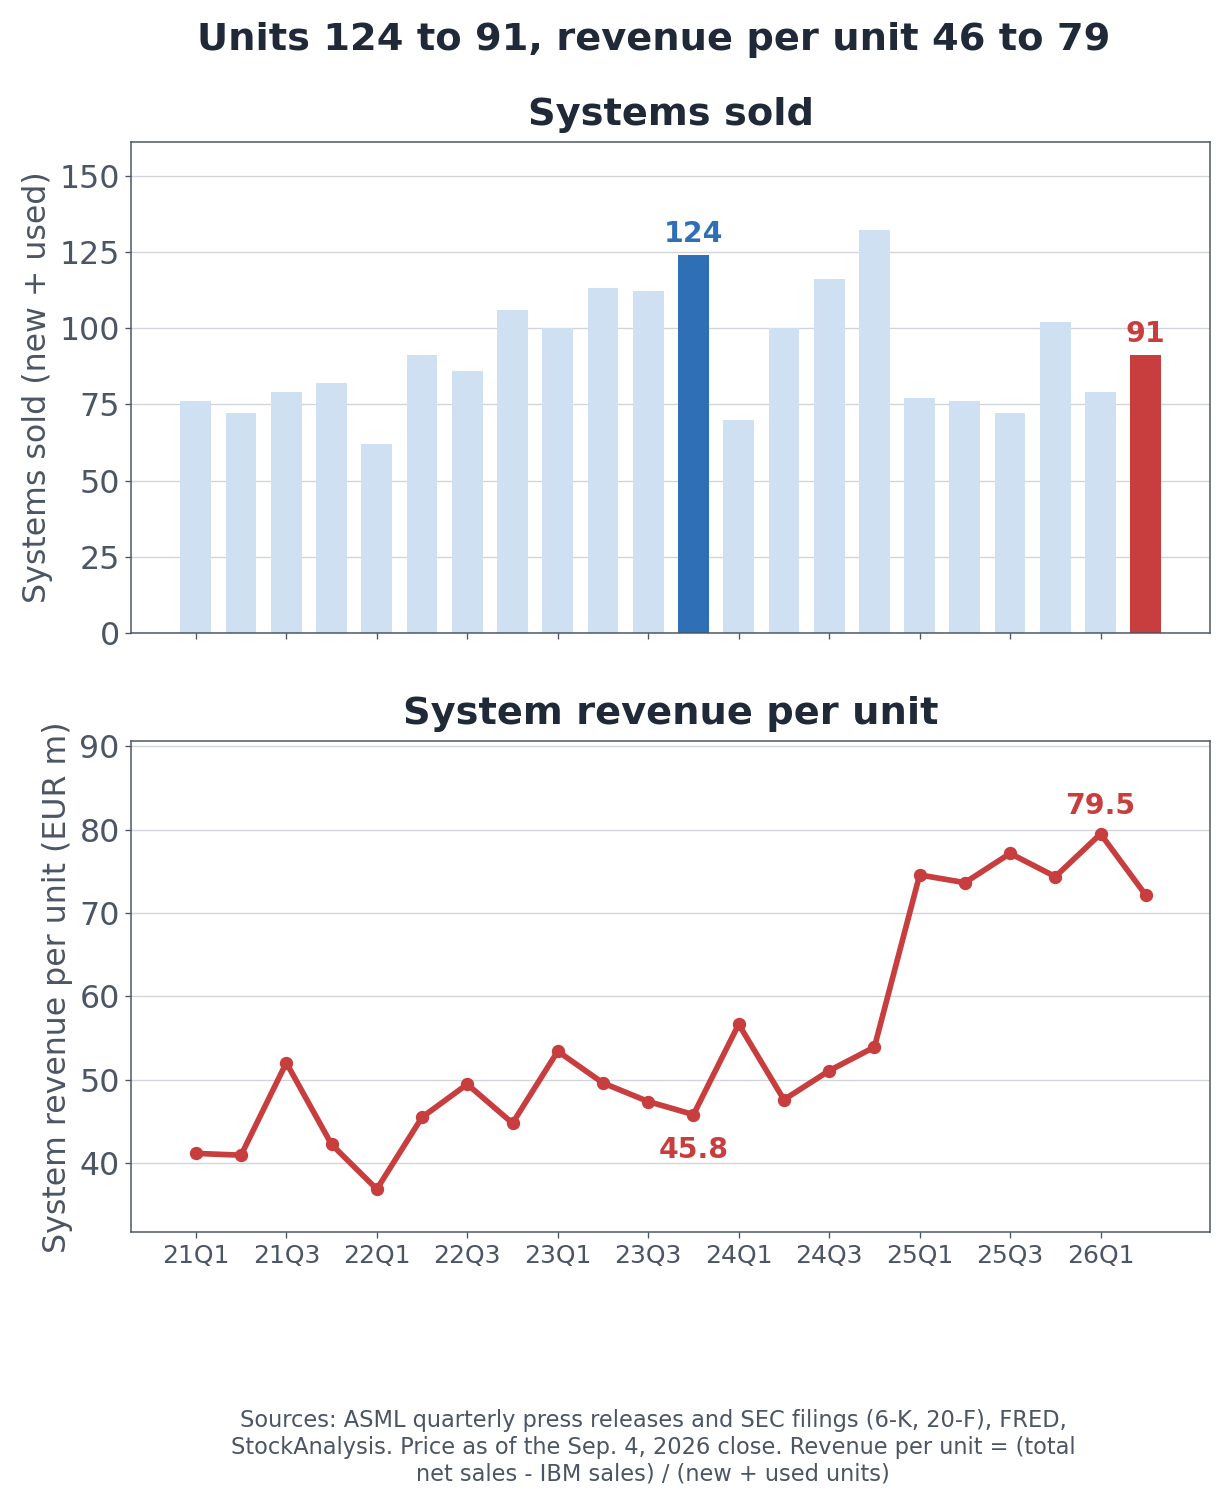
ASML lithography units sold and system revenue per unit, Q1 2021 through Q2 2026
In the fourth quarter of 2023 ASML shipped 113 new and 11 used systems, 124 in all, for €5.68 billion of system revenue. That is €45.8 million per unit. In the second quarter of 2026 it shipped 86 new and 5 used, 91 in all, for €6.56 billion, or €72.1 million per unit. Thirty-three fewer machines, €882 million more revenue.
The step change lands in the first quarter of 2025, when revenue per unit jumped from €53.9 million to €74.6 million in a single quarter and stayed in the seventies afterward. That is when the EUV share of shipments changed shape.
Management does not dispute the reading. Asked about value-based pricing on the call, Dassen agreed that "the current environment provides more flexibility on pricing than in the past," while adding that long order lead times mean it "will not immediately translate into a price effect tomorrow." Today's per-unit figure reflects contracts signed several quarters ago.
The second check is guidance the company raised on its own.
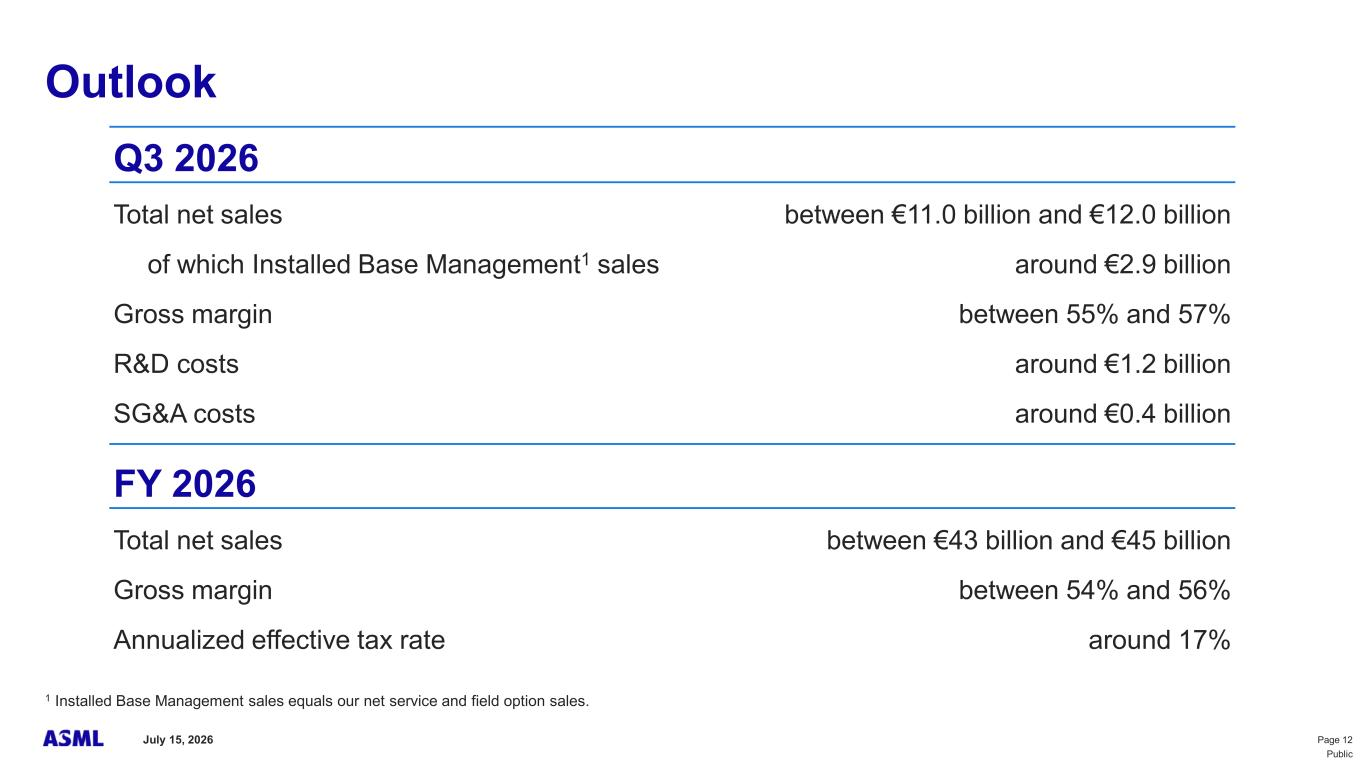
ASML third-quarter and full-year 2026 outlook, from the company's earnings presentation
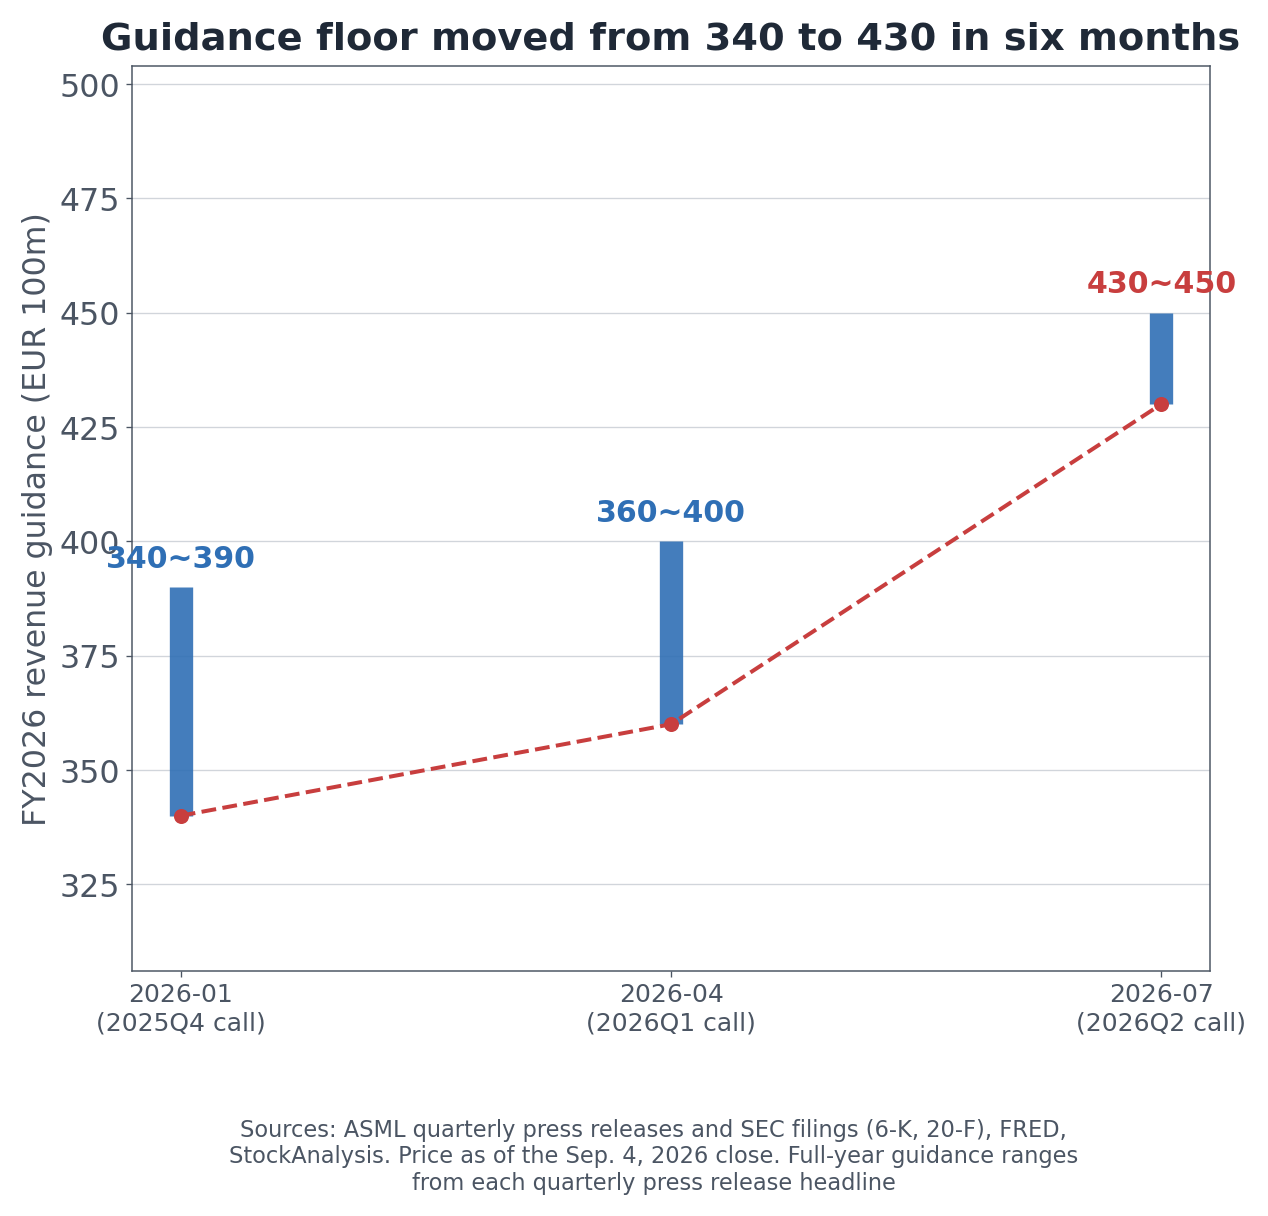
In January ASML guided 2026 revenue to €34 billion to €39 billion. In April it moved to €36 billion to €40 billion, and in July to €43 billion to €45 billion. The floor rose €9 billion in six months. Third-quarter guidance of €11.0 billion to €12.0 billion implies a jump of more than 20% from the €9.3 billion just reported.
ASML full-year 2026 revenue guidance across three quarterly releases
The third check sits on the balance sheet: contract liabilities, the cash customers pay before a machine arrives.
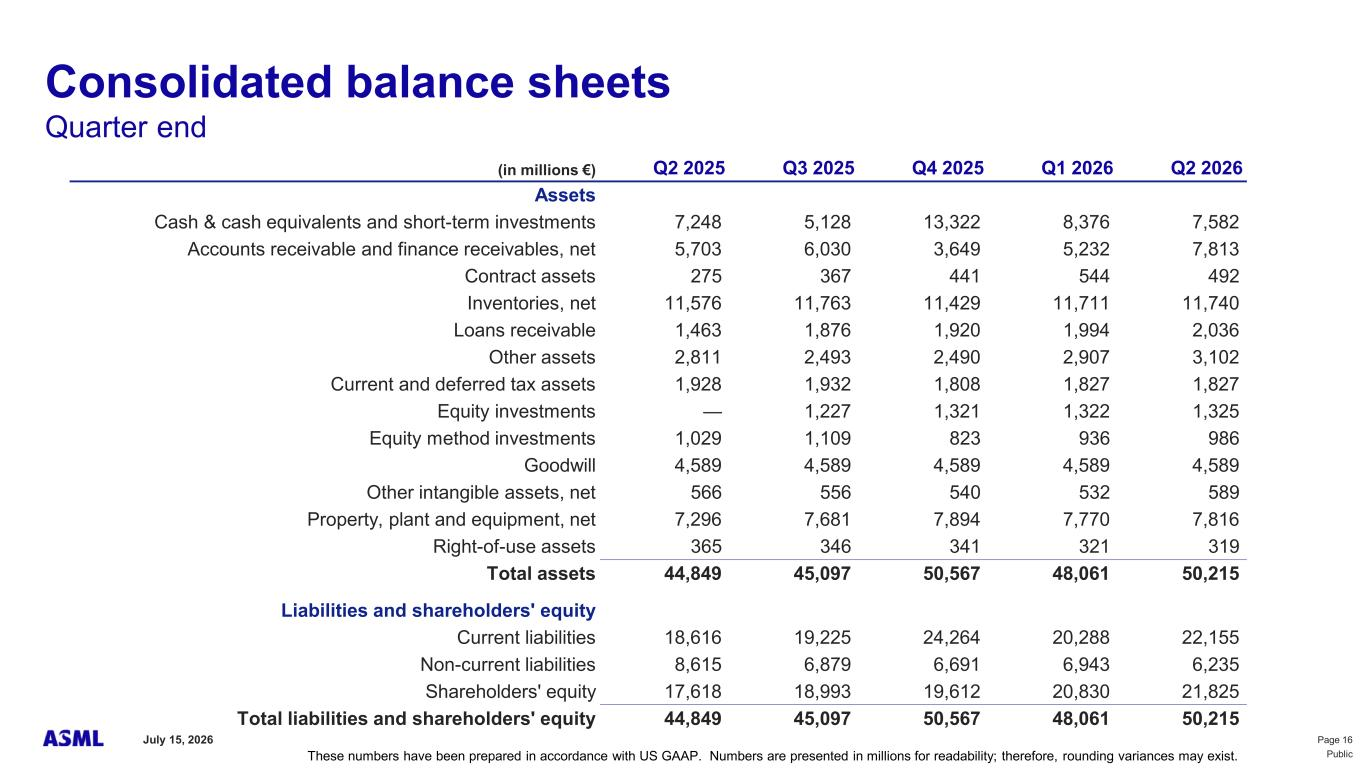
ASML condensed balance sheet across five quarters, from the company's earnings presentation
Contract liabilities totaled €19.37 billion at the end of 2025 and €17.43 billion at June 28, 2026, a decline of €1.94 billion. More prepaid cash was consumed by deliveries in the first half than new prepayments brought in. That points the other way from "backlog continues to grow."
The two are not strictly contradictory. Backlog is the total value of accepted orders; contract liabilities are only the portion already collected in cash. A change in payment terms would move one without the other. What is certain is narrower: with bookings gone, the remaining indicators disagree, and the investor now closes that gap alone.
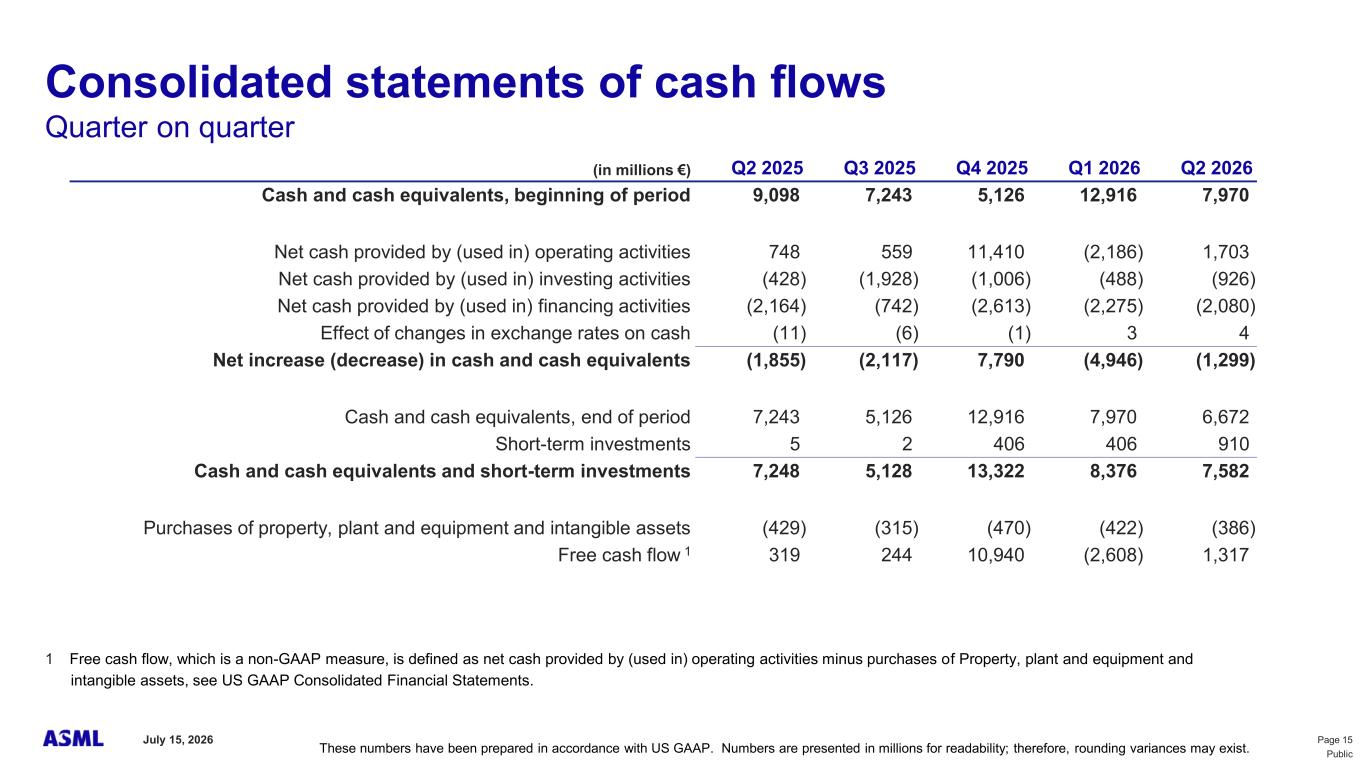
ASML condensed cash flow statement across five quarters, from the company's earnings presentation
Cash flow tells the same story. Operating cash flow in the fourth quarter of 2025 was €11.41 billion against €9.72 billion of revenue that quarter, with free cash flow of €10.94 billion. Prepayments arrived in the quarter bookings peaked. Free cash flow in the first quarter of 2026 was negative €2.61 billion. Read one quarter alone and the direction is wrong.
US Semiconductor Demand and Capacity Utilization
Two forward indicators point different ways.
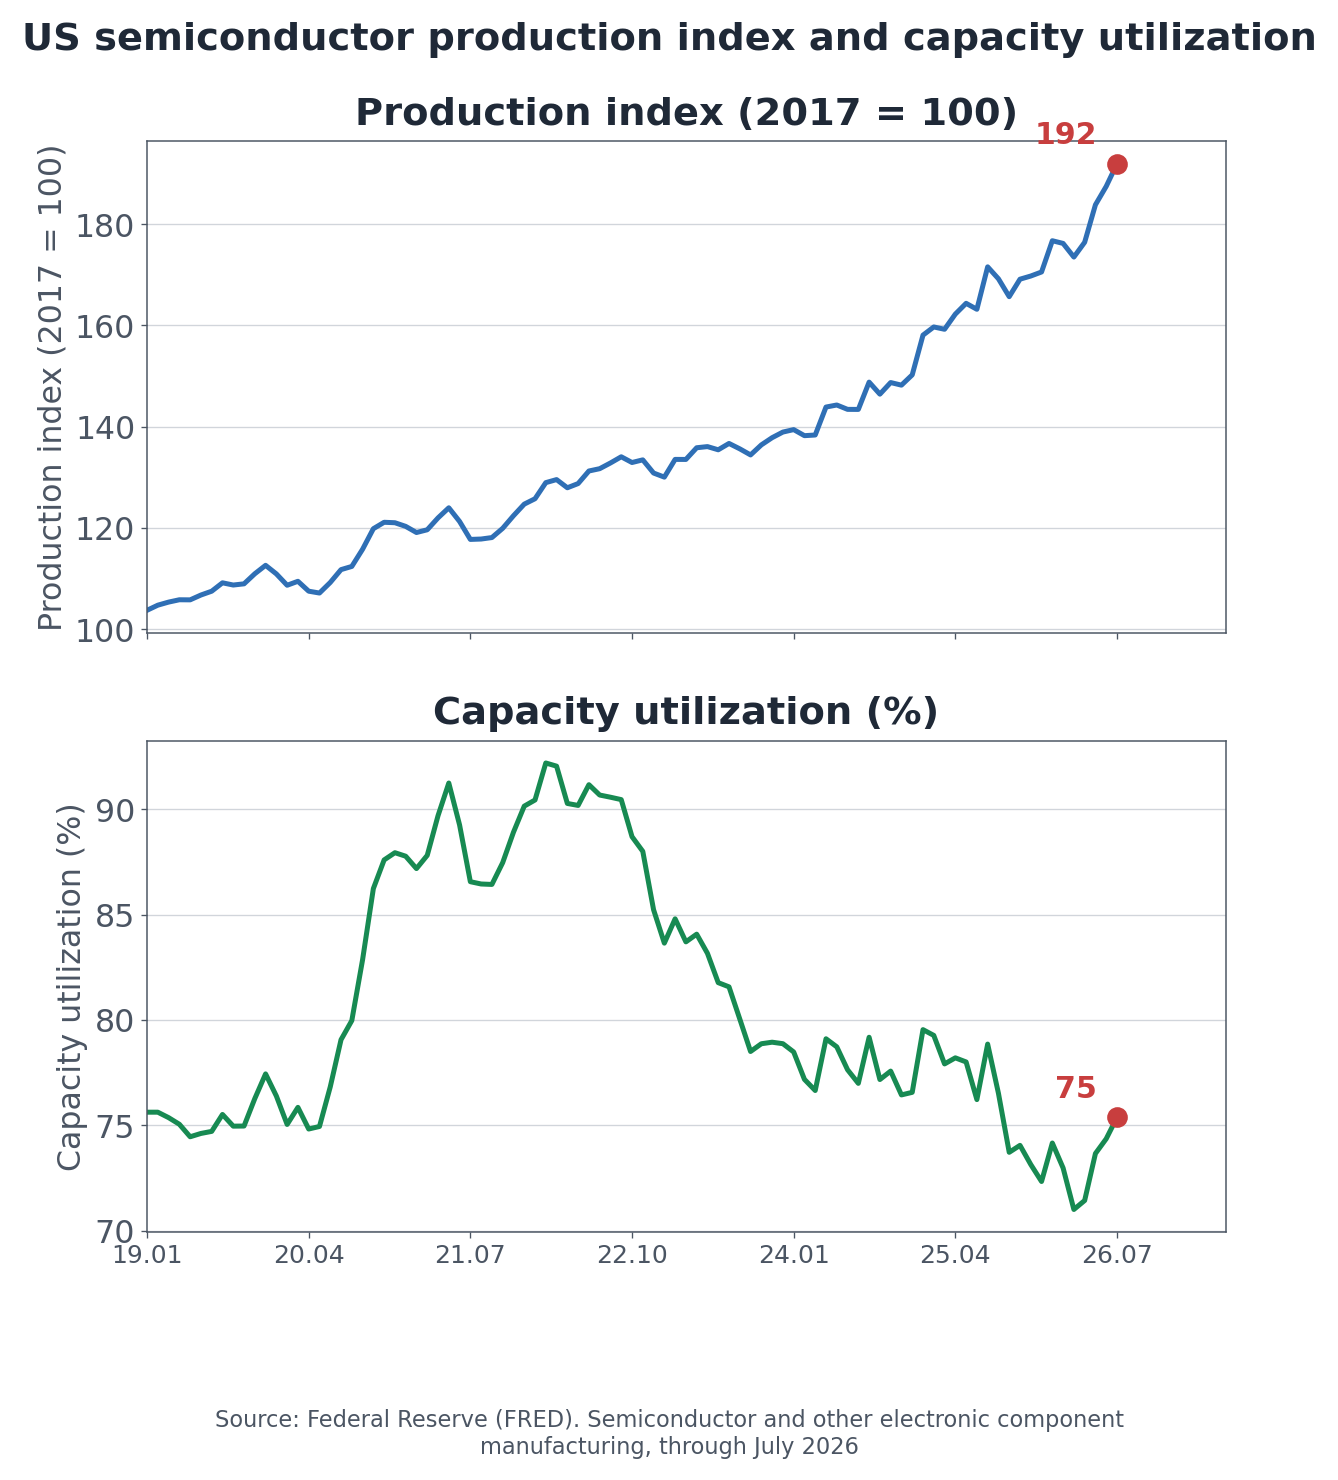
US semiconductor production index and capacity utilization (Federal Reserve)
The US production index for semiconductors and electronic components reached 191.9 in July 2026, near an all-time high and nearly double the 104 reading of early 2019. Capacity utilization in the same industry sits at 75.4%, down from about 92% at the end of 2021.
The gap lives in the denominator. Output can rise while utilization falls if capacity is added faster still, which is what the last several years of US fab construction produced. Building capacity is what generates orders for ASML, so a low utilization rate is not by itself a negative signal for the company.
The reverse reading also holds. Utilization that stays low gives customers a reason to defer expansion, and ASML's plan to raise output 30% in each of 2027 and 2028 rests on multi-year customer forecasts. If those forecasts soften, the added capacity becomes inventory.
Indicator
July 2026
End of 2021
Semiconductor production index (2017 = 100)
191.9
132
Semiconductor capacity utilization
75.4%
92.3%
PHLX Semiconductor Index (Jan 2022 = 100)
331
100
Source: Federal Reserve industrial production and capacity utilization series via FRED; PHLX Semiconductor Index month-end closes.
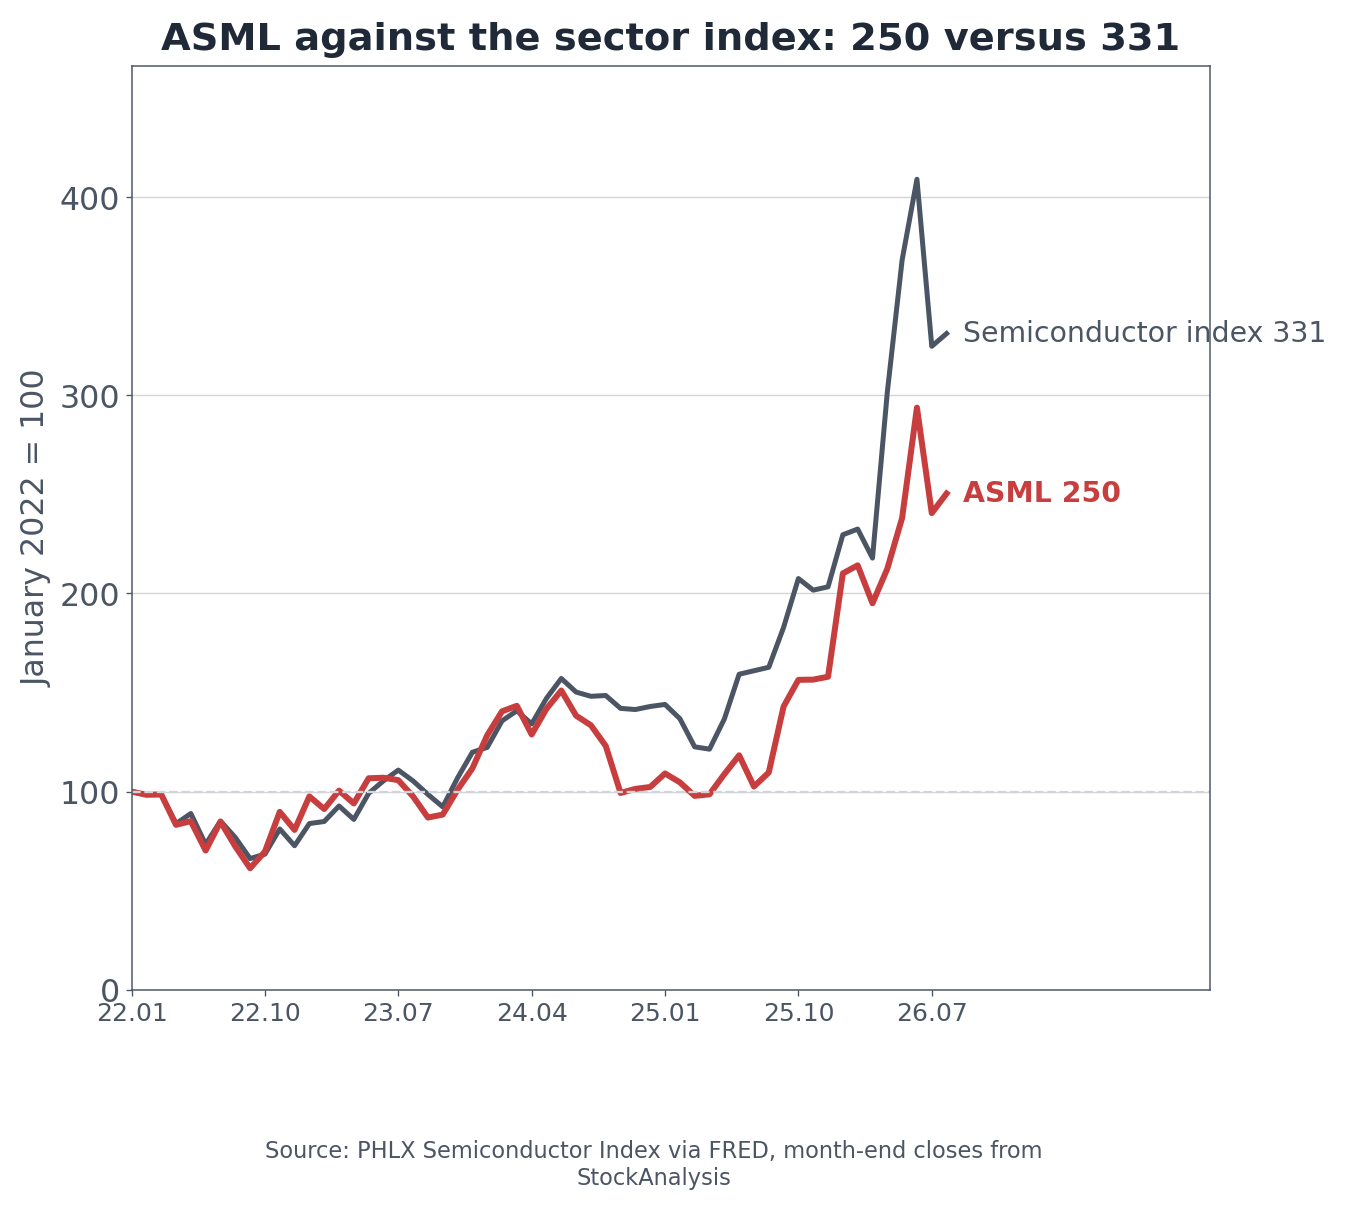
ASML share price against the PHLX Semiconductor Index, January 2022 = 100
Against the sector, ASML lags. Indexed to January 2022, the PHLX Semiconductor Index stands at 331 and ASML at 250. The company with a monopoly on the most advanced tool has trailed its own industry.
How Export Controls Shape ASML Revenue
ASML carries a variable most chip companies do not: Dutch and US export licensing. EUV systems cannot ship to China, and some DUV immersion models require licenses.
Management guided China to roughly 20% of annual net sales. The first-quarter 2026 release explains the width of the guidance range by saying the band "accommodates potential outcomes of ongoing discussions around export controls." The company has put the size of its own uncertainty inside the guidance range.
Licensing works at the level of country and customer rather than model, so the same tool can be approved for one fab and refused for another. That is why the quarterly disclosure of sales by region matters: it is the minimum instrument an investor has for sizing regulatory exposure.
Controls do not run in one direction only. Customers blocked from EUV pull DUV purchases forward. ASML's China share once exceeded 40% in 2023 and 2024 before settling into the twenties, which is roughly where that adjustment has landed.
ASML Valuation vs. Applied Materials, Lam Research and KLA
Three front-end equipment peers put the multiple in context. Applied Materials spans deposition and etch, Lam Research concentrates on etch and deposition, KLA on inspection and metrology. Tokyo Electron is not US-listed and is excluded.
Company
Ticker
Market cap
P/E
P/S
Latest-quarter revenue growth
ASML
ASML
$654.9B
54.0x
16.3x
+21.3%
Applied Materials
AMAT
$360.9B
39.2x
11.7x
+24.8%
Lam Research
LRCX
$385.0B
53.4x
16.6x
+30.0%
KLA
KLAC
$242.5B
50.7x
17.9x
+15.2%
Source: aggregated market data as of the September 4, 2026 close. Fiscal quarters differ by up to one quarter across these companies.
On multiples alone ASML sits in the middle. Price to sales of 16.3x is level with the peer median of 16.4x, and price to earnings of 54.0x is a rounding error from Lam Research at 53.4x. Growth ranks third of four. The monopolist earns no multiple premium here.
Stretch the window to three years and the reason appears.
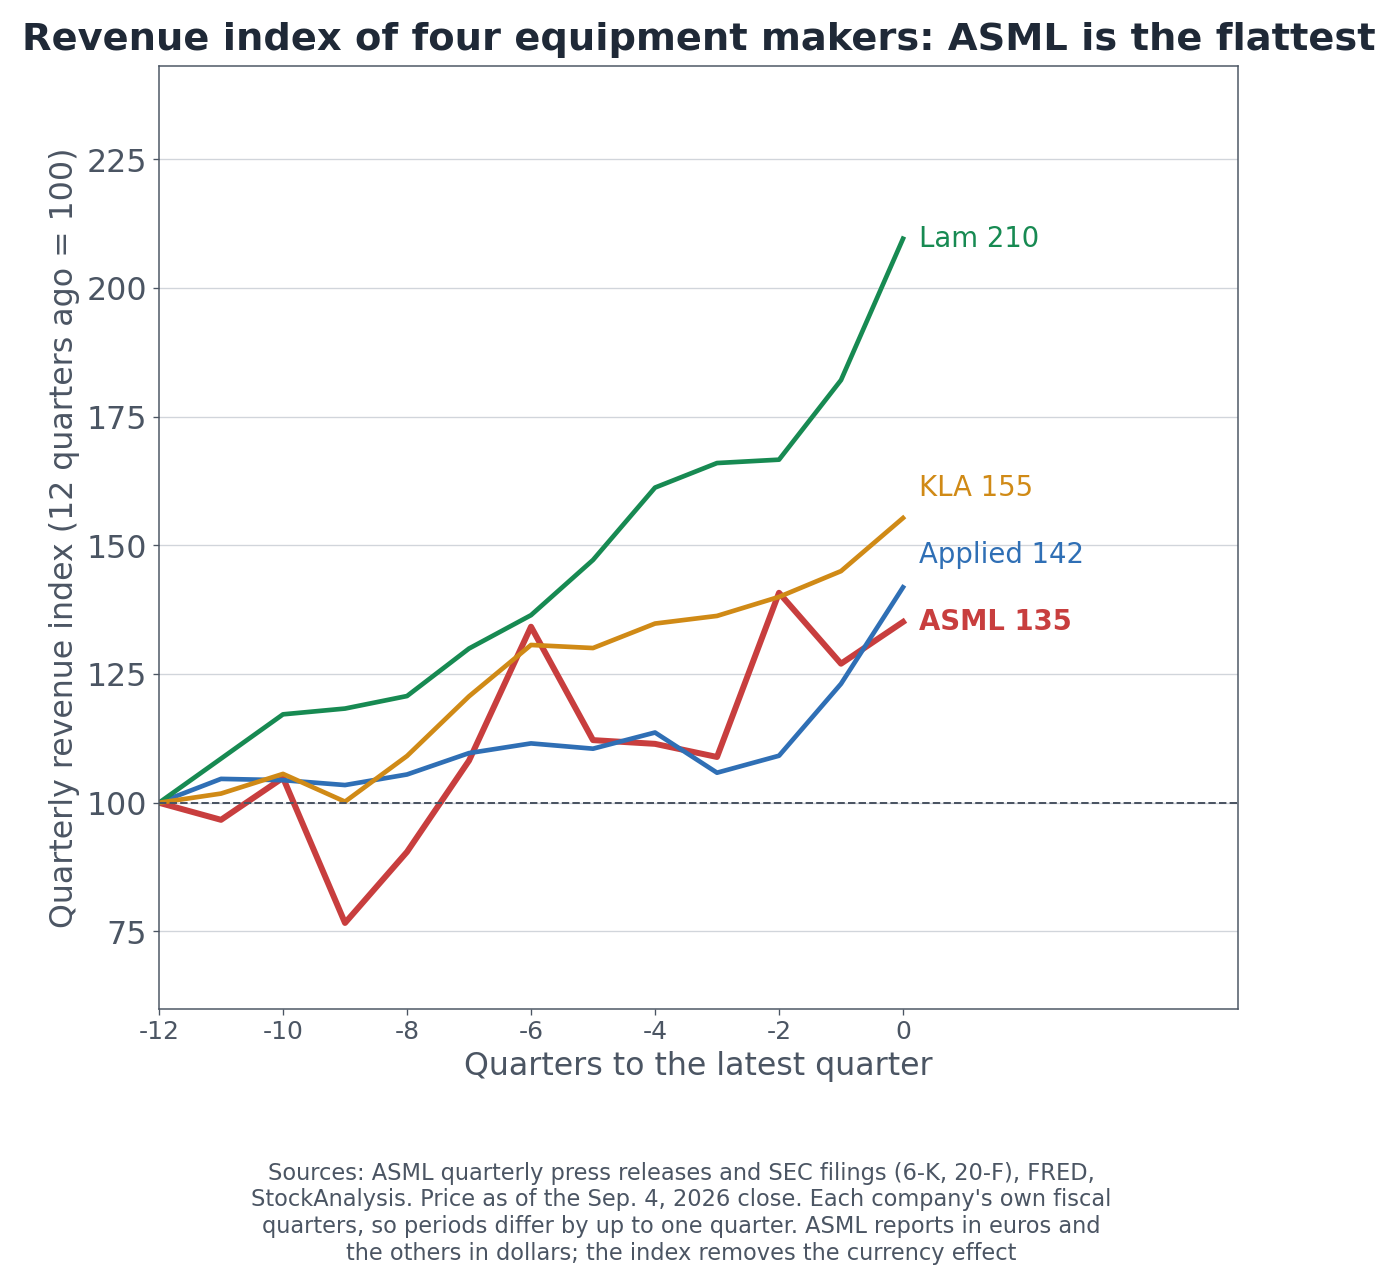
Quarterly revenue index for four semiconductor equipment makers, 12 quarters ago = 100
Indexed to twelve quarters ago, Lam Research stands at 210, KLA at 155 and Applied Materials at 142. ASML is at 135, the flattest of the four. The weak stretch through the first half of 2024 is still in the series, and recovery only begins in the fourth quarter of 2025.
So what is the multiple resting on? Margin.
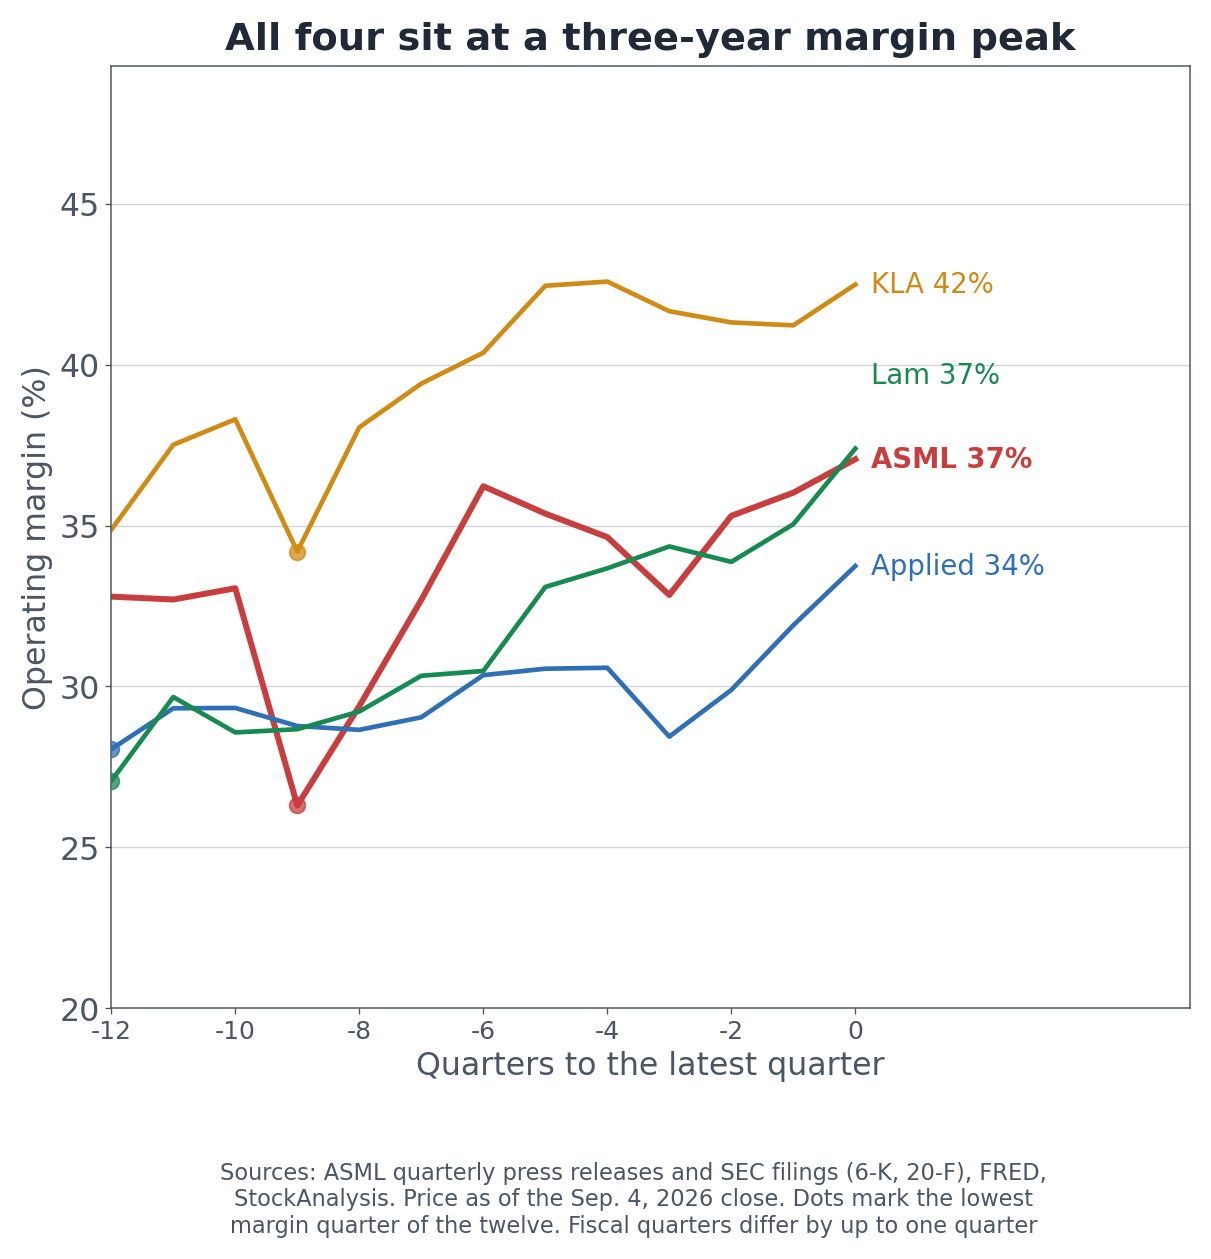
Quarterly operating margin for four semiconductor equipment makers, twelve quarters
ASML's operating margin of 37.1% is its highest of the twelve quarters shown. The complication is that the other three are in the same position. Applied Materials at 33.7%, Lam Research at 37.4% and KLA at 42.5% are each at or within a fraction of a three-year peak. All four sit at the top of the cycle together.
Company
Operating margin (latest)
Three-year low
12-quarter revenue index
Next-year EPS, 90-day change
Revisions up / down, 30 days
ASML
37.1%
26.3%
135
+24.7%
28 / 0
Applied Materials
33.7%
28.1%
142
+14.2%
28 / 1
Lam Research
37.4%
27.1%
210
+20.1%
19 / 1
KLA
42.5%
34.2%
155
+13.2%
13 / 2
Source: aggregated sell-side research and company filings. The cyclical framing is chosen because margin moves with the cycle here: ASML's operating margin ranged from 26.3% to 37.1% over three years while quarterly bookings ranged from €2.6 billion to €13.2 billion.
Revisions favor ASML. Next-year EPS estimates moved +24.7% over ninety days, with 28 upward and zero downward revisions in the past thirty days, the strongest of the four. Analysts are raising numbers on guidance and capacity plans, without bookings.
The multiple rests on forward margin and revisions rather than on the past three years of growth, and that margin comes from a cycle peak all four companies occupy at once. When the cycle turns, they return in the order they arrived.
What Do Analysts Expect for 2027?
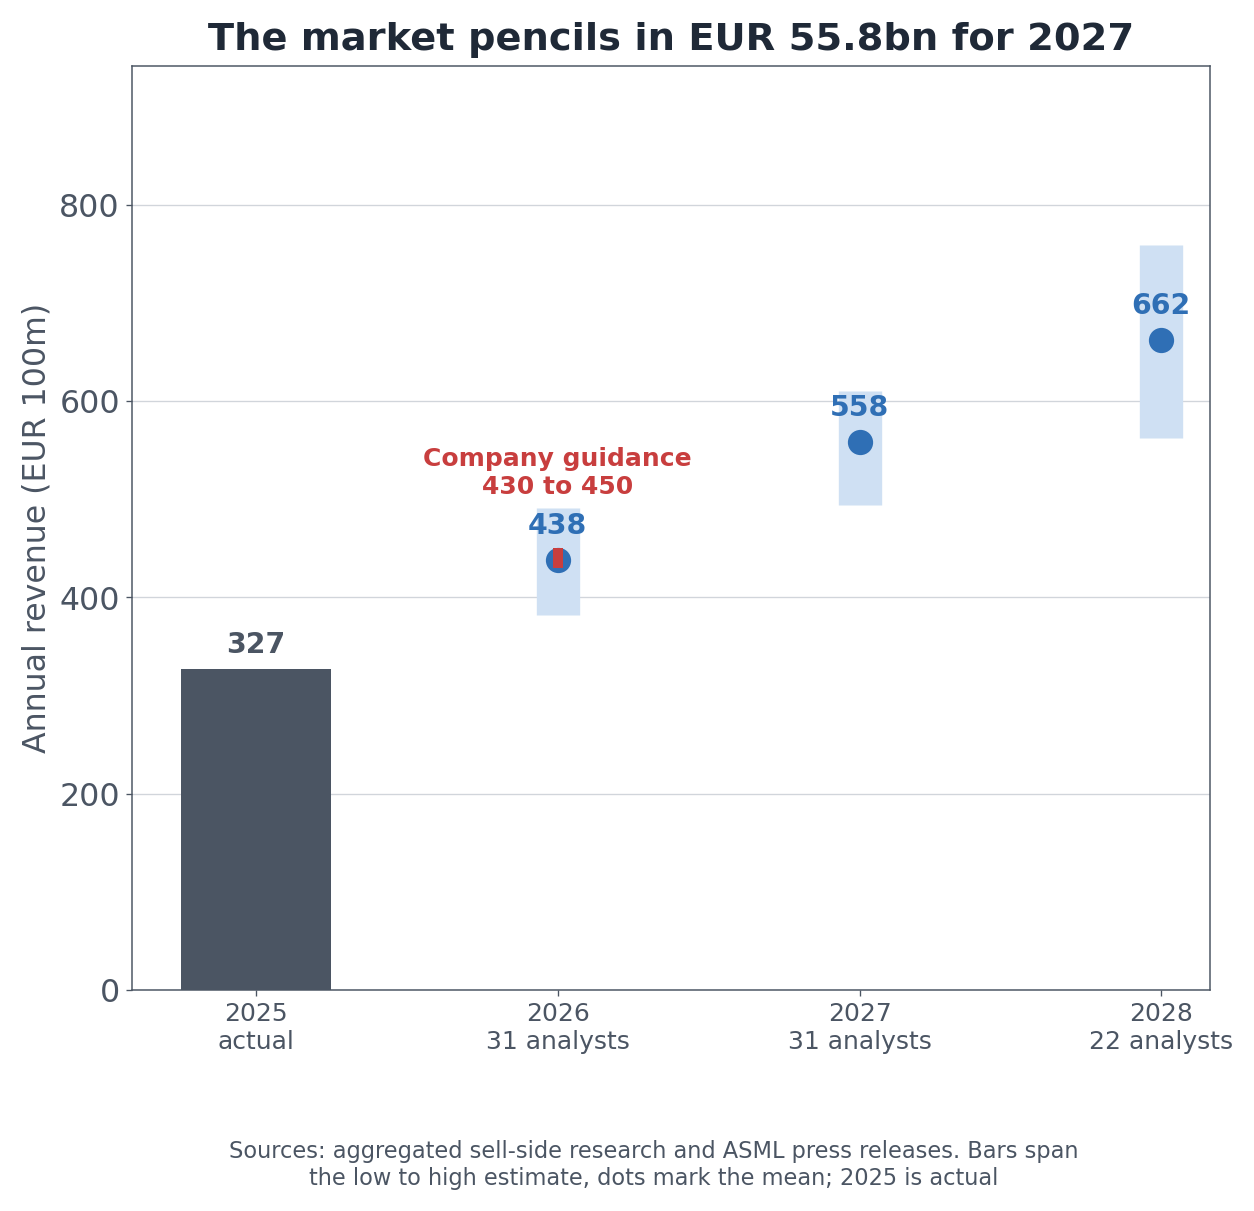
ASML annual revenue consensus against company guidance, aggregated sell-side research
Consensus puts 2026 revenue at €43.8 billion, sitting inside the company's own €43 billion to €45 billion range. For 2027 the mean is €55.8 billion, a 27.5% increase, and 2028 comes in at €66.2 billion.
No firm upgraded a rating in the past ninety days. Twelve reiterations and five target changes, clustered in mid-July right after results. The mean twelve-month target across 45 analysts is $2,306, or +34.5% from the current price.
Different aggregators disagree, though. A second set covering 17 analysts shows a mean of $2,204 with a high of $2,846 and a low of $1,450, that low sitting 15% below today's price. Depending on which count an investor reads, the same stock carries upside of +34% and downside of -15%.
Is ASML Stock Expensive? Two Bands, One Answer
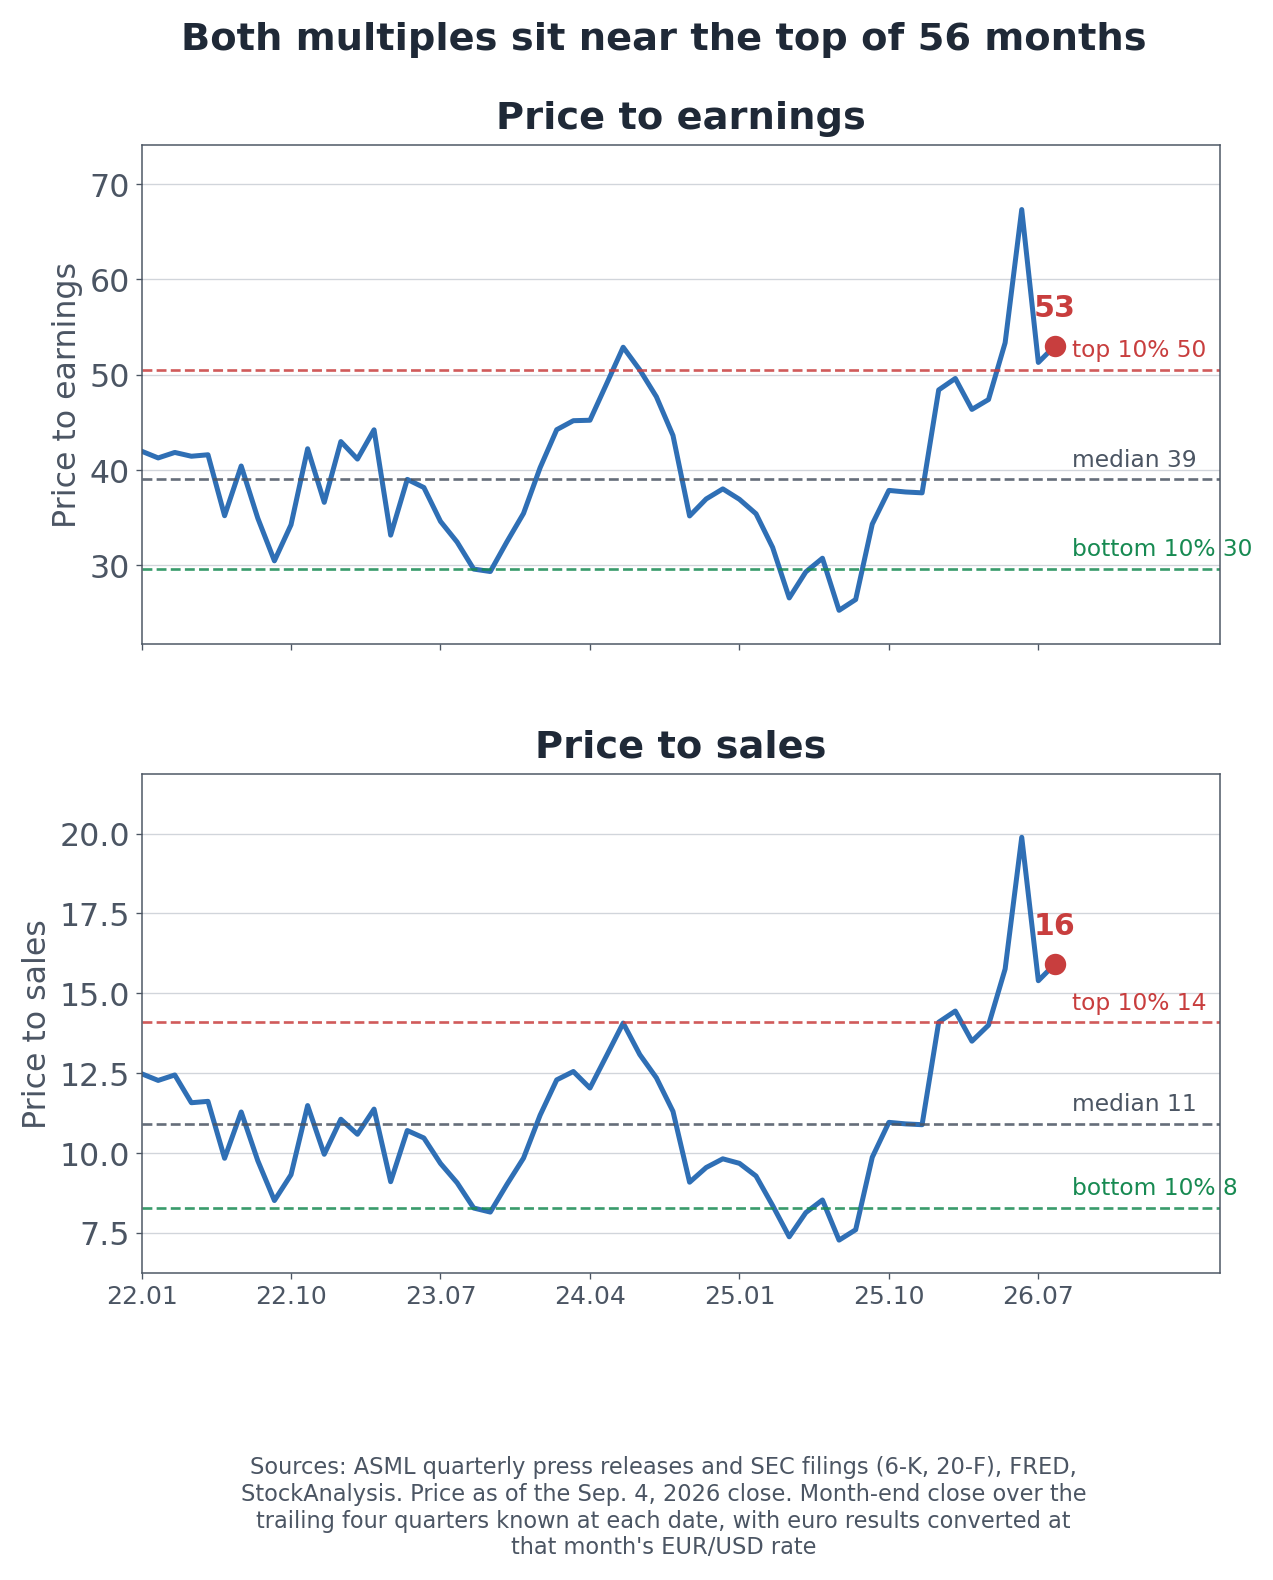
ASML price-to-earnings and price-to-sales bands across 56 months, using month-end closes and the trailing four quarters known at each date
Across the 56 months from January 2022 through August 2026, ASML's price to earnings ranged from 25.3x to 67.3x with a median of 39.0x. Today's 53.0x sits in the top 4%. Price to sales ranged from 7.3x to 19.9x with a median of 10.9x, and today's 15.9x is in the top 2%.
Both bands hold because the amplitude is 2.7x in each case. Since results are in euros and the shares trade in dollars, each month-end close is matched to that month's EUR/USD rate.
One step stands out in the recent series. Price to earnings moved from 37.6x in December 2025 to 48.4x in January 2026, the month of the fourth-quarter release that carried both the record €13.2 billion bookings figure and the 2026 growth outlook. That release is where the market re-rated the stock.
What does 53x hold? If the 2027 consensus of €55.8 billion arrives with margins near current levels, earnings grow substantially and the multiple is spending that growth in advance. If the cycle turns and operating margin returns toward the three-year low of 26%, revenue can grow while earnings stand still.
What to Watch in the Third Quarter
Results land in mid-October, and three items carry the weight.
Whether revenue reaches the guided €11.0 billion to €12.0 billion is the first. That is more than a 20% step from the second quarter, so it shows whether delivery schedules held.
Installed Base Management sales against the roughly €2.9 billion the company guided is the second. That line produced this quarter's beat, and a repeat would confirm the shift is structural rather than a timing artifact.
Contract liabilities are the third. With bookings withdrawn, prepaid customer cash is the closest public substitute. Another decline would keep the balance sheet pointing away from the company's language about a growing backlog.
Whether bookings return is worth watching too. ASML never stated a reason for stopping, so no condition for resuming has been published either. The company said it will refresh its longer-term view at its Capital Markets Day on June 10, 2027, and whether that occasion also resets what gets disclosed each quarter is an open question.
The bookings and unit series were built by parsing all twenty-two quarterly earnings 6-K filings from the first quarter of 2021 through the second quarter of 2026. Because each release prints the prior quarter alongside the current one, every value was cross-checked against the neighboring filing, and the four-quarter sums were reconciled to the annual revenue, net income and gross profit in the 20-F across five fiscal years, matching within 0.01%.
Multiples divide month-end closing prices by the trailing four quarters publicly available at each date, with euro results converted at that month's EUR/USD rate from the Federal Reserve series DEXUSEU. Share count of 384.5 million is derived by dividing net income by basic earnings per share. Industry series are from the Federal Reserve, and market data and analyst estimates come from aggregated sell-side research.
This article is for information only and is not investment advice.