
- Oracle Corporation (NYSE: ORCL) reported fiscal Q1 2027 results on September 10, 2026, with revenue up 29.6% to $19.345 billion and record quarterly operating cash flow of $23.103 billion. This ORCL stock analysis works through where that cash actually came from, why GAAP operating margin expanded while the company's own non-GAAP margin barely moved, how remaining performance obligations of $664 billion are now growing, and what the two valuation multiples that still work are saying.
- Start with one line in the cash flow statement. Of the $23.103 billion Oracle reported as operating cash flow, $11.363 billion is an item the company labels "increase in deferred revenues from customer prepayments with significant financing component." A year ago that line did not exist. Strip it out and operating cash flow was $11.740 billion, up 44.2% rather than 183.8%.
- Company disclosure (8-K exhibit 99.1, Sep 10 2026): Oracle publishes a second capital expenditure figure alongside the reported one. Footnote 1 of the free cash flow table defines net cash outlay for capital expenditures as capex less (1) other short-term financing cash flow related to capex and (2) customer prepayments with a significant financing component for capex. Reported capex was $28.499 billion. Net cash outlay was $17.966 billion. The source document is the 8-K exhibit 99.1 filed with the SEC.
Record Operating Cash Flow Hid a Second Number
- The headline quarter was strong on every line Oracle reports. Revenue of $19.345 billion beat the company's own guidance range of 27% to 29% growth. GAAP operating income rose 57.3% to $6.728 billion. GAAP net income rose 62.6% to $4.760 billion, and diluted EPS rose 54.5% to $1.56. Cloud revenue grew 61.5% to $11.607 billion, with infrastructure alone up 120.7%.
- Oracle runs on a fiscal year that ends in May, so this quarter covers June through August 2026. That calendar puts the company roughly a month ahead of most large-cap software reporters, and it is why ORCL prints are read as an early gauge of AI infrastructure demand.
- Then there is the stock. Oracle closed the regular session on September 10 at $152.94, down 5.38%, before the release. In after-hours trading it printed $159.26, up 4.13%. The move happened in two directions on the same day, and the reason sits in how the quarter's cash was built.
| Item | Fiscal Q1 2027 | Year ago | Change |
| Revenue | $19.345 billion | $14.926 billion | +29.6% |
| Gross profit | $11.612 billion | $10.042 billion | +15.6% |
| GAAP operating income | $6.728 billion | $4.277 billion | +57.3% |
| Non-GAAP operating income | $8.151 billion | $6.236 billion | +30.7% |
| GAAP net income | $4.760 billion | $2.927 billion | +62.6% |
| Diluted EPS | $1.56 | $1.01 | +54.5% |
| Operating cash flow | $23.103 billion | $8.140 billion | +183.8% |
| Capital expenditures | $28.499 billion | $8.502 billion | +235.2% |
| Free cash flow | -$5.396 billion | -$0.362 billion | wider deficit |
- Source: Oracle fiscal Q1 2027 earnings release, September 10, 2026. Non-GAAP excludes stock-based compensation, amortization of intangibles, and restructuring.
- The last two rows are the quarter. Operating cash flow nearly tripled while the free cash flow deficit widened fifteenfold, because capital expenditures grew faster still.
Where Did $11.4 Billion of Operating Cash Come From?
- Filing footnote (8-K condensed cash flow statement, Sep 10 2026): Inside operating activities, the line "increase in deferred revenues from customer prepayments with significant financing component" reads $11.363 billion. The comparable line a year earlier is blank. Below it, "increase in other deferred revenues" reads $3.997 billion against $2.550 billion.
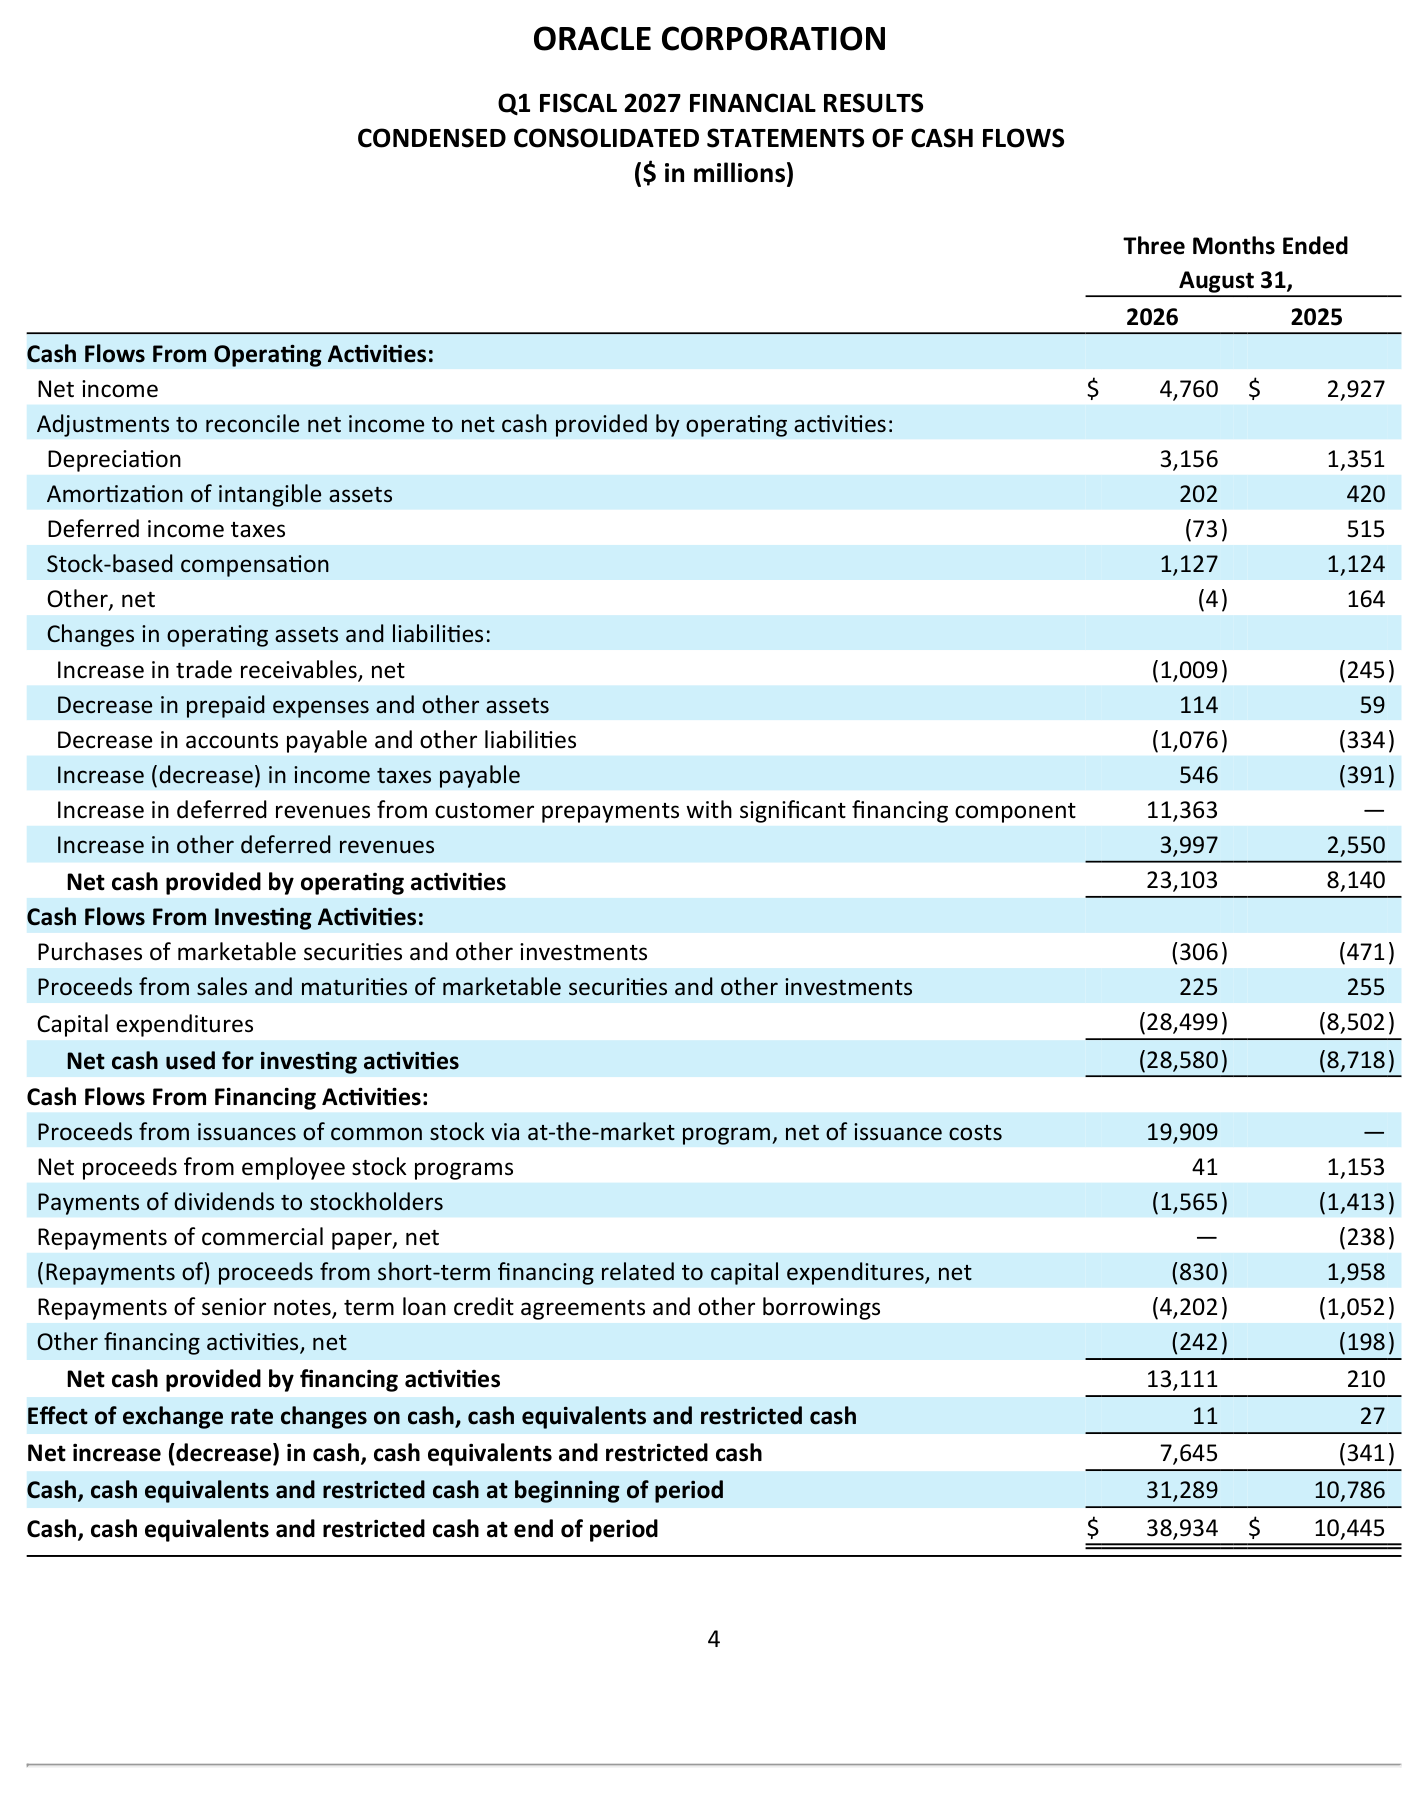
- The accounting here is ordinary. A customer who pays ahead for cloud capacity creates deferred revenue, and that cash belongs in operating activities. What matters is the label. Under revenue recognition rules, a "significant financing component" exists when the gap between payment and delivery is large enough that the arrangement carries an interest element. Oracle applied that label itself.
- Own calculation (earnings release cash flow statement, Sep 10 2026): Subtract the prepayment and operating cash flow for the quarter was $11.740 billion against $8.140 billion a year ago. Subtract it from free cash flow as well and the deficit widens from the reported figure to a materially larger one.
- Put the two side by side: -$5.396 billion as reported, -$16.759 billion once the prepayment is removed. Three times the hole, same quarter, same filing. The first figure answers whether Oracle can cover its obligations this quarter, which it comfortably can with $36.4 billion of cash on the balance sheet. The second answers whether the buildout funds itself out of operations, and on that question the filing is less flattering. Both numbers sit one page apart in the same document.
- Neither figure is wrong. They measure different things. The reported number tells you what moved through Oracle's accounts. The adjusted number tells you how much of that the business generated on its own, without borrowing against future delivery. Liquidity questions use the first. Questions about whether the model funds itself use the second.
Oracle Net Cash Outlay for Capital Expenditures Explained
- Oracle does not bury this. It built a table for it.
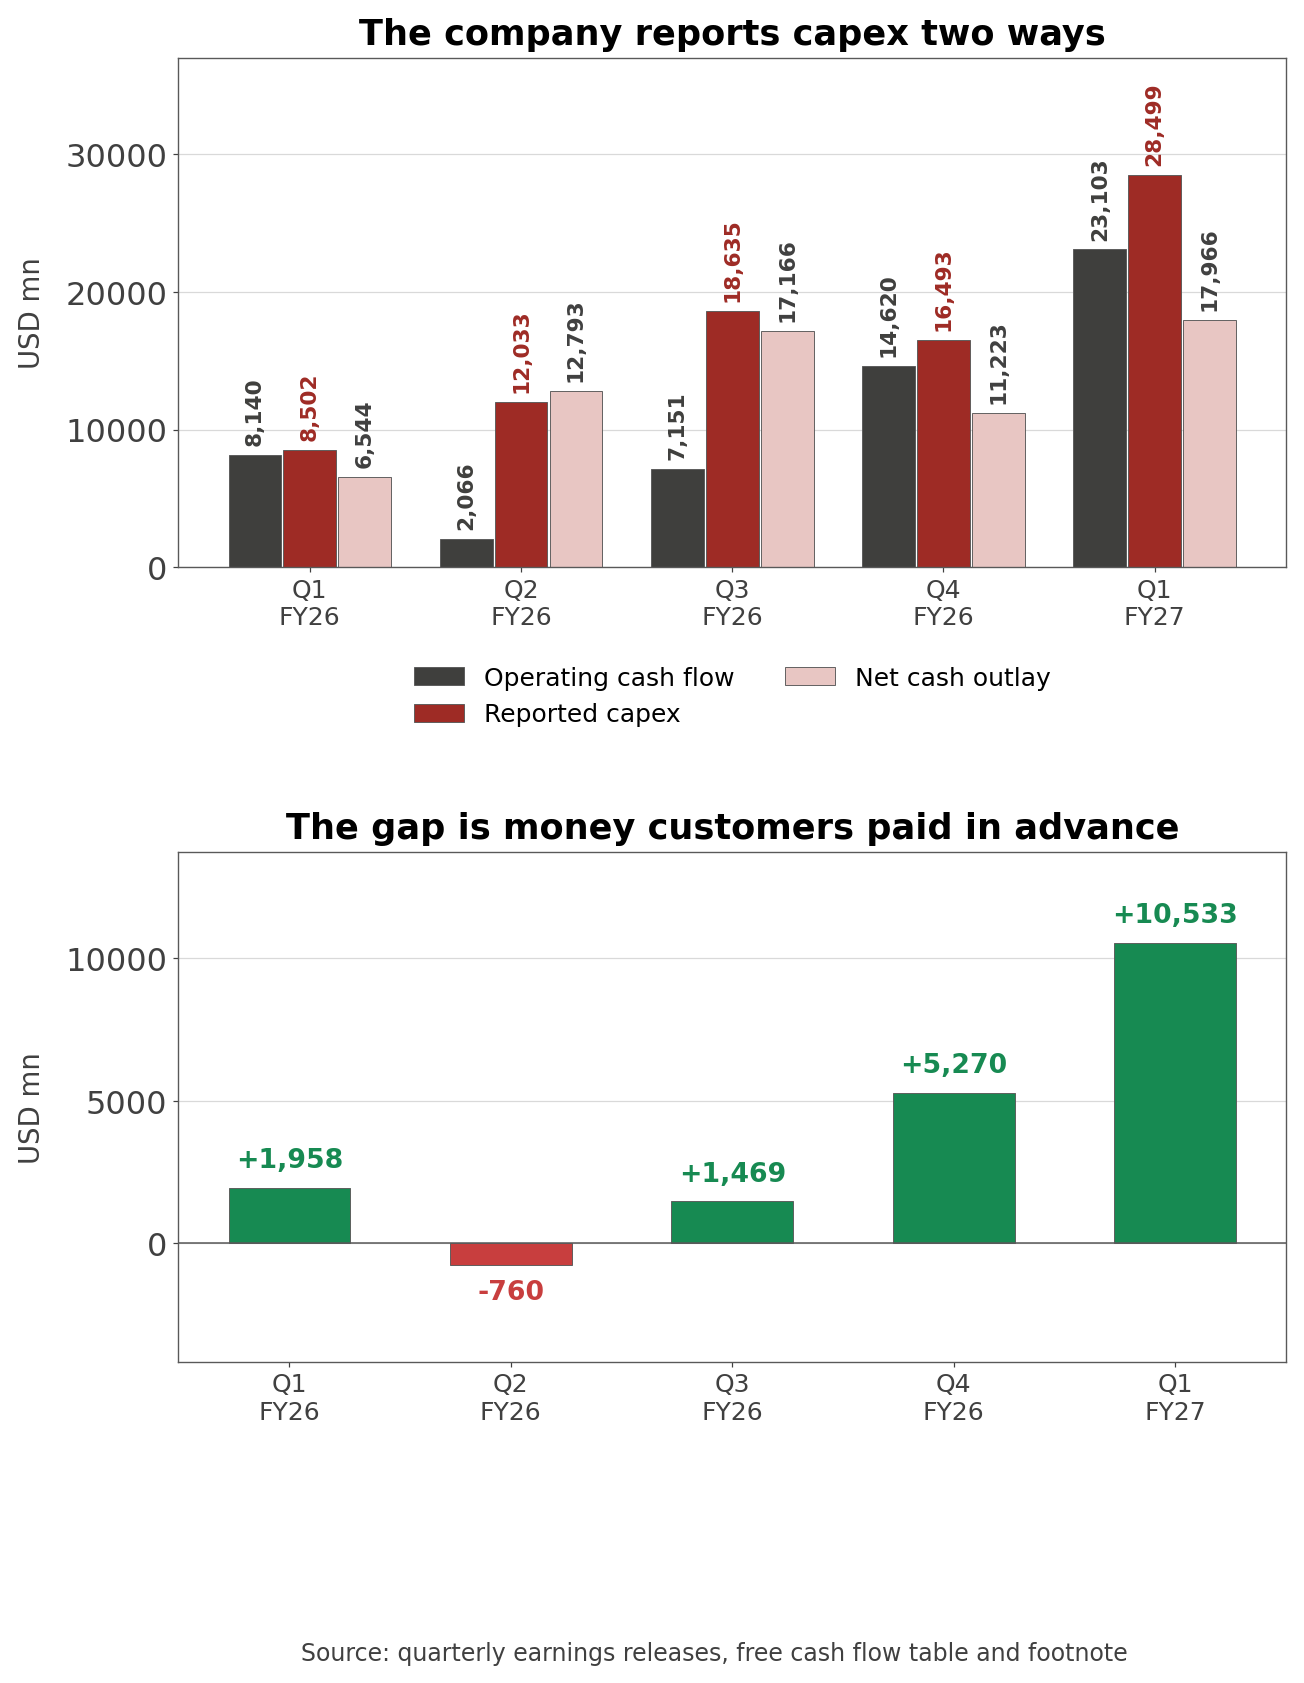
- Own calculation (cash flow statement and free cash flow table, Sep 10 2026): Two independent paths produce the same figure. Path one: customer prepayments of $11.363 billion less $0.830 billion of short-term financing repayment related to capex equals $10.533 billion. Path two: reported capex of $28.499 billion less net cash outlay of $17.966 billion equals $10.533 billion. The two tables meet exactly.
- Run the same arithmetic on the prior fiscal year and the answer is $7.937 billion, which matches what management described on the June call.
- Company disclosure (fiscal Q4 2026 earnings call, June 10 2026): The chief financial officer said annual net cash outlay was $48 billion "considering approximately $8 billion of prepayments and timing," and called the metric important for understanding funding needs. On the same call the company said it had signed $67 billion of AI infrastructure contracts in the quarter, most of them bring-your-own-hardware or prepaid, bringing that category to $75 billion.
| Quarter | Operating cash flow | Reported capex | Net cash outlay | Gap |
| FQ1 2026 | $8.140bn | $8.502bn | $6.544bn | +$1.958bn |
| FQ2 2026 | $2.066bn | $12.033bn | $12.793bn | -$0.760bn |
| FQ3 2026 | $7.151bn | $18.635bn | $17.166bn | +$1.469bn |
| FQ4 2026 | $14.620bn | $16.493bn | $11.223bn | +$5.270bn |
| FQ1 2027 | $23.103bn | $28.499bn | $17.966bn | +$10.533bn |
- Source: Oracle quarterly earnings releases, free cash flow table. The gap combines capex-related short-term financing and customer prepayments.
- Read down the last column and the gap starts widening in FQ3 2026 and doubles this quarter. For Oracle that is good news, because it lowers the external capital the buildout requires. For anyone reading the cash flow statement it changes what the top line of that statement measures.
Cost Cuts, Not Gross Profit, Drove the Margin Gain
- Operating income rose by $2.451 billion. Gross profit rose by $1.570 billion. The missing $881 million came out of expenses.
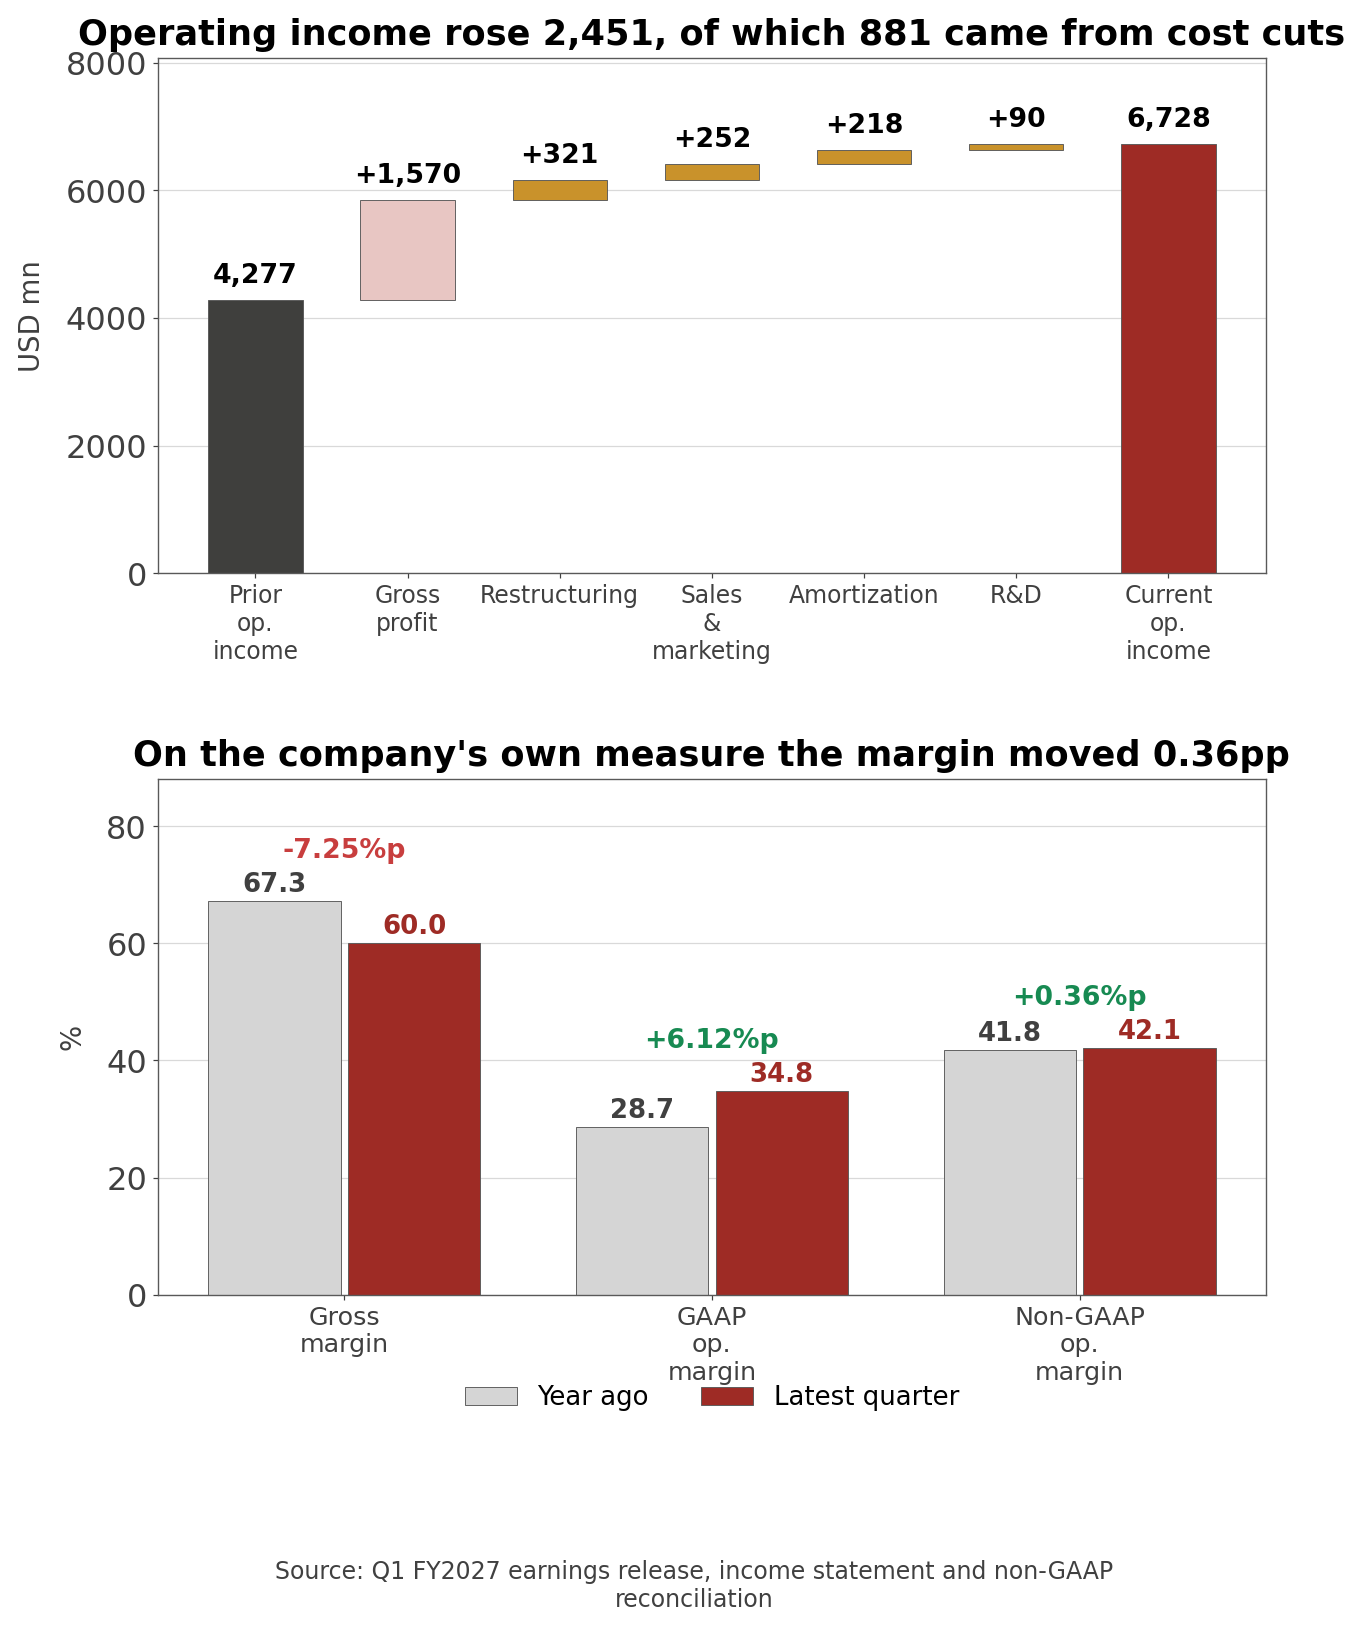
- Own calculation (earnings release income statement, Sep 10 2026): Four lines fell year over year. Restructuring dropped $321 million, sales and marketing $252 million, amortization of intangibles $218 million, and research and development $90 million. Together that is $881 million, which added to the gross profit increase reconciles exactly to the operating income increase.
- A company growing revenue 29.6% while cutting R&D 3.6% and sales and marketing 12.2% is unusual, particularly one scaling an infrastructure business at triple-digit rates. Management described the driver on the June call as efficiency measures in the cost structure.
- Gross margin tells the other half. It fell from 67.28% to 60.03%, a decline of 7.25 percentage points, because cloud and software cost of revenue grew 77.4% against cloud revenue growth of 61.5%. Building data centers and running GPUs costs more, faster, than the revenue those assets carry.
- Yet GAAP operating margin went the other way, from 28.65% to 34.78%.
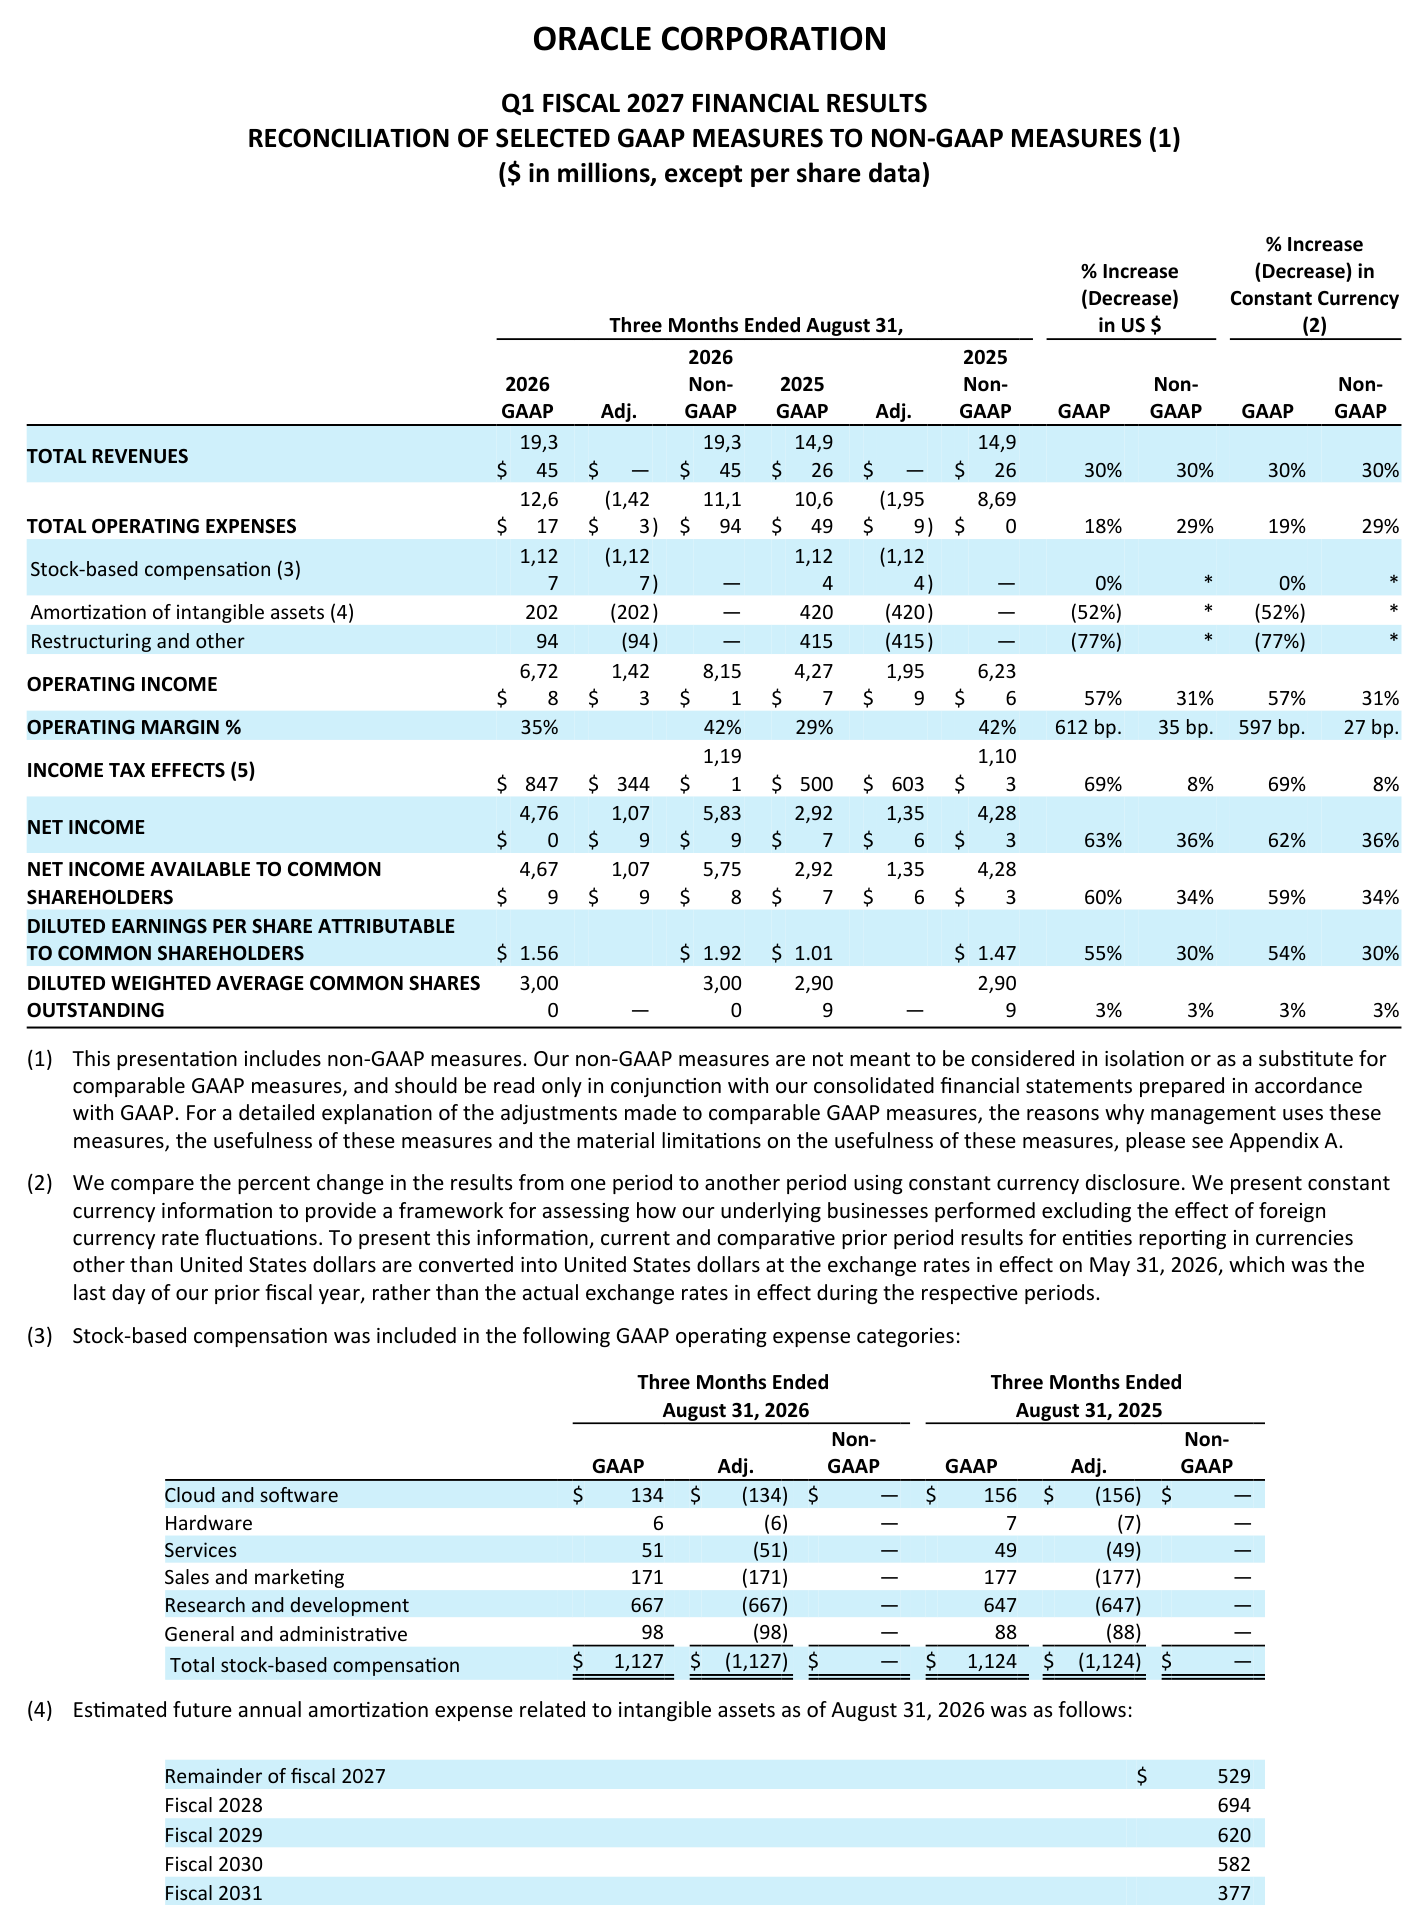
- Filing footnote (8-K GAAP/non-GAAP reconciliation, Sep 10 2026): Total excluded items were $1.959 billion a year ago and $1.423 billion this quarter. Stock-based compensation was flat at $1.127 billion against $1.124 billion. Amortization fell from $420 million to $202 million and restructuring from $415 million to $94 million.
- Apply Oracle's own measure and non-GAAP operating margin moved from 41.78% to 42.13%, a gain of 0.36 percentage points. The 6.12 point GAAP improvement is largely last year's one-time costs going away. Both numbers are accurate. They answer different questions, and the company reports both.
What Does Oracle (ORCL) Sell Today?
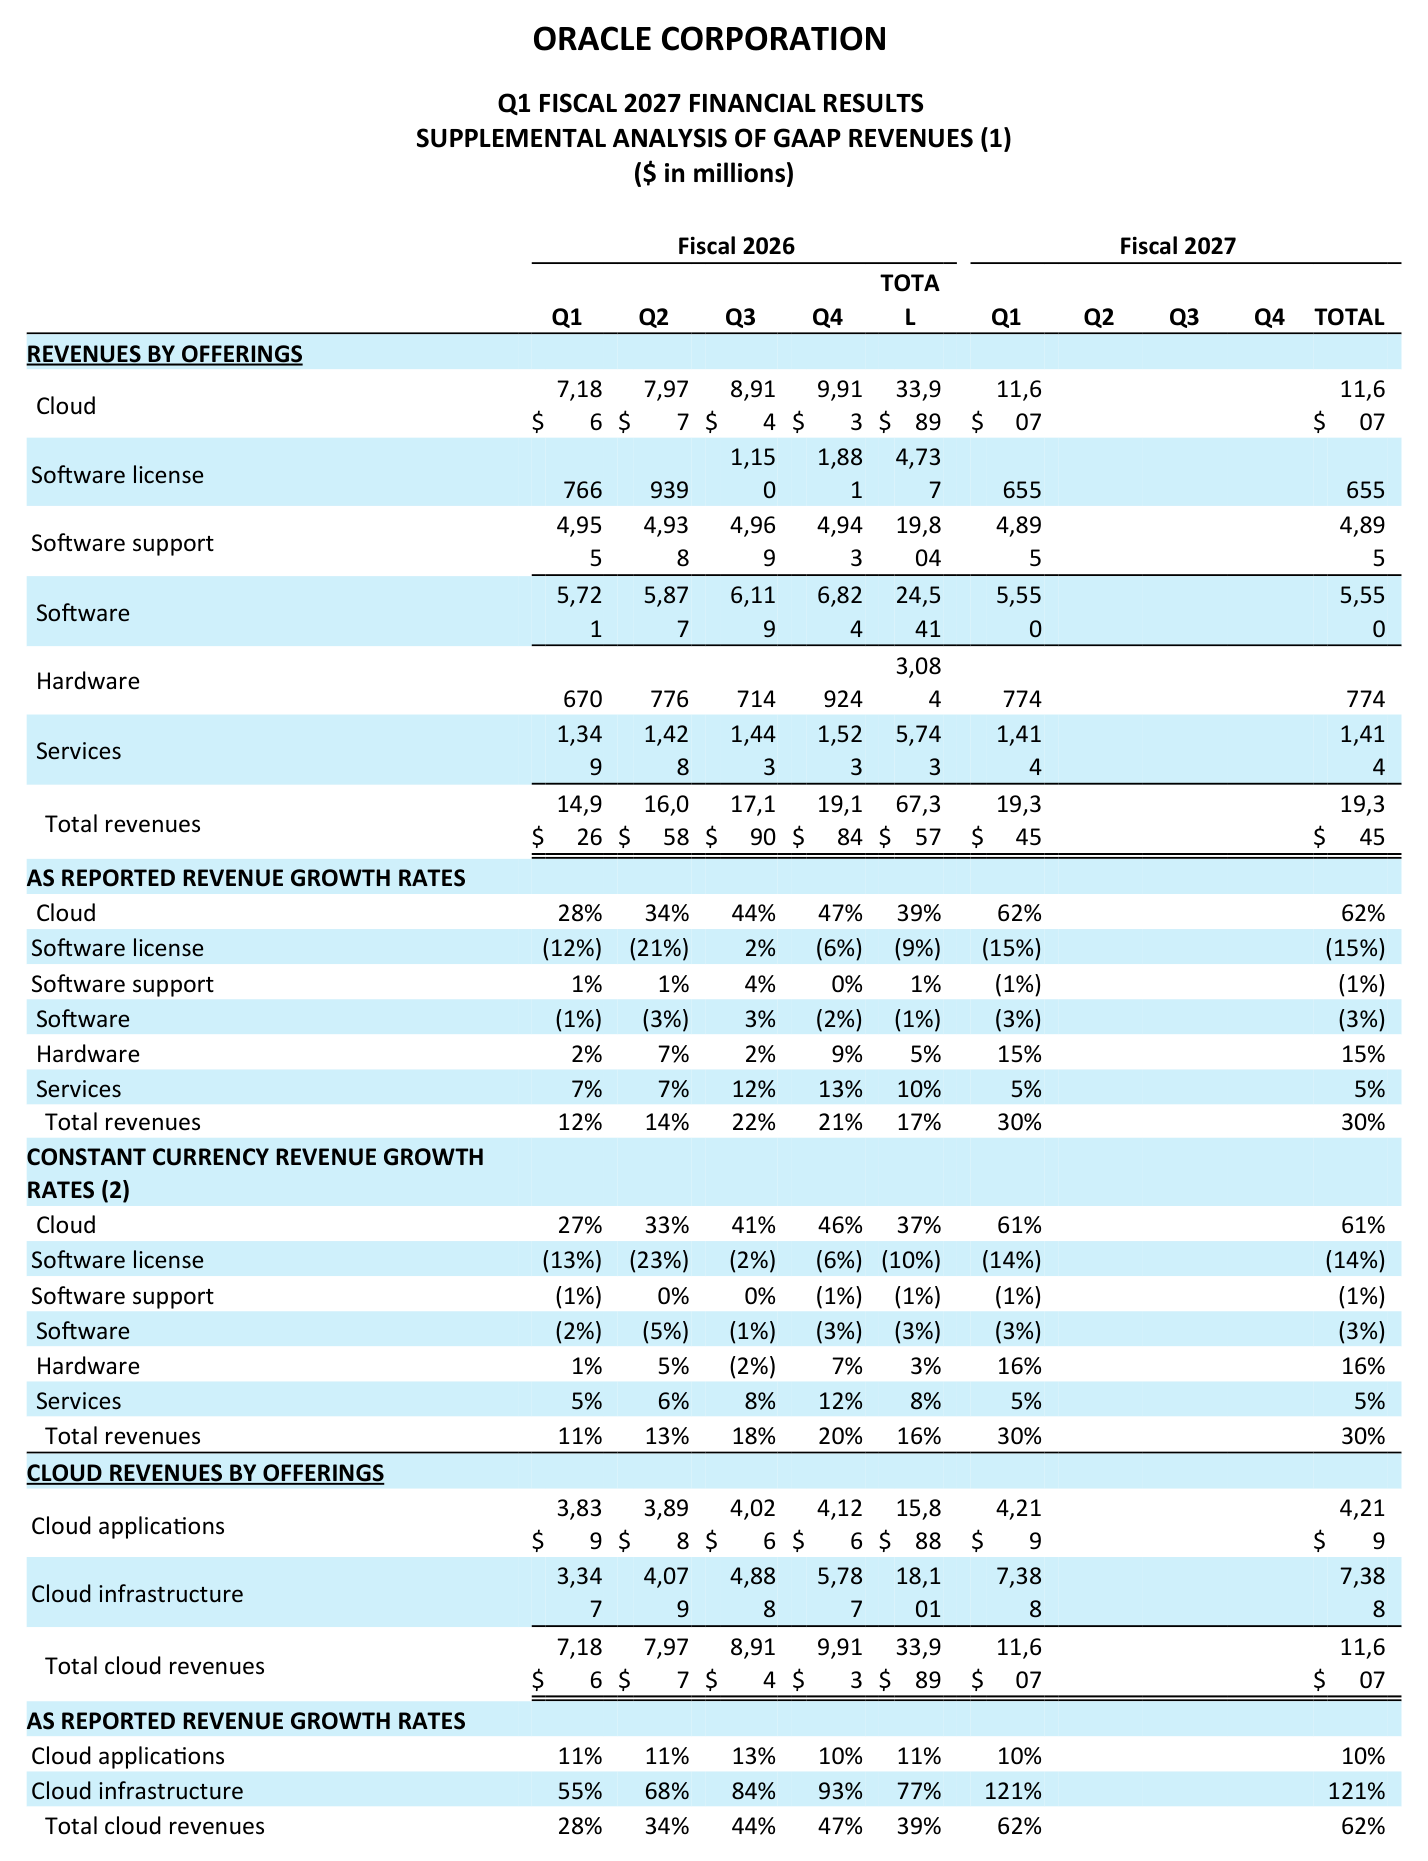
- Oracle sells four things. Cloud brought in $11.607 billion this quarter, software licenses and support $5.550 billion, services $1.414 billion, and hardware $0.774 billion. Cloud splits again: applications, which rent business software such as finance and HR by the seat, generated $4.219 billion, and infrastructure, which rents compute and storage by the hour, generated $7.388 billion.
- The two halves of cloud sell differently. Applications grow with seat counts, so they compound in the low double digits. Infrastructure grows in steps, because a single large contract adds capacity and revenue at once. That structural difference is why the two grew 9.9% and 120.7% in the same quarter.
- Steps have a price. Applications run on data centers that already exist; infrastructure requires GPUs and power to be in place before the revenue arrives. Money leaves first. This quarter's $28.499 billion of capital expenditure is that money.
Oracle Cloud Infrastructure Revenue Growth by Segment
- Own calculation (supplemental revenue tables, Sep 10 2026): Of the $4.419 billion increase in quarterly revenue, cloud infrastructure contributed $4.041 billion. Applications added $380 million, hardware $104 million, and services $65 million, while software fell $171 million.
- Geography says the same thing. Americas revenue grew from $9.662 billion to $13.711 billion, an increase of $4.049 billion. EMEA added $245 million and Asia Pacific $125 million.
- One product line produced 91.5% of the growth and one region produced 91.6% of it. Infrastructure revenue has gone from $2.154 billion in FQ1 2025 to $7.388 billion now, 3.4 times in eight quarters, while applications went from $3.469 billion to $4.219 billion.
- Oracle also disclosed the physical side. It delivered 850 megawatts of additional data center capacity in the quarter and more than 300,000 GPUs to customers since the end of Q4, close to triple the prior quarter's delivery. Revenue growth is now a function of power and equipment on the ground.
Software Support Revenue Turned Down for the First Time
- Database licenses and their annual support contracts are Oracle's oldest business, and for years they funded everything else. Support revenue arrives annually, renews by default, and carries almost no incremental cost.
- Own calculation (supplemental revenue tables, Sep 10 2026): Software support revenue went from $4.955 billion to $4.895 billion. Across five quarters the series reads $4.955bn, $4.938bn, $4.969bn, $4.943bn, $4.895bn. It held a narrow band for four quarters and stepped below it in this one, while software licenses went from $766 million to $655 million.
- As rates those are -1.2% and -14.5%. Support contracts renew by default, so a line that moves at all is a line where some customers stopped renewing.
- Oracle attributes the decline to customers continuing their migration from on-premises software to the cloud. If those customers landed on OCI, the revenue changed segments. If they landed elsewhere, it left.
- What changed alongside it is the funding source.
- Filing footnote (8-K condensed balance sheet, Sep 10 2026): Total borrowings fell from $129.541 billion to $125.337 billion, a decrease of $4.204 billion. Stockholders' equity rose from $43.056 billion to $67.196 billion, an increase of $24.140 billion. Property, plant and equipment went from $99.957 billion to $127.845 billion, and depreciation from $1.351 billion to $3.156 billion.
- In percentage terms property, plant and equipment rose 27.9% in a single quarter and depreciation rose 133.6%. Equipment added at that rate converts into depreciation that stays on the income statement for years. This quarter's $3.156 billion of depreciation already equals nearly half of operating income.
- The equity increase came from selling stock. Oracle raised $19.909 billion through an at-the-market program during the quarter. Basic weighted average shares rose from 2.826 billion to 2.966 billion, up 5.0%, which is why net income grew 62.6% while diluted EPS grew 54.5%. A new line also appears: $81 million of preferred stock dividends on the 6.50% Series D mandatory convertible preferred, paying $1,625 per share on October 15.
Oracle RPO Backlog: $664 Billion and Slowing Additions
- Remaining performance obligations are the contracted revenue Oracle has not yet recognized, and that number has driven the stock for a year. It closed the quarter at $664 billion, up $209 billion year over year.
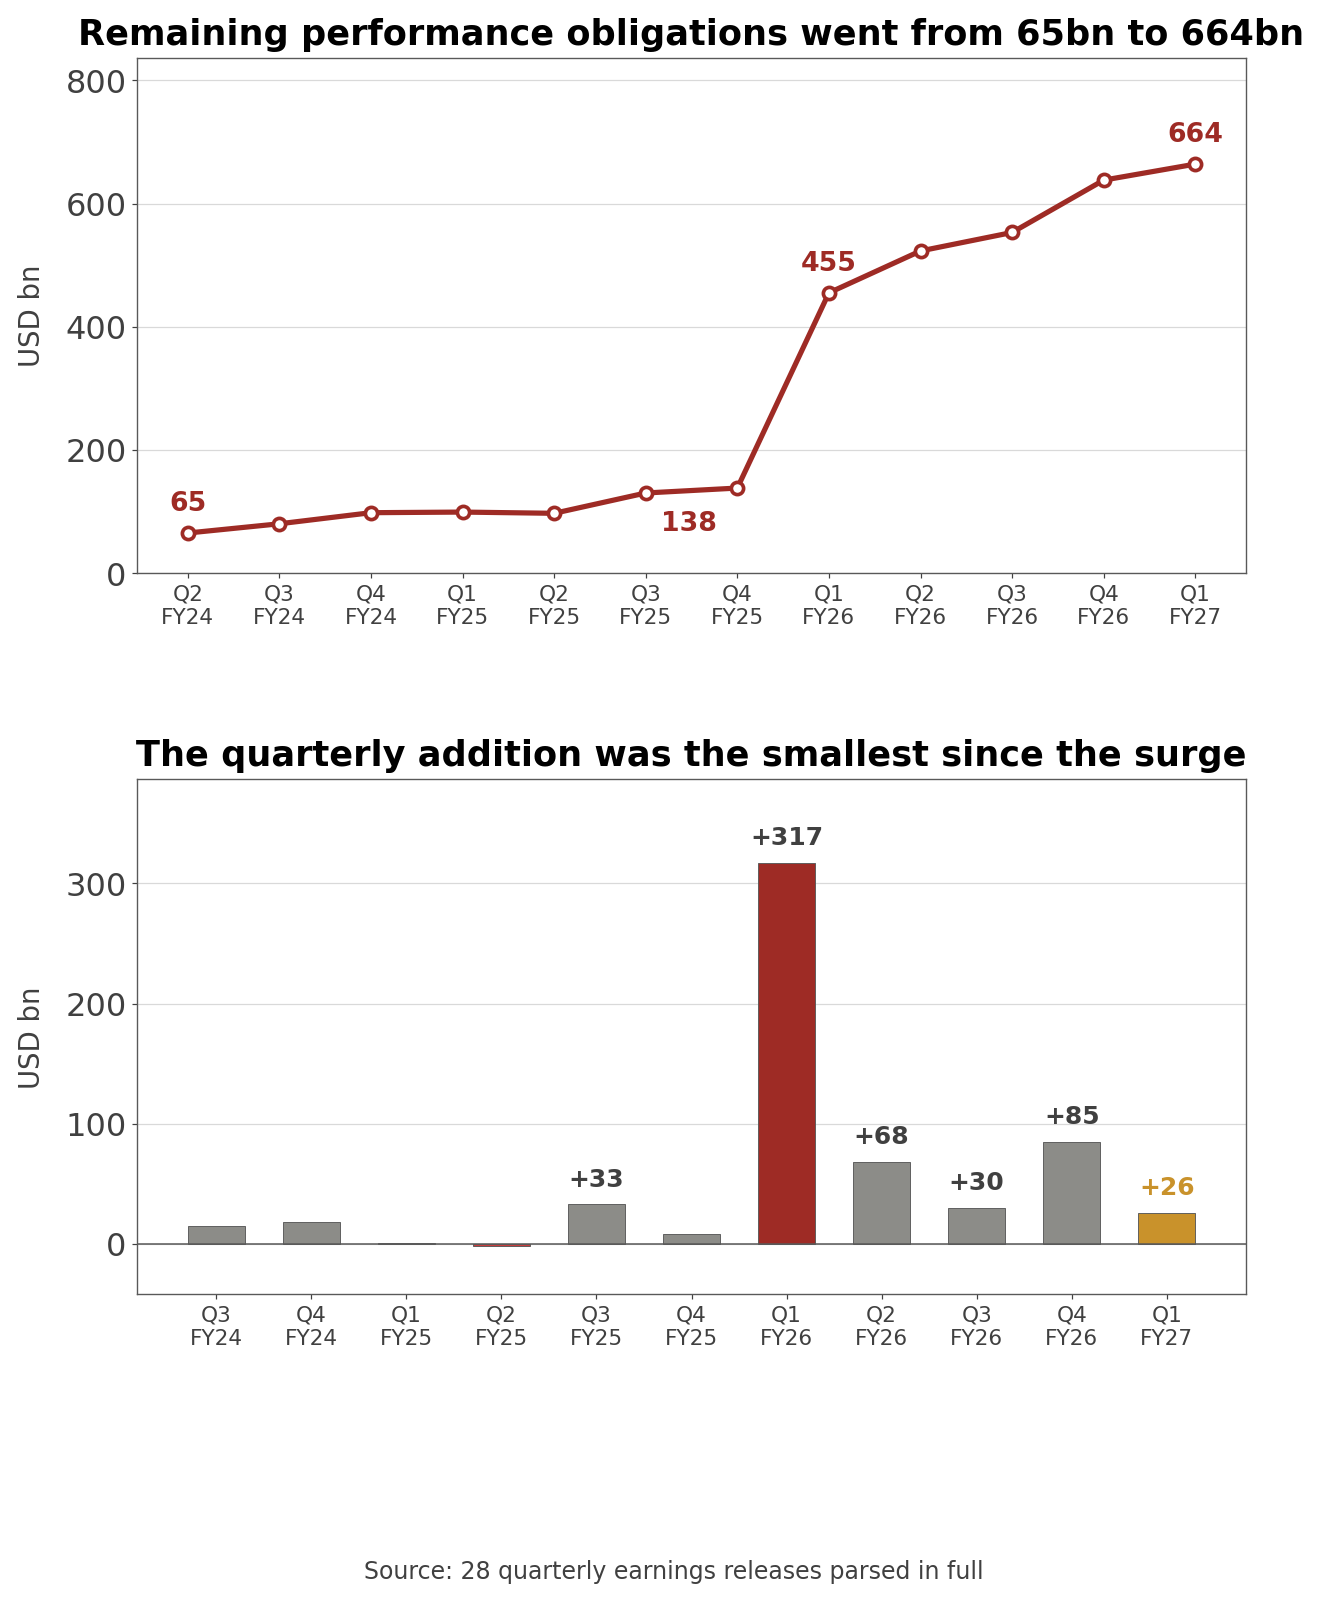
- Own calculation (28 quarterly earnings releases, FQ2 2019 through FQ1 2027): Twelve releases disclose an RPO balance: $65bn, $80bn, $98bn, $99bn, $97bn, $130bn, $138bn, $455bn, $523bn, $553bn, $638bn, $664bn. Converted to sequential additions, FQ1 2026 brought $317 billion at once, followed by $68bn, $30bn, $85bn, and $26bn.
- This quarter's $26 billion addition is the smallest since the surge began. Oracle said in the same release that it booked more than $30 billion of new AI cloud contracts during the quarter. New bookings above the change in balance means recognition and signing have started to offset each other.
- Size is worth measuring too. At $664 billion, RPO is 34.3 times this quarter's revenue and 7.4 times the $90 billion full-year revenue guidance. On the June call management said it expected 12% of RPO to be recognized within twelve months and another 34% between months 13 and 36. Applied to the current balance, that first tranche is roughly $797 billion — a figure that only makes sense as a multi-year queue, not as next year's revenue.
- Concentration follows from the same math. On the June call the company said it signed more than $8 billion with four of its largest customers in that quarter alone, while describing continuing diversification. Counterparties are not named in the filings.
AI Data Center Capex vs Cloud Hosting Prices
- Oracle's $28.499 billion of quarterly capital expenditure looks reckless in isolation. Against the industry it looks like participation.
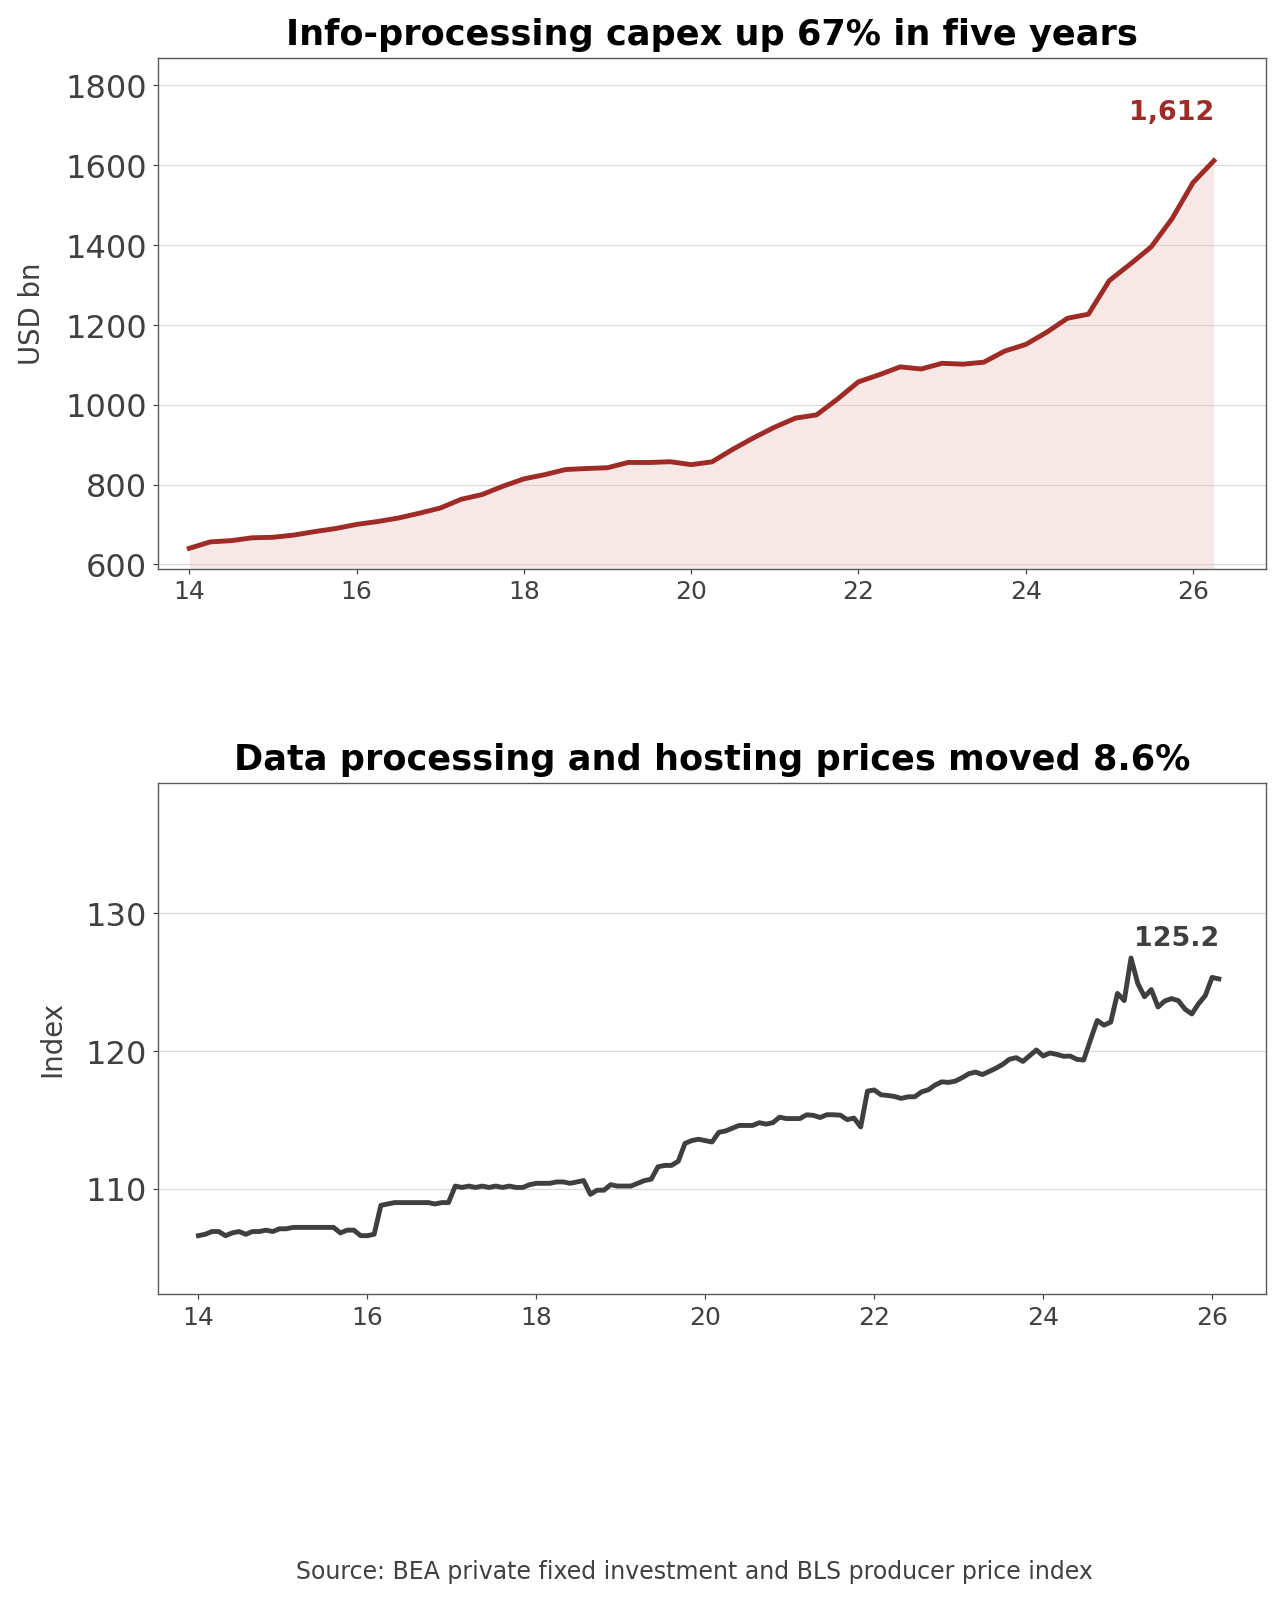
- Official statistics (FRED A679RC1Q027SBEA and PCU518210518210, Q2 2026 and Aug 2026): U.S. private fixed investment in information processing equipment and software ran at an annualized $1,611.5 billion in Q2 2026. The producer price index for data processing and hosting services stood at 125.2 over the same span.
- Against five years earlier that is +67.0% for the investment and +8.6% for the price. Capital is pouring in while the price of what the capital produces has barely moved.
- Capital is pouring in while the price of what the capital produces has barely moved. That combination shows up directly in Oracle's income statement as cloud cost of revenue growing faster than cloud revenue. When prices do not rise, added capacity has to be recovered through volume, which is why infrastructure providers increasingly contract first and build second.
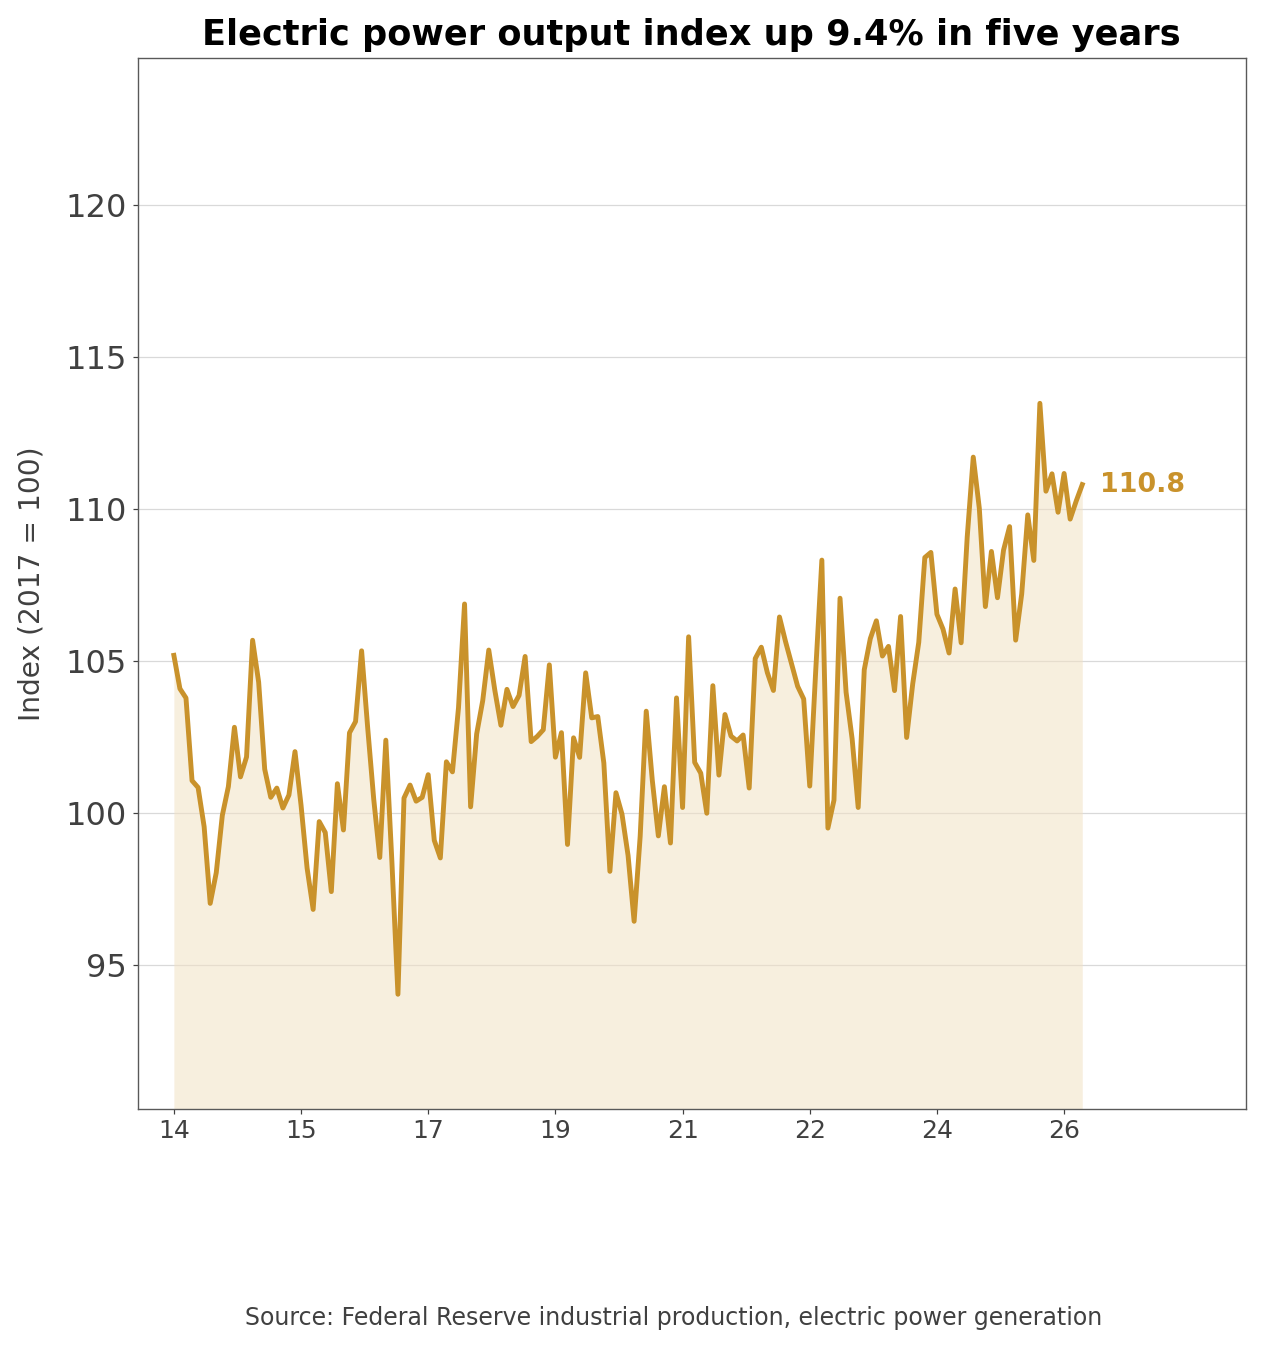
- Official statistics (FRED IPG2211S, Jul 2026): The electric power generation and distribution production index stands at 110.8. No official series measures data center electricity separately, so this is a proxy.
- That reading is +9.4% against five years ago. The index moved sideways near 100 for most of the last decade and turned up after 2024.
| Indicator | Latest | Five-year change | What it shows |
| Info processing equipment and software investment | $1,611.5bn | +67.0% | AI capex is large enough to move national accounts |
| Data processing and hosting PPI | 125.2 | +8.6% | Service pricing is not keeping pace with capacity |
| Electric power production index | 110.8 | +9.4% | Power demand proxy has changed direction |
| Oracle cloud and software cost of revenue | $6.400bn | +77.4% (1yr) | The industry pattern shows up in company costs |
- Source: U.S. Bureau of Economic Analysis, Bureau of Labor Statistics, Federal Reserve (FRED), and Oracle earnings releases.
- Two things decide outcomes in that environment: building cheaper than peers, and keeping what you build occupied. Oracle put global GPU utilization at 97.5% on the June call and said that of 35,000 GPUs up for renewal, 49% of those customers renewed 92% of them, with most of the remainder resold within the same quarter.
Oracle and CoreWeave Share the Same Cash Profile
- Which peer group Oracle belongs to changes the answer on valuation. As an enterprise software company it is a mature large cap. As an infrastructure builder it spends ahead of revenue like a growth company. Both groups are on the chart.
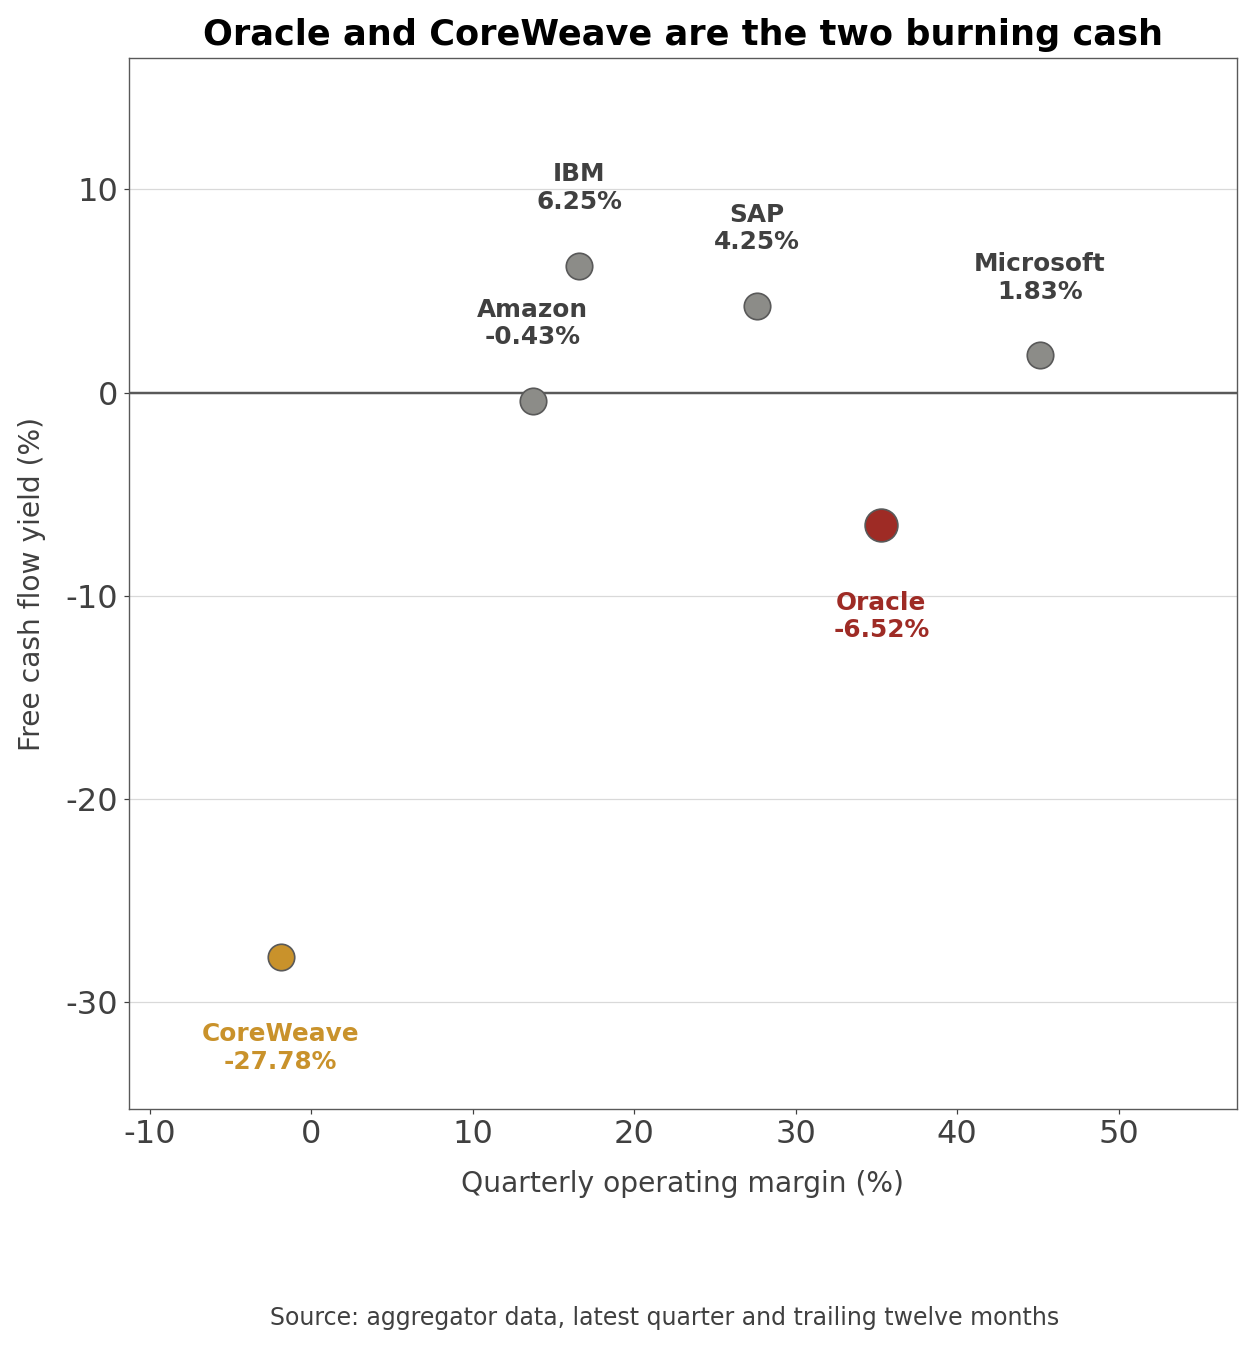
- Aggregator cross-check (as of Sep 10 2026): Quarterly operating margins run Microsoft 45.1%, Oracle 35.3%, SAP 27.6%, IBM 16.6%, Amazon 13.7%, CoreWeave -1.9%. Oracle sits second.
- Sort by free cash flow yield and the order inverts: IBM +6.25%, SAP +4.25%, Microsoft +1.83%, Amazon -0.43%, Oracle -6.52%, CoreWeave -27.78%. Second from the top on operating profitability, second from the bottom on cash generation. The only two companies below -1% are Oracle and CoreWeave, a 2024 IPO that builds AI data centers and has yet to reach operating profit.
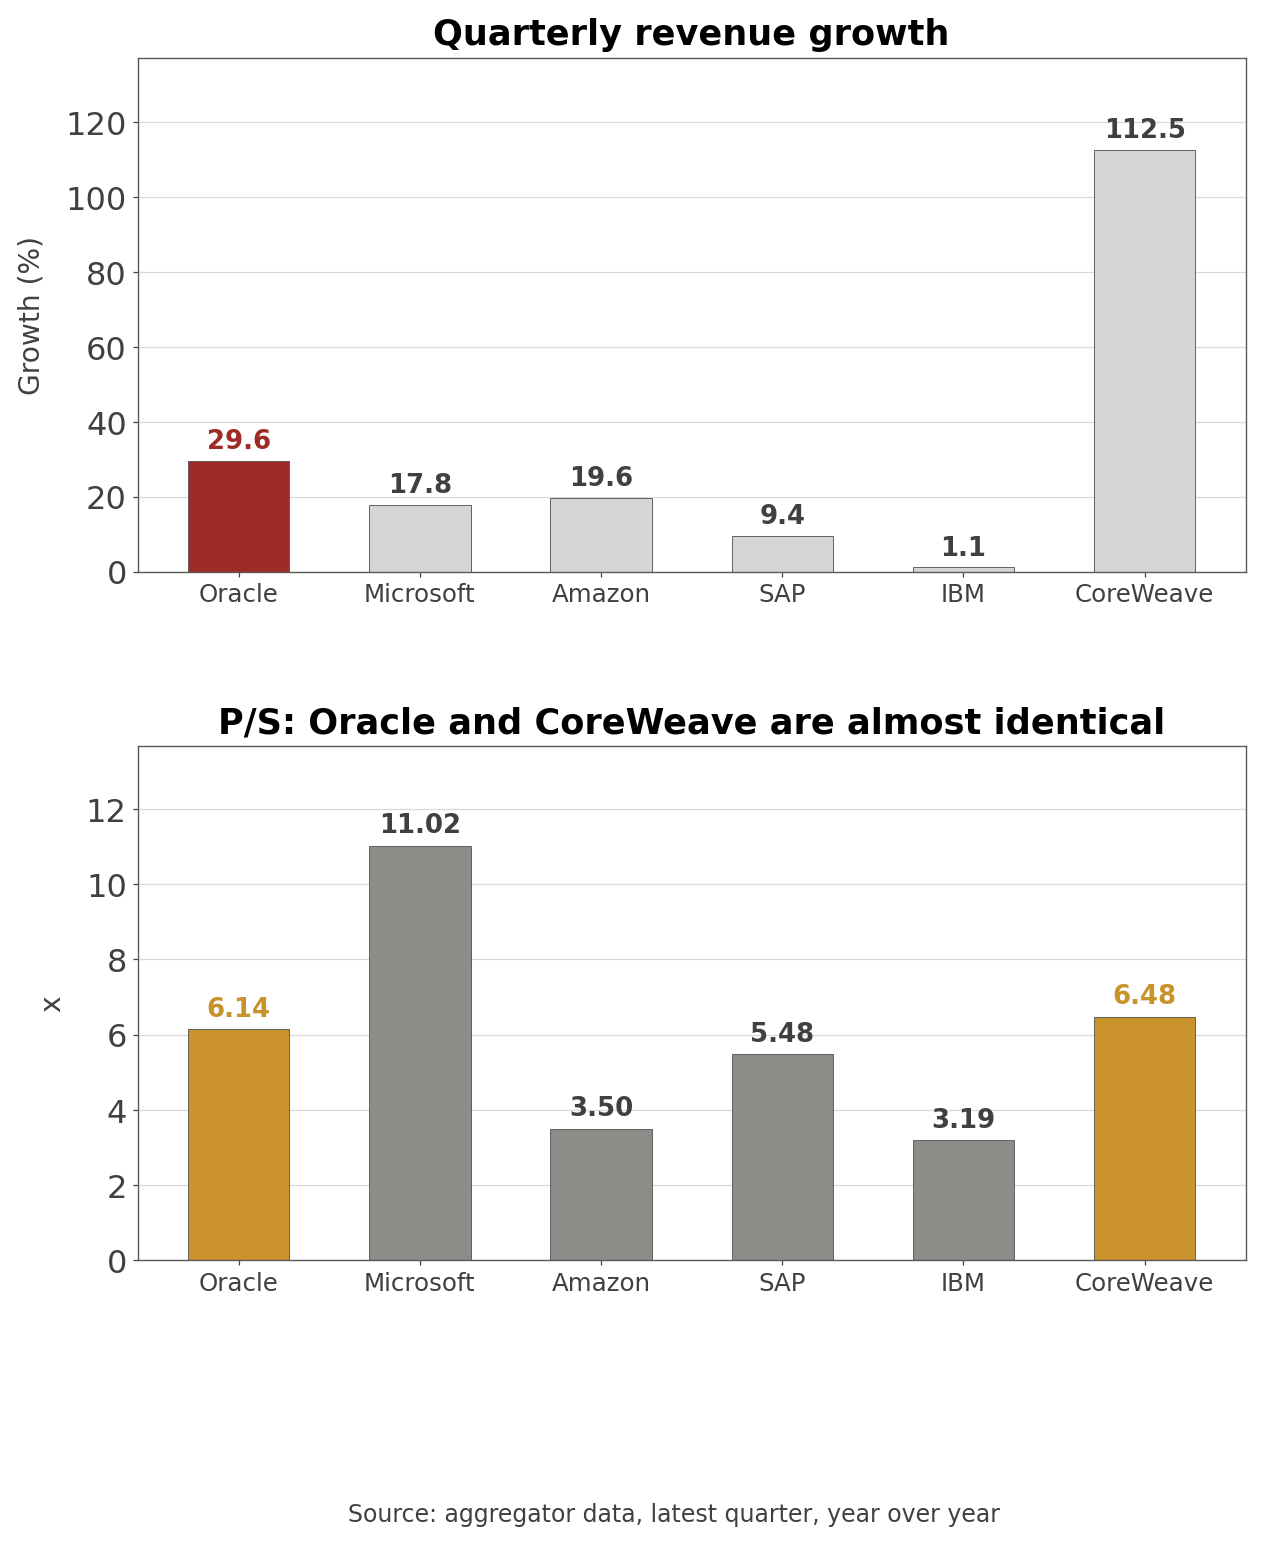
- Multiples put them side by side as well. Microsoft sits alone above 11x while everyone else falls below 6.5x, and in that lower cluster Oracle and CoreWeave land within a few hundredths of each other. Sort the same six by growth and the order scrambles: CoreWeave leads with triple digits and Oracle follows, yet the market pays both roughly the same multiple on revenue despite a gap of nearly 4x in growth rate.
| Company | Revenue growth | Operating margin | FCF yield | P/S |
| Oracle | +29.6% | 35.3% | -6.52% | 6.14x |
| Microsoft | +17.8% | 45.1% | +1.83% | 11.02x |
| Amazon | +19.6% | 13.7% | -0.43% | 3.50x |
| SAP | +9.4% | 27.6% | +4.25% | 5.48x |
| IBM | +1.1% | 16.6% | +6.25% | 3.19x |
| CoreWeave | +112.5% | -1.9% | -27.78% | 6.48x |
- Source: aggregated data, latest reported quarter as of September 10, 2026. Free cash flow yield is trailing twelve months.
Is Oracle Stock Expensive? Two Multiples, Two Answers
- Trailing twelve months, or TTM, means the last four reported quarters summed.
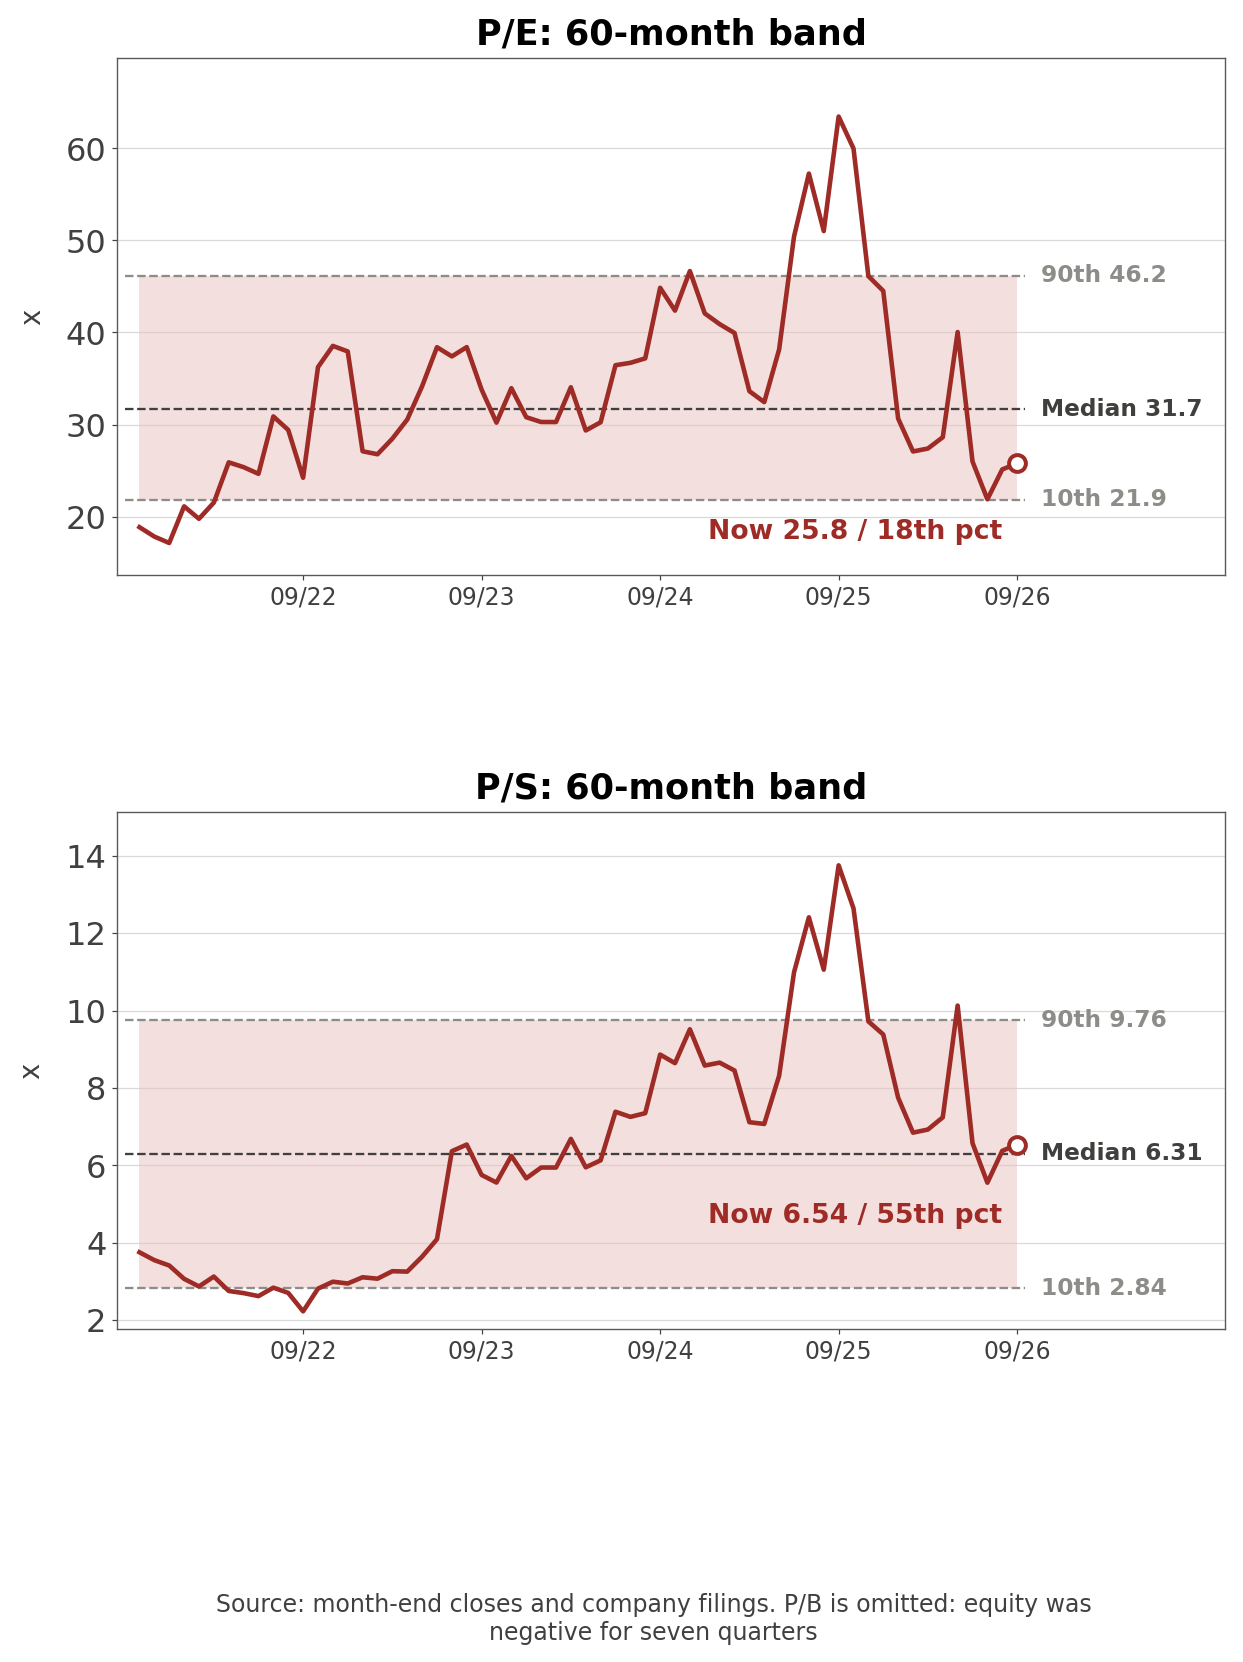
- Own calculation (120 month-end closes and XBRL quarterly financials, Oct 2016 to Sep 2026): Price to earnings is 25.78x, in the 18th percentile of the last 60 months. The range runs 17.15x to 63.44x with a median of 31.7x. Price to sales is 6.54x, in the 55th percentile, just above the 6.31x median.
- The two disagree because of the denominator. TTM net income climbed across the last five quarters from $12.441bn to $17.087bn while TTM revenue went from $59.018bn to $67.357bn. Earnings grew faster, so the earnings multiple fell further.
- Context helps. Oracle traded at $281.24 in September 2025 and closed this quarter at $152.94, down 45.6% over the year, while TTM revenue rose 14.1% and TTM net income rose 37.3%. The multiple compressed because price moved opposite to results.
- What sits under that denominator is the open question. Roughly 36% of this quarter's earnings increase came from lower costs, and restructuring is already down to $94 million with little left to cut.
- There is a third multiple, and its absence is informative.
- Own calculation (XBRL quarterly equity, Oct 2016 to May 2026): Oracle's stockholders' equity was negative for seven consecutive quarters, from August 2021 through February 2023, the result of sustained buybacks. It then climbed from $2.370 billion in August 2023 to $42.508 billion in May 2026, a 39.6-fold range across twenty quarters. Twenty-one of the last sixty months have no usable value at all, so no price-to-book band is drawn here.
- A company that once bought back stock until its equity went negative is now issuing stock to fund construction. That reversal is the balance sheet story of the year, and it is why the metric that worked a year ago does not work now.
- Aggregator cross-check (as of Sep 10 2026): Own price-to-book calculates to 10.37x against an aggregator's 10.80x. The difference is share count: the last confirmed figure from filings is 2.880 billion shares outstanding as of May 31, 2026, while the aggregator multiple implies roughly 3.0 billion. The at-the-market issuance explains the gap, and the 10-Q is not out yet, so market capitalization is not asserted in this analysis.
ORCL Price Targets and Analyst Revisions

- Aggregator cross-check (as of Sep 10 2026): Of 86 analysts, 56 rate the stock buy, 26 hold, and 4 sell. The twelve-month consensus target is $248, with a low of $160 and a high of $320.
- Direction is mixed. No firm raised its rating in the last 90 days, with 12 reiterations. The five target changes converge from both ends: the most bullish house cut $30, while a house sitting well below consensus added $3. The ceiling is falling faster than the floor is rising.
| Date | Firm | Rating | Target change |
| 2026-09-09 | Cowen | Buy | maintained |
| 2026-09-08 | Guggenheim | Buy | maintained |
| 2026-09-08 | Oppenheimer | Outperform | maintained |
| 2026-09-04 | Morgan Stanley | Positive | $207 to $210 |
| 2026-09-02 | Bernstein | Outperform | maintained |
| 2026-09-02 | Jefferies | Buy | $320 to $290 |
| 2026-08-26 | Citigroup | Buy | maintained |
| 2026-08-21 | UBS | Outperform | maintained |
- Source: aggregated sell-side research, 90 days to September 10, 2026.
- Earnings estimates barely moved. Fiscal 2027 consensus EPS went from $8.05 ninety days ago to $8.06, and fiscal 2028 from $10.88 to $10.97. Oracle's own full-year guidance is non-GAAP EPS of $8.10, effectively on top of consensus.
- Company disclosure (fiscal Q1 2027 earnings release, Sep 10 2026): The company also gave second-quarter guidance, with non-GAAP EPS of $1.85 to $1.93.
- Written with signs, that guidance is revenue +30% to +34% and cloud revenue +65% to +71% in U.S. dollars. A footnote then reverses one of them: the EPS growth rate excludes a one-time investment gain from the sale of Oracle's Ampere stake in fiscal Q2 2026, and including that gain, second-quarter non-GAAP EPS declines 14% to 18%. Excluding it, the same quarter grows 21% to 25%. Both are in the release, and coverage that copies one number tends to drop the other.
What Would Change This View
| Scenario | Condition | Indicator to check | When · Source |
| Upside | Operating cash grows without customer prepayments | Gap between reported capex and net cash outlay narrows | FQ2 2027 release, expected December 2026 |
| Upside | Cloud cost growth falls below cloud revenue growth | Gross margin recovers from 60.03% | FQ2 2027 release |
| Upside | Sequential RPO addition exceeds $26 billion | RPO balance and new bookings in release text | FQ2 2027 release |
| Downside | Cost reductions run out and margin expansion stops | Restructuring, amortization, sales and marketing year over year | FQ2 2027 release |
| Downside | Funding shifts from equity back to debt | Total borrowings above $125.3 billion, new notes 8-K | Any time during the quarter |
| Downside | Support revenue decline accelerates past 1.2% | Software support line, supplemental revenue table | FQ2 2027 release |
- Full-year guidance is at least $90 billion of revenue and $8.10 of non-GAAP EPS. On the June call management guided to roughly $70 billion of net cash outlay for fiscal 2027, with reported capex running $20 billion to $25 billion higher because of customer prepayments.
- Annualizing this quarter's $28.499 billion of reported capex gives $114 billion, above the $95 billion implied ceiling. Spending is rarely even across quarters, so the annualized figure will not hold literally. Still, one quarter consumed 51.2% of the prior full year's capital expenditure.
Related Analysis
- CrowdStrike (CRWD) Stock Analysis: GAAP vs Non-GAAP
- Dell (DELL) Stock Analysis: AI Server Guidance
- TSMC (TSM) Stock: 60% Margins and Guidance It Keeps Beating
Methodology and Sources
- Price reference is the September 10, 2026 close of $152.94 on the NYSE. Earnings were released after that session, and the after-hours print was $159.26. Financial figures come from the 8-K and exhibit 99.1 Oracle filed on September 10, 2026; the 10-Q was not yet available, so this quarter's end-of-period share count is not final.
- I parsed all 60 Form 8-K filings Oracle submitted between December 2019 and September 2026, identified 28 of them as quarterly earnings releases, and built the revenue, cloud, cash flow and RPO time series from those documents directly. Derived figures were recomputed in code and checked with assertions against the filings, including the $10.533 billion prepayment figure, which reconciles across two separate tables. Valuation bands use 120 month-end closes with quarterly financials from XBRL company facts (CIK 1341439); price-to-book is omitted because equity was negative for seven quarters.
- Call quotations are from the fiscal Q4 2026 earnings call held June 10, 2026. The fiscal Q1 2027 call transcript was not yet published. Analyst consensus and peer multiples come from aggregated sell-side research and market data aggregators as of September 10, 2026. Industry series are from the U.S. Bureau of Economic Analysis, Bureau of Labor Statistics, and the Federal Reserve via FRED.
- This analysis is for information only and is not investment advice. Last updated: September 11, 2026.
#Oracle #ORCL #OracleStock #ORCLStockAnalysis #CloudInfrastructure #AIDataCenter #FreeCashFlow #USStocks #StockAnalysis #EquityResearch #GlobalStockBrief
'US Stock Analysis' 카테고리의 다른 글
| Bitmine (BMNR) Stock Analysis: mNAV Below 1 and Dilution (0) | 2026.09.14 |
|---|---|
| Sumitomo Electric (5802) Stock Analysis: Data Center Optics (0) | 2026.09.13 |
| Linde (LIN) Stock Analysis: Price, Volume and Margin Trends (0) | 2026.09.12 |
| Uber (UBER) Stock Analysis: Gross Bookings vs Revenue Gap (0) | 2026.09.11 |
| ASML Stock Analysis: The Bookings Line That Went Missing (0) | 2026.09.11 |


