Linde (LIN) Stock Analysis: Price, Volume and Margin Trends
by Global Stock Brief2026. 9. 12.
Linde (LIN) Stock Analysis: Price, Volume and Margin Trends
Linde plc (NASDAQ: LIN) reported Q2 2026 revenue of $9.29 billion, up 9% year over year, and an operating margin of 27.5% that was lower than the same quarter last year for the first time in three years. This LIN stock analysis works through the price-and-volume split the company publishes itself in every earnings release, why operating income rose 40% across eleven quarters in which volume contributed nothing, what the official price and output statistics say about the same period, where the P/E and P/B bands sit today, and why management left this quarter's volume recovery out of its own guidance.
Two things happened in the same quarter, and they point in opposite directions. Volume contributed as much as price for the first time since Q4 2021. And the margin that price had been lifting for three years stopped rising.
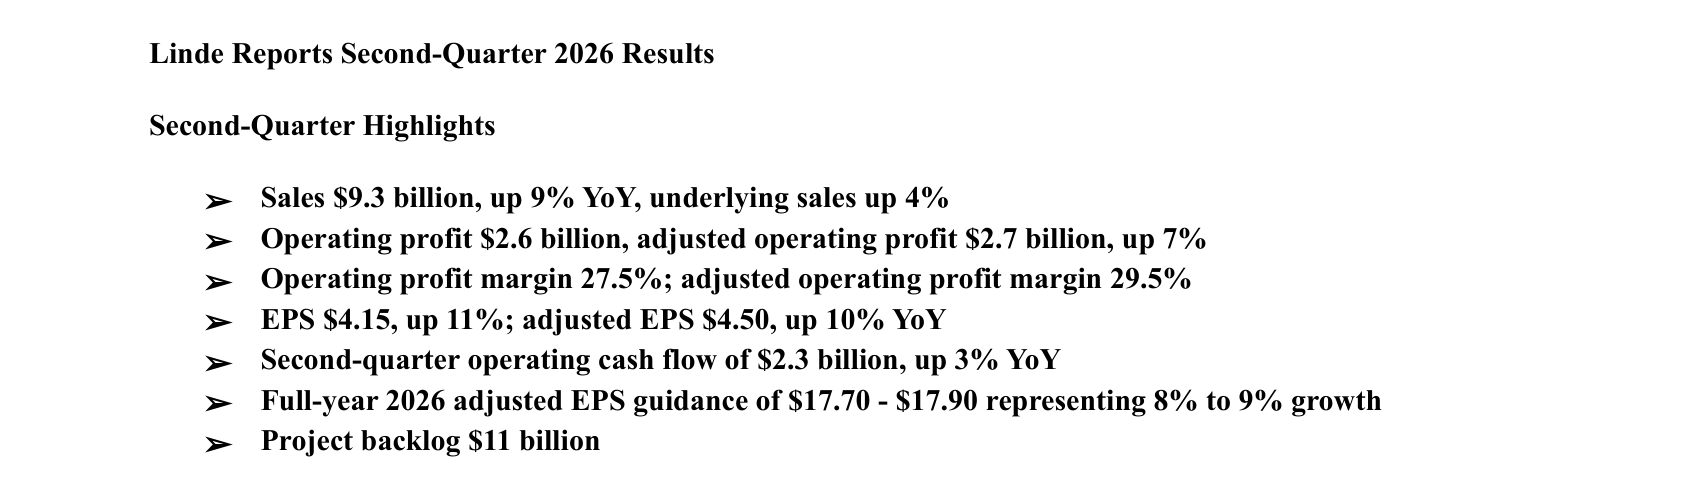
Linde Q2 2026 earnings release, page 1: the metrics the company put up front
Linde's market capitalization is $220.2 billion. The fiscal year ends in December, so Q2 2026 covers April through June. Unless stated otherwise, profit figures are US GAAP and multiples use trailing-twelve-month (TTM) denominators.
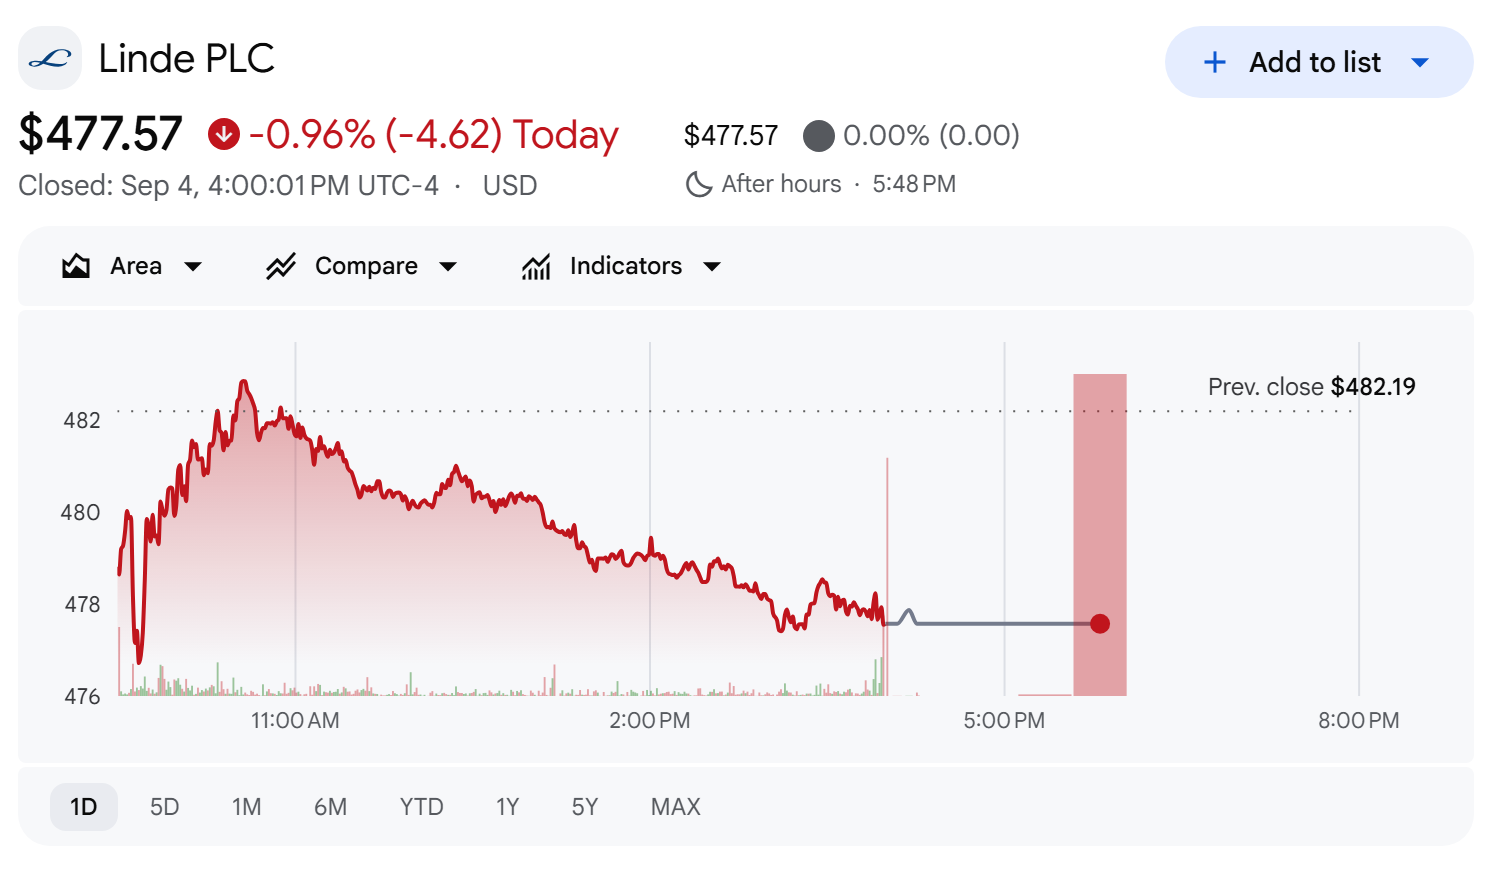
LIN share price, Google Finance, close of Sep. 4, 2026
How Linde Splits Its Own Sales Growth
There are only two ways an industrial gas company grows: sell more molecules, or charge more for them. Linde prints both numbers in the body of every quarterly release.
Company disclosure (Q2 2026 earnings release, July 31, 2026): "Compared to prior year, underlying sales increased 4% from 2% price attainment and 2% volumes, primarily in the electronics, manufacturing and chemicals & energy end markets."
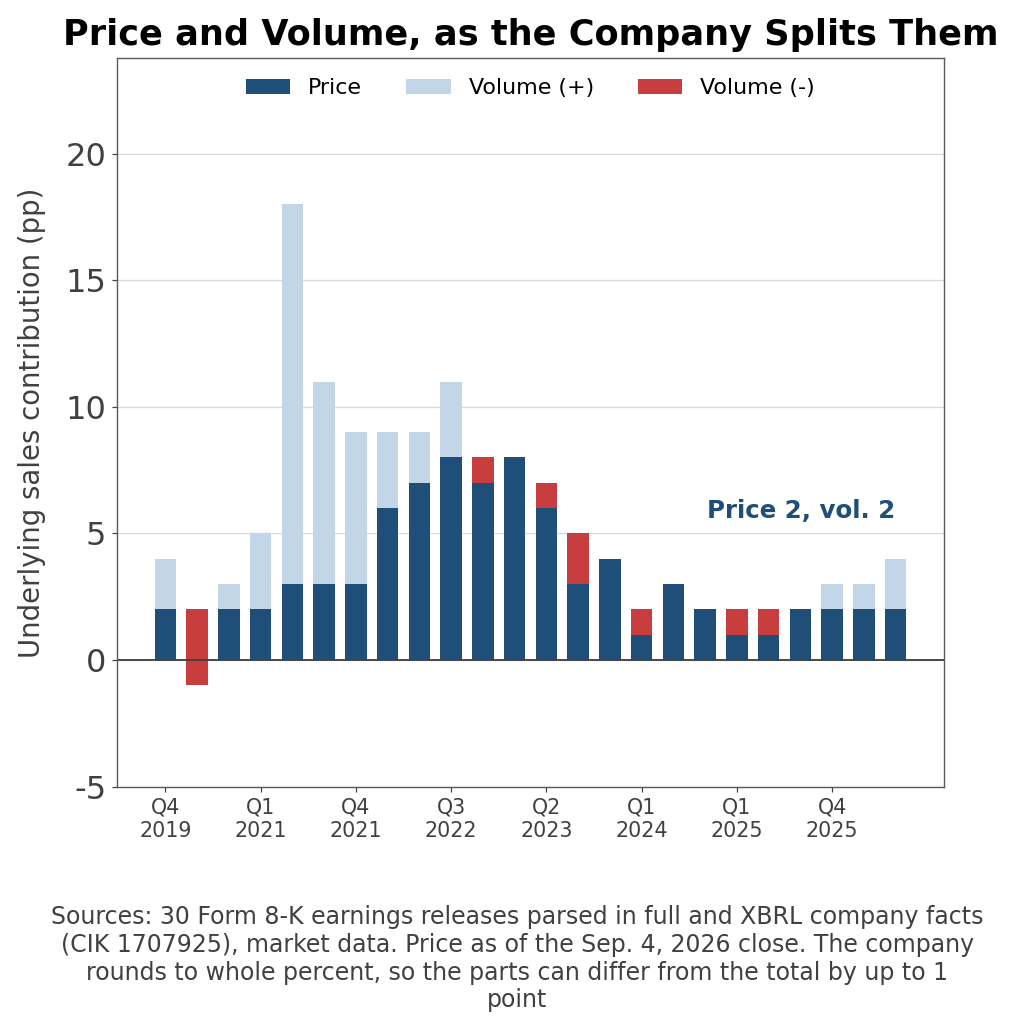
Price and volume contribution across 24 quarters, as the company splits them
Own calculation (30 Form 8-K earnings releases, Q1 2019 to Q2 2026): I pulled every earnings release Linde has filed and parsed that sentence into a 24-quarter series. The company writes it eight different ways, so in every quarter I checked the identity that underlying sales should equal price plus volume. It holds in all 24, within the one-point rounding the company itself uses.
The series reads in one direction. In 2021, volume carried the growth: +15, +8, +6 points. From 2022 the roles swap, price climbs to +6, +7, +8, and volume falls to zero or below. Then in Q2 2026 the two are level again at +2 and +2.
The last quarter in which volume contributed as much as price was Q4 2021. For the sixteen quarters in between, every point of Linde's growth came from price.
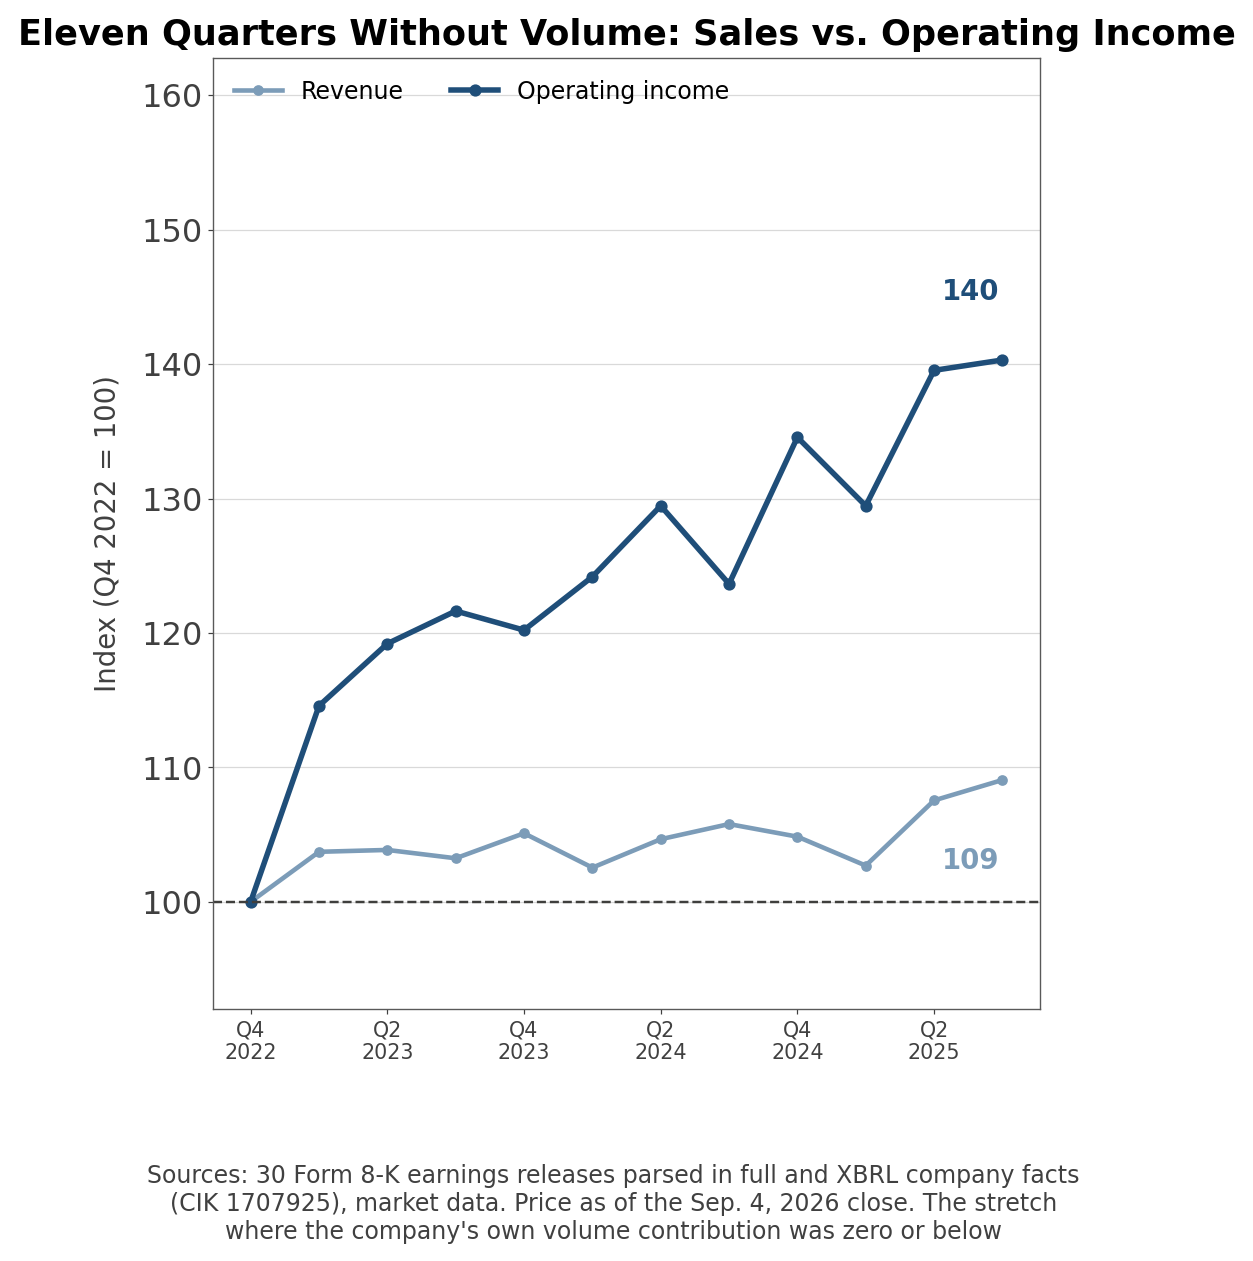
Eleven Quarters Without Volume, 40% More Operating Income
Look at that stretch through the revenue line and it is unremarkable. Q4 2022 revenue of $7,899 million, Q3 2025 revenue of $8,615 million: +9.1% over three years.
Quarterly revenue and operating margin across 30 quarters
Operating income over the same eleven quarters went from $1,687 million to $2,367 million, or +40.3%. Operating margin went from 21.4% to 27.5%.
Widen the frame and the gap widens with it. Since Q1 2019 revenue is up 33.8% while operating income is up 319.4%, because margin went from 8.8% to 27.5%.
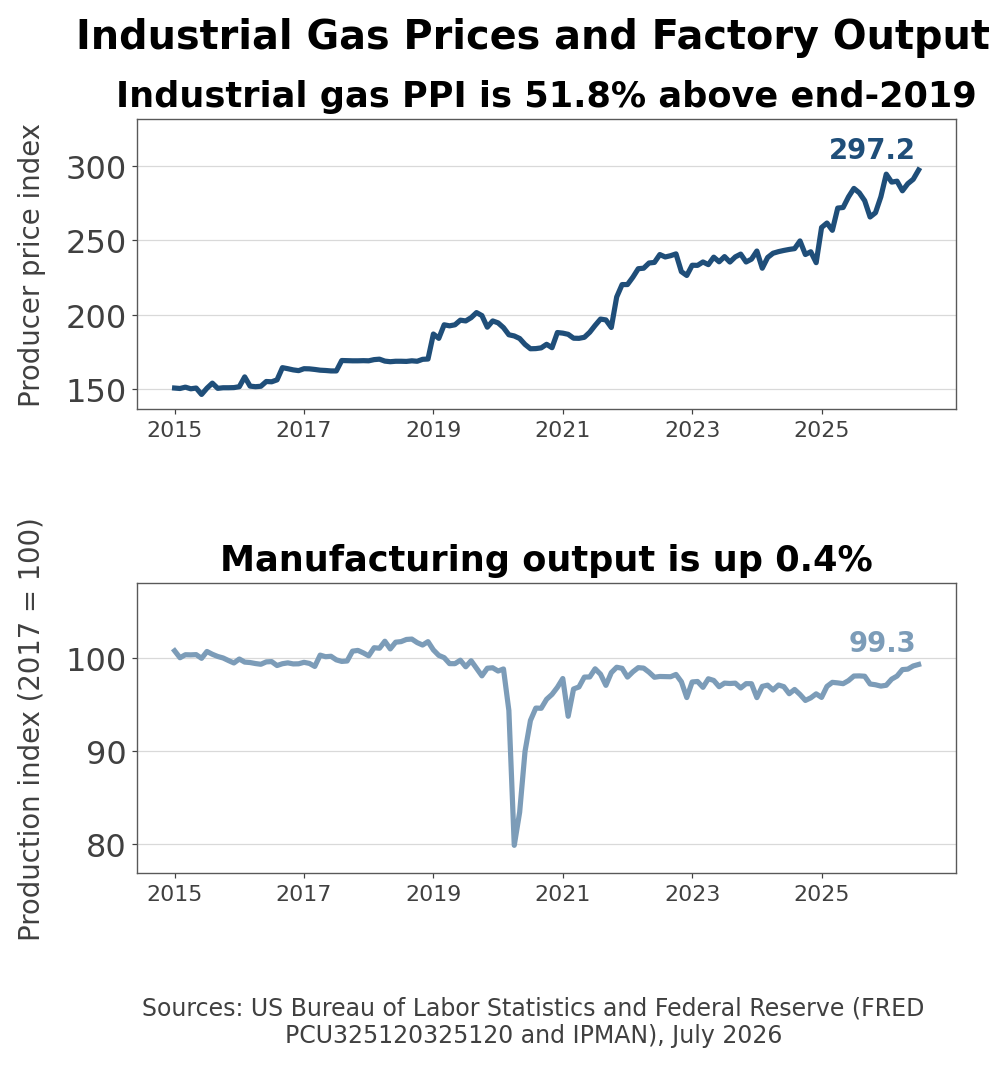
Official statistics (FRED PCU325120325120 and IPMAN, July 2026): the US producer price index for industrial gas manufacturing has gone from 195.8 at the end of 2019 to 297.2, a rise of 51.8%. Over the same span the manufacturing production index went from 99.0 to 99.3, a rise of 0.4%.
The company's account and the government's numbers say the same thing. Prices are up by half; the factory output that drives volume has not moved in seven years. What produced Linde's earnings was not an industrial recovery. It was the ability to raise price.
Why Did Linde's Margin Fall This Quarter?
That ability comes from the contracts. Linde's largest customers take gas from a plant built next to their own, on ten- to twenty-year agreements with minimum-offtake clauses and energy and inflation pass-throughs. Volume can sit still and the price still steps up. Three years of high inflation were, for this company, a margin expansion program.
Revenue against operating income across the eleven quarters without volume
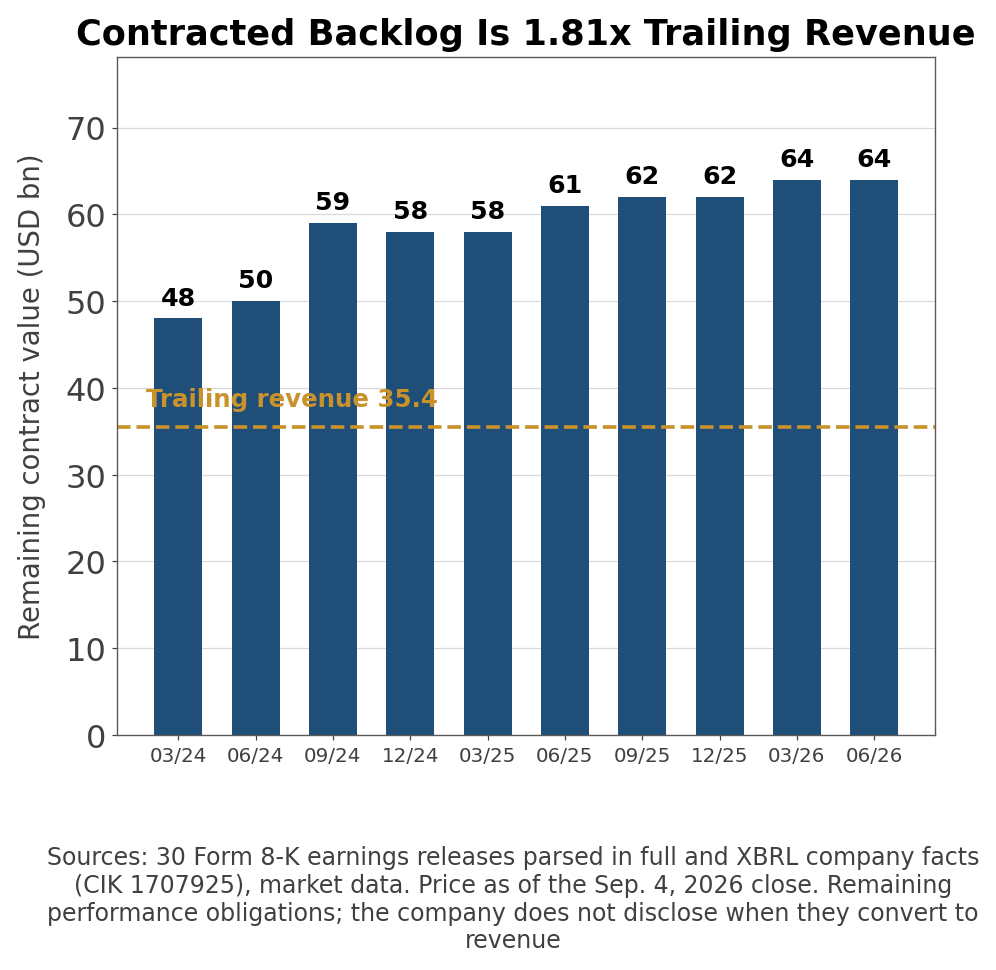
You can see how much of that is contracted. Remaining performance obligations stand at $64 billion, or 1.81x trailing revenue of $35.45 billion, up from 1.47x two years ago. This quarter the company won another long-term US electronics supply contract, taking the sale-of-gas backlog to a record $8.1 billion, with a project backlog of $11 billion on top.
Contracted backlog against trailing revenue
Then came the sentence that complicates all of it.
Filing footnote (Q2 2026 earnings release, margin commentary): "Operating margin was 60 basis points lower than the previous year as higher price and productivity initiatives were offset by cost inflation."
The sales split and the margin sentence, in the company's own words
Price and productivity were the two forces that lifted margin for three years. This quarter they fought cost inflation to a draw. On the GAAP line the move is smaller, 27.5% against 27.7% a year ago, but it points the same way.
Management did not soften it. On the earnings call, Chief Executive Sanjiv Lamba said he was not satisfied with the quarter's margin performance and put the blame mainly on the Americas, where the US home-care business and a higher mix of equipment and hardware sales diluted the result. Chief Financial Officer Matthew White noted that the 2% of price was broad-based across regions and roughly in line with local inflation, which is to say price is no longer running ahead of costs.
And then the detail that matters most. Management left the volume recovery out of the second-half guidance, saying it wants to watch the trend for a few more quarters before building it in. Full-year adjusted EPS guidance stayed at $17.70 to $17.90, or 8% to 9% growth excluding a point of currency tailwind.
The company does not yet believe its own volume number. That is the most honest thing in the release.
What Does Linde (LIN) Do?
Linde sells oxygen, nitrogen, argon, hydrogen and specialty gases in three delivery modes. On-site plants sit next to a customer's factory and pipe gas over the fence on long contracts. Merchant supply moves liquefied gas by tanker truck. Packaged gas ships in cylinders. On-site carries the minimum-offtake and inflation clauses; merchant and packaged run shorter contracts where regional delivery density is the moat. The hardware sales that diluted Americas margin this quarter sit in the packaged business.
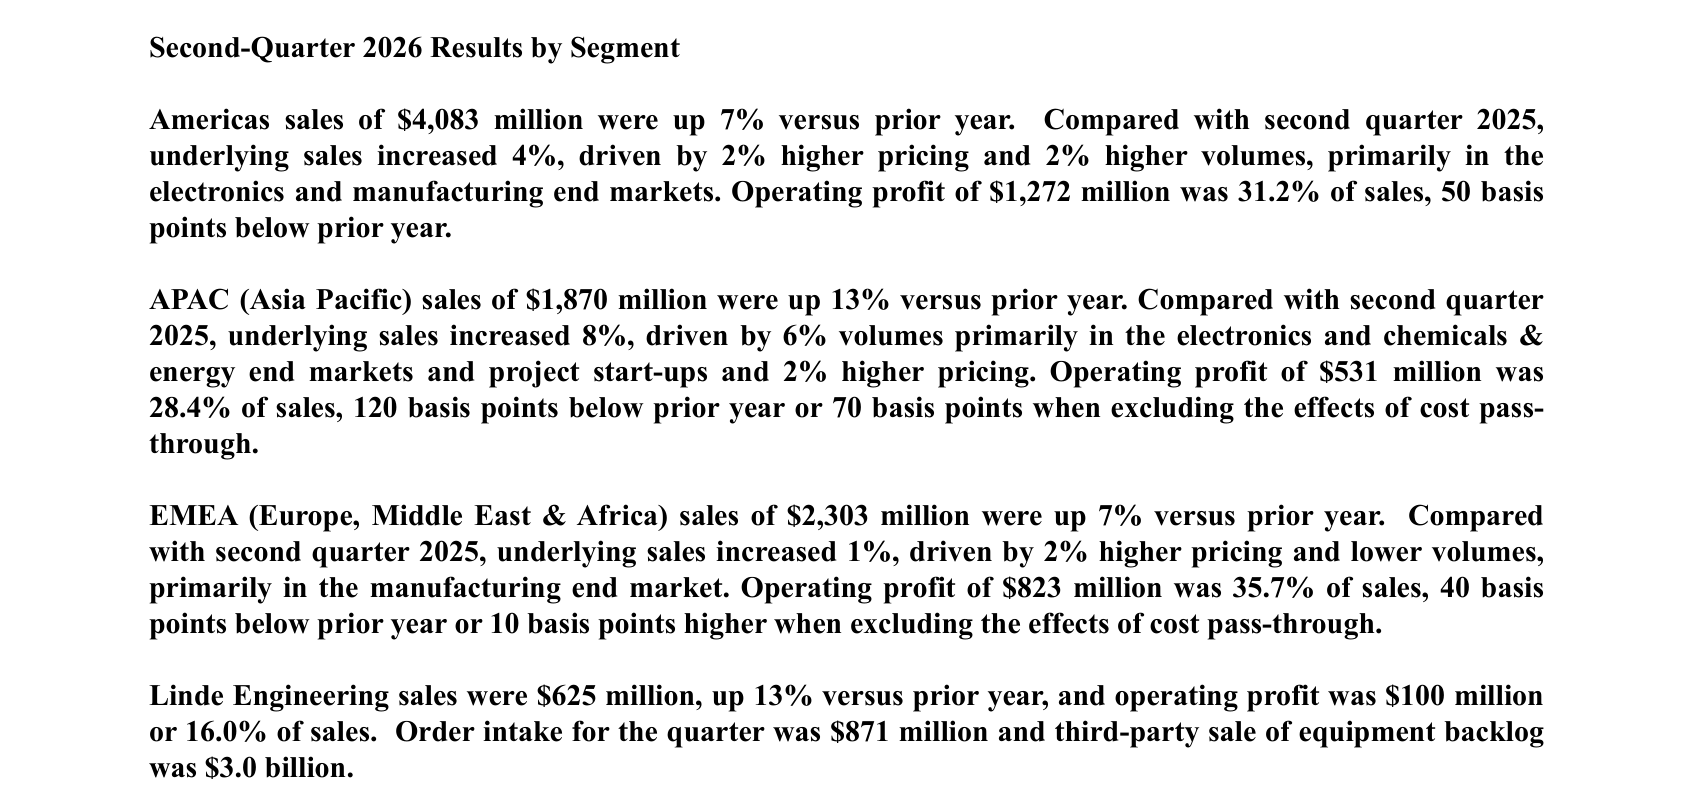
Linde Q2 2026 results by segment, from page 2 of the release
By region, Americas revenue was $4,083 million (+7%), EMEA $2,303 million (+7%), APAC $1,870 million (+13%), and Engineering $625 million (+13%) at a 16.0% operating margin.
APAC leads by a distance. Management attributed roughly half of the volume increase to project start-ups in APAC and the Americas, with the rest from organic growth in the US, China, Korea and India and from the advanced materials business. Electronics is the fastest-growing end market and the largest contributor to backlog.
The awkward part is that the region where revenue grew fastest in dollars, the Americas, is also where margin was squeezed. A mix that adds sales while subtracting margin is not a combination a company leaves alone for long.
US Industrial Gas Prices vs. Factory Output
US industrial gas producer prices and manufacturing output
Official statistics (FRED PCU325120325120, IPMAN and MCUMFN, July 2026): industrial gas producer prices are up 4.3% year over year. Manufacturing output is up 1.3%, and manufacturing capacity utilization is 76.0%, essentially flat.
Measure
July 2026
Year earlier
vs. end-2019
Industrial gas PPI
297.2
284.9
+51.8%
Manufacturing output index
99.3
98.1
+0.4%
Manufacturing capacity utilization
76.0%
75.9%
-1.2pp
Utilization at 76% is below where it sat before the pandemic. Idle capacity does not consume industrial gas. For volume to come back durably this number has to rise first, and it has not. That is the same picture management is looking at when it declines to put the recovery in guidance.
The end markets are not uniform, though. Management named electronics and aerospace as the volume leaders this quarter while metals, mining, chemicals and energy grew slowly. Semiconductor fabs pull ultra-high-purity nitrogen and hydrogen with them, and the US advanced-node contract Linde signed this quarter is a $1 billion award. Two more electronics wins at a Taiwanese joint venture are not yet in the backlog at all.
Is Linde Stock Expensive? P/E Says No, P/B Says Yes
Own calculation (60 month-end closes, TTM denominators): I built month-end market capitalization from August 2020 through September 2026 and measured all three multiples. Current values agree with aggregator figures within 0.8% on market capitalization, 0.6% on P/E and 0.8% on P/B.
P/E and P/B over 60 months; one price, two verdicts
Price-to-earnings of 30.62x is the 8th percentile of its own five-year range, well under the 36.69x median. Price-to-book of 5.68x is the 75th percentile, above its 4.76x median. Price-to-sales at 6.26x sits between them at the 65th.
The same price is cheap on one measure and expensive on the other, and the denominators explain why. Over five years trailing net income went from $2,277 million to $7,244 million, up 218%, while shareholders' equity went from $45,537 million to $39,081 million, down 14%. Earnings tripled; capital shrank under buybacks. Neither reading is wrong, and they point opposite ways.
Stretch to seven years and diluted shares fall from 549.1 million to 464.5 million, down 15.4%. That is the part of per-share growth the business itself did not have to produce.
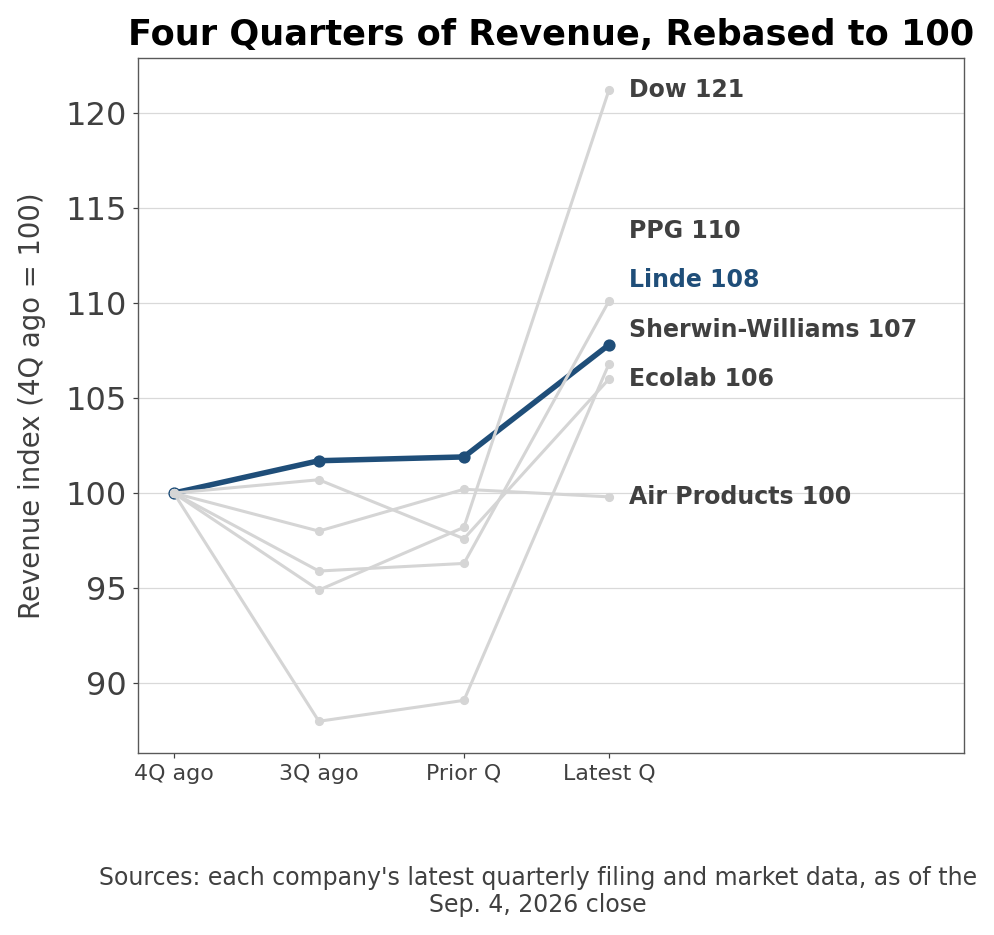
Six peers, revenue rebased to 100 four quarters ago
Company (Ticker)
Revenue growth
Operating margin
P/S
P/B
Linde (LIN)
+9.3%
28.1%
6.21x
5.63x
Air Products (APD)
+4.6%
25.5%
5.32x
4.83x
Ecolab (ECL)
+9.7%
18.5%
4.65x
7.79x
Sherwin-Williams (SHW)
+7.5%
18.1%
3.30x
20.89x
PPG (PPG)
+7.2%
14.0%
1.52x
2.96x
Dow (DOW)
+19.7%
11.6%
0.51x
1.34x
At 28.1% Linde has the highest operating margin of the six and leads Air Products, its closest business comparable, by 2.6 points. Dow is in the table as a control. It grows revenue fastest at +19.7% and earns an 11.6% operating margin, which is what a commodity chemical business without pricing power looks like next to one with it.
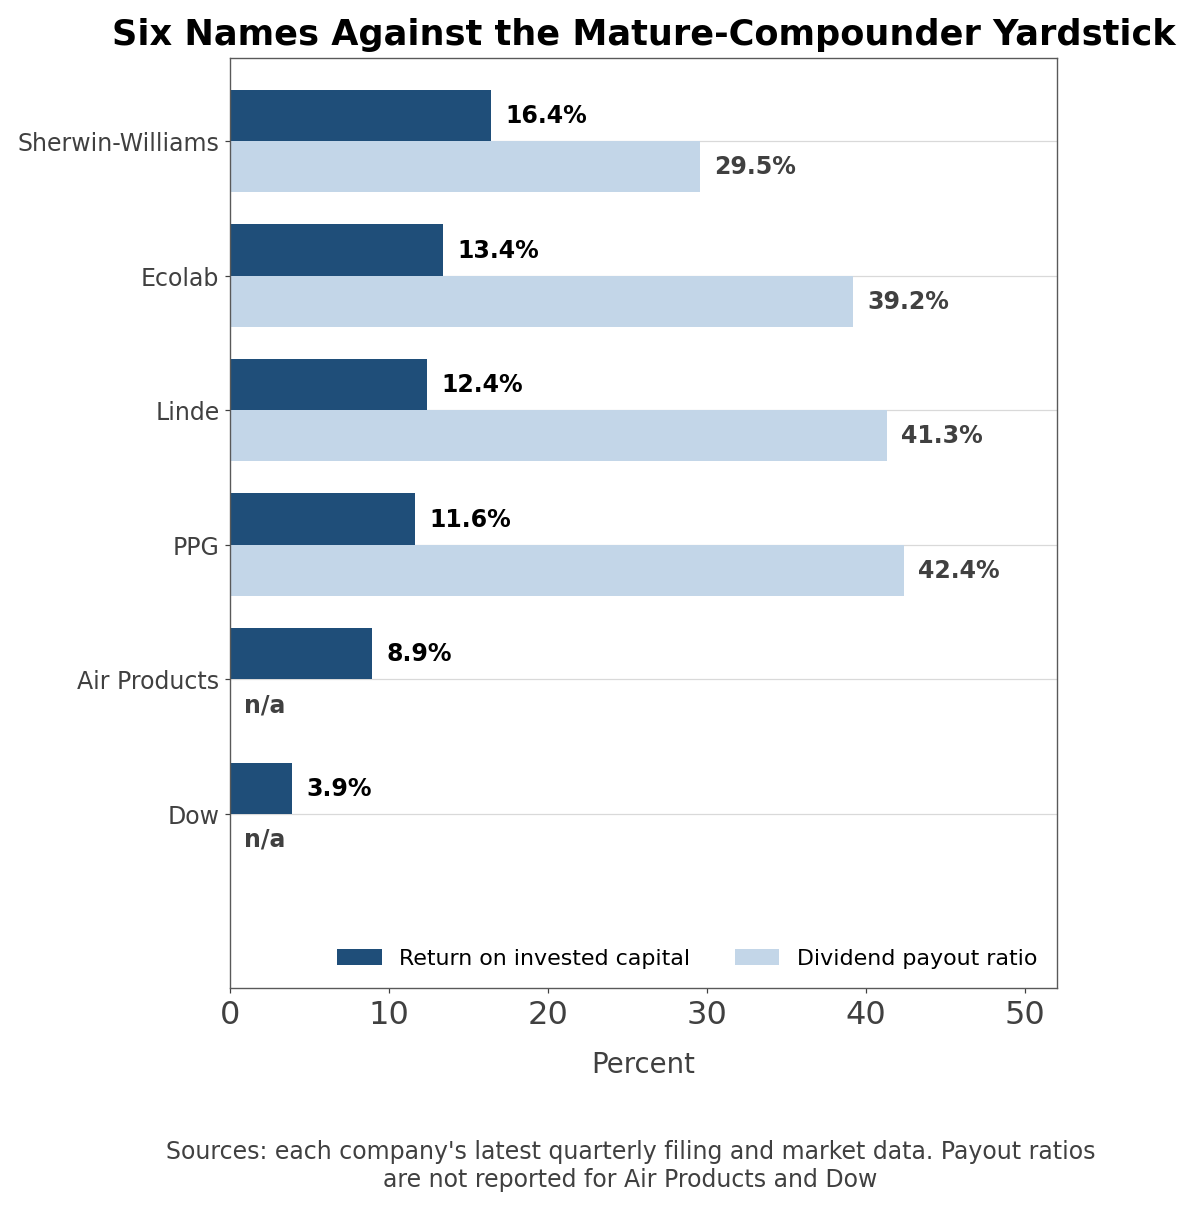
Return on invested capital and dividend payout across the six
Company (Ticker)
Return on invested capital
Dividend yield
Payout ratio
EV/EBITDA
Linde (LIN)
12.37%
1.34%
41.30%
17.60x
Air Products (APD)
8.94%
2.40%
n/a
18.13x
Ecolab (ECL)
13.38%
1.05%
39.18%
21.05x
Sherwin-Williams (SHW)
16.39%
0.96%
29.52%
20.23x
PPG (PPG)
11.63%
2.63%
42.35%
11.41x
Dow (DOW)
3.88%
4.75%
n/a
9.20x
Linde's 12.37% return on invested capital is mid-pack, and that is worth reading carefully. Sherwin-Williams and Ecolab clear it because they do not have to build plants; their denominators are light. Industrial gas is capital-heavy by construction, and Air Products, the one company here under the same constraint, earns 8.94%. Within its own capital intensity Linde is the high scorer. It returns cash through a modest yield and a 41.30% payout while shrinking the share count, rather than through a large dividend.
The company returned $1,590 million to shareholders this quarter against free cash flow of $833 million. Management attributes the gap to first-half seasonality.
LIN Price Targets and Analyst Revisions
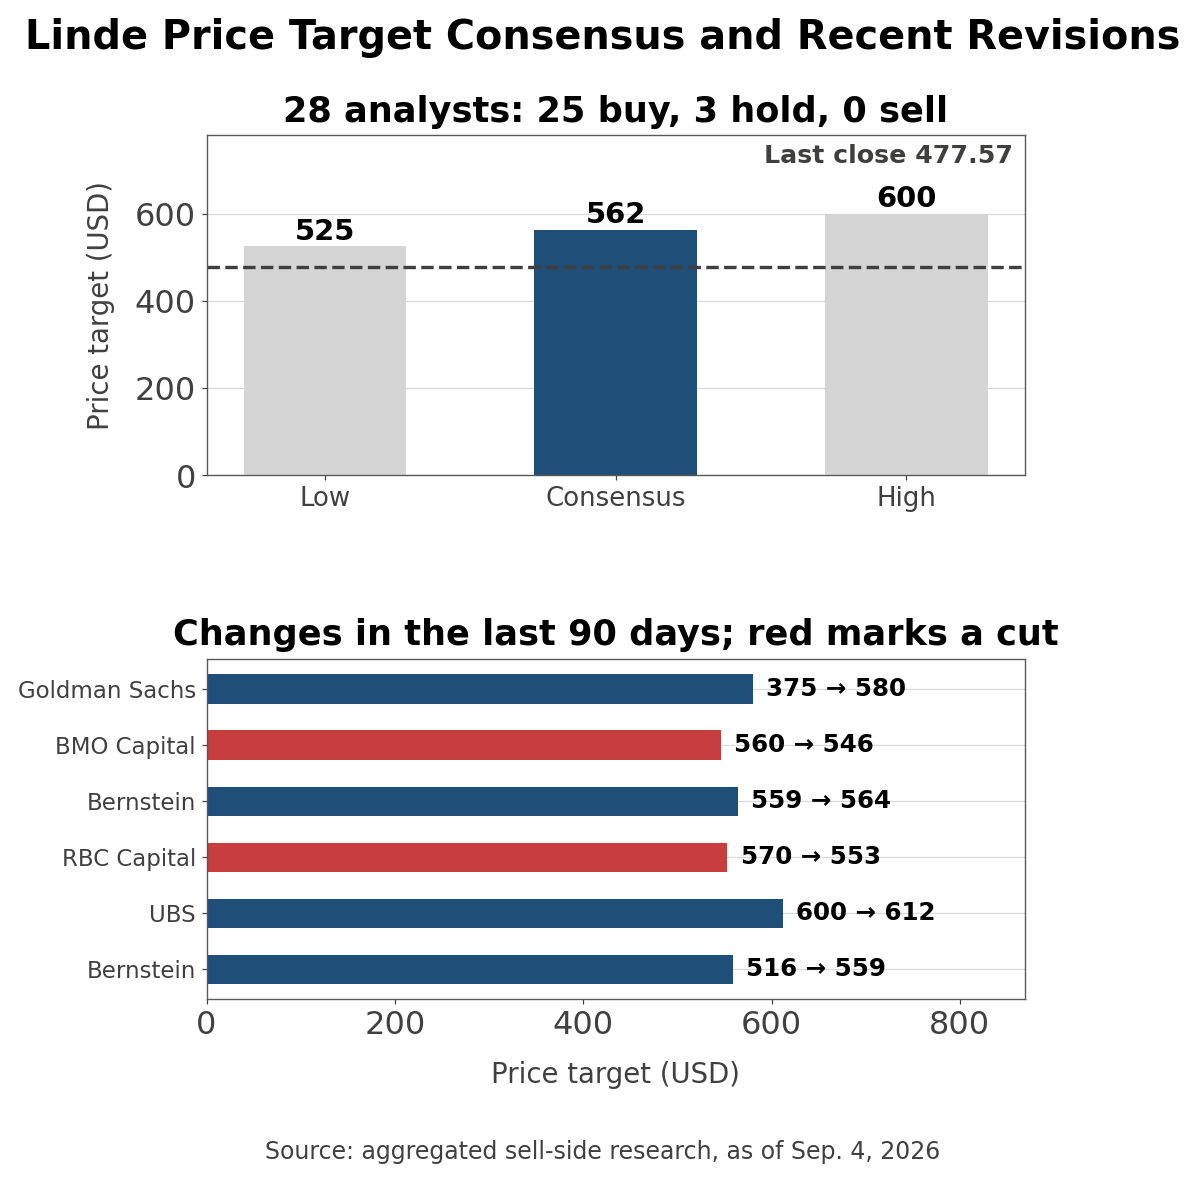
Aggregator cross-check (aggregated sell-side research, as of Sep. 4, 2026): 28 analysts cover the stock, with 25 buy, 3 hold and no sell ratings. The twelve-month consensus target is $562, 17.7% above the $477.57 close, with a low of $525 and a high of $600.
Target distribution and the revisions of the last 90 days
In the last 90 days there were no rating upgrades: 9 reiterations, 1 initiation and 7 target changes.
Date
Firm
Rating
Target
2026-09-04
UBS
Buy
maintained
2026-08-10
Goldman Sachs
maintained
375 → 580
2026-08-10
BMO Capital
maintained
560 → 546
2026-08-03
Bernstein
Outperform
559 → 564
2026-08-03
RBC Capital
maintained
570 → 553
2026-08-03
UBS
maintained
600 → 612
2026-07-17
Bernstein
maintained
516 → 559
The early-August cluster follows the July 31 results, and the houses split: three raised, two cut. Goldman's $375 starting point had gone stale rather than bearish, so reading that percentage move as conviction would overstate it.
Earnings estimates moved the other way. Over the last 30 days there were 8 upward and 13 downward revisions to 2026 EPS, which is what a quarter with a falling margin produces. Note also that the headline P/E depends on which earnings you use: on GAAP trailing earnings the stock trades at 30.82x, while quote pages that use adjusted EPS of $17.37 show 27.50x.
Bull and Bear Conditions for LIN Stock
Scenario
Condition
Indicator to check
When · Source
Bull
Volume contribution stays positive two more quarters
Volume figure in the release body
Q3 2026 release
Bull
Margin returns to sequential improvement
Adjusted operating margin, quarter over quarter
Q3 2026 release
Bull
Sale-of-gas backlog closes the year near $8bn-plus
Backlog disclosure
Q4 2026 release
Bear
Price contribution slips below local inflation
Price figure in the release body
Q3 2026 release
Bear
Americas mix dilution persists
Americas segment margin
Q3 2026 release
Bear
Capacity utilization falls back under 76%
Federal Reserve monthly release
Monthly
Guidance for 2026 adjusted EPS is $17.70 to $17.90, and Q3 is expected to rise about $0.05 sequentially at the midpoint excluding currency. The volume recovery is not inside those numbers.
Questions This Analysis Does Not Answer
How big is the US home-care business? Management says it weighed on Americas margin, but Linde does not disclose its revenue or profit separately, and the extent of the portfolio pruning is not visible from filings.
When does the $64 billion of contracted backlog convert to revenue? The company discloses the total remaining performance obligation but not the recognition schedule, and the boundary between the $11 billion project backlog and the $8.1 billion sale-of-gas backlog is described only briefly.
What does electronics actually contribute? Management calls electronics the fastest-growing end market and the largest backlog contributor, but Linde reports by geography, not by end market. The disclosure stops at the regional line.
Every figure here comes from Linde's own filings with the US Securities and Exchange Commission. I downloaded all 79 Form 8-K filings the company has made since 2018, extracted the 30 quarterly earnings releases among them, and parsed the sales-decomposition sentence from each. Linde's 8-K exhibit is a narrative press release rather than a financial statement, so the price and volume figures exist only in that prose. The company phrases the split eight different ways across those releases, and I verified the identity of underlying sales against price plus volume in every quarter it discloses. Quarterly income statement figures come from XBRL company facts, cross-checked against annual filings by summing quarters; where a quarter was reported only inside a year-to-date figure, it was derived by subtraction. Multiples were built from month-end closing prices times diluted share counts, with book value taken as equity attributable to Linde shareholders rather than including the non-controlling interest. Industry figures come from the US Bureau of Labor Statistics and the Federal Reserve via FRED. Analyst counts, price targets and estimate revisions are aggregated sell-side research as of Sep. 4, 2026. Prices are the Sep. 4, 2026 close, the last completed session before publication. The Q2 2026 release is attached to this Form 8-K on SEC EDGAR. This is research, not investment advice.