
- Lennar Corporation (NYSE: LEN) says it has finished turning itself into an asset-light homebuilder that controls 98% of its land through options, yet its Class A shares trade at $79.60, below book value of $89.75 per share. Sales incentives still ran at 12.9% of the gross sales price in the quarter ended May 31, 2026, against the 4% to 6% management calls normal, and trailing twelve-month return on equity is 7.4%. The transformation is visible in the land numbers but not yet in shareholder returns, and the next test is whether incentives keep falling without deeper cuts to base prices.
- Lennar builds affordable, move-up and active adult homes, mostly under the Lennar brand, and its financial services segment provides mortgages, title and closing services to its own buyers. Class A shares (LEN) carry one vote and Class B shares (LEN.B) ten votes. At $79.60 for Class A and $78.27 for Class B, the two classes together are worth $19.13 billion.
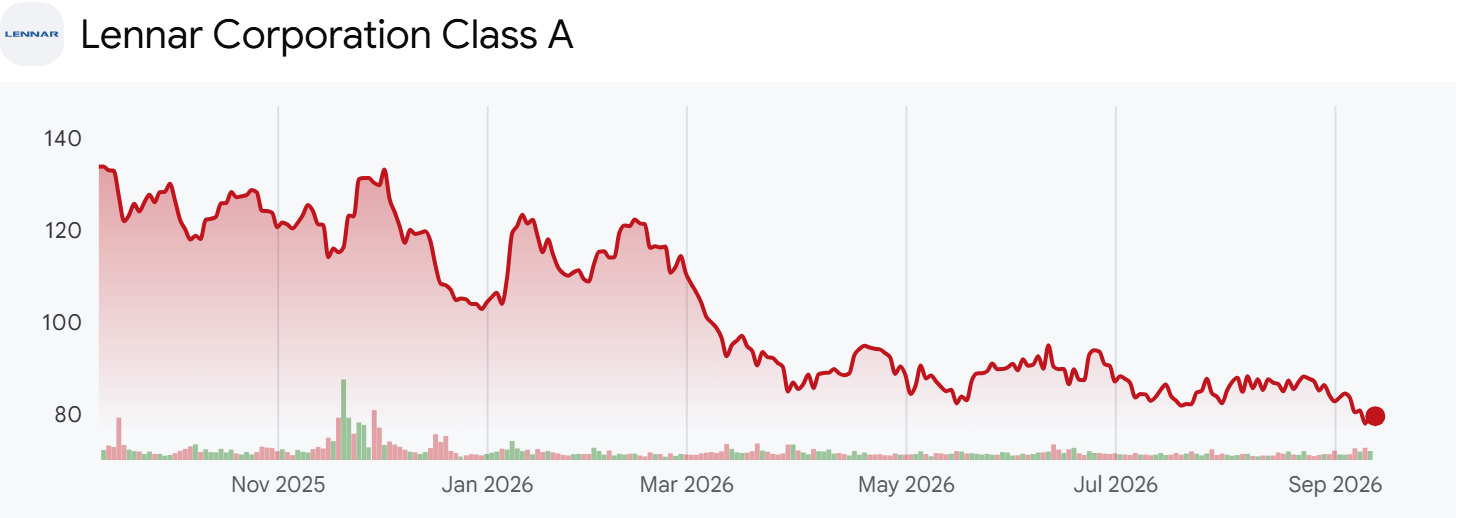
- Lennar's fiscal year ends in November, so Q2 FY2026 is the quarter ended May 31, 2026, and share counts in this article combine both classes net of treasury shares at that date. The shares are -9.1% over one month, -16.2% over three months and -43.2% over one year, and -57.3% below the ten-year closing high of $186.30 reached on September 19, 2024. Q3 FY2026 results are expected in mid-September.
What Lennar Builds and How It Got Here

- Lennar was founded in Miami in 1954. Three later events shaped the company that investors are pricing now.
- The first was the February 2018 acquisition of CalAtlantic Group. According to page 6 of the June 2026 investor presentation, annual deliveries went from 46,000 homes in 2018 to 83,000 in 2025.
- The second was the 2022 margin peak. Home sales gross margin reached 29.5% in Q2 FY2022, and as mortgage rates climbed, sales incentives went from 2.5% of the gross price in Q3 FY2022 to 10.2% in Q1 FY2023.
- The third was the 2025 Millrose Properties spin-off. In February Lennar moved about $5.6 billion of land and about $1.0 billion of cash into Millrose and distributed the shares, which reduced retained earnings by $4.84 billion. In November an exchange offer swapped the Millrose shares Lennar had kept for 8,049,594 Lennar Class A shares, and total equity went from $27.87 billion at the end of FY2024 to $21.96 billion at the end of FY2025. Co-CEO Jon Jaffe retired at the end of 2025, leaving Executive Chairman Stuart Miller as CEO and President.
| Year | What happened | Source |
| 2018 | Completed the CalAtlantic Group acquisition | 8-K Item 2.01 (Feb) |
| 2022 | Home sales gross margin peaked at 29.5% | 8-K earnings release (Jun) |
| 2025 | Spun off Millrose Properties and retired Class A shares in an exchange offer | 8-K and 10-K (Feb and Nov) |
- The five-year financials below come from 10-K XBRL data in millions of dollars. Lennar's consolidated income statement has no operating income line, so those two columns are marked not reported, and the debt ratio is total liabilities divided by equity.
| Fiscal year-end | Revenue | Operating income | Net income | Operating margin | Net margin | Debt ratio | ROE |
| Nov 2021 | 27,130.7 | Not reported | 4,430.1 | Not reported | 16.3% | 58.7% | 21.3% |
| Nov 2022 | 33,671.0 | Not reported | 4,614.1 | Not reported | 13.7% | 57.0% | 19.1% |
| Nov 2023 | 34,233.4 | Not reported | 3,938.5 | Not reported | 11.5% | 47.1% | 14.8% |
| Nov 2024 | 35,441.5 | Not reported | 3,932.5 | Not reported | 11.1% | 47.7% | 14.1% |
| Nov 2025 | 34,186.9 | Not reported | 2,078.2 | Not reported | 6.1% | 56.0% | 9.5% |
- Revenue stayed near $34 billion for four years while net income fell by more than half. The debt ratio rose again in FY2025 because the spin-off and buybacks cut equity by more than $5.9 billion while new borrowing came in.
The Five Biggest Daily Moves in Lennar Shares
| Date | Move | Close ($) | Company filings within a day | Peer average (DHI, PHM, NVR, TOL, KBH) |
| 2023-12-14 | +6.6% | 140.52 to 149.86 | Q4 FY2023 results (8-K) | +6.9% |
| 2024-03-14 | -7.6% | 160.21 to 147.98 | Q1 FY2024 results (8-K, prior evening) | -3.6% |
| 2024-07-11 | +6.9% | 141.06 to 150.85 | None | +7.4% |
| 2025-07-22 | +8.3% | 109.43 to 118.53 | None | +10.6% |
| 2026-01-09 | +8.9% | 109.55 to 119.25 | None | +6.4% |
- Only one of the five days stands apart from the group. On March 14, 2024, the session after Q1 FY2024 results, Lennar fell -7.6% against a -3.6% peer average, and that quarter's incentive rate was 10.9%, back in double digits after 7.5% in Q3 FY2023. On the other four days the five peers moved the same way by similar amounts.
Homebuilding and Financial Services Segments
- Homebuilding produced 95.9% of Q2 FY2026 revenue of $7.94 billion. The homebuilding figure below is total revenue minus the other three segments.
| Segment | Q2 revenue ($m) | Share | Q2 operating earnings ($m) | Year-earlier operating earnings ($m) |
| Homebuilding | 7,616.3 | 95.9% | 489.4 | 728.2 |
| Financial Services | 236.9 | 3.0% | 101.1 | 157.3 |
| Multifamily | 63.6 | 0.8% | 18.3 | -14.8 |
| Lennar Other | 23.1 | 0.3% | -38.9 | -52.9 |
- Homebuilding operating earnings were -32.8% from a year earlier. Deliveries rose +1.9% to 20,519 homes, but the average sales price fell from $389,000 to $371,000 (-4.6%), and Lennar attributed the lower gross margin to lower revenue per square foot and higher land costs.
- Financial Services earned $101 million against $157 million, which Lennar put down to lower profit per locked loan. Multifamily revenue fell from $230 million to $64 million, yet $28 million of equity earnings turned the segment to an operating profit, and the $39 million Lennar Other loss includes a $23 million mark-to-market loss on technology investments.
| Region | Q2 deliveries (homes) | Average sales price | Incentives |
| East | 4,761 | $369,000 | 13.6% |
| Central | 4,606 | $361,000 | 10.6% |
| South Central | 6,286 | $233,000 | 19.1% |
| West | 4,863 | $567,000 | 10.3% |
- Filing note (Q2 FY2026 10-Q, filed June 29, 2026): Lennar measures incentives per home delivered, excluding unconsolidated entities, against the sales price before incentives. The Q2 figure was $55,200 per home (a year earlier $59,500), or 12.9% (a year earlier 13.3%).
- South Central, where the average home sold for $233,000, spent almost a fifth of the price on incentives, and it also delivered the most homes of the four regions.
Sales Incentives and Home Sales Gross Margin
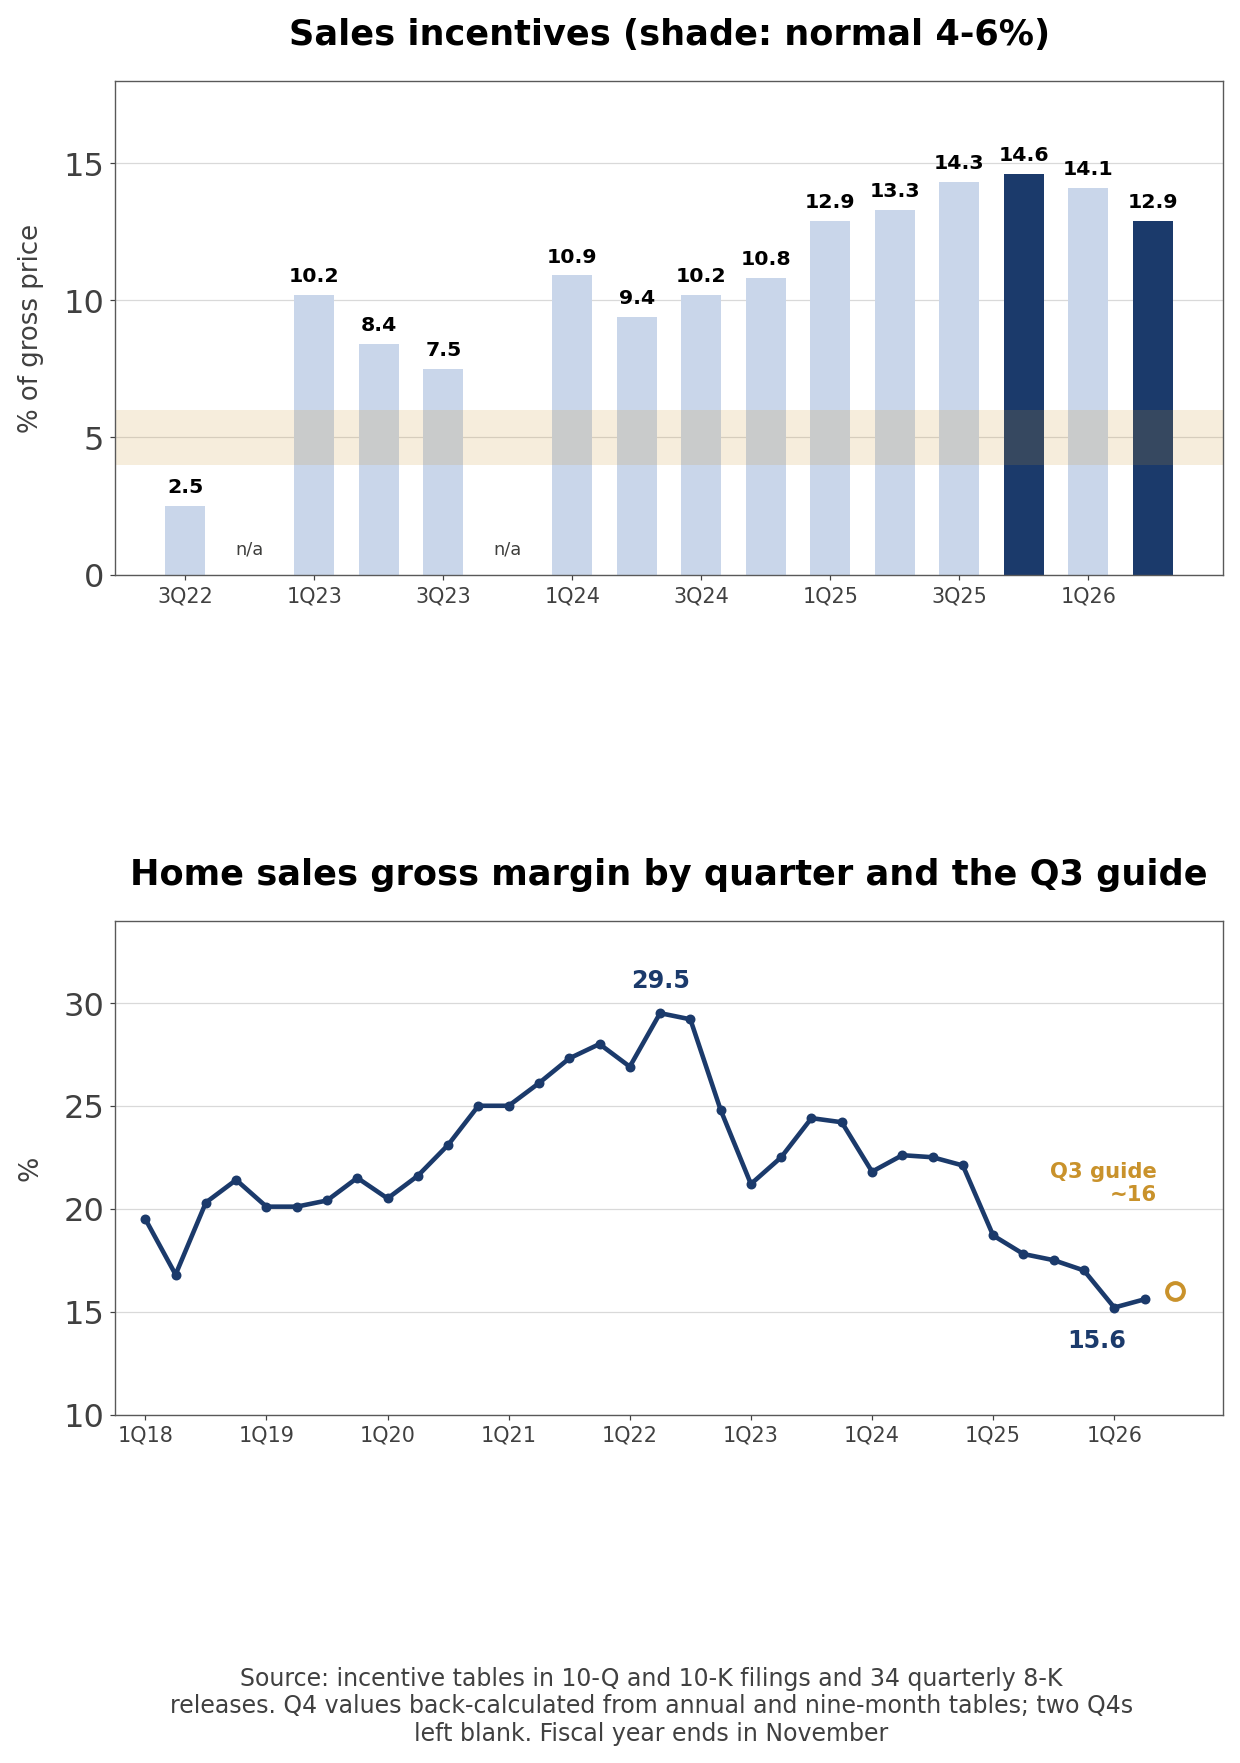
- Incentives fell for a second straight quarter, from 14.6% in Q4 FY2025 to 14.1% in Q1 FY2026 and 12.9% in Q2. The Q4 figure is my back-calculation from the annual and nine-month tables, 0.1 point above the 14.5% management gave on the call.
- Company disclosure (Q2 FY2026 8-K earnings release, June 11, 2026): Stuart Miller said the gap between current incentives of 12.9% and normalized levels of 4% to 6% "is narrowing for the first time in three years." The same release said the $371,000 average price reflected about 12.9% in incentives "along with base price adjustments necessary to sustain volume."
- Gross margin moved far less. Incentives came down 1.2 points in Q2 while home sales gross margin rose 0.4 points, from 15.2% to 15.6%, and the Q3 guide is about 16%.
- Own sensitivity calculation (10-Q incentive table and 8-K release, Q2 FY2026): $55,200 per home times 20,446 consolidated deliveries is $1.13 billion of incentives. Divided by gross sales of $8.72 billion, the basis Lennar uses, that is 12.9%; divided by net revenue it would be 14.9%. If incentives fell to 5% on the same gross sales, quarterly revenue would rise by $692 million, 1.68 times Q2 pretax income of $413 million.
- Lennar is cutting base prices at the same time, so part of any incentive reduction can come back out through lower list prices. That makes the $692 million a ceiling rather than a forecast.
Is Lennar Cheap at 0.89 Times Book Value?
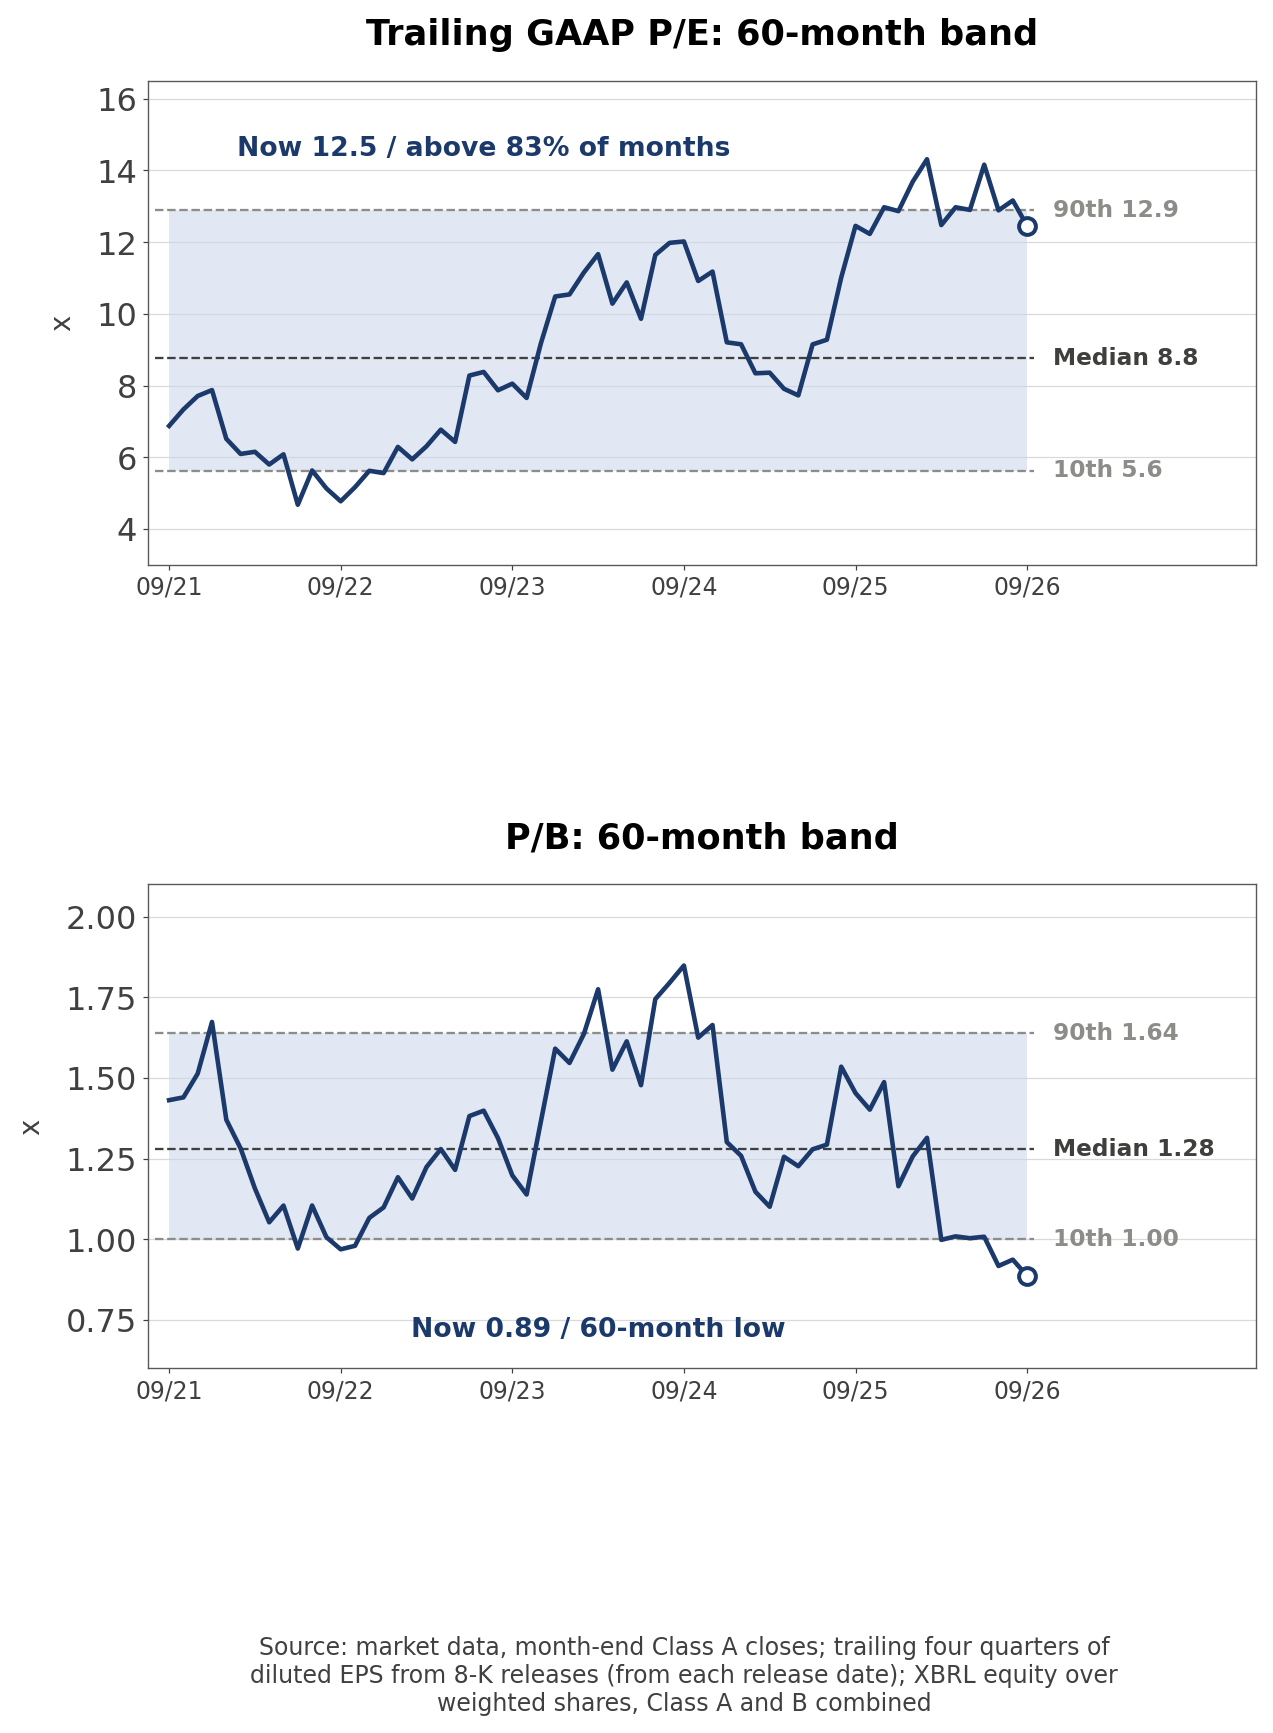
- Rebuilt month by month, the trailing P/E sits near the top of its five-year range while P/B sits at the bottom. Dividend yields in the year-end table use the per-share dividends stated in the 10-K: $1.00 in 2021, $1.50 in 2022 and 2023, and $2.00 in 2024 and 2025.
| Fiscal year-end | Year-end price | P/E | P/B | Dividend yield | FCF ($m) |
| Nov 2021 | $100.62 | 7.1x | 1.48x | 0.99% | 2,467.6 |
| Nov 2022 | $80.58 | 5.1x | 0.97x | 1.86% | 3,208.5 |
| Nov 2023 | $121.71 | 8.9x | 1.30x | 1.23% | 5,079.9 |
| Nov 2024 | $163.39 | 11.4x | 1.59x | 1.22% | 2,231.9 |
| Nov 2025 | $129.28 | 16.2x | 1.52x | 1.55% | 28.2 |
- The bands are my own calculation from 60 month-end closes, 8-K diluted EPS and 10-Q equity. For each month from September 2021 to August 2026 I used diluted EPS for the last four quarters released by that month-end and book value per share at the latest quarter-end, filling gaps in share counts with XBRL weighted diluted shares.
- The trailing GAAP P/E of 12.46x (TTM EPS of $6.39) is higher than 83% of those months, against an 8.76x median and a 4.68x low in June 2022. P/B of 0.89x is the lowest of the 60 months. The previous low was 0.92x at the end of July 2026, the median is 1.28x and the high was 1.85x in September 2024.
- One market data aggregator shows the same 12.46x and 0.89x with five-year medians of 8.95x and 1.24x. Another shows a 16.32x P/E because its denominator is FY2025 EPS of $7.98, before the last two quarters of lower earnings.
- The two multiples sit at opposite ends because of their denominators. EPS fell as margins came down while book value kept growing, so at a similar price P/E rose and P/B fell. ROE of 7.4% is half the 15% cost of equity assumed on page 7 of the investor presentation, and a price below book is consistent with that return.
What the June 2026 Investor Presentation Claims
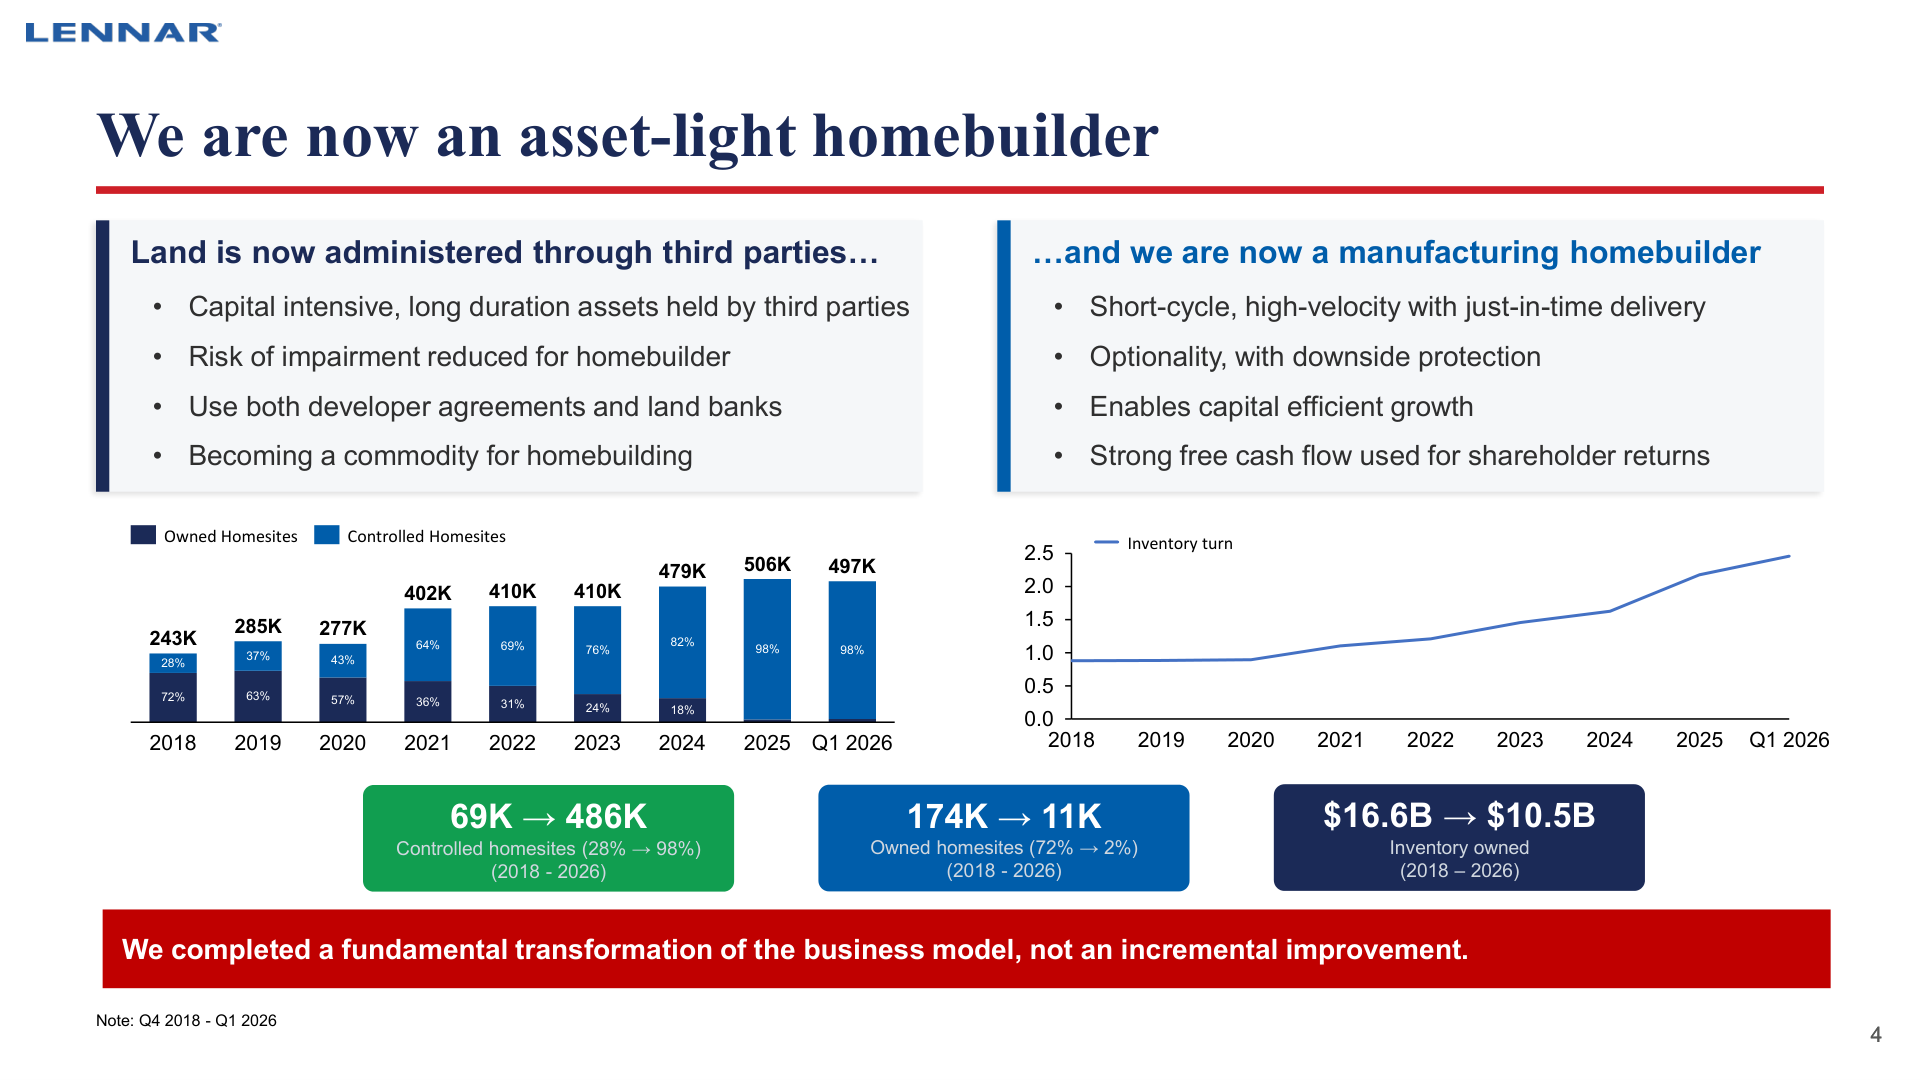
- Lennar posted a 27-page investor presentation to its IR site on June 12, and the Q2 release described it as a current view of the company's transformation, asset-light operating model, technology platform and path to margin recovery. The deck is organized around eight themes, and its concluding page says now is a good time to invest in Lennar. Each claim below is set against the 10-K, the 10-Q or the earnings release.
- Page 4 says owned homesites fell from 174,000 (72% of the total) in 2018 to 11,000 (2%) in Q1 2026, controlled homesites rose from 69,000 to 486,000, and owned inventory went from $16.6 billion to $10.5 billion. The land figures match the filings: the Q2 release says less than 5% of Lennar's land is on its balance sheet and owned homebuilding inventory declined from $11.4 billion a year ago to $10.9 billion. The last bullet on the same page does not match. It says strong free cash flow is used for shareholder returns, while the FY2025 10-K shows free cash flow of $28 million against $2.33 billion of buybacks and dividends.
- Page 6 says deliveries grew about 80% from 2018 to 2025 while owned inventory plus deposits held near $17.3 billion, and that inventory would be about twice as large without the asset-light shift. It puts the capital land banks would spend to buy the controlled homesites once developed at an estimated $18.5 billion as of February 28, 2026. That $18.5 billion has not disappeared; third parties hold it. Page 7 calculates a weighted average cost of capital of about 13% for the old structure, with 75% equity and 25% debt, and about 11% for the asset-light structure, with 40% equity, 8% debt and 52% land bank capital. Both calculations assume a 15% cost of equity and a 10% cost for land bank capital, and the same page lists lower land banking costs as an opportunity ahead. The Q2 release cited higher land costs as one reason gross margin fell.
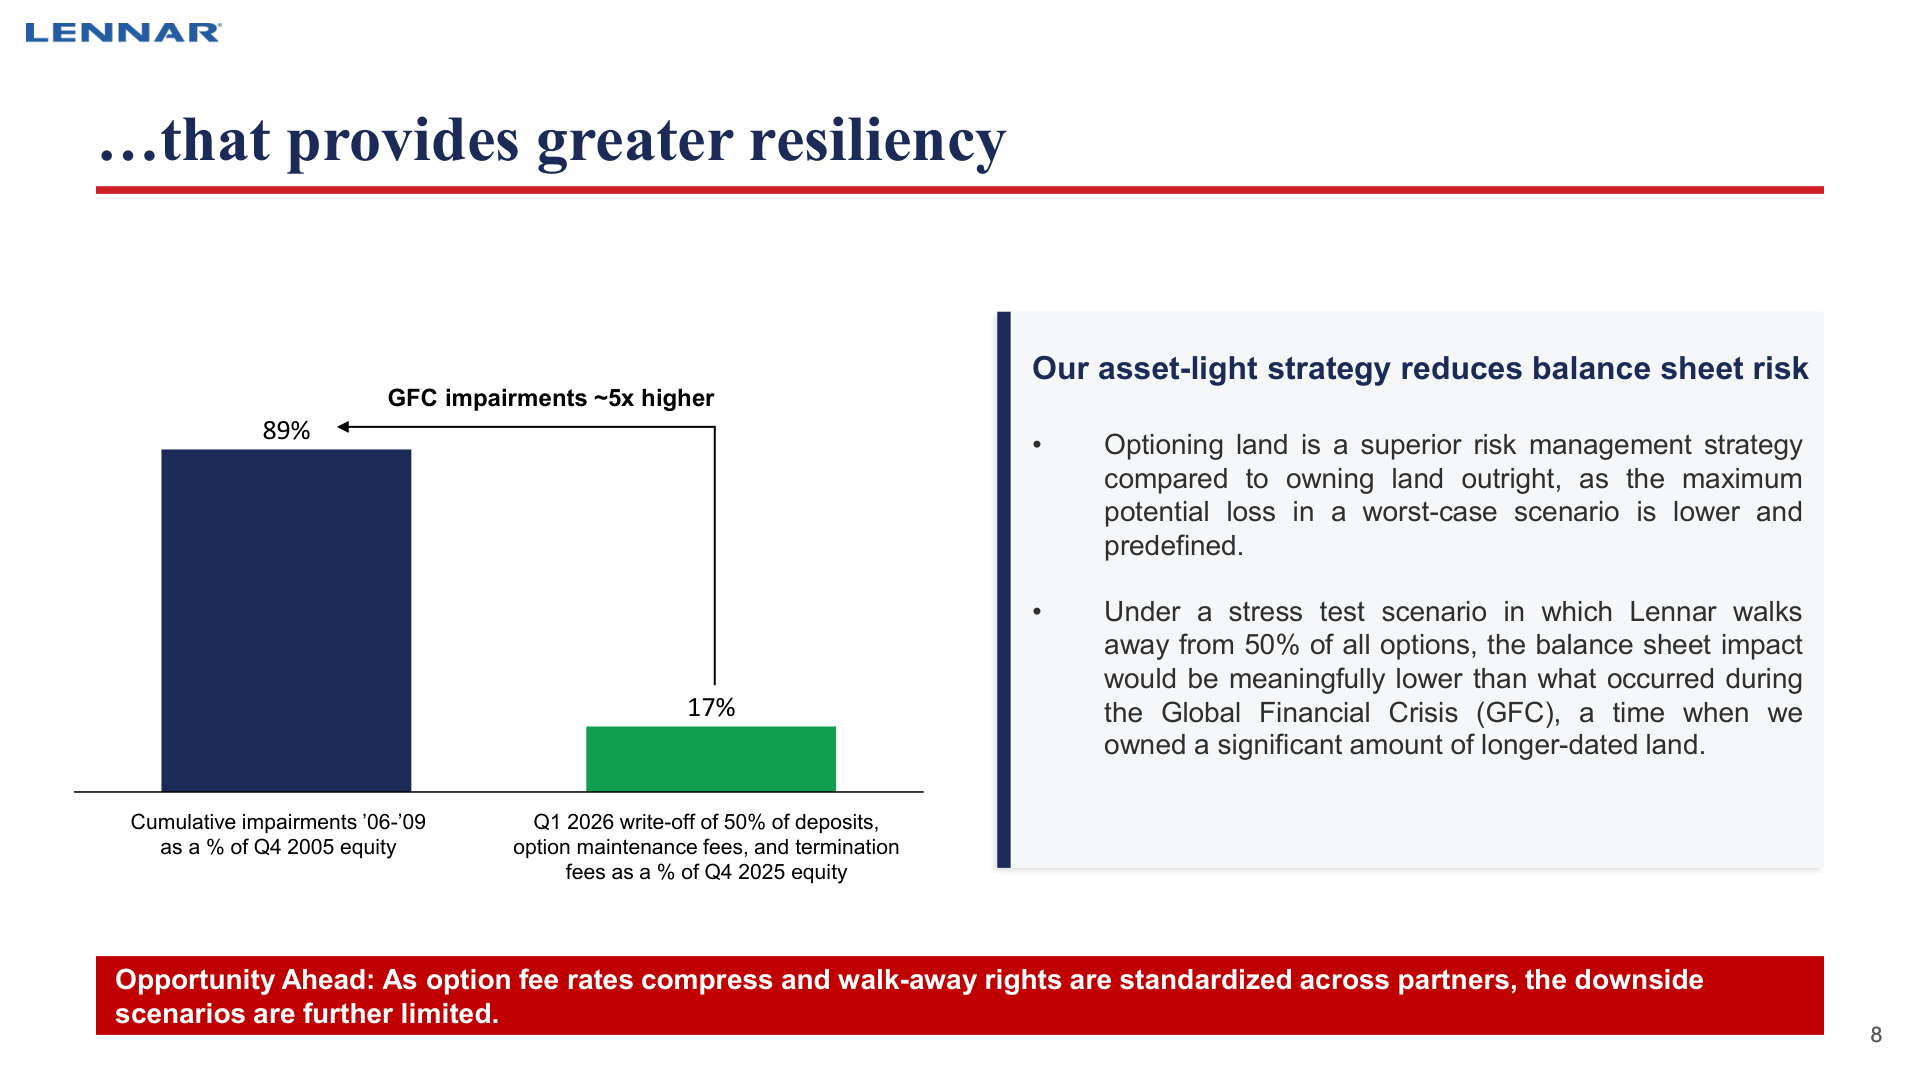
- Page 8 runs a stress test in which Lennar walks away from half of its options. Writing off 50% of deposits, option maintenance fees and termination fees would equal 17% of Q4 2025 equity, compared with cumulative impairments in 2006 to 2009 equal to 89% of Q4 2005 equity. Seventeen percent of FY2025 year-end equity of $21.96 billion is about $3.73 billion, and half of the $7.1 billion of deposits and pre-acquisition costs management cited on the Q2 call is $3.55 billion, so the slide's scale checks out. Write-offs outside the stress case are already rising: the FY2025 cash flow statement shows $246 million, 1.96 times the FY2023 figure. Page 8 also says the downside narrows further as option fee rates compress and walk-away rights are standardized across partners.
- Page 9 says Lennar has repurchased $9.6 billion of stock and retired $6.9 billion of senior notes since the start of 2018, using $16.5 billion of freed-up cash. In the 10-K, FY2023 to FY2025 buybacks add up to $5.25 billion, more than half of that total. In FY2025 alone, Lennar drew a $1.71 billion term loan and issued $700 million of notes while redeeming $500 million, so new borrowing that year was 4.8 times the debt it repaid.
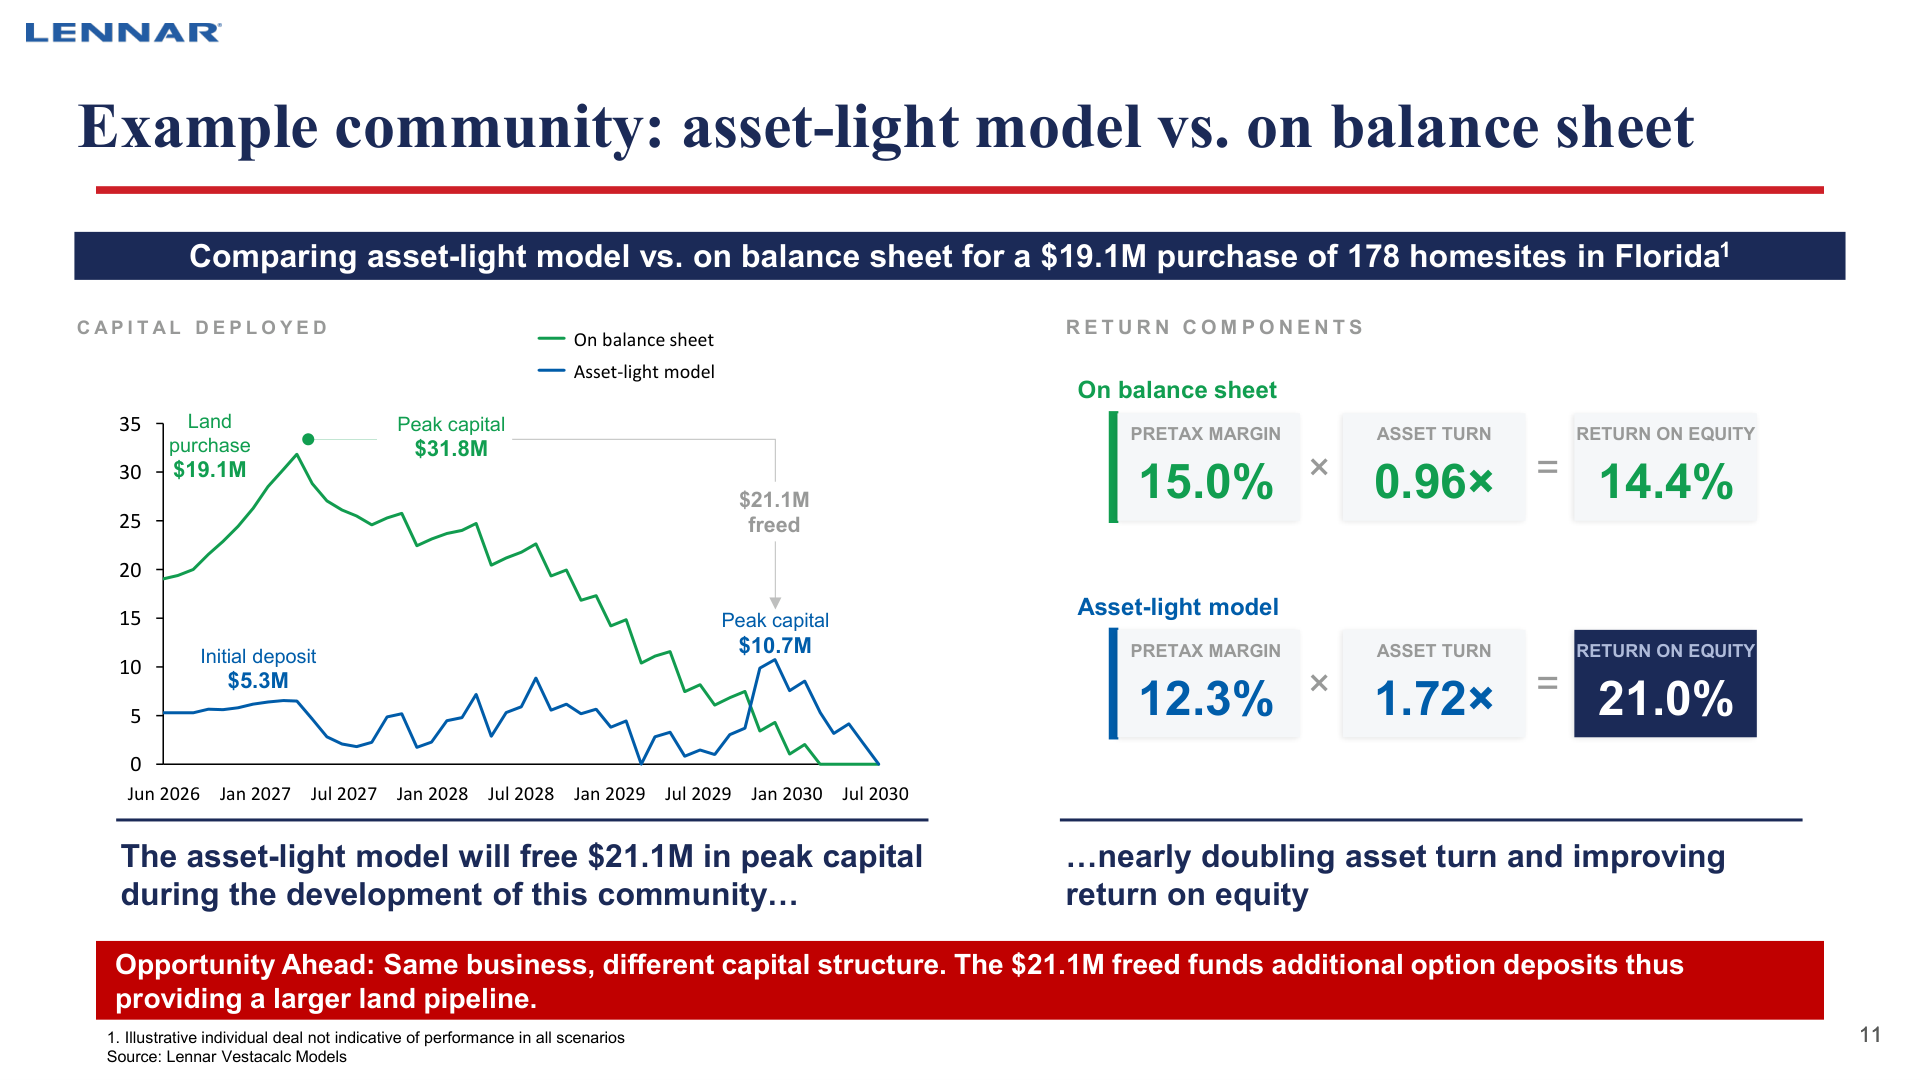
- Page 11 compares one example community, 178 Florida homesites bought for $19.1 million. Owning the land gives a 15.0% pretax margin and a 0.96x asset turn, for a 14.4% return on equity; the asset-light model gives a 12.3% pretax margin and a 1.72x turn, for 21.0%. Peak capital falls from $31.8 million to $10.7 million, freeing $21.1 million. Even in the example the asset-light pretax margin is 2.7 points lower, and the higher ROE comes from faster turns. Lennar's actual Q2 pretax margin was 5.2% of revenue, well below both examples, and trailing ROE of 7.4% is below even the 14.4% owned-land case. The slide's footnote calls it an illustrative deal not indicative of performance in all scenarios.
- Page 18 says year-over-year cycle time fell from 137 to 122 days and inventory turns improved from 1.7 to 2.5 between Q1 2025 and Q1 2026. The Q2 release reports a record low cycle time of 121 days and construction costs down 2% sequentially and 13% over the last several years, so this page lines up with the filing. The same page shows the homesite portion of revenue being redeployed into land deposits, which is the $1.55 billion increase in option deposits in the FY2025 cash flow statement.
- Pages 20 and 22 describe automated land evaluation, plan selection, bidding, AI-assisted sales and real-time financial reporting, and argue that "AI will not build America's homes. Homebuilders will." In the filings, technology shows up as mark-to-market results on investments in the Lennar Other segment: a first-half FY2026 loss of $8 million against $92 million a year earlier, but a $23 million loss in Q2 alone.
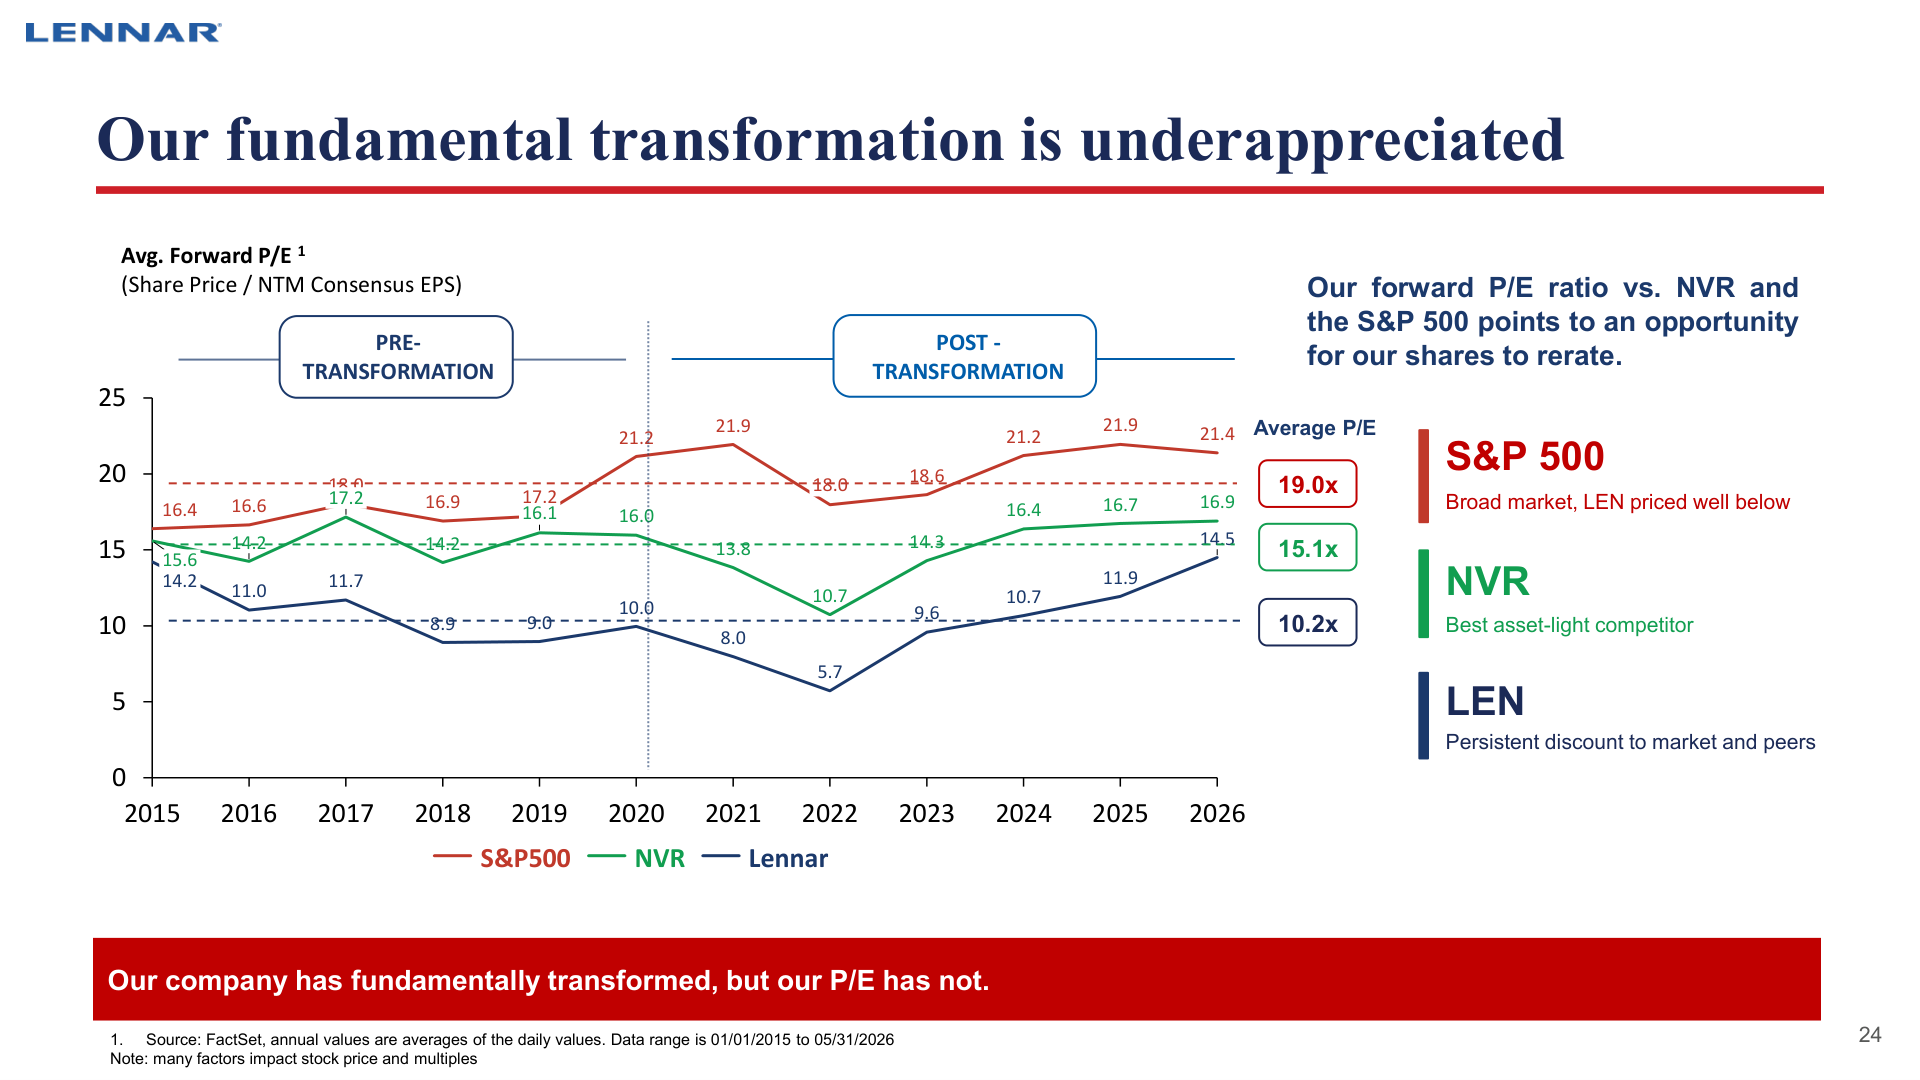
- Page 24 shows average forward P/E from 2015 to May 2026 of 10.2x for Lennar, 15.1x for NVR and 19.0x for the S&P 500, under the line "Our company has fundamentally transformed, but our P/E has not." The same chart shows Lennar's 2026 forward P/E at 14.5x, the highest of the twelve years on the page. The stock is -43.2% over one year, so a rising forward P/E means earnings estimates fell faster than the price, and the average FY2027 EPS estimate went from $7.39 ninety days ago to $6.41 (-13.3%).
- Page 26 lists four pillars and says under growth that Lennar has been and will continue to grow at above-average rates. The Q2 release, published the day before the deck, moderated the FY2026 delivery target to about 82,000 to 83,000 homes, level with or below the 83,000 shown for 2025 on page 13.
- The land percentages, cycle time, construction costs and the size of the stress case hold up against the filings. The free cash flow bullet, the unchanged P/E line and the growth pillar do not, and the 21.0% ROE describes a single example community rather than the company.
Operating Cash Flow and Shareholder Returns
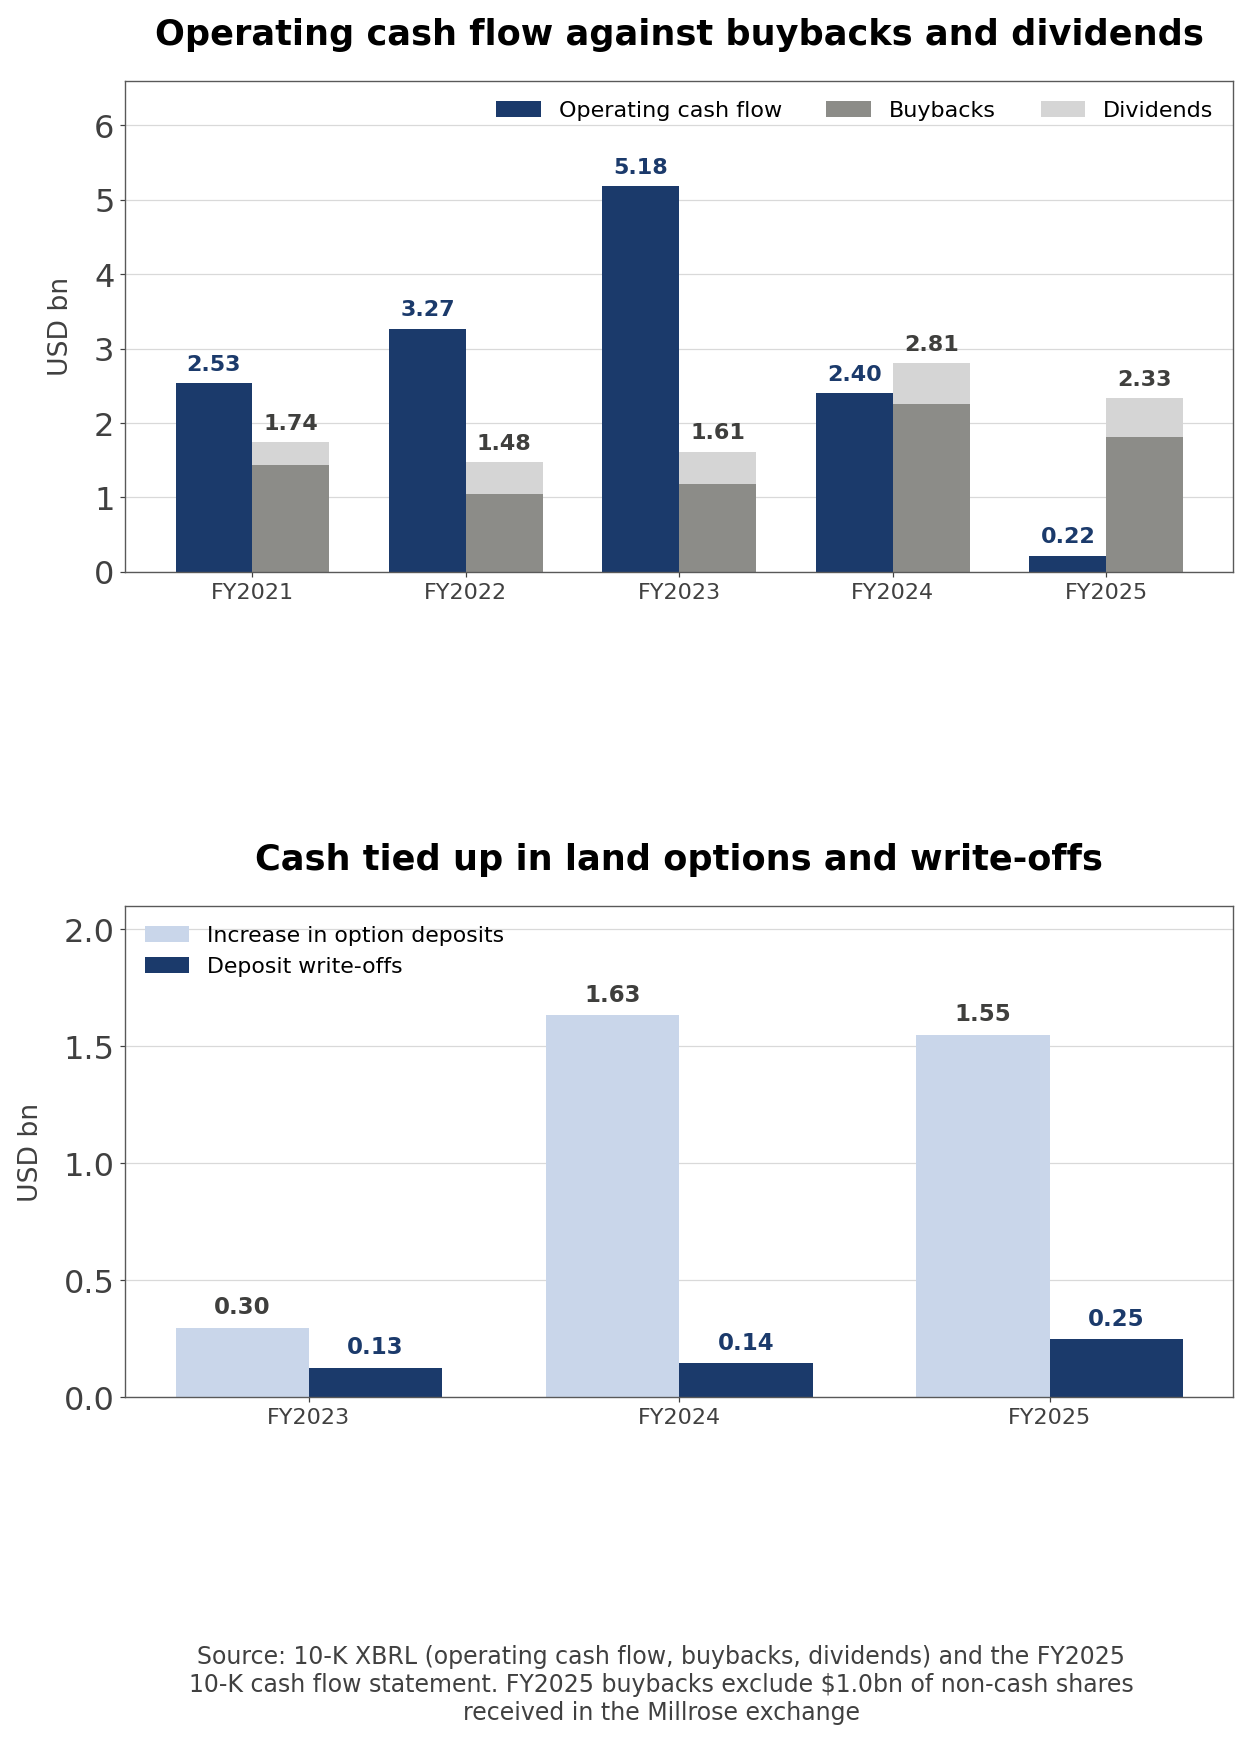
- Filing note (FY2025 10-K cash flow statement, filed January 28, 2026): Operating cash flow was $217 million, while buybacks of $1.81 billion and dividends of $521 million added up to $2.33 billion, 10.7 times operating cash flow. The largest drag on operating cash flow was the increase in option deposits and pre-acquisition costs. Financing brought in a $1.71 billion term loan and $700 million of notes and repaid $500 million of notes, $416 million of cash went out with Millrose, and cash fell $1.16 billion over the year.
| Fiscal year | Operating cash flow ($m) | Buybacks ($m) | Dividends ($m) | Increase in option deposits ($m) | Deposit write-offs ($m) |
| FY2023 | 5,179.7 | 1,182.7 | 430.6 | 295.8 | 125.3 |
| FY2024 | 2,403.4 | 2,256.5 | 548.8 | 1,631.8 | 143.3 |
| FY2025 | 216.8 | 1,808.4 | 521.0 | 1,549.7 | 246.2 |
- Under the asset-light model, land purchases leave the balance sheet but deposits still use cash. The deposit increases of FY2024 and FY2025 total $3.18 billion, more than the $2.62 billion of operating cash flow over the same two years. In FY2025, new borrowing of $2.41 billion exceeded shareholder returns, and the Class A shares retired in the Millrose exchange were recorded separately as $1.0 billion of non-cash treasury stock.
- Buybacks continued in FY2026. Lennar repurchased 5 million shares for $447 million in Q2 at an average of $89.35, which is 0.996 times May 31 book value per share of $89.75. At $79.60 the stock is 10.9% below that average price.
Land Option Deposits and Walk-Away Costs
- On the Q2 earnings call (June 12) management gave 11,000 owned and 484,000 controlled homesites and $7.1 billion of deposits and pre-acquisition costs. Together that is 495,000 homesites, about 6.0 years at the 82,500-home midpoint of FY2026 delivery guidance, and the deposits equal 32.8% of May 31 equity of $21.62 billion.
- Those deposits become expenses if Lennar walks away. The Q2 release lists the forfeiture of deposits and pre-acquisition costs on options Lennar decides not to exercise as a risk, next to the risk of failing to execute its land light strategy, and FY2025 also carried a $156 million loss on the Millrose exchange. With six years of controlled land and a lower delivery target, which options to give up if sales slow affects both margins and equity.
| Number | Value | Why it matters |
| Sales incentives, Q2 FY2026 (normal 4% to 6%) | 12.9% | Down for the first time in three years and still more than twice the normal range |
| Home sales gross margin (Q2 FY2022: 29.5%) | 15.6% | Half the peak; Lennar cited sales prices and land costs |
| FY2025 buybacks and dividends / operating cash flow | 10.7x | New borrowing of $2.41 billion and lower cash funded the returns |
| Option deposits and pre-acquisition costs / equity | 32.8% | Becomes an expense on walk-away; write-offs rose 1.96 times in two years |
| P/B (60-month low; P/E above 83% of months) | 0.89x | Cheapest on book value while earnings-based multiples sit high |
Six Bull Case Arguments Checked Against the Filings
- The case for buying Lennar starts with the asset-light transformation and ends with a multiple that should rerate. I split the presentation's argument and common investor reasoning into six links and checked each against the 10-K, 10-Q and earnings release.
| # | The argument | Evidence | Verdict |
| 1 | Lennar is now an asset-light homebuilder | Owned homesites 2%; owned inventory $16.6 billion to $10.5 billion; release says under 5% of land on balance sheet | Holds |
| 2 | Asset-light lifts return on equity | Example community 21.0%; trailing ROE 7.4%; FY2021 ROE 21.3% | Overstated |
| 3 | Incentives have turned so margins are recovering | Incentives 14.6%, 14.1%, 12.9%; gross margin guide about 16% | Conditional |
| 4 | Strong free cash flow funds buybacks | FY2025 free cash flow $28 million; returns $2.33 billion; new borrowing $2.41 billion | Wrong |
| 5 | Options cap the downside in a housing slump | 50% walk-away equals 17% of equity against 89% in the financial crisis; write-offs up 1.96 times | Partly holds |
| 6 | The P/E has not caught up with the transformation | 2026 forward P/E of 14.5x is the deck's twelve-year high; FY2027 EPS estimate -13.3% in 90 days | Overstated |
- Holds means the filings confirm it, Conditional means it depends on a number not yet reported, Overstated means the direction is right but the size is not, and Wrong means the filings say the opposite. One link holds, one partly holds, one is conditional, two are overstated and one is wrong. If incentives keep falling but base prices fall with them, link 1 stays true while gross margin stalls near 16%, and links 2 and 6 rest on that lower margin.
Q3 Guidance and Analyst Estimate Revisions
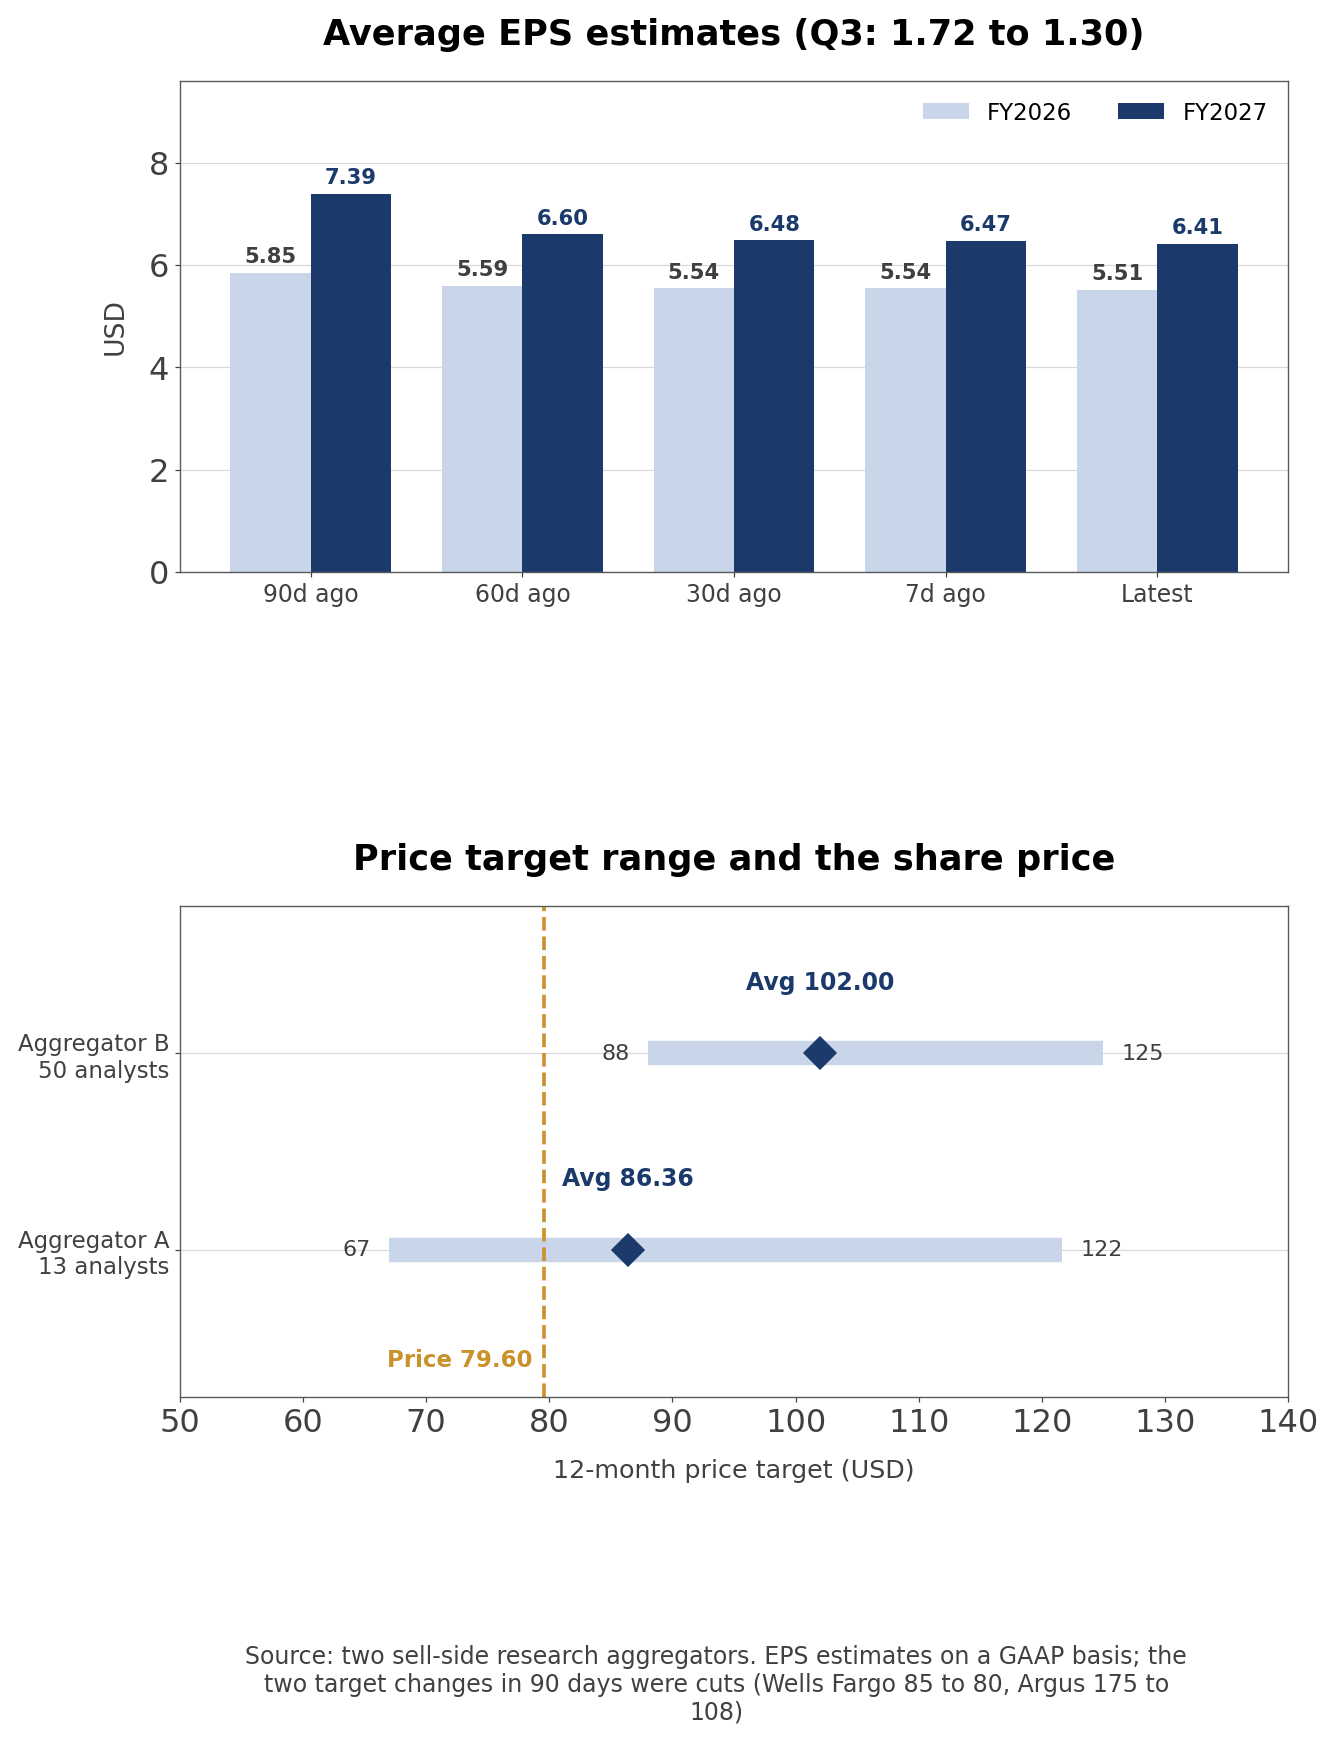
- For Q3 FY2026 Lennar guided to 21,000 to 22,000 new orders, 20,500 to 21,500 deliveries, an average sales price of $375,000 to $380,000, home sales gross margin of about 16%, SG&A of 8.8% to 9.0% of home sales and Financial Services operating earnings of $95 million to $100 million. It credited higher volume, moderating incentives and cost discipline for the margin improvement.
- The price guide is above Q2's $371,000. If incentives shrink without further base price cuts the average price should rise, so the two guides are consistent, and whether that price shows up in Q3 is the first thing to check. On the Q2 earnings call management put Q3 EPS at $1.20 to $1.40.
- One sell-side research aggregator shows 50 analysts at 23 Buy, 18 Hold and 9 Sell, with a 12-month target of $102 on average in a range of $88 to $125. A second shows 13 analysts averaging $86.36, between $67 and $121.67. Lennar beat the average EPS estimate in two of the last eight quarters.
| Date | Broker | Rating | Target ($) |
| 2026-09-11 | Wells Fargo | Reiterated | 85 to 80 |
| 2026-08-06 | Truist | Reiterated | 80 |
| 2026-07-09 | Argus Research | Reiterated | 175 to 108 |
- Both brokers that changed targets in the past 90 days cut them. Estimates kept falling after the Q2 release: the Q3 EPS average went from $1.72 ninety days ago to $1.30 (-24.4%), FY2026 from $5.85 to $5.51 and FY2027 from $7.39 to $6.41, and eleven analysts cut Q3 estimates in the last 30 days. The $1.30 average sits at the midpoint of management's range.
Berkshire Hathaway and the Miller Family Vote
| Holder | Reported stake | Filed | Form |
| BlackRock | 7.6% | 2026-01-21 | 13G/A |
| Vanguard Capital Management | 6.94% | 2026-04-30 | 13G |
| Warren E. Buffett (Berkshire Hathaway) | 6.2% | 2026-08-14 | 13G |
| Greenhaven Associates | 5.08% | 2026-05-04 | 13G |
| Eagle Capital Management | 5.03% | 2026-05-15 | 13G |
- Berkshire Hathaway's 13F information tables show Class A holdings rising from 10,099,642 shares at March 31 to 13,111,741 at June 30 (+29.8%), and Class B from 237,703 to 298,117 shares. The June Class A position equals 6.23% of Class A shares outstanding at May 31, which matches the 6.2% in the 13G, and at the prices in this article both classes are worth about $1.07 billion. The 13F does not show purchase prices.
- Control sits with the Miller family. The FY2025 10-K says Stuart Miller directly owned or controlled through family-owned entities Class A and Class B shares representing approximately 42% of the voting power. Class B carries ten votes per share, so Class B shares, 12.6% of all shares, hold 59.1% of the votes.
- That matters for how the April 8 annual meeting vote reads. A shareholder proposal for one vote per share failed with 36.8% of votes cast in favor, per the 8-K filed April 13. If the Miller family voted its full 42% against, about two thirds of the remaining votes cast supported the proposal.
How Lennar Compares With D.R. Horton and NVR
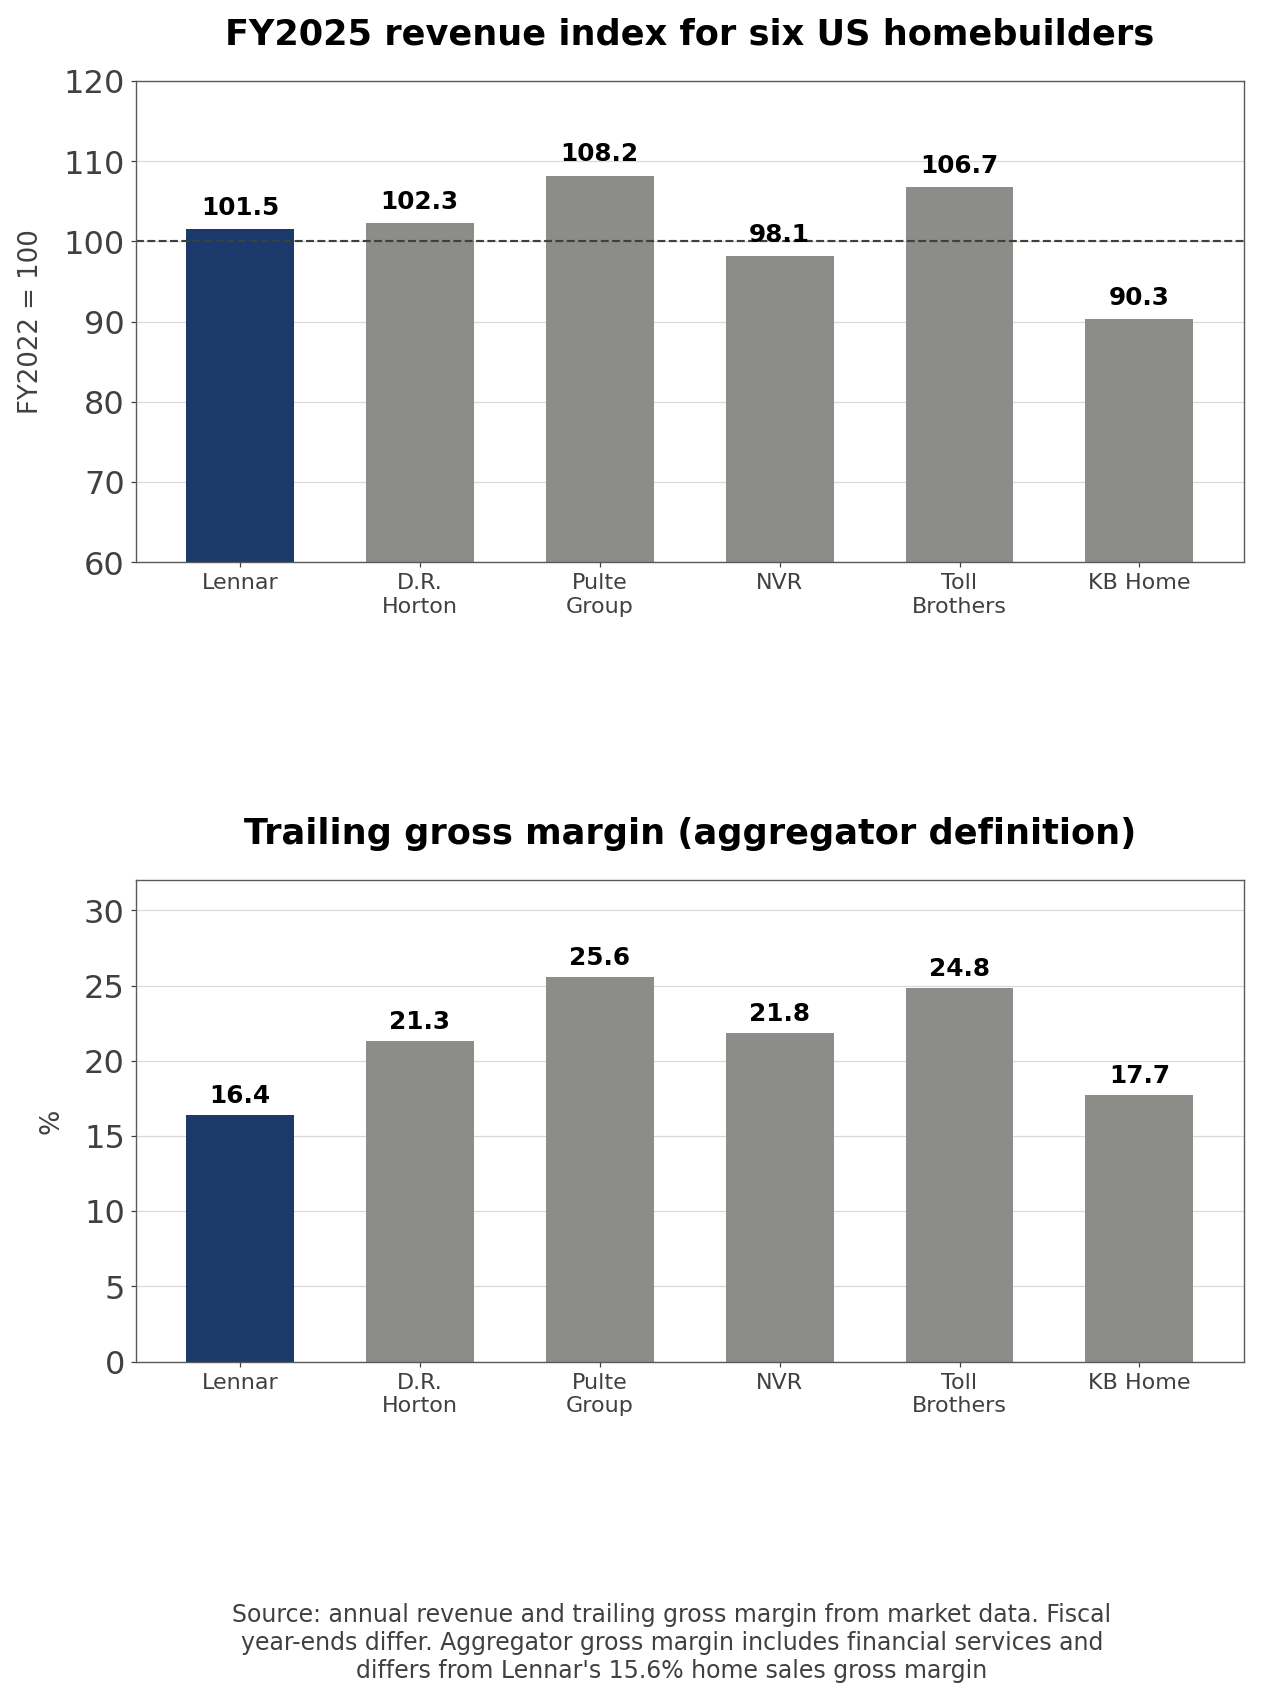
- The peers are D.R. Horton, PulteGroup, NVR, Toll Brothers and KB Home, the large U.S.-listed homebuilders. Homebuilding is cyclical, with margins that swing between peak and trough, so I compared cycle margins, capital efficiency and multiple history.
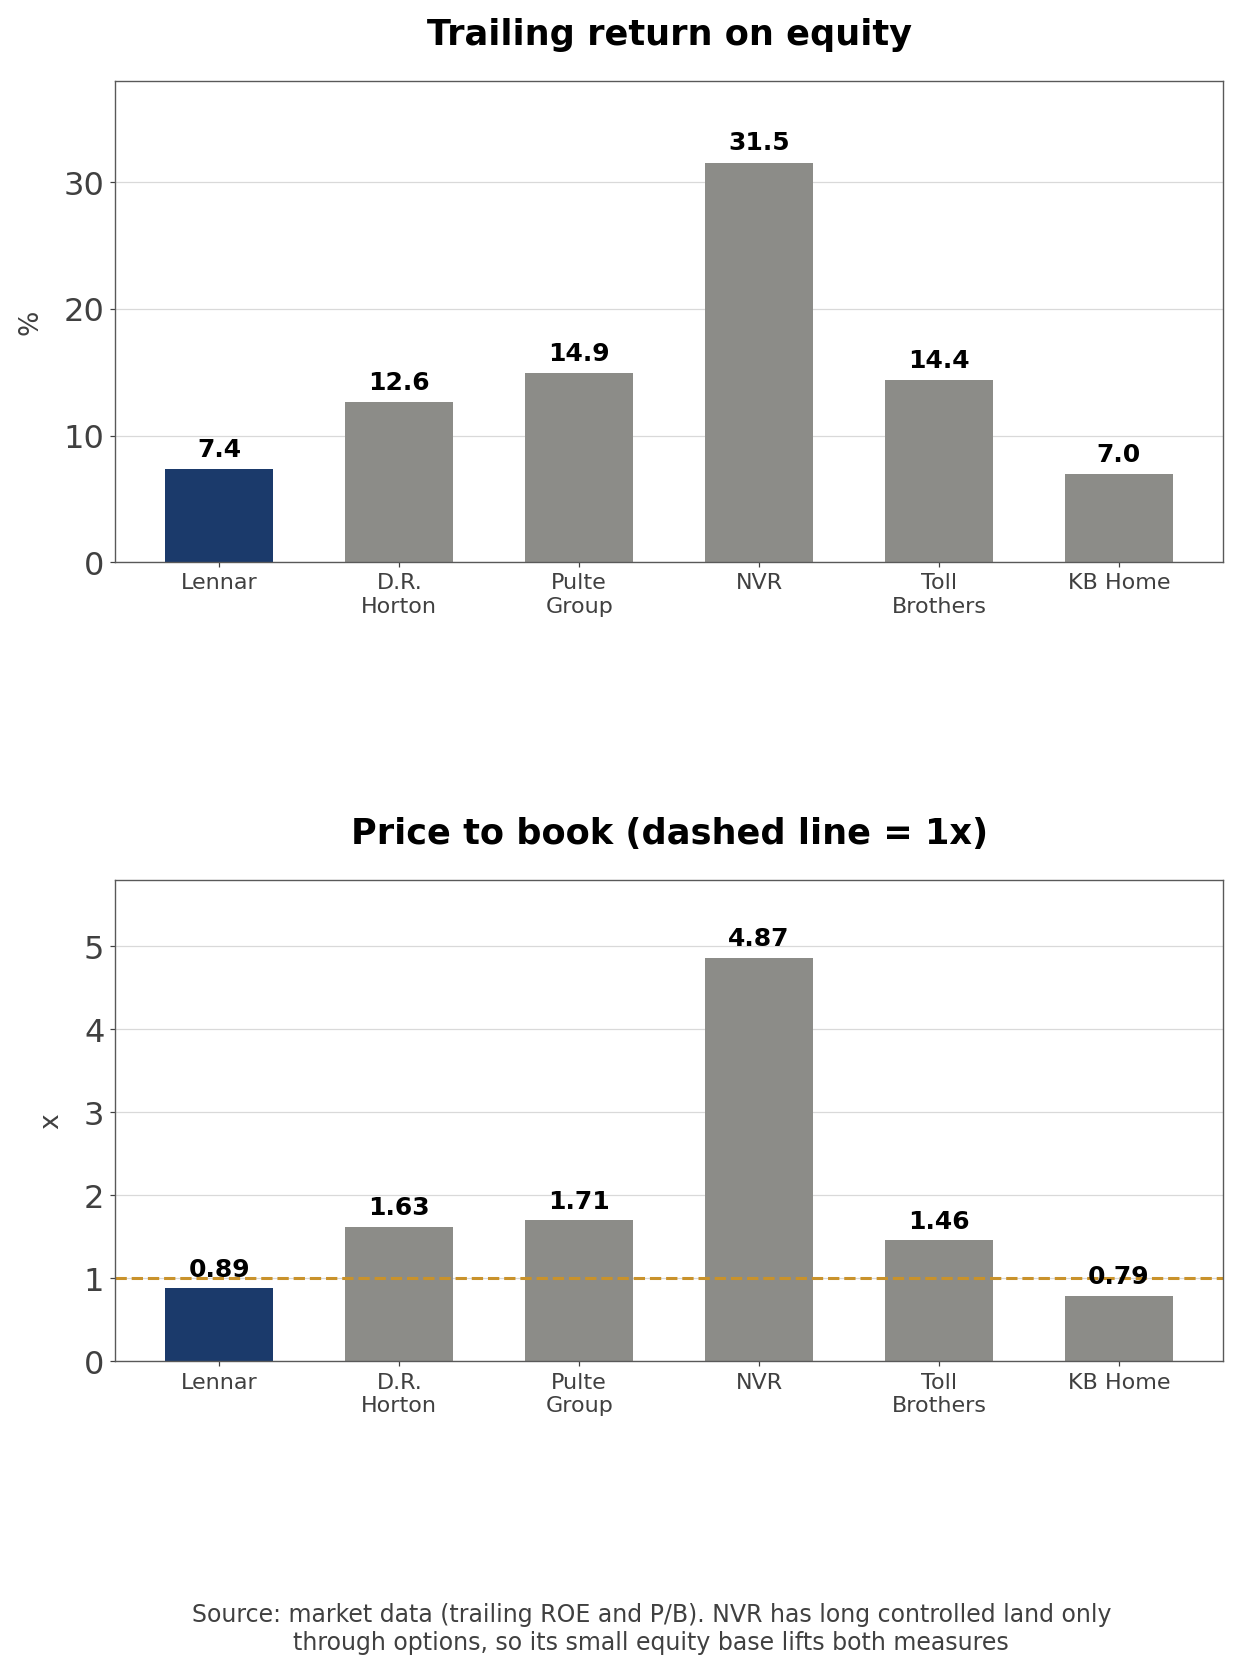
| Company | Market cap ($bn) | Trailing gross margin | Trailing operating margin | Trailing ROE | P/B | Forward P/E |
| Lennar | 19.1 | 16.4% | 5.3% | 7.4% | 0.89x | 12.4x |
| D.R. Horton | 38.6 | 21.3% | 13.0% | 12.6% | 1.63x | 11.7x |
| PulteGroup | 22.5 | 25.6% | 15.7% | 14.9% | 1.71x | 10.5x |
| NVR | 16.4 | 21.8% | 13.9% | 31.5% | 4.87x | 15.0x |
| Toll Brothers | 12.4 | 24.8% | 14.6% | 14.4% | 1.46x | 9.6x |
| KB Home | 3.0 | 17.7% | 3.6% | 7.0% | 0.79x | 11.3x |
- This table uses aggregator definitions. Lennar's 16.4% trailing gross margin includes more than homebuilding and differs from the 15.6% Q2 home sales gross margin in the release, and the 12.4x forward P/E uses next-twelve-month estimates, while the 12.46x in the band section is trailing GAAP.
- D.R. Horton is about twice Lennar's market cap, and Lennar is smaller than PulteGroup and larger than NVR. Lennar has the lowest gross margin of the six, 9.2 points below PulteGroup, and its forward P/E is higher than Toll Brothers, PulteGroup and D.R. Horton, so it screens cheap on book value and expensive on earnings.
| Company | Net debt / equity | FY2025 revenue index (FY2022 = 100) | Dividend yield |
| Lennar | 18.1% | 101.5 | 2.51% |
| D.R. Horton | 21.4% | 102.3 | 1.31% |
| PulteGroup | 7.4% | 108.2 | 0.88% |
| NVR | -2.8% | 98.1 | None |
| Toll Brothers | 21.7% | 106.7 | 0.77% |
| KB Home | 47.4% | 90.3 | 2.09% |
- Net debt to equity subtracts cash from debt at each company's latest quarter-end; for Lennar that is $6.01 billion of debt less $2.09 billion of cash at May 31. NVR, which page 24 of Lennar's deck calls the best asset-light competitor, gets its 31.5% ROE from a 21.8% gross margin and a small $3.39 billion equity base. Lennar cut owned land to 2% but its gross margin is 5.4 points below NVR's, and its ROE is level with KB Home. Its 2.51% dividend yield is the highest of the six because the $2.00 dividend stayed flat while the stock fell -43.2% over one year.
- The number of competitors and market share cannot be verified. Lennar does not report a national share, and its deliveries and the Census Bureau's new home sales count different things, so one cannot be divided by the other.
Mortgage Rates and New Home Inventory
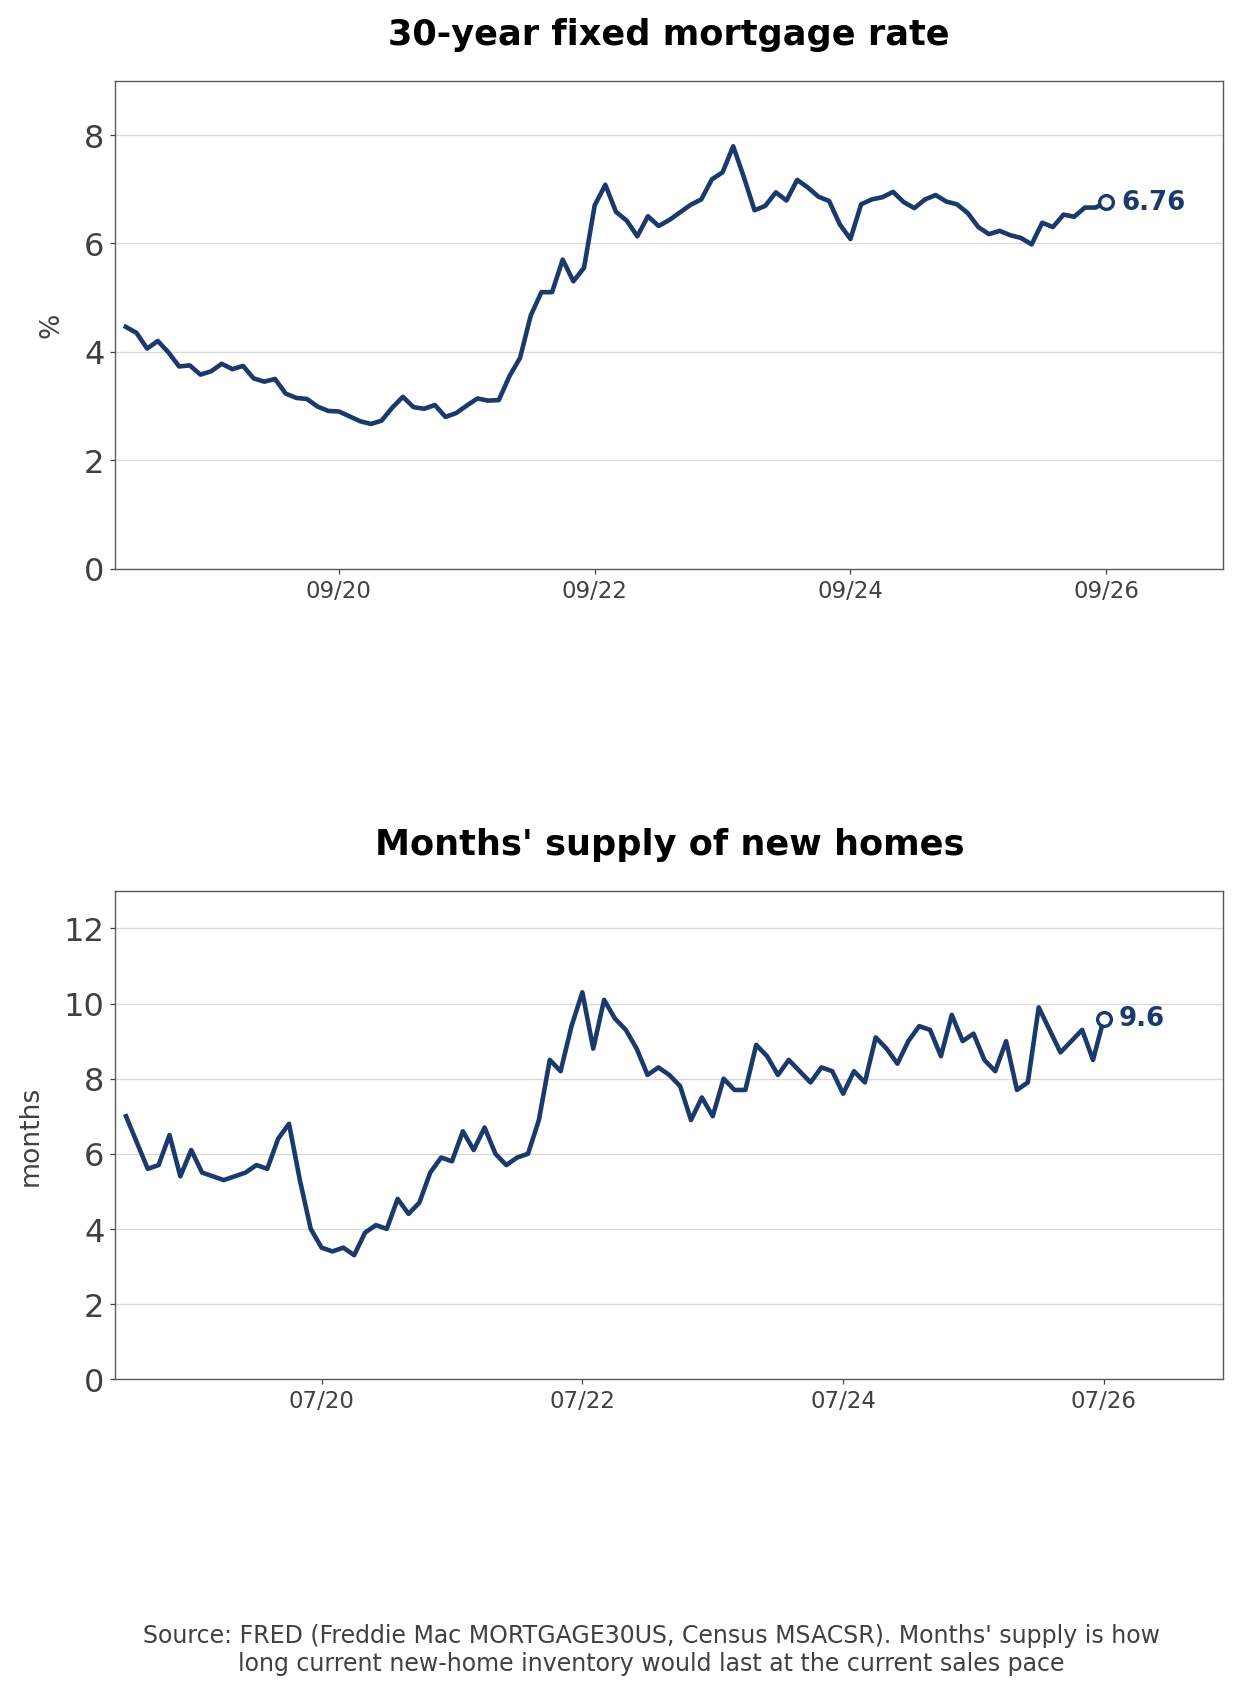
- The 30-year fixed mortgage rate is 6.76% (FRED MORTGAGE30US, September), against 6.30% a year earlier and 3.01% five years earlier. New home supply is 9.6 months at the current sales pace (MSACSR, July), up from 9.2 months a year earlier and 5.8 months five years earlier. July new home sales ran at a 607,000 annual rate, housing starts at 1,239,000 and permits at 1,433,000.
- New home sales were -6.3% from a year earlier and -4.0% a year on average over five years. Starts were -13.5% while permits were +2.4%, and over five years starts fell -5.0% a year from a 1.6 million pace. Builders cut starts while inventory stacked up, the same backdrop in which Lennar is using incentives to hold volume.
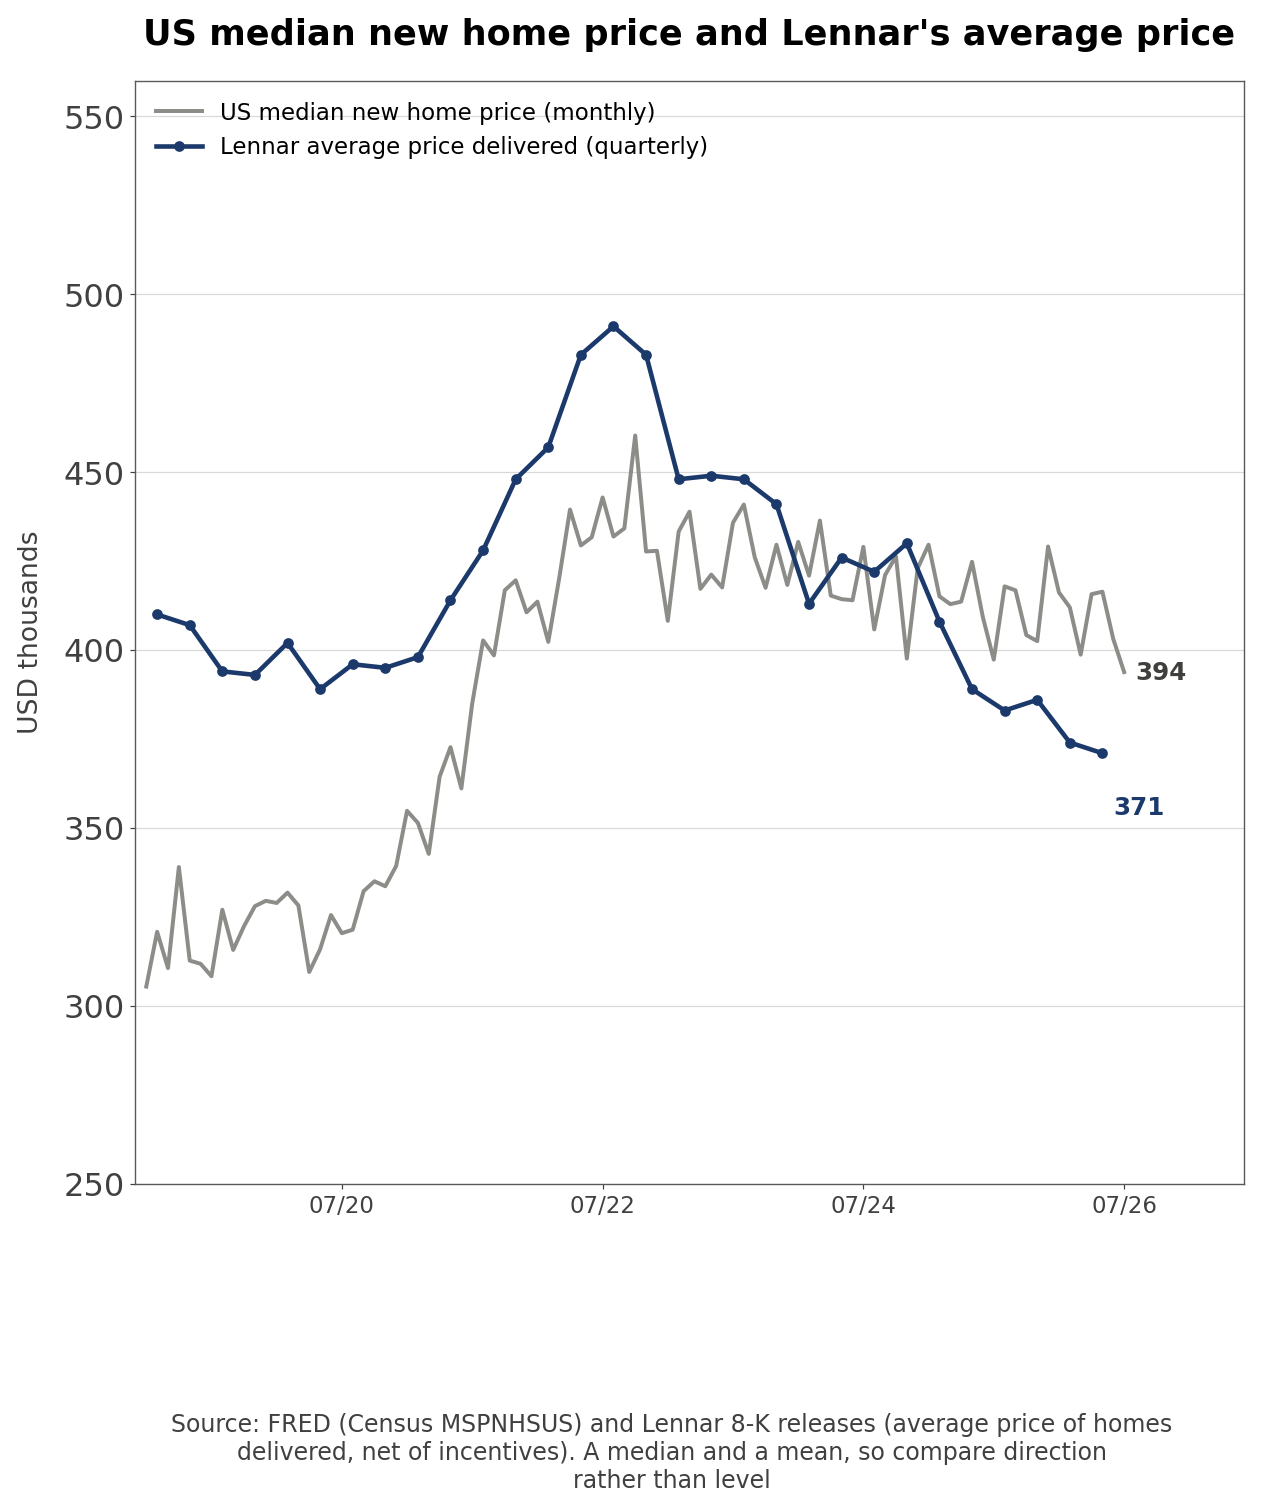
- The US median new home price was $393,800 in July, -0.9% from a year earlier, while Lennar's Q2 average sales price was -4.6%. One is a median and the other an average net of incentives, so the comparison is about direction rather than level.
- Outside view (National Association of Home Builders and National Association of Realtors estimates, cited on page 13 of Lennar's presentation): The US needs about 1.5 million homes a year and has a cumulative shortage of about 5 million, which would take more than ten years to close.
- July starts ran more than 260,000 below that annual need. The 5 million shortage is an industry estimate that official statistics do not confirm, and with 9.6 months of new home supply on the market the shortfall may be less about the number of homes than about homes buyers can afford at current rates.
Conditions That Would Move LEN Stock
| Scenario | Condition | Indicator to check | When · Source |
| Upside | Incentives below 12% | Incentives as a share of gross price | Q3 results in mid-September · 10-Q |
| Downside | Incentives back at 13% or higher | Incentives as a share of gross price | Q3 results · 10-Q |
| Upside | Home sales gross margin at the 16% guide or better | Gross margin on home sales | Q3 results · 8-K release |
| Downside | Average sales price below $370,000 | Average price of homes delivered | Q3 results · 8-K release |
| Downside | Deposit write-offs rise and buybacks rely on borrowing | Cash flow statement | FY2026 10-K in late January |
| Upside | 30-year mortgage rate below 6% | FRED MORTGAGE30US | Weekly |
- If incentives fall but the average sales price drops below $370,000, the incentive has moved into the base price, and the 16% gross margin guide would have to come from volume and construction costs alone.
Incentive Cuts Versus Base Price Cuts
- Lennar said its Q2 average price reflected base price adjustments along with 12.9% in incentives, but it did not say how much base prices came down. The 10-Q table shows only incentives per home, so if base prices fell in the same quarter that incentives did, the table improves without Lennar collecting more per home.
- Own calculation (8-K average price and 10-Q incentives per home): Adding incentives per home to the average sales price gives a pre-incentive price of $448,500 a year earlier and $426,200 in Q2, a drop of $22,300. Incentives per home fell $4,300 over the same period.
- The pre-incentive price fell more than five times as much as incentives did. Recomputing that price by region in the Q3 10-Q would show whether incentive cuts are turning into base price cuts, so shouldn't the first check be the pre-incentive price in South Central, where incentives are 19.1%?
Related Analysis
- lululemon (LULU) Stock Analysis: Margin Decline and Tariffs: compare how a consumer brand and a homebuilder each explained a gross margin decline to pricing and costs.
- Shopify (SHOP) Stock Analysis: Net Income vs. Equity Gains: see another company whose reported earnings swing with mark-to-market results on its investments, as Lennar's do in the Lennar Other segment.
Methodology and Sources
- Prices are $79.60 for Class A and $78.27 for Class B. Share counts are 210,506,003 Class A and 30,389,139 Class B shares, issued shares less treasury shares at May 31, 2026, and book value per share divides equity of $21.62 billion by the two combined.
- Company figures come from the Q2 FY2026 Form 10-Q, the FY2025 Form 10-K, the 8-K with 2026 annual meeting results, Lennar's 8-K earnings releases and the June 2026 investor presentation. Macro data come from FRED series MORTGAGE30US, MSACSR, HSN1F, HOUST, PERMIT and MSPNHSUS, and peer and consensus figures from market data and sell-side research aggregators.
- I parsed all 34 quarterly earnings releases from Q1 FY2018 to Q2 FY2026 in code and reconciled them to annual totals for eight fiscal years. Incentive rates come from the sales incentive tables in 16 quarterly and annual filings, with Q4 derived from the annual and nine-month tables; Q4 FY2022 and Q4 FY2023 are blank because no nine-month table was available. The bands use 60 month-end closes from September 2021 to August 2026 plus the latest price. Call statements quote management; call figures are used only where the release and 10-Q do not report them.
#Lennar #LEN #LENStock #LENStockAnalysis #Homebuilders #HousingMarket #MortgageRates #USStocks #StockAnalysis #EquityResearch #GlobalStockBrief
'US Stock Analysis' 카테고리의 다른 글
| AutoZone (AZO) Stock: 36.3% ROIC and a 19.6x P/E (0) | 2026.09.17 |
|---|---|
| NVIDIA (NVDA) Stock Analysis: Guarantees and Cash Flow (0) | 2026.09.17 |
| Plug Power (PLUG) Stock Analysis: GAAP vs Operating Loss (0) | 2026.09.15 |
| Trip.com (TCOM) Stock Analysis: Antitrust Fine and Guidance (0) | 2026.09.14 |
| Bitmine (BMNR) Stock Analysis: mNAV Below 1 and Dilution (0) | 2026.09.14 |


