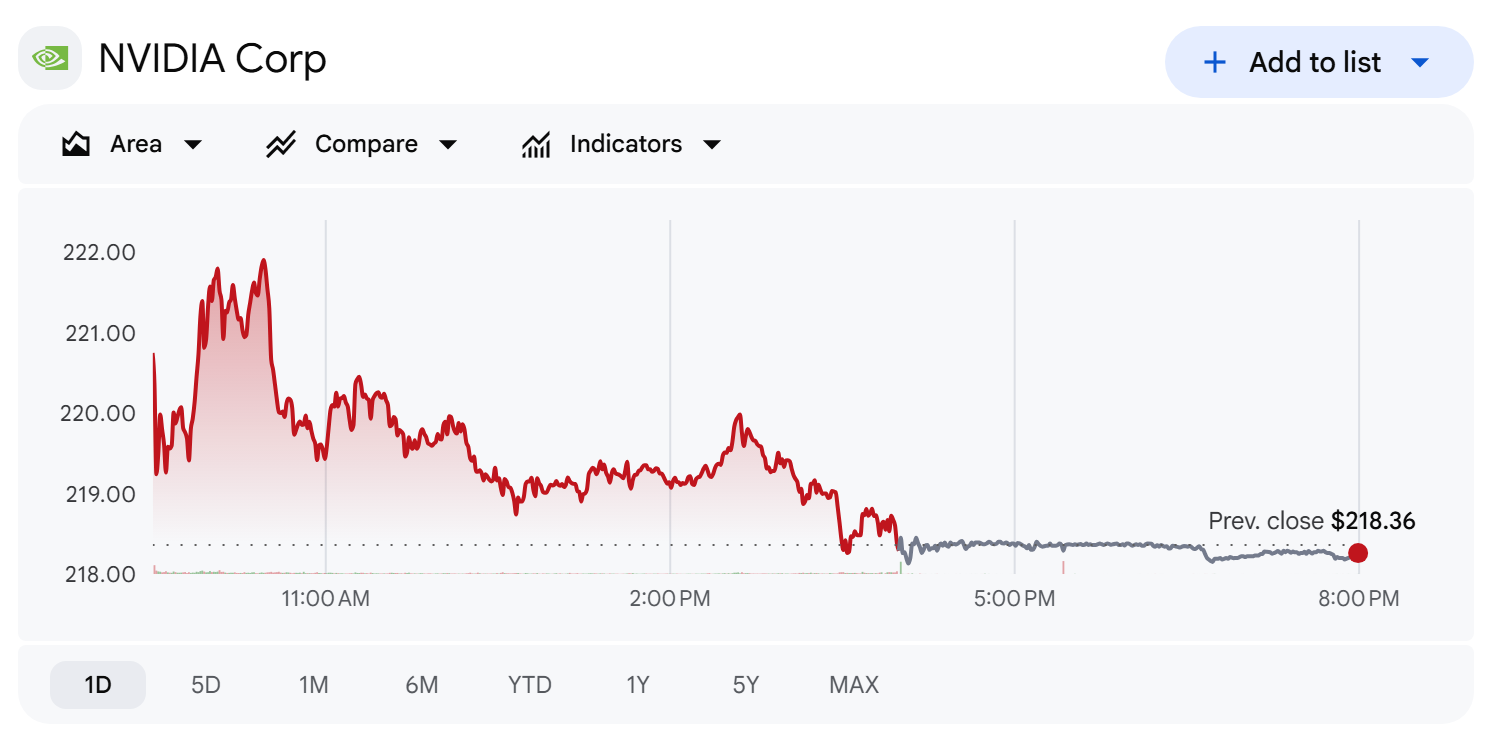
- NVIDIA Corporation (NASDAQ: NVDA) sells the accelerated computing systems that most AI data centers run on, and data centers produced 92.5% of its $96.22 billion of revenue in the July quarter. At $218.29 a share the company is worth about $5.26 trillion. This NVDA stock analysis covers the gap between record profit and falling operating cash flow, the supply commitments and lease guarantees behind it, the claims in the Q2 investor presentation, guidance history, P/E and P/B bands, analyst price targets, peers, and the conditions that would move the shares.
- Here is the puzzle. Revenue rose $14.6 billion from the April quarter (+17.9%) and GAAP net income reached $59.69 billion, yet operating cash flow fell from $50.34 billion to $24.08 billion (-52.2%). In the same quarter days sales outstanding went from 45 to 60, supply and capacity commitments went from $119 billion to $279 billion, and in August NVIDIA agreed to guarantee up to $105 billion of data center leases for an OpenAI affiliate in Ohio.
- Two limits up front. Per-share figures use the 24.1 billion shares on the cover of the Q2 10-Q and equity at the July 26 quarter-end. Quarterly operating cash flow for Q2 and Q3 of each fiscal year is derived by subtracting the prior year-to-date figure, and I checked every derived quarter against annual totals. GAAP net income includes gains on equity securities, and the SB Energy guarantees only take effect as leases commence, so none of that exposure sits on the balance sheet yet.
- The shares are +0.3% over one month, +8.9% over three months and +23.1% over one year. The latest results are for the second quarter of fiscal 2027 (May to July 2026), released August 26. NVIDIA's fiscal year ends in late January.
What Does NVIDIA (NVDA) Do Now?
- NVIDIA started as a graphics chip company for PC gaming. It is now a data center computing company. Revenue grew from $26.91 billion in fiscal 2022 to $215.94 billion in fiscal 2026, eight times in four years, and the operating margin rose from 37.3% to 60.4%.
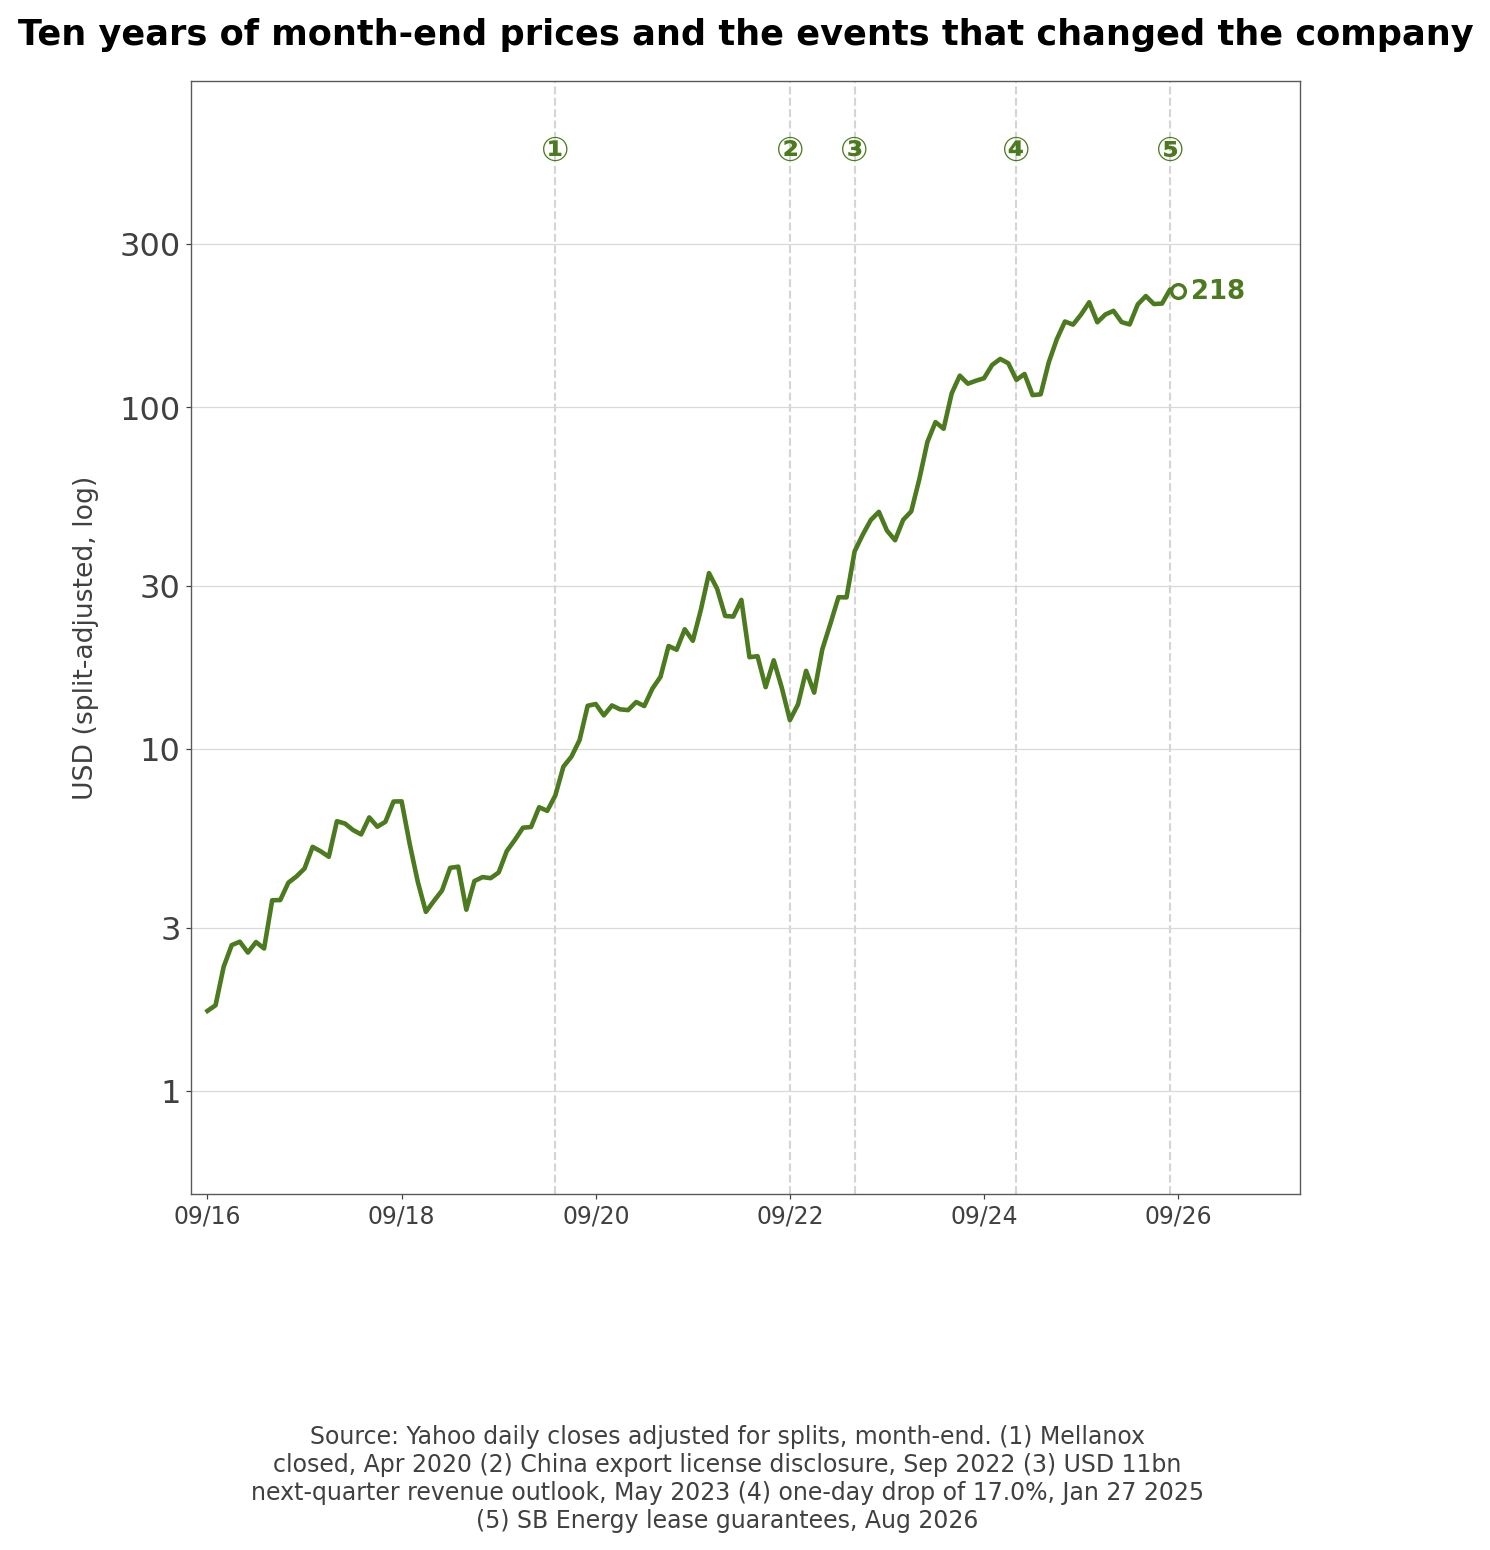
- The first turn came with Mellanox. NVIDIA agreed to buy the networking company in March 2019 and closed in April 2020 (8-K Item 2.01), which brought InfiniBand, the fabric that ties thousands of servers together. The Arm deal announced in September 2020 was terminated in February 2022 (8-K Item 1.02).
- 2022 was the hard year. An 8-K on August 31 disclosed that the U.S. government would require licenses for exports to China, fiscal 2023 revenue was flat at $26.97 billion, and operating income fell to $4.22 billion (-57.9%).
- The inflection was May 24, 2023. NVIDIA guided the next quarter to $11 billion, 1.53 times the $7.19 billion it had just reported. Actual revenue came in at $13.51 billion, +22.8% above the outlook, still the largest beat of the 14 quarters I tracked.
- Since then the big events have come from export rules, funding and customer support. The H20 license requirement in April 2025 led to a $4.5 billion inventory and purchase-obligation charge in the first quarter of fiscal 2026. NVIDIA issued $25.0 billion of senior unsecured notes in June 2026, signed the SB Energy guarantees in August and agreed in September to buy Hugging Face for about $11.9 billion plus an equity retention program of up to about $1.0 billion.
| Year | What happened | Source |
| 2019 | Agreed to buy Mellanox and entered data center networking | 8-K 1.01 (Mar) |
| 2020 | Closed Mellanox and announced the Arm deal | 8-K 2.01 (Apr), 1.01 (Sep) |
| 2021 | Reincorporated in Delaware and split its stock 4-for-1 | 8-K 7.01, 8.01 (Jun) |
| 2022 | Arm deal terminated; China export licenses required | 8-K 1.02 (Feb), 8.01 (Aug) |
| 2023 | An $11 billion quarterly outlook kicked off the AI revenue surge | 8-K 2.02 (May) |
| 2024 | 10-for-1 split; fiscal 2025 revenue reached $130.5 billion | 10-Q, 10-K |
| 2025 | A one-day drop of 17.0% and the H20 license requirement | 10-Q (Apr license rule) |
| 2026 | $25 billion bond sale and up to $105 billion of lease guarantees | 424B5 (Jun), 8-K 1.01 (Aug) |
- The five-year financials below come straight from 10-K XBRL data, in millions of dollars. Debt ratio is total liabilities divided by equity.
| Fiscal year-end | Revenue | Operating income | Net income | Operating margin | Net margin | Debt ratio | ROE |
| Jan 2022 | 26,914.0 | 10,041.0 | 9,752.0 | 37.3% | 36.2% | 66.0% | 36.6% |
| Jan 2023 | 26,974.0 | 4,224.0 | 4,368.0 | 15.7% | 16.2% | 86.3% | 19.8% |
| Jan 2024 | 60,922.0 | 32,972.0 | 29,760.0 | 54.1% | 48.8% | 52.9% | 69.2% |
| Jan 2025 | 130,497.0 | 81,453.0 | 72,880.0 | 62.4% | 55.8% | 40.7% | 91.9% |
| Jan 2026 | 215,938.0 | 130,387.0 | 120,067.0 | 60.4% | 55.6% | 31.5% | 76.3% |
The Five Biggest Daily Moves in NVDA Stock
- Over the past three years, about 750 trading days, NVDA moved more than 5% in a single session on 50 days. I lined up the five largest moves against the Nasdaq Composite and the Philadelphia Semiconductor Index on the same day. Only one of them followed a company filing.
| Date | Move | Close (split-adjusted, $) | Company filings within a day | What the market did |
| 2024-02-22 | +16.4% | 67.47 to 78.54 | Q4 FY2024 results and 10-K on Feb 21 | Nasdaq +3.0% · SOX +5.0% |
| 2024-04-19 | -10.0% | 84.67 to 76.20 | None found | Nasdaq -2.0% · SOX -4.1% |
| 2024-07-31 | +12.8% | 103.73 to 117.02 | None found | Nasdaq +2.6% · SOX +7.0% |
| 2025-01-27 | -17.0% | 142.62 to 118.42 | None found | Nasdaq -3.1% · SOX -9.1% |
| 2025-04-09 | +18.7% | 96.30 to 114.33 | None found | Nasdaq +12.2% · SOX +18.7% |
- On each of the four days without a filing, the chip index moved more than 4% in the same direction. On January 27, 2025 the Nasdaq fell 3.1% and NVDA fell five times as far. On April 9, 2025 NVDA and the chip index both rose exactly 18.7%.
- Outside view (major financial press, January and April 2025): January 27 was widely reported as the day concern spread about AI chip demand after China's DeepSeek released a reasoning model trained with less compute, and April 9 as the day the U.S. announced a 90-day pause on reciprocal tariffs.
- NVIDIA filed no 8-K on either day. The stock traded as the lead name in a sector call, and when that call swung hard, NVDA swung harder.
NVIDIA Data Center Revenue by Customer Type
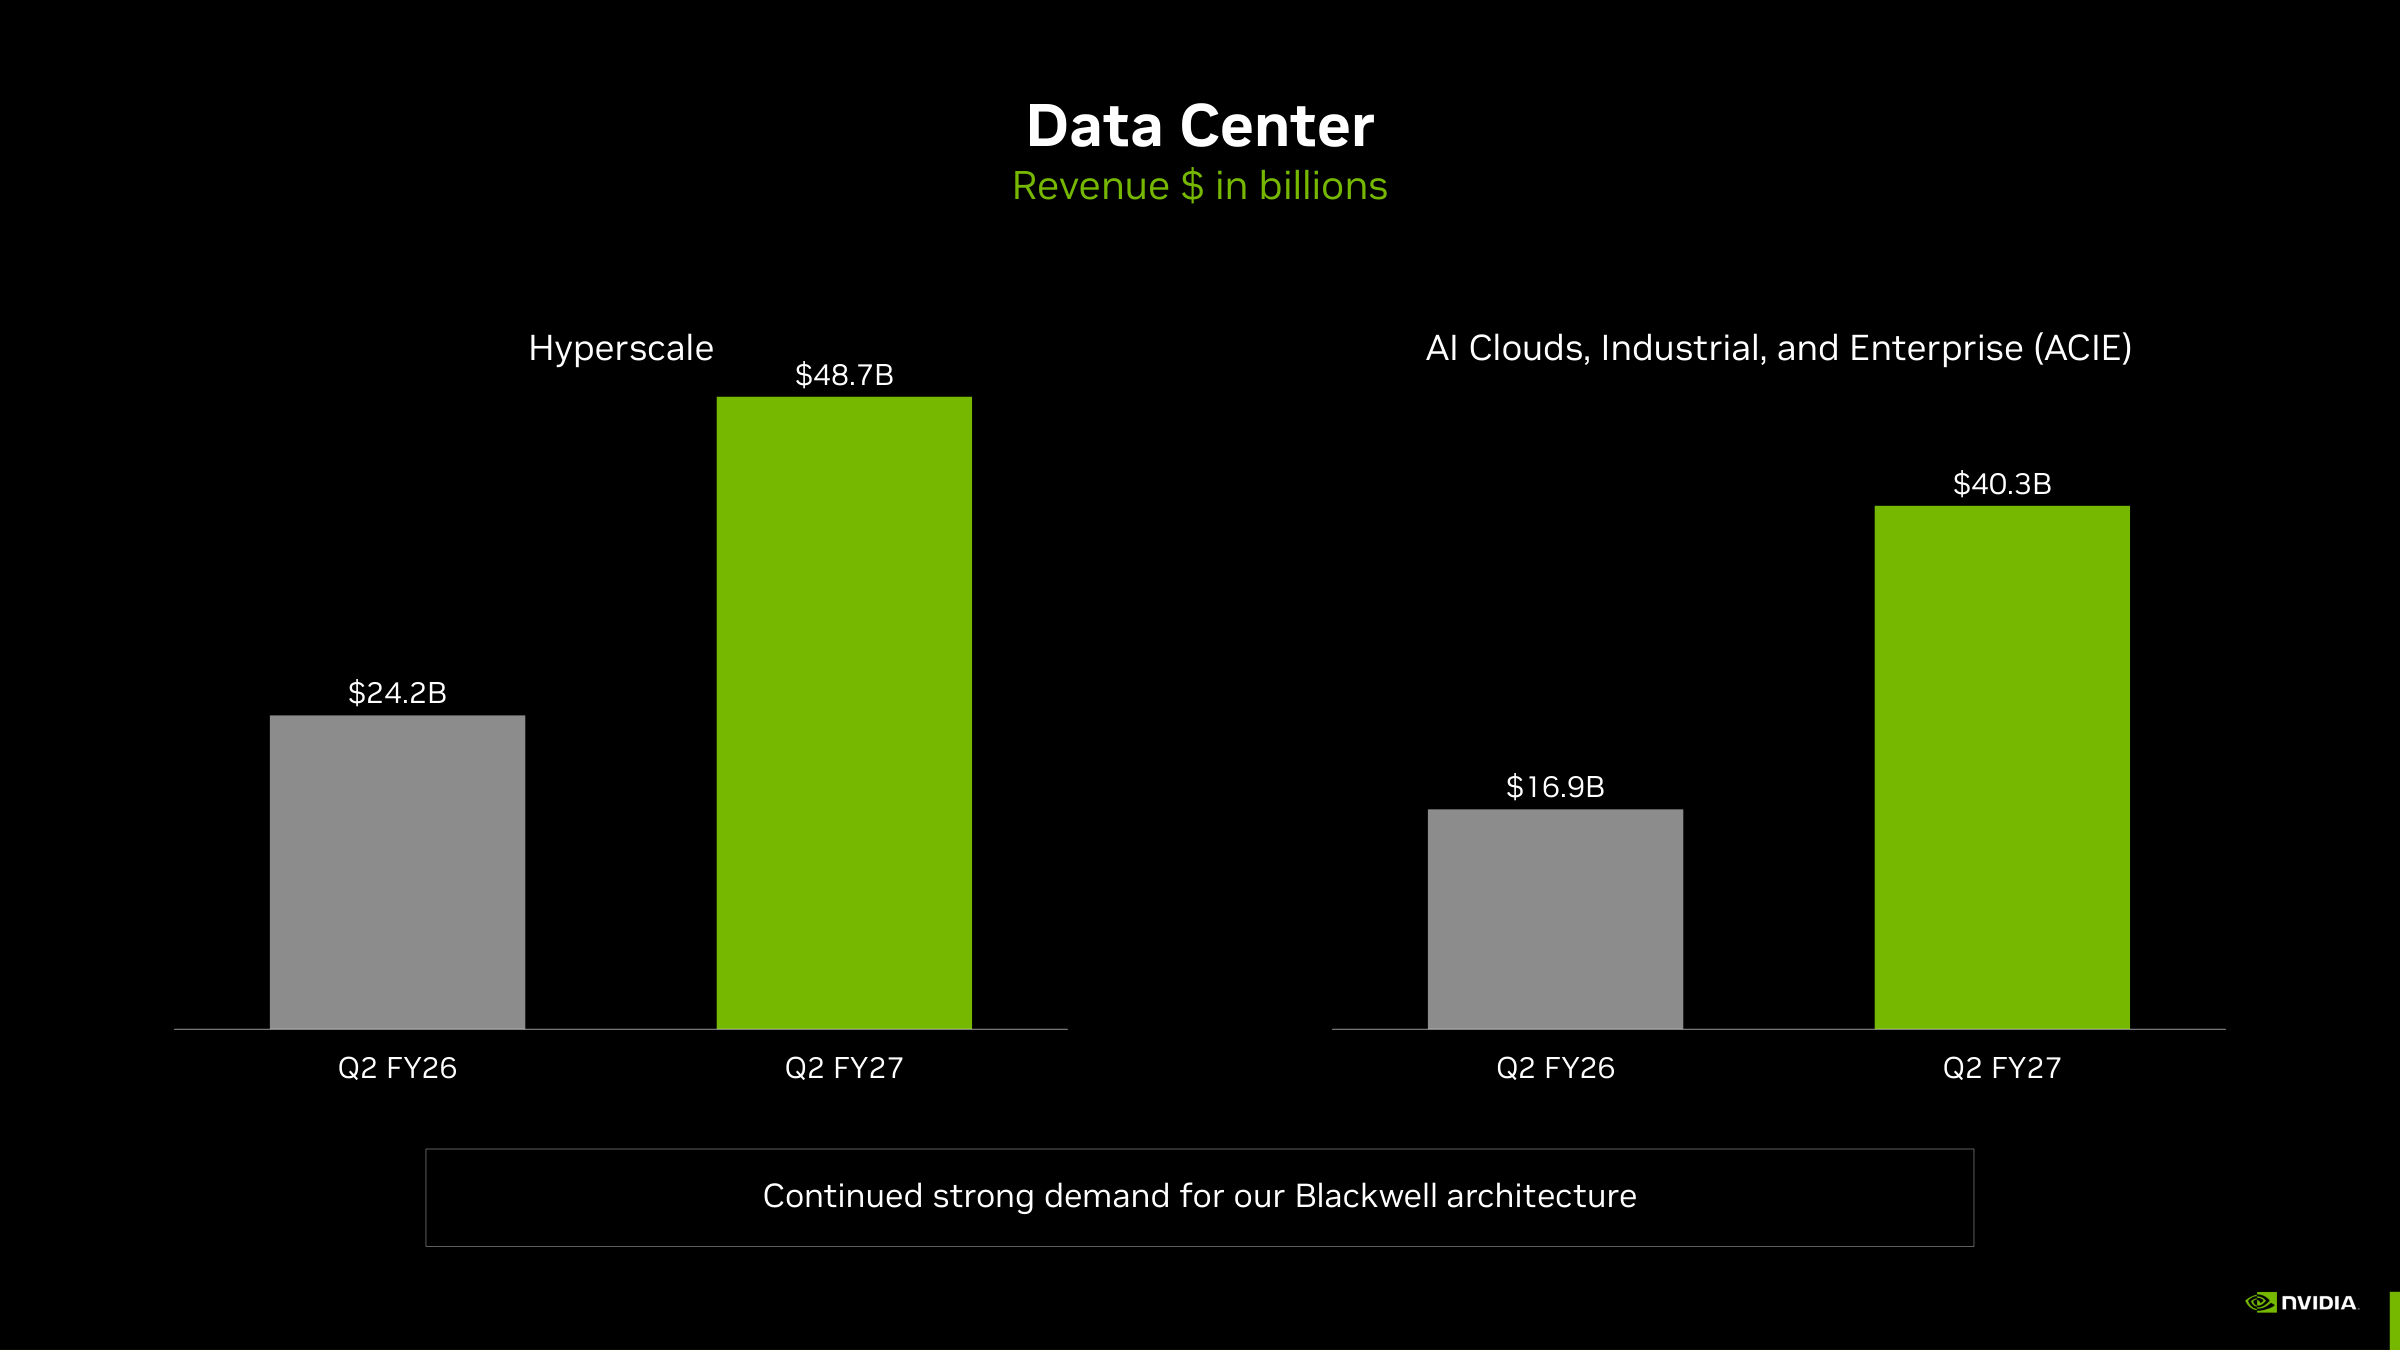
- NVIDIA changed how it reports revenue by market platform in the first quarter of fiscal 2027. Data Center is now split into Hyperscale and ACIE (AI Clouds, Industrial, and Enterprise), and PCs, gaming, robotics and automotive sit in Edge Computing. In Q2 the company moved one customer from ACIE to Hyperscale "due to a change in their business model" and recast prior periods.
| Quarter | Hyperscale | AI Clouds, Industrial & Enterprise | Edge Computing | Total |
| Q1 FY2026 | 22,260 | 16,852 | 4,950 | 44,062 |
| Q2 FY2026 | 24,168 | 16,928 | 5,647 | 46,743 |
| Q3 FY2026 | 35,140 | 16,075 | 5,791 | 57,006 |
| Q4 FY2026 | 42,213 | 20,101 | 5,813 | 68,127 |
| Q1 FY2027 | 43,050 | 32,196 | 6,369 | 81,615 |
| Q2 FY2027 | 48,710 | 40,313 | 7,198 | 96,221 |
- Figures are in millions of dollars from the company's quarterly revenue trend sheet. The two customer groups ran on different clocks. Hyperscale jumped to $35.1 billion in Q3 of fiscal 2026. ACIE then went from $16.1 billion to $40.3 billion over three quarters, 2.5 times. Of the $14.6 billion added in Q2, ACIE contributed $8.1 billion, Hyperscale $5.7 billion and Edge $0.8 billion.
- Filing note (Q2 10-Q, Note 16): One direct customer accounted for 16% of Q2 revenue, and three direct customers accounted for 16%, 15% and 13% in the first half. A year earlier, two direct customers were 23% and 16% of the quarter. Customers headquartered outside the U.S. were 38% of Q2 revenue, up from 30%.
- Direct customers are mostly the manufacturers and distributors that build the servers, so the end buyers are not named. That makes management's description the only window into the mix.
- Company disclosure (Q2 earnings call, August 26, 2026): CFO Colette Kress said ACIE growth was "driven by neocloud capacity additions to meet the rising demand from enterprises, AI start-ups, and sovereigns, as well as hyperscalers purchasing capacity to supplement their own build." She also said "we expect demand from the AI labs for which we expect to leverage our balance sheet to contribute toward roughly a quarter of our business next year."
- The 10-Q connects the two. NVIDIA says it "introduced a new business model with certain select AI cloud partners" in Q2: the clouds buy NVIDIA infrastructure, NVIDIA commits to cloud service agreements on that capacity, and if the clouds cannot resell it, NVIDIA has agreed to buy it. ACIE revenue growing 2.5 times in three quarters and this commitment appeared in the same filing.
- Edge Computing revenue of $7.20 billion was +27.5% from a year ago on Blackwell workstations, partly offset by slower consumer PCs as memory and system prices rose. China was small. H200 shipments under U.S. licenses were under 1% of Data Center revenue, NVIDIA booked a $0.4 billion H200 charge in the first half, and the Q3 outlook assumes no China data center compute revenue.
Is NVIDIA Stock Cheap at 27 Times Earnings?
- On fiscal year-end prices the P/E has fallen every year. Prices are split-adjusted; P/E is the year-end price over diluted EPS; the dividend yield uses dividends declared per share.
| Fiscal year-end | Year-end price | P/E | P/B | Dividend yield | FCF ($m) |
| Jan 2022 | $22.74 | 5.9x | 2.14x | 0.70% | 8,132.0 |
| Jan 2023 | $20.30 | 119.4x | 2.26x | 0.08% | 3,808.0 |
| Jan 2024 | $60.85 | 51.1x | 34.89x | 0.03% | 27,021.0 |
| Jan 2025 | $142.25 | 48.4x | 43.89x | 0.02% | 60,853.0 |
| Jan 2026 | $187.23 | 38.2x | 28.93x | 0.02% | 96,676.0 |
- The 5.9x in the January 2022 row is a data artifact: the XBRL diluted EPS for that year is still on a pre-split share basis. The bands below are built from a separate monthly calculation that adjusts for both splits.
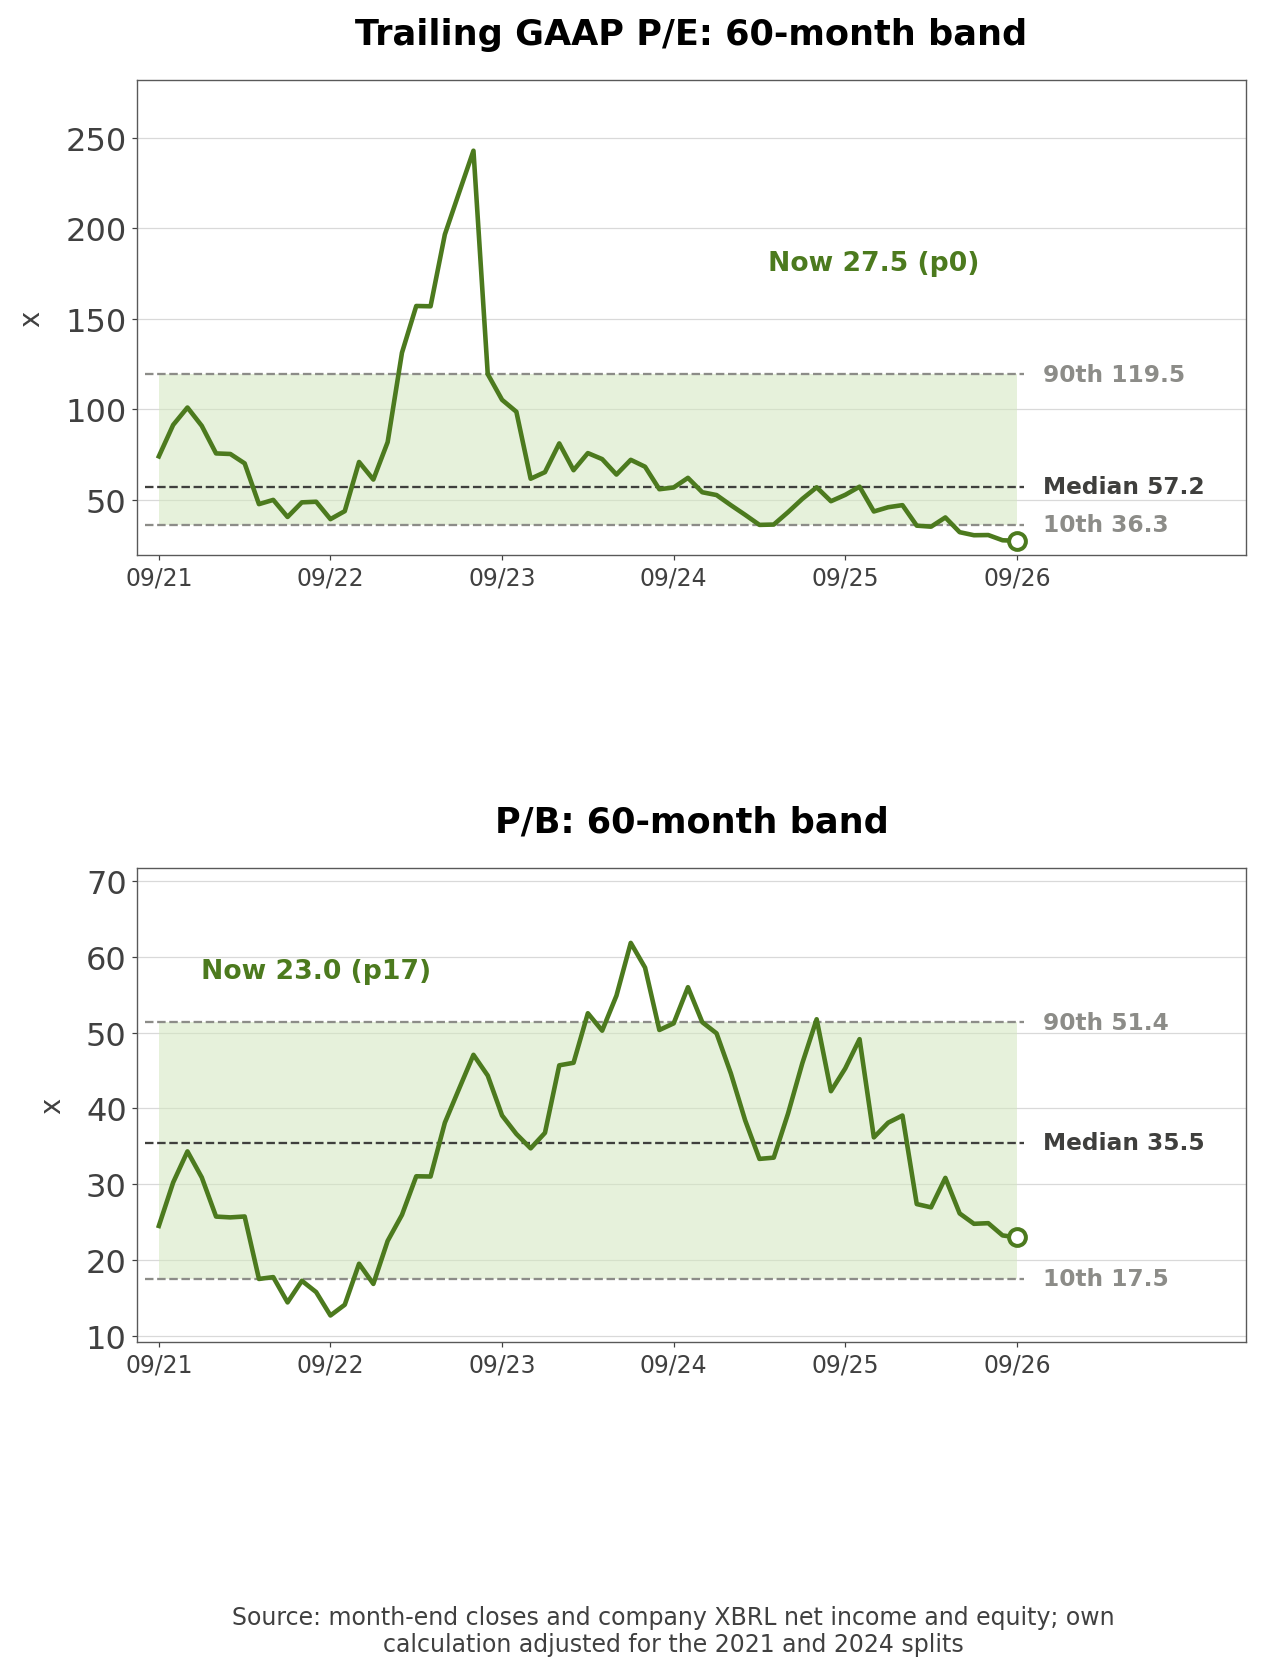
- Own calculation (60 month-end closes with XBRL quarterly net income and equity): For each month from September 2021 to August 2026 I used trailing twelve-month (TTM) GAAP net income from the latest quarter that ended at least 30 days earlier, plus that quarter's equity. Share counts mix pre- and post-split values in the raw data, so I normalized them by magnitude.
- At $218.29 the trailing P/E is 27.5x, below the 60-month low of 27.8x set at the end of August 2026. The median is 57.2x, the 10th percentile 36.3x, and the peak 242.8x in July 2023. P/B is 23.0x, in the 17th percentile, against a 35.5x median and a 12.7x low in September 2022.
- Aggregator check (two sell-side research aggregators): One shows a trailing P/E of 27.63x, within 0.2x of my figure. The other shows P/B of 23.07x and a non-GAAP P/E of 31.14x with a five-year non-GAAP median of 52.75x.
- The multiple compressed because earnings outran the stock. The shares are +23.1% over a year while trailing net income rose from $86.6 billion to $192.9 billion, 2.2 times, and the P/E at the end of August 2025 was 49.3x.
- The earnings deserve one adjustment. First-half fiscal 2027 GAAP net income of $118.0 billion includes $23.7 billion of pre-tax gains on equity securities, 20.1% of the total. Q2 non-GAAP net income, which excludes those gains, was $53.95 billion, 90.4% of GAAP. On earnings without the gains, the multiple is higher than 27.5x.
Why Operating Cash Flow Fell While Profit Hit a Record
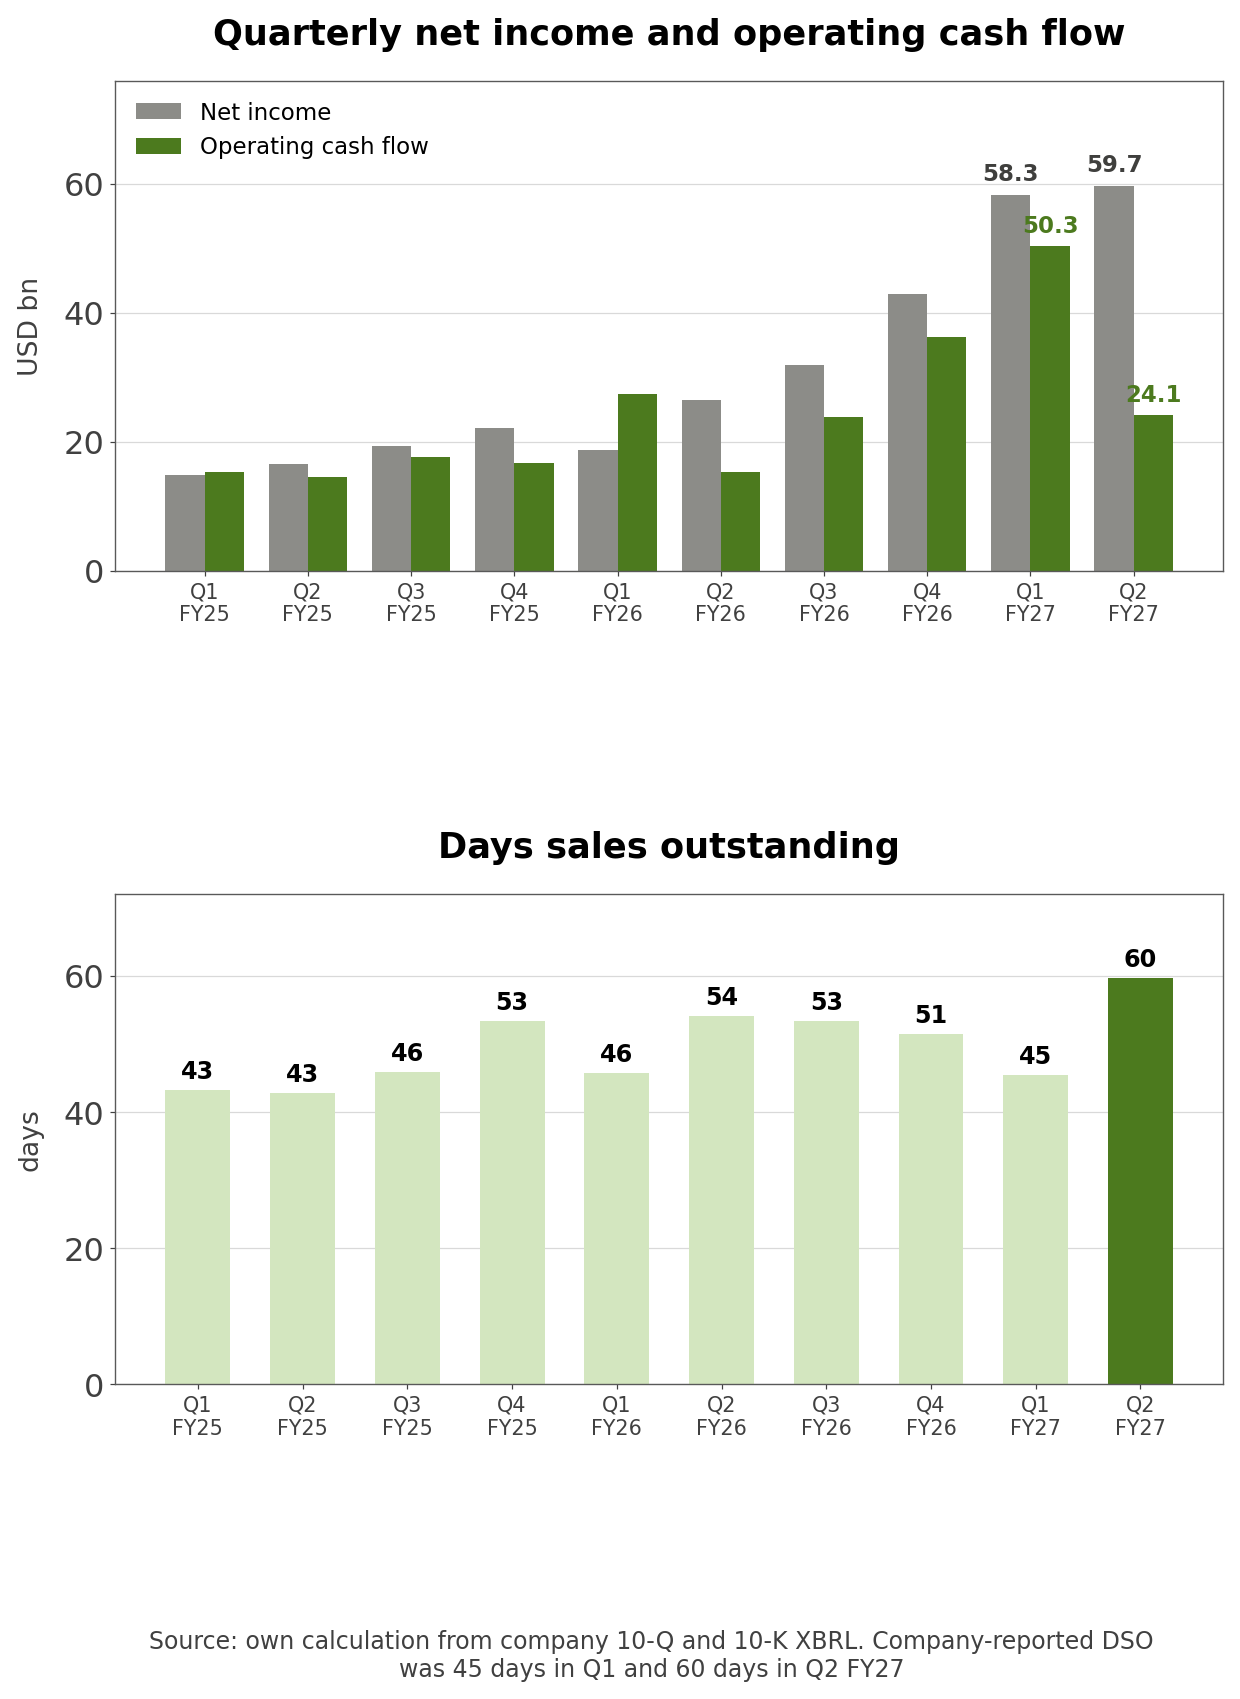
- Q2 operating cash flow of $24.08 billion was 0.40 times GAAP net income, the lowest of the last ten quarters. It was 0.86 times in Q1 and 0.58 times a year earlier. Accounts receivable rose $22.3 billion, from $40.71 billion to $63.06 billion, which is 153% of the quarter's $14.6 billion revenue increase. Inventory rose $5.8 billion to $31.58 billion.
- Company disclosure (Q1 FY2027 CFO commentary, May 20, 2026): Explaining a drop in DSO from 51 to 45 days, NVIDIA wrote: "We expect our DSO to return to more normal levels next quarter." The same document said it expected "a substantial increase in cash taxes in the second quarter."
- Company disclosure (Q2 FY2027 CFO commentary, August 26, 2026): DSO rose to 60 days "due to extended payment terms on large, multi-quarter agreements with certain investment-grade customers." Inventory rose "as we prepare for the introduction of Vera Rubin in the third quarter," and the sequential drop in operating cash flow "was driven by higher working capital adjustments and cash taxes."
- A metric the company expected to normalize moved 15 days the other way one quarter later. The average of the prior eight quarters was about 49 days, so 60 is 11 days above that and the longest in ten quarters.
- Filing note (Q2 10-Q risk factors): A new sentence reads: "Financing arrangements with certain investment-grade customers, including extended payment terms under large, multi-quarter agreements, will continue to affect the timing of our operating cash flows."
- That wording turns a timing blip into a stated condition. The same 10-Q shows the opposite flow too: NVIDIA collected $15.6 billion of customer advances in the first half, recognized $13.0 billion of them as revenue, and ended July with $2.8 billion of advances, up from $160 million in January. Some customers are paying early while others are paying late.
- Equity gains widen the gap as well. Q1 gains of $15.9 billion were 27.3% of net income and Q2 gains of $7.8 billion were 13.0%, and none of that is cash. NVIDIA held $99 billion of equity investments and $25 billion of further equity investment commitments at quarter-end, and in Q2 it received public company warrants with a $4.8 billion notional and an $824 million fair value.
| Number | Value | Why it matters |
| Days sales outstanding (45 days in Q1) | 60 days | Extended payment terms delayed cash collection |
| Q2 operating cash flow / net income | 0.40x | Lowest in ten quarters; Q1 was 0.86x |
| Supply and capacity commitments ($119 billion in Q1) | $279 billion | 0.92 times trailing revenue and hard to cut if demand slows |
| Maximum gross guarantee exposure | $108.5 billion | 1.9 times cash and securities; phases in from fiscal 2029 |
| Trailing GAAP P/E (60-month median 57.2x) | 27.5x | Lowest in 60 months, but earnings include equity gains |
What NVIDIA's Q2 Investor Presentation Claims
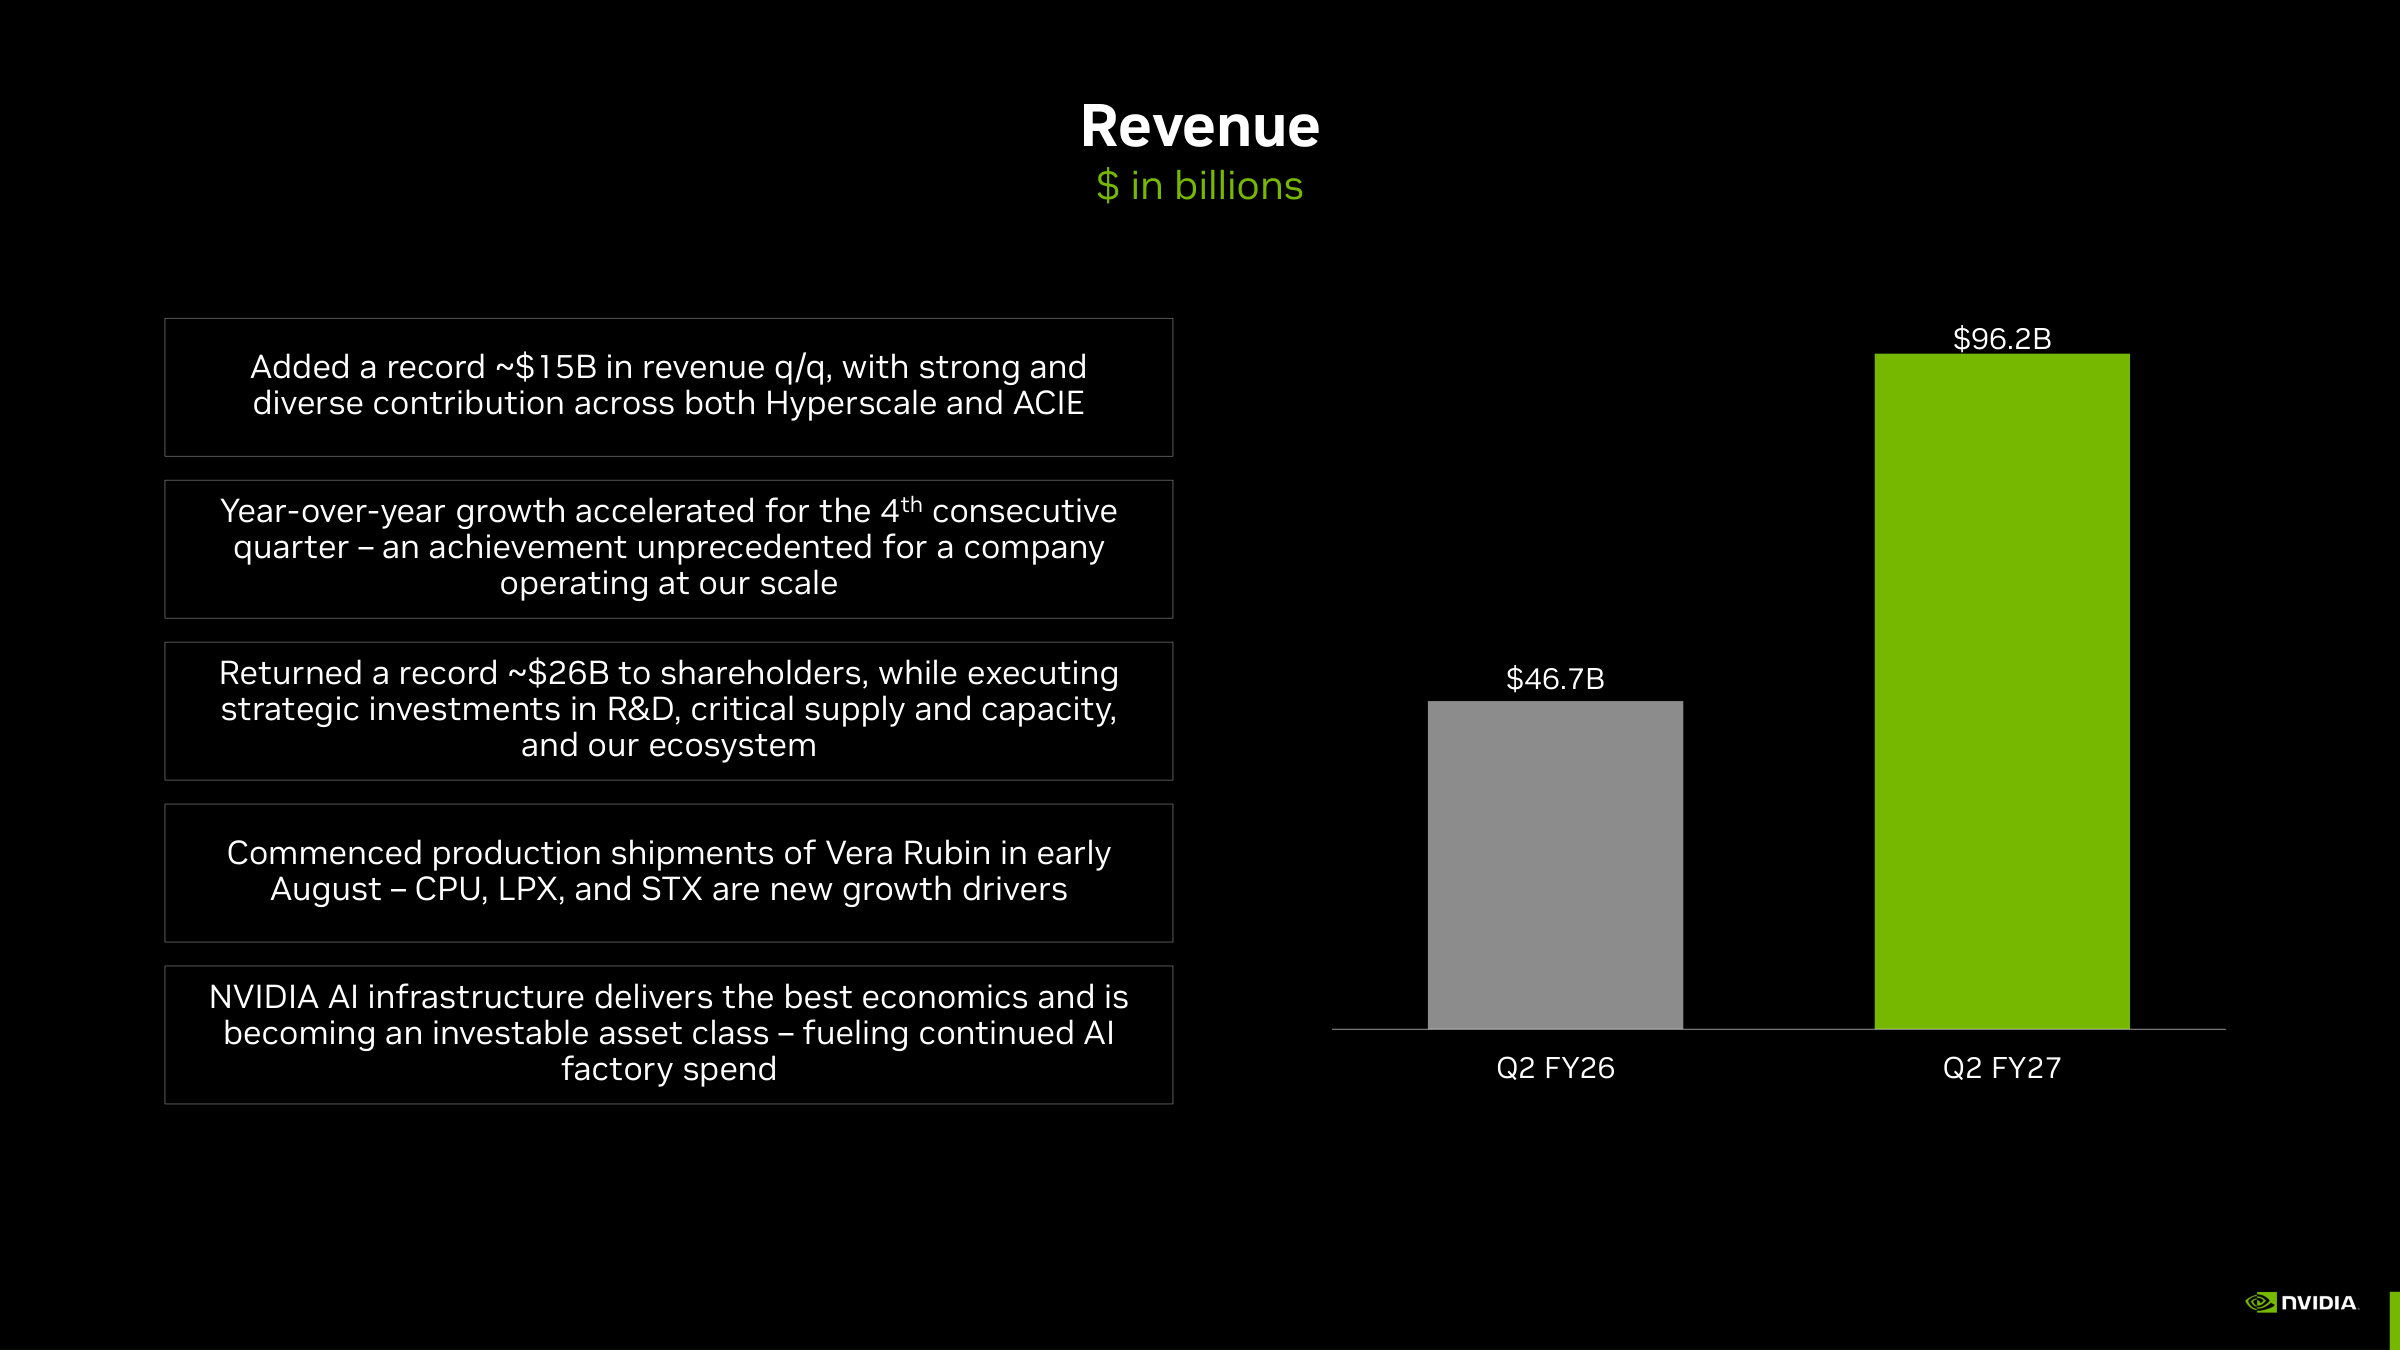
- Page 3 of the Q2 investor presentation puts five claims next to the revenue bars. NVIDIA "Added a record ~$15B in revenue q/q," says "Year-over-year growth accelerated for the 4th consecutive quarter," "Returned a record ~$26B to shareholders," began Vera Rubin production shipments in early August, and says its AI infrastructure "delivers the best economics and is becoming an investable asset class."
- Own calculation (ten quarters of XBRL revenue): Q2 revenue rose $14.61 billion, above Q1's $13.49 billion increase and the largest on record. Year-over-year growth ran 55.6%, 62.5%, 73.2%, 85.2% and 105.9% from Q2 of fiscal 2026 to Q2 of fiscal 2027, four straight accelerations.
- The first two claims check out. The third needs the next slide and the cash flow statement.
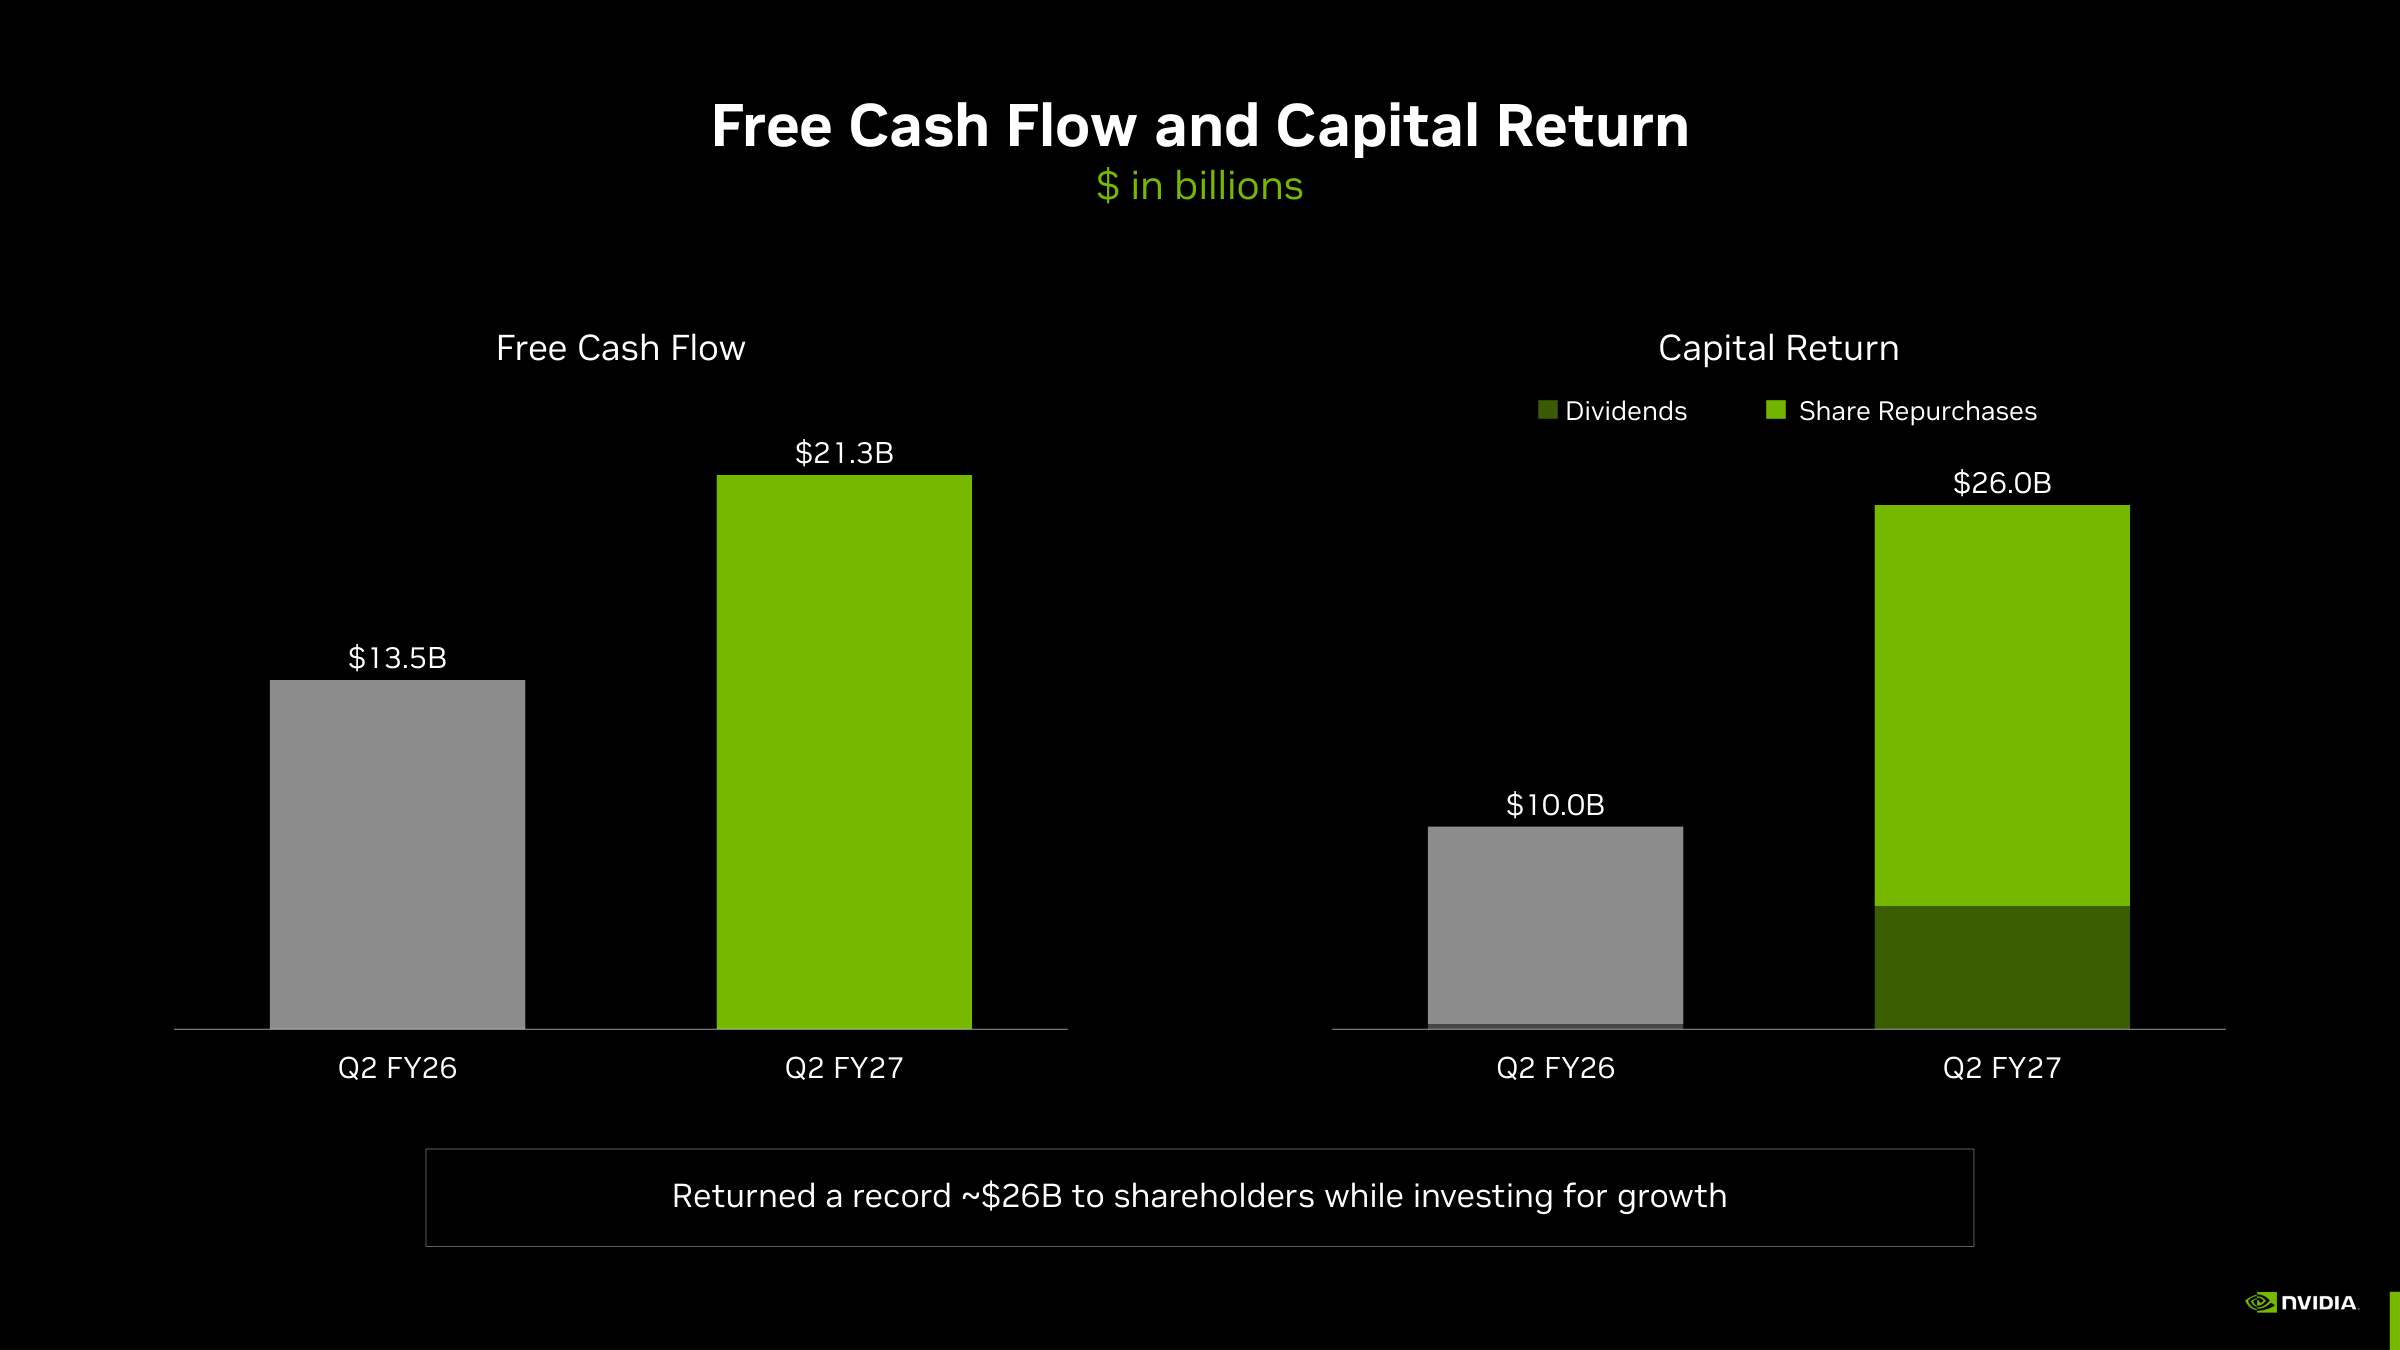
- Page 8 shows free cash flow of $21.3 billion and capital return of about $26.0 billion in Q2, so NVIDIA returned 122% of the quarter's free cash flow. The same page in Q1 showed $48.6 billion of free cash flow and about $20.0 billion returned.
- Filing note (Q2 10-Q cash flow statement, first half): Operating cash flow was $74.42 billion and purchases of property, equipment and intangibles were $4.43 billion. NVIDIA spent $39.04 billion on buybacks and $6.29 billion on dividends, and raised $24.90 billion from debt issuance.
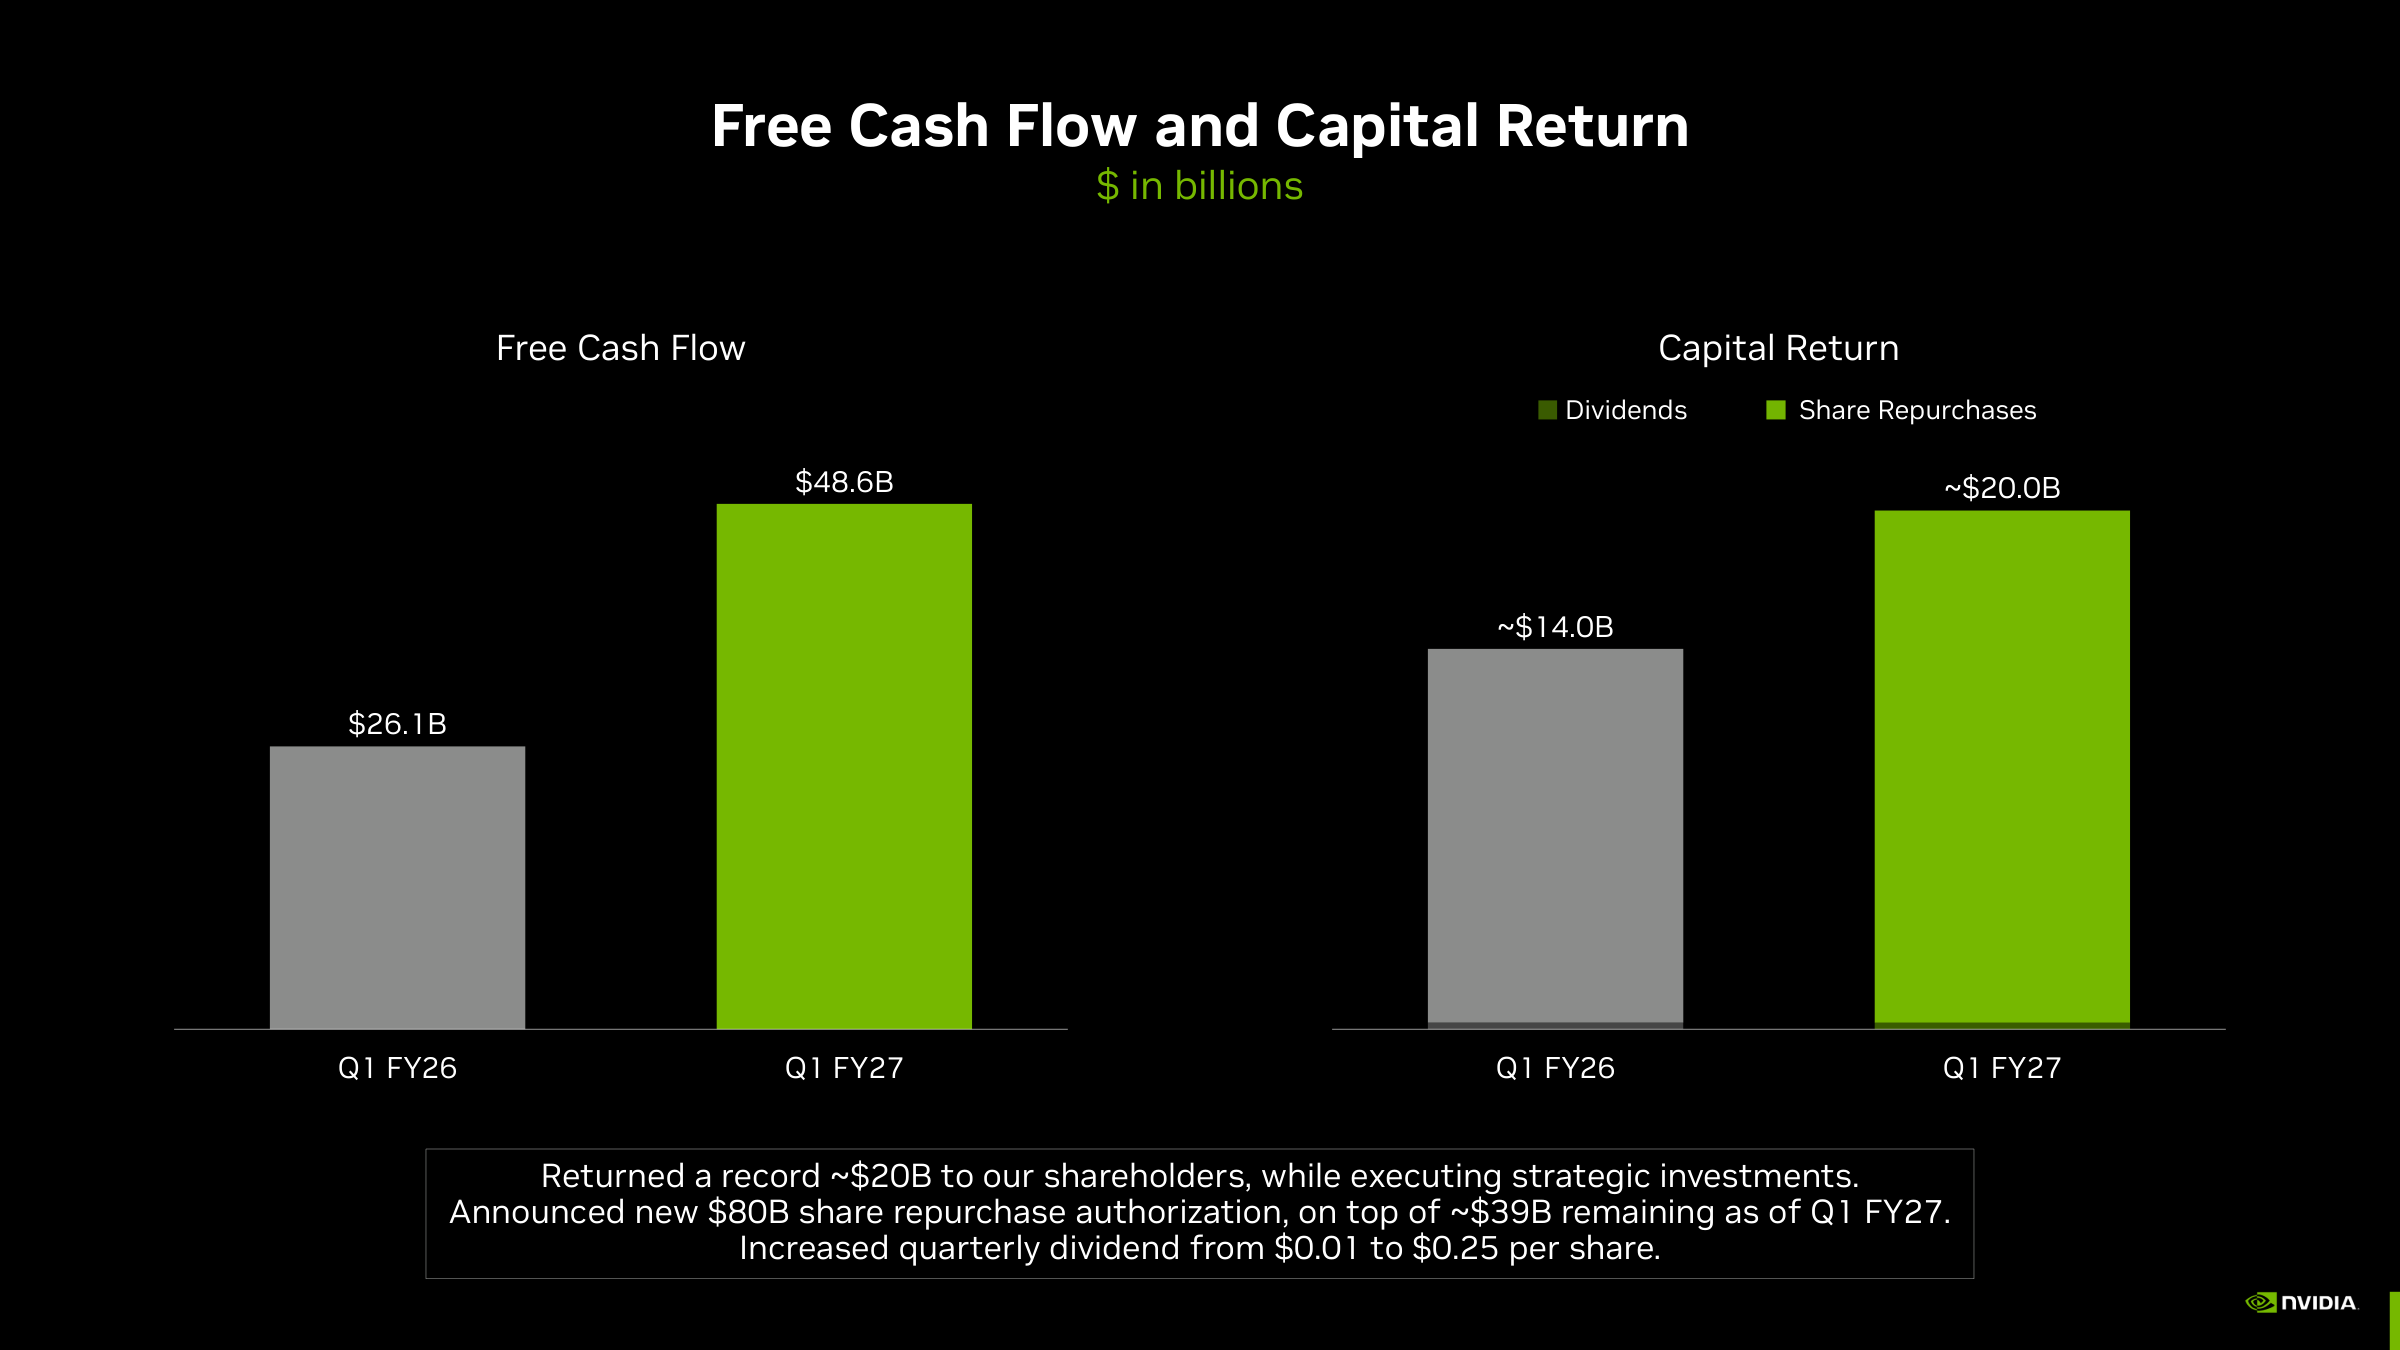
- The record return landed in the same quarter NVIDIA sold $25 billion of senior notes. Cash and marketable securities rose from $50.3 billion to $56.6 billion with those proceeds included, and senior notes outstanding reached $33.5 billion. Across the first half, the $45.3 billion returned was 64.9% of $69.9 billion of free cash flow.
- The fifth claim is the one whose wording changed. In Q1, the matching line said NVIDIA AI infrastructure "delivers the lowest token cost and highest token throughput." In Q2 it became "the best economics" and "an investable asset class," a performance sentence turned into a financing sentence. The same quarter's 10-Q added $36 billion of AI cloud agreements, $20 billion of data center leases to be reassigned to third parties, and the $105 billion SB Energy guarantee.
- The Vera Rubin shipment claim cannot be verified from the filings, but inventory of $31.58 billion and the stated reason for it point the same way. On the call, management put NVIDIA's revenue opportunity per gigawatt at about $18 billion for Hopper, $25 billion for Blackwell and $40 billion for Vera Rubin.
Supply Commitments and the SB Energy Lease Guarantees
- Note 10 of the 10-Q and the CFO commentary list three layers of future payments. Amounts are in billions of dollars.
| Obligation | Amount ($bn) | What it is |
| Supply and capacity | 279 | Up from 119 in Q1, mostly memory |
| Cloud service agreements | 29 | Compute for R&D |
| Data center leases not commenced | 25 | Terms up to 20 years |
| Equity investment commitments | 25 | AI model makers and infrastructure financiers |
| Capital expenditures | 8 | Data center equipment |
| AI cloud agreements | 36 | New business model started in Q2 |
| Leases to be reassigned to third parties | 20 | About 15 years from fiscal 2028 to 2029 |
| AI cloud lease guarantees | 3.5 | Partners placed $712 million in escrow |
| SB Energy guarantees | 105 | Tenant is an OpenAI affiliate |
- Own calculation (Q2 CFO commentary commitment tables): $267 billion of the $279 billion in supply commitments falls in the rest of fiscal 2027 through fiscal 2029, 95.7% within three years. The five commitment lines total $366 billion; adding $56 billion of AI cloud and third-party lease commitments and $108.5 billion of guarantees gives $530.5 billion, 1.75 times trailing revenue of $303.0 billion.
- Filing note (8-K Items 1.01 and 2.03, August 17, 2026): NVIDIA entered into multiple residual value guaranties with SB Energy covering leases for about 4.25 gigawatts of IT load at the PORTS Technology Campus in Pike County, Ohio. An OpenAI affiliate is the tenant on 20-year leases. If OpenAI becomes insolvent or stops paying, NVIDIA pays the shortfall between a guaranteed minimum lease value and what is recovered through re-leasing or sale. The obligation is capped at $105 billion, and NVIDIA can support about 3.8 more gigawatts at its option.
- The 8-K also lists when the guarantees end: 20 years after each lease starts, if OpenAI terminates the lease under its terms, or on "OpenAI achieving a satisfactory credit rating." OpenAI has agreed to reimburse NVIDIA for any amounts it actually pays. The 10-Q adds that guarantee amounts step up as each of nine data centers is completed, with the first expected in fiscal 2029, and decline as OpenAI pays rent.
- The $105 billion cap is 1.86 times quarter-end cash and securities, 54% of trailing net income and 2.0% of market capitalization. The CFO commentary says each generation of NVIDIA infrastructure at the site "could represent approximately 1.5 million NVIDIA GPUs, or approximately $150 billion to $200 billion in NVIDIA revenue."
- Company disclosure (Q2 earnings call): Describing the neocloud arrangements, Kress said "NVIDIA provides a take-or-pay commitment on a portion of the facility's capacity" and shares in revenue above that floor. "We're not making loans," she said, adding "our risk is limited" because NVIDIA compute can be redeployed to other customers.
- Outside view (BofA Securities analyst Vivek Arya, Q2 earnings call): Adding up the CFO commentary, Arya said "I get to a number of about $500 billion or so" and asked about the cash needed in fiscal 2028 and about OpenAI and Anthropic designing their own chips.
- Kress answered that supply commitments are "essential for the raising of Vera Rubin" and are concentrated in the first three years; she did not give a fiscal 2028 cash figure. CEO Jensen Huang called the AI lab investments a "once-in-a-generation opportunity" and said "the only regret that I have is that I didn't invest more and sooner." My $530.5 billion and Arya's $500 billion come from the same tables.
- The 10-Q also discloses memoranda of understanding signed in August with large capital providers to mobilize more than $500 billion of third-party capital for AI infrastructure, with NVIDIA possibly providing limited residual value support. The company notes these "may not lead to definitive agreements."
How Actual Revenue Compared With NVIDIA Guidance

- Own calculation (15 earnings releases filed on 8-K, February 2023 to August 2026): I matched the next-quarter revenue outlook in each release with the revenue actually reported. Actual revenue beat the outlook in all 14 completed quarters, but the average beat narrowed from 14.3% in the first four to 5.2% in the latest four.
- The smallest beat was 2.5% in Q1 of fiscal 2026, the quarter hit by the H20 license rule. In Q2 of fiscal 2027 NVIDIA guided to $91.0 billion and reported $96.2 billion, a 5.7% beat. Because the base is larger, that beat is $5.2 billion in dollars, more than the $2.5 billion beat in the May 2023 quarter.
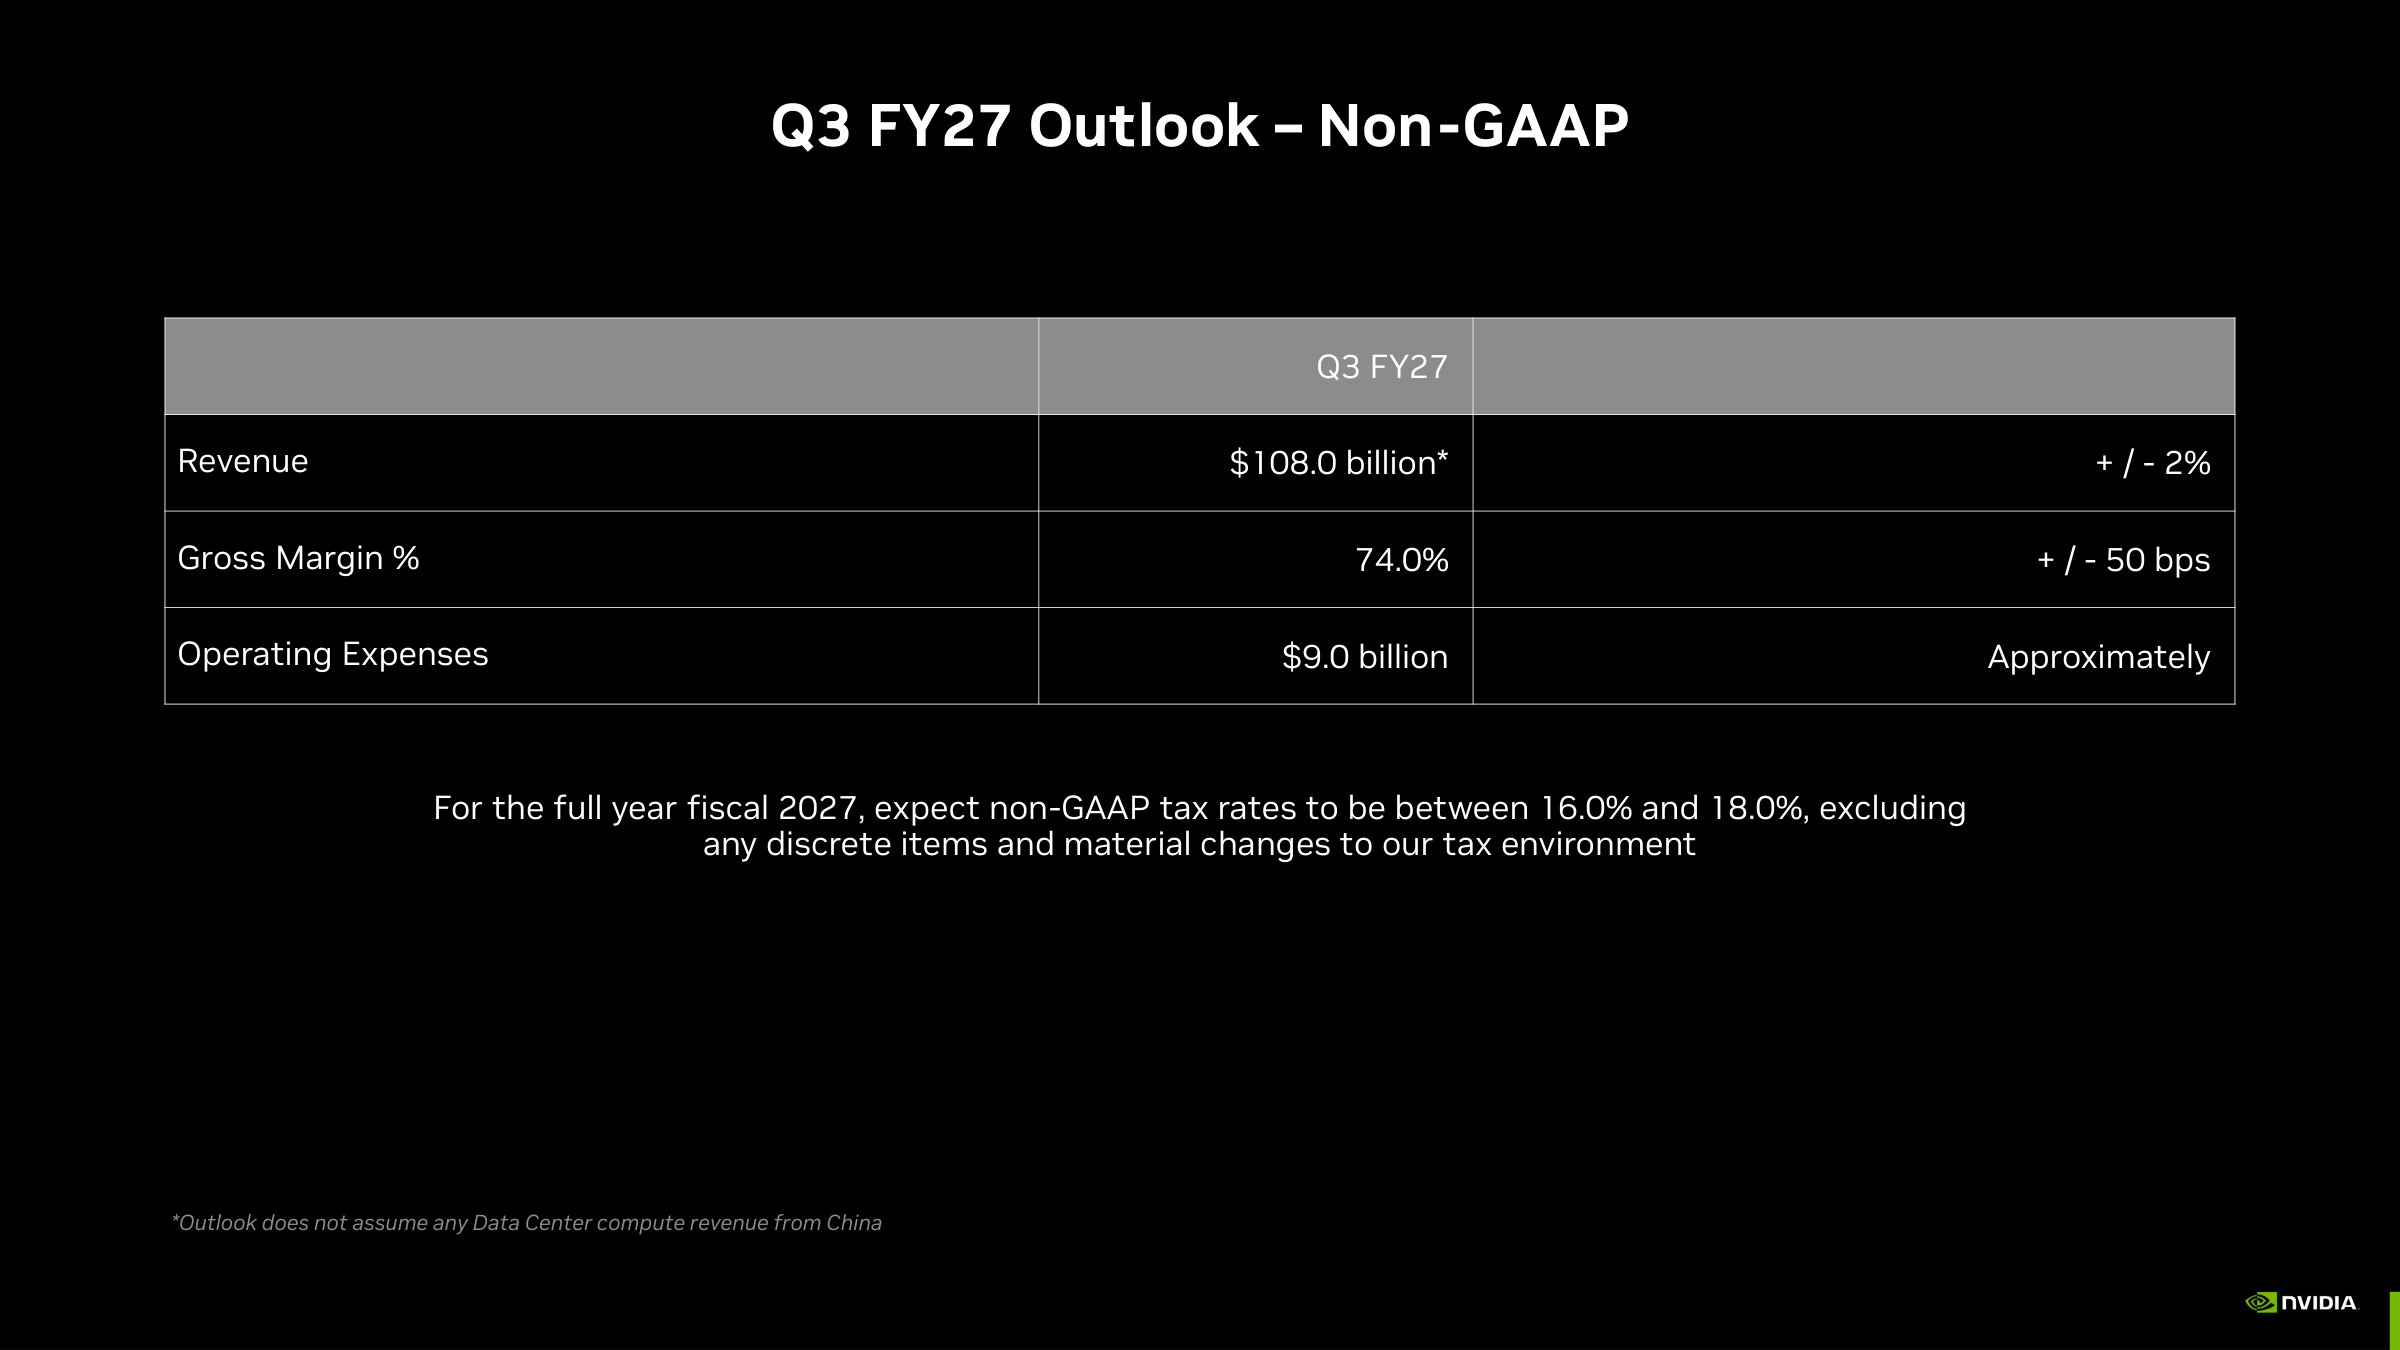
- The Q3 outlook calls for revenue of $108.0 billion plus or minus 2%, a non-GAAP gross margin of 74.0% plus or minus 50 basis points and non-GAAP operating expenses of about $9.0 billion, with no China data center compute revenue. That is +12.2% sequential growth, below Q2's 17.9%. Applying the recent 5.2% average beat gives about $113.6 billion. One aggregator's average Q3 revenue estimate is $108.99 billion, 0.9% above the guide.
- Company disclosure (Q2 earnings call): Kress said memory price increases "exceeded our prior expectations," and "We expect margins to bottom in Q4 in the 71% to 72% range before settling at 72% to 73% in fiscal year 2028 as executed price increases take effect in Q1." She added that NVIDIA has relationships "with all three major memory suppliers."
- Revenue guidance and margin guidance pointed in opposite directions on the same call. NVIDIA said it expects fiscal 2028 revenue growth of approximately 70% and called it "a supply-constrained outlook," while guiding gross margin two to three points below the Q2 level of 75.0%.
What the Street Believes vs What the Filings Show
- The bull case for NVDA runs from AI compute demand to a low P/E. I broke the argument that recurs in broker notes and on the earnings call into ten links and checked each against the 10-Q, the 8-Ks and the CFO commentary.
| # | The thesis | Evidence | Verdict |
| 1 | AI compute demand exceeds supply | Management call remarks; $31.6 billion inventory; $279 billion supply commitments | Partly holds |
| 2 | Fiscal 2028 revenue grows about 70% | Company outlook; consensus revenue growth of 64.8% | Conditional |
| 3 | Supply commitments cleared the component bottleneck | 95.7% of commitments due within three years; margin outlook cut on memory costs | Partly holds |
| 4 | Customer support carries little risk | Company assertion only; up to $108.5 billion of guarantees; $36 billion AI cloud agreements | Unverifiable |
| 5 | The cash flow slowdown is temporary | Q1 expected normal DSO, Q2 hit 60 days; new 10-Q risk sentence says it will continue | Overstated |
| 6 | Gross margin stays at 75% | Company guided 71% to 72% in Q4 and 72% to 73% in fiscal 2028 | Wrong |
| 7 | A 60-month low P/E makes the stock cheap | 27.5x vs a 57.2x median; equity gains are 20.1% of first-half net income | Partly holds |
| 8 | Brokers keep raising targets | All 11 target changes since August 27 were increases | Holds |
| 9 | The guarantee ends if OpenAI earns a rating or keeps paying | 8-K termination terms; OpenAI reimbursement agreement | Holds |
| 10 | A China return adds upside | No China data center compute in the outlook; H200 under 1% of Data Center revenue | Unverifiable |
- Two links hold, three partly hold, one is conditional, two cannot be verified, one is overstated and one is wrong. The weakest link is number 5. If slower cash conversion is a standing condition, the low P/E in link 7 is a multiple on earnings that turn into cash later, and links 4 and 9 will not be tested until fiscal 2029.
NVDA Price Targets and EPS Revisions
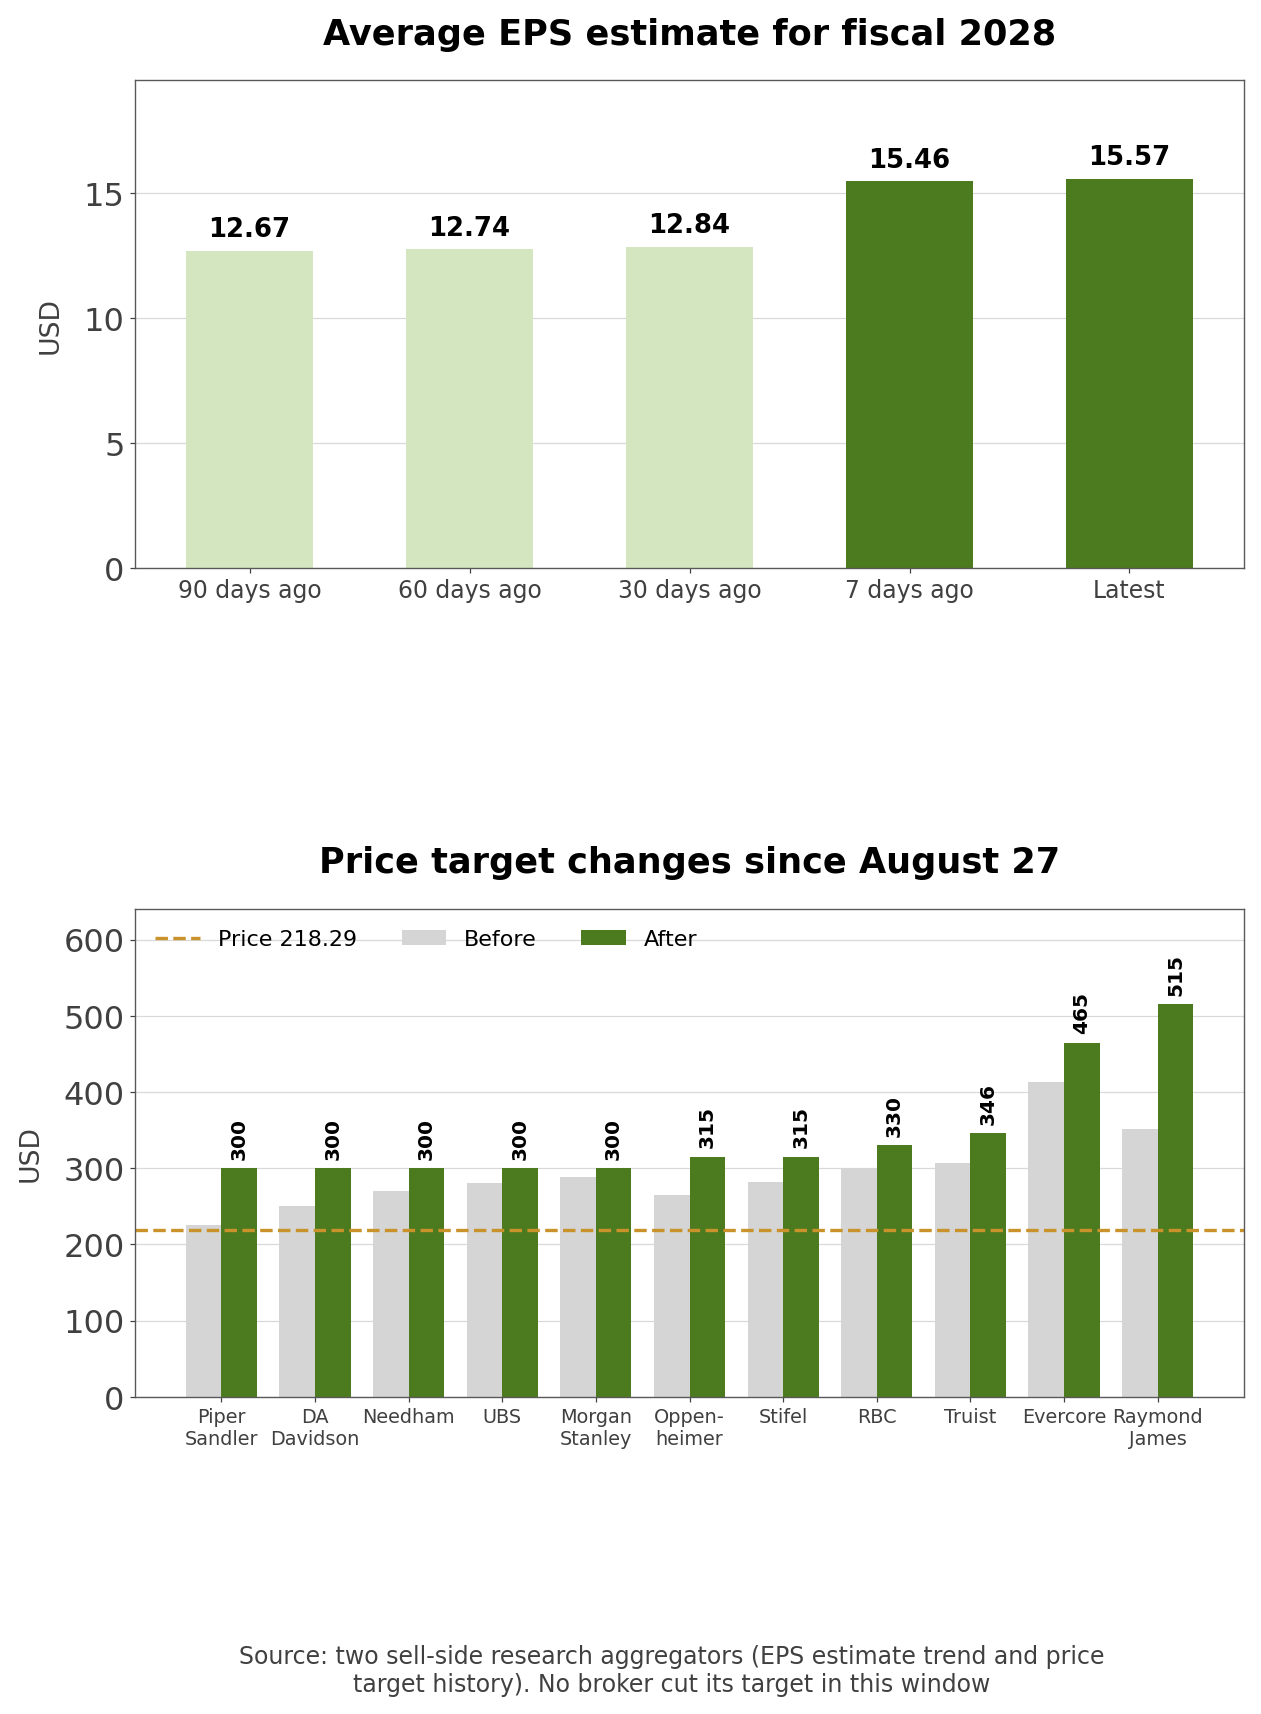
- Aggregated sell-side research (79 target prices; 49 to 57 EPS estimates): The average 12-month target is $309, with a low of $139 and a high of $500. Ratings split 2 Strong Buy, 58 Buy, 16 Hold and 3 Sell, and a second aggregator's 56-analyst average is $322.88. The average EPS estimate is $9.30 for fiscal 2027 and $15.57 for fiscal 2028, and the fiscal 2028 revenue estimate averages $677.92 billion.
| Date | Broker | Rating | Target ($) |
| 2026-09-11 | RBC Capital | Initiated at Outperform | Not given |
| 2026-09-10 | Goldman Sachs | Buy, reiterated | Not given |
| 2026-09-09 | Piper Sandler | Initiated at Overweight | 225 to 300 |
| 2026-08-31 | Deutsche Bank | Buy, reiterated | Not given |
| 2026-08-27 | Truist Financial | Not shown | 307 to 346 |
| 2026-08-27 | D.A. Davidson | Not shown | 250 to 300 |
| 2026-08-27 | RBC Capital | Not shown | 300 to 330 |
| 2026-08-27 | Needham | Buy, reiterated | 270 to 300 |
| 2026-08-27 | Evercore ISI | Outperform, reiterated | 413 to 465 |
| 2026-08-27 | Raymond James | Not shown | 352 to 515 |
| 2026-08-27 | UBS | Not shown | 280 to 300 |
| 2026-08-27 | Morgan Stanley | Not shown | 288 to 300 |
| 2026-08-27 | Bernstein | Outperform, reiterated | Not given |
| 2026-08-27 | Oppenheimer | Not shown | 265 to 315 |
| 2026-08-27 | Stifel Nicolaus | Not shown | 282 to 315 |
- All 11 brokers that changed targets after the results raised them. The new targets average $344, and five of the eleven landed on the same round number. The largest increase came from Raymond James at +46.3%.
- Estimates moved in one step after the report. The fiscal 2028 EPS estimate rose from $12.84 thirty days earlier to $15.57 (+21.3%), after barely moving from $12.67 ninety days ago. Forty-one analysts raised fiscal 2028 estimates over thirty days and none cut. At $218.29 the stock trades at 14.0 times the fiscal 2028 figure.
- Aggregator check (two aggregators): NVIDIA beat the non-GAAP EPS estimate in each of the last eight quarters, by 6.0% on average in one aggregator. The other shows beats of 3.46%, 5.32%, 5.54% and 6.16% over the last four.
- Company disclosure (Q2 earnings call): Huang said "Customers' forecasts point to our growth doubling next year" but that NVIDIA expects about 70% "as we are supply-constrained," and that "NVIDIA Compute is fully utilized across every cloud we serve."
- Consensus fiscal 2028 revenue growth of 64.8% is still below the company's 70%. Estimates rose 21% in a month without reaching the outlook, and with lower margins guided the same day, whether the revenue raise outweighs the margin cut is what decides the next revision.
Who Owns NVIDIA and How Shareholders Voted
| Holder | Shares | Stake | Source |
| Vanguard Capital Management | Percentage only in filing | 7.31% | Schedule 13G (April 28, 2026) |
| Jensen Huang (CEO) | 870,604,104 | 3.58% | Proxy (DEF 14A, May 2026) |
| Colette Kress (CFO) | 4,443,523 | Under 1% | Same |
- Vanguard is the only holder reporting more than 5%. Its March 26 amendment showed 0% under the old filer name, and on April 28 Vanguard Capital Management reported 7.31% under a new entity after a reorganization, so the 9.32% in the January filing is from a different filer. One aggregator lists BlackRock, Vanguard, Fidelity, State Street and Geode as the top institutions.
- Counting only common shares and excluding option lines in 13F information tables, four well-known funds held more than 10 million NVDA shares at the end of June: D.E. Shaw, Millennium, Citadel and Tiger Global. Point72 cut almost its entire stake, Third Point sold all 190,000 shares, and Berkshire Hathaway has no position.
| Fund | Common shares (June 30) | Change vs March 31 |
| D.E. Shaw | 20,042,818 | +36.3% |
| Millennium Management | 12,157,614 | +14.8% |
| Citadel Advisors | 11,815,467 | No prior filing in data |
| Tiger Global | 11,198,773 | -6.8% |
| Renaissance Technologies | 7,091,256 | +180.6% |
| Two Sigma | 6,284,574 | -44.1% |
| ARK Investment | 1,381,247 | +33.4% |
| Point72 | 437,800 | -94.2% |
- NVIDIA is also a shareholder in its customers: a July 20 Schedule 13G shows it owns 9.3% of Nebius Group, an AI cloud company.
- Filing note (8-K Item 5.07 on the 2026 annual meeting, filed June 30): All ten directors were elected. Approval (for divided by for plus against) was highest for Jensen Huang at 99.01% and lowest for lead independent director Stephen Neal at 86.70%. Say-on-pay passed with 93.62%, and a shareholder proposal to replace supermajority voting provisions with a simple majority passed with 86.84%.
- Insiders filed 94 Form 4 reports over the last twelve months. Suzanne Nora Johnson joined the board in May, and an April 8-K reported that Chief Accounting Officer Donald Robertson notified the company of his departure.
How NVIDIA Compares With Broadcom and TSMC

- The peers are Broadcom, AMD and Marvell, which sell competing accelerator and networking chips, plus TSMC, which manufactures NVIDIA's chips, and Micron, which sells high-bandwidth memory. The yardstick is trailing twelve-month operating income against market cap; TSMC figures are converted from New Taiwan dollars.
| Company | Market cap ($bn) | Trailing operating margin | Market cap / trailing operating income | Forward P/E | Revenue growth |
| NVIDIA | 5,271 | 65.2% | 26.7x | 14.0x | +105.9% |
| Broadcom | 1,728 | 48.5% | 40.0x | 18.7x | +85.5% |
| TSMC | 2,247 | 56.1% | 28.5x | 19.8x | +36.0% |
| Micron | 1,102 | 65.7% | 18.6x | 6.2x | +345.7% |
| AMD | 843 | 15.7% | 129.9x | 33.3x | +50.1% |
| Marvell | 212 | 16.8% | 133.6x | 35.1x | +36.5% |
- Own calculation (trailing operating income and market caps): NVIDIA's trailing operating income of $197.6 billion is larger than the other five combined at $189.5 billion. Its operating margin ranks second behind Micron, and its 26.7x market cap to operating income is second lowest after Micron's 18.6x.
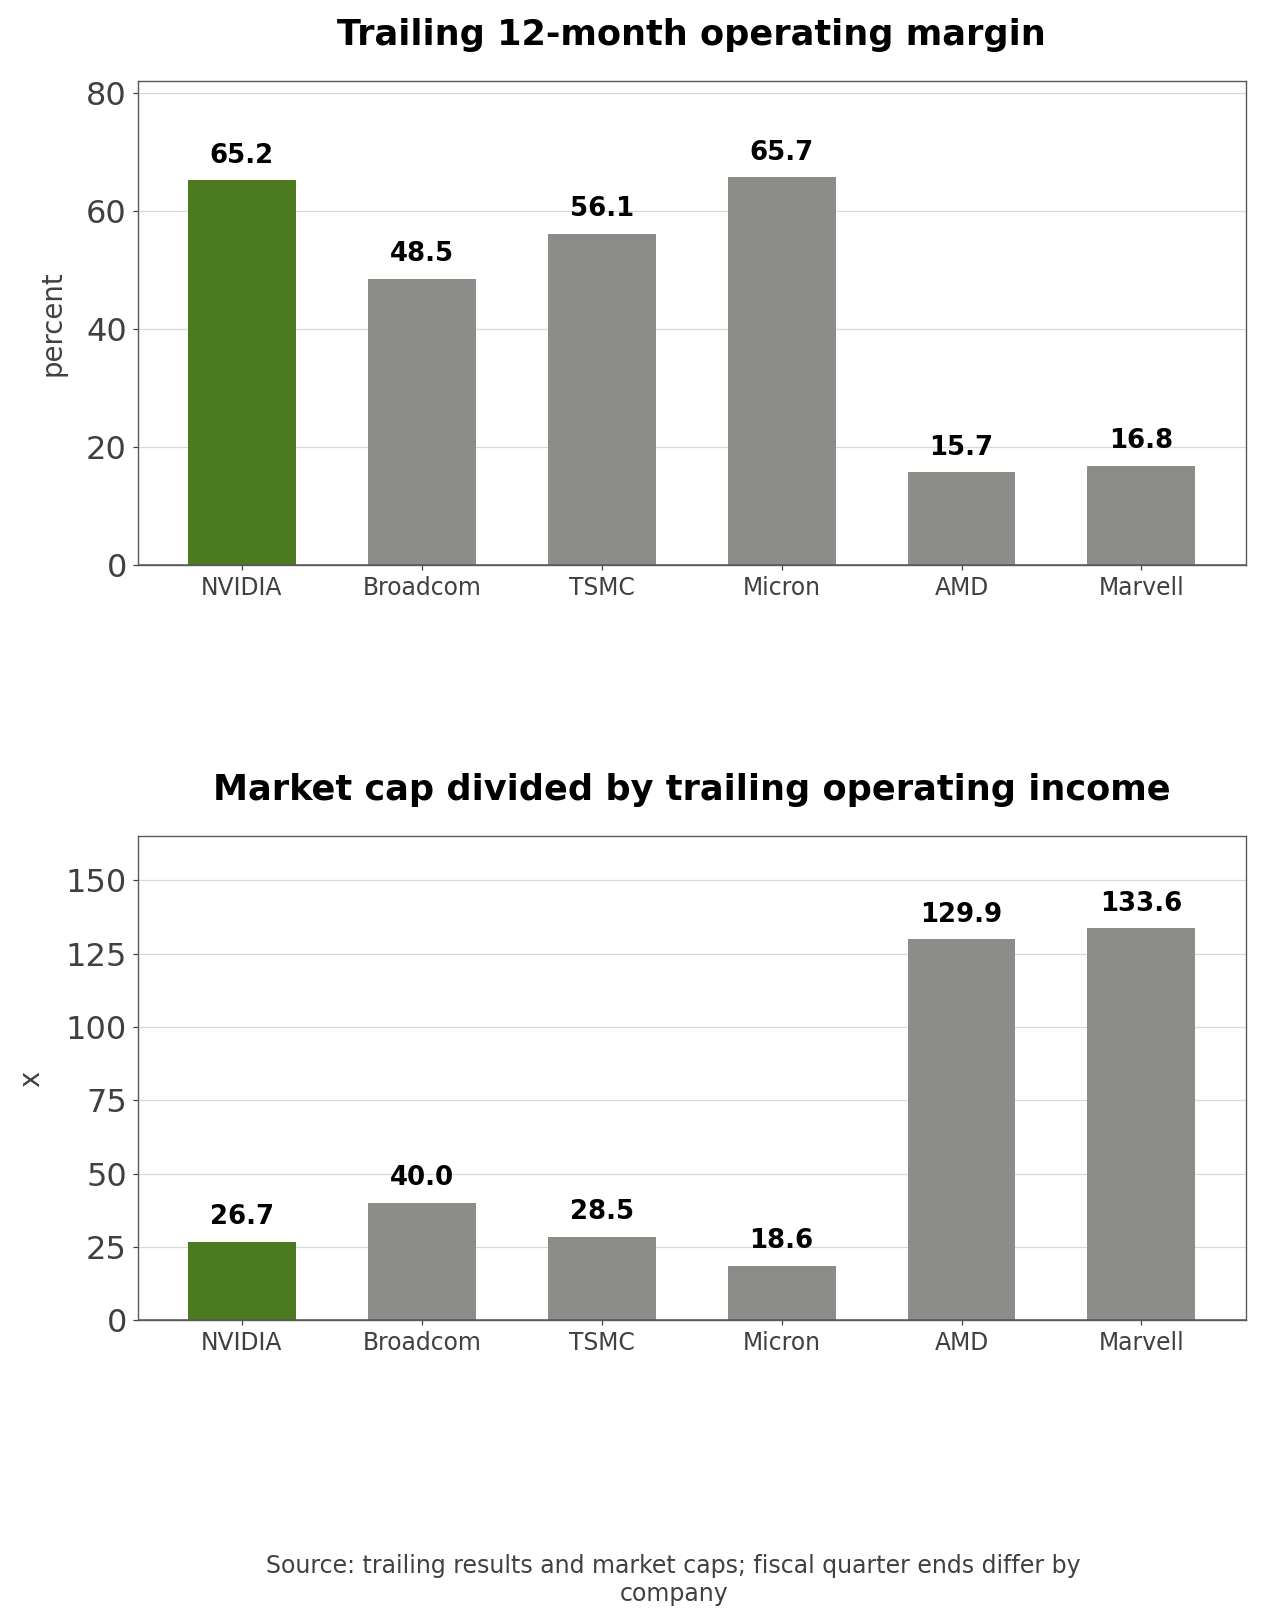
- The highest multiples belong to AMD and Marvell, whose margins in the teens leave small profits to divide into large market caps. Broadcom's 40.0x carries expectations for its custom accelerator business. Micron's 18.6x and 6.2x forward P/E sit in the middle of a memory price cycle that multiplied its profit in a year. NVIDIA shares Micron's margin bracket and TSMC's multiple bracket.
- The same table speaks to NVIDIA's costs. In the quarter NVIDIA cut its Q4 margin outlook on memory prices, Micron's trailing operating margin reached 65.7% and its revenue was 4.5 times a year earlier. With most of NVIDIA's $279 billion of supply commitments going to memory, the memory makers' margins sit on the other side of NVIDIA's cost line.
- The number of competitors and market share cannot be verified. NVIDIA names competitors in its 10-K but discloses no share data. When Arya asked about OpenAI's own chip on the call, Huang said many XPUs are "inference-specific chips for one cloud or one service" while "NVIDIA is a platform."
U.S. Computer Investment and Chip Production
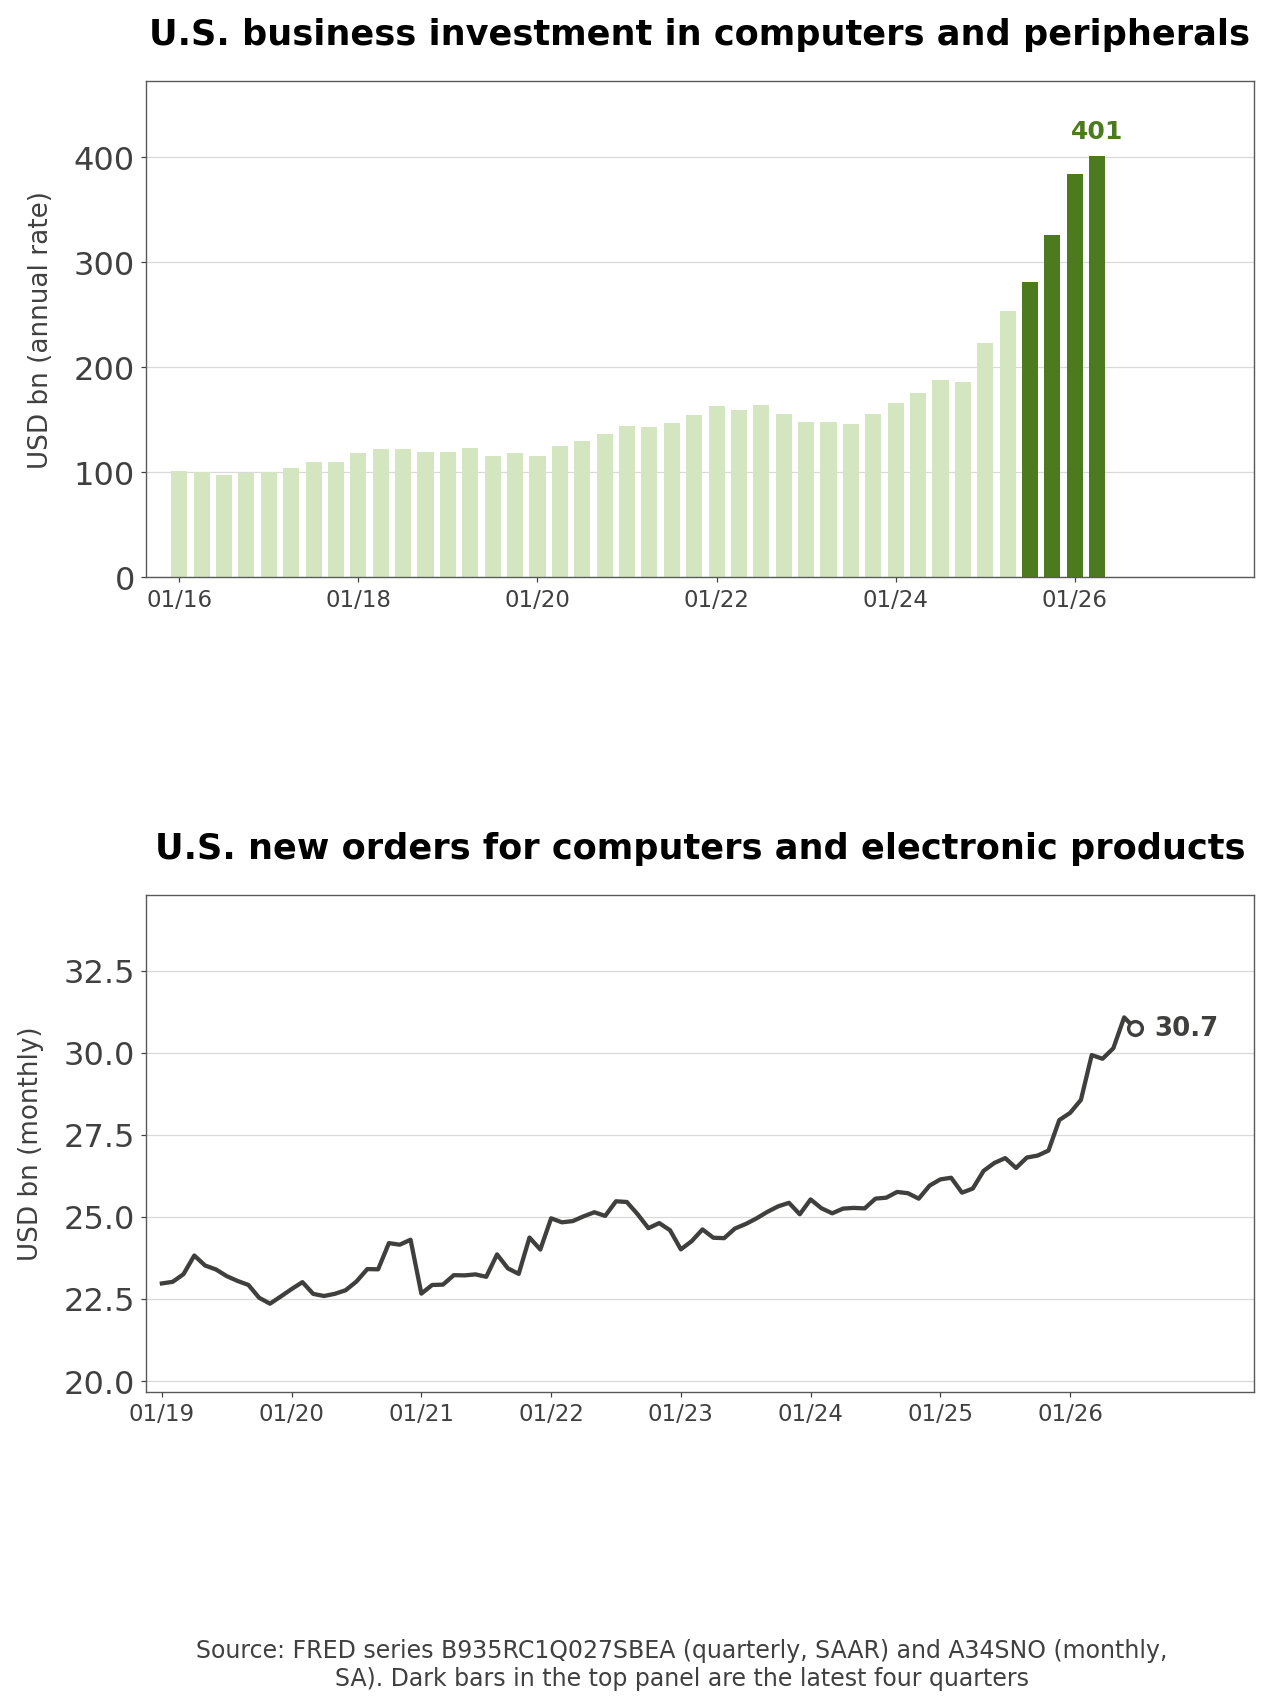
- Government statistics (FRED B935RC1Q027SBEA and A34SNO): U.S. private investment in computers and peripheral equipment ran at a seasonally adjusted annual rate of $400.6 billion in the second quarter of 2026, and U.S. new orders for computers and electronic products were $30.7 billion in July 2026.
- Computer investment is +57.9% from a year earlier and +22.8% a year over five years. After sitting between $100 billion and $190 billion from 2016 through 2024, it climbed from $280 billion to $400 billion in the latest four quarters, the same stretch in which NVIDIA's quarterly Data Center revenue passed $50 billion. New orders grew more slowly, +14.8% over a year.
- For scale, NVIDIA's Q2 Data Center revenue of $89.0 billion annualizes to $356.1 billion, 89% of the U.S. business computer investment rate. The populations differ, since 38% of NVIDIA's revenue comes from customers headquartered abroad and the statistic covers only U.S. businesses, but one company's revenue is now on the same order as a national investment series.
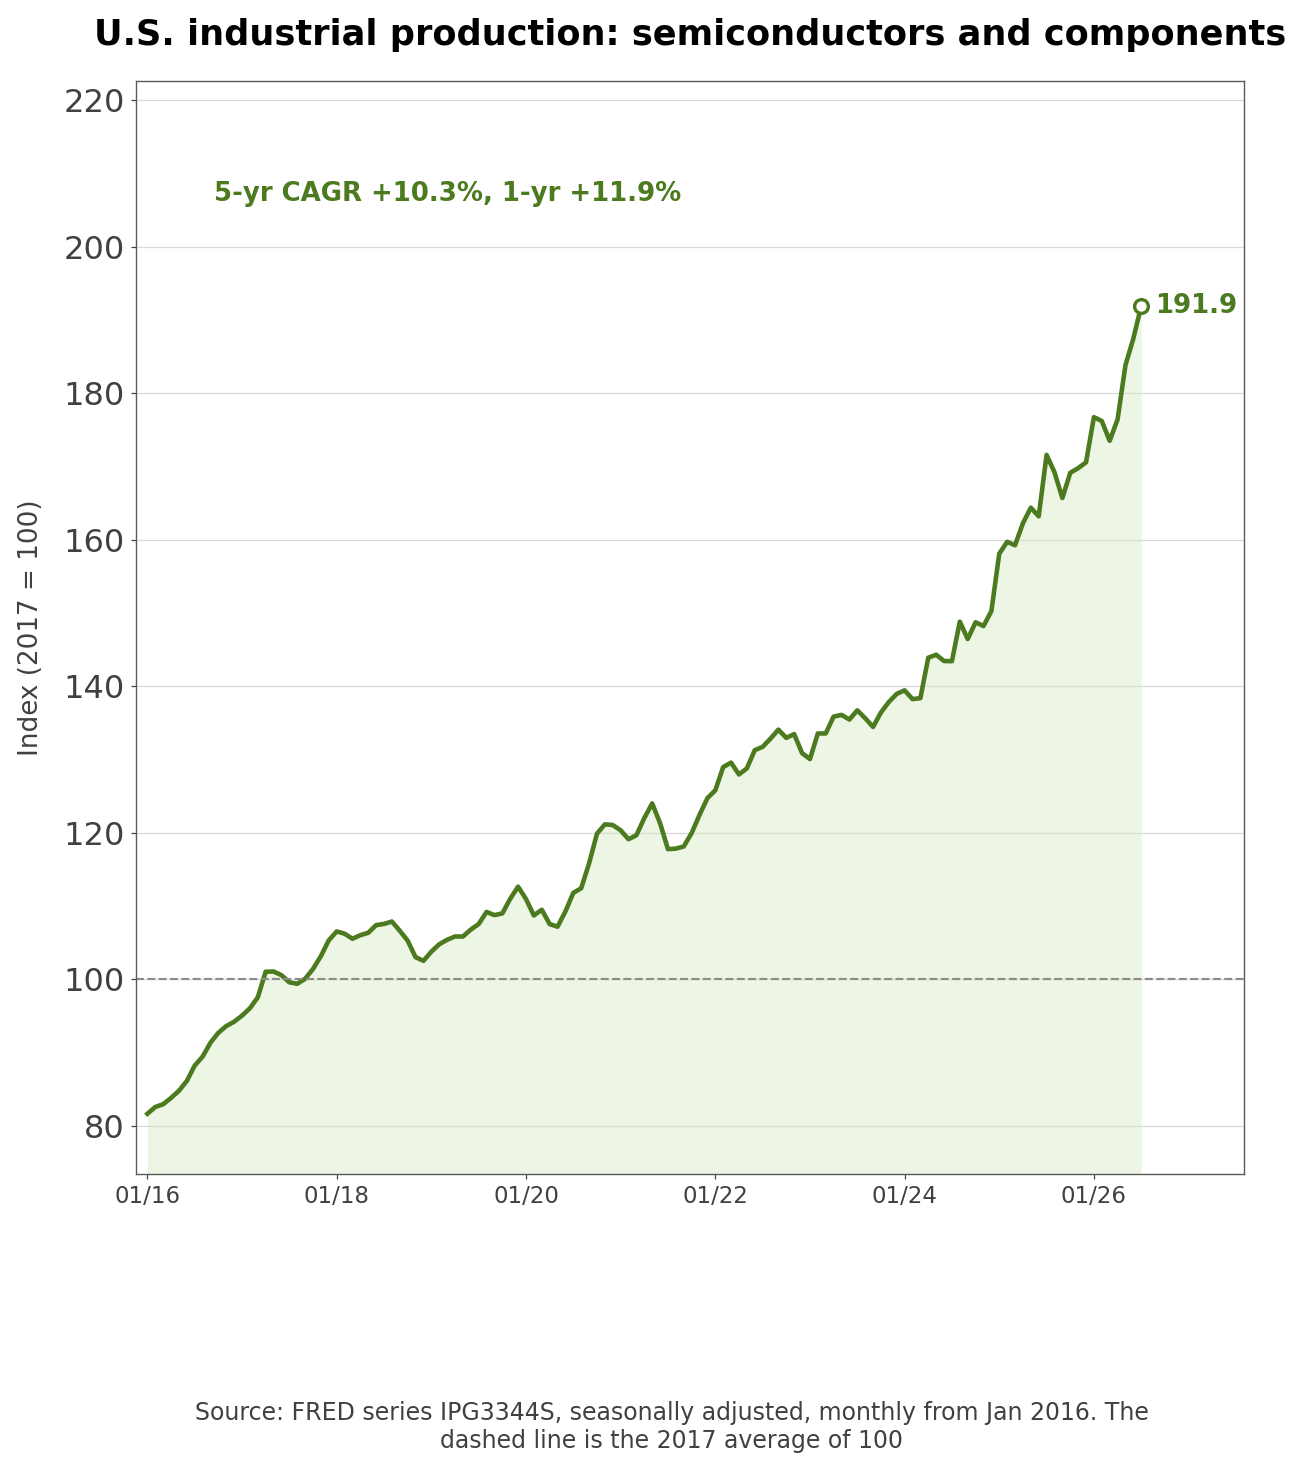
- The index is +11.9% from a year earlier, slower than the rise in computer investment. Investment dollars include higher equipment prices and hardware built overseas, which is why the two series diverge.
- Regulation is the other variable. The 10-Q flags China export licenses, a 25% tariff on licensed H200 shipments, the EU AI Act and new U.S. state AI laws. The Hugging Face 8-K added a risk factor on rules that could restrict open-source models, noting that "Many of the world's most popular and successful open-source models originated in China."
Conditions That Would Move NVDA Stock
| Scenario | Condition | Indicator to check | When · Source |
| Upside | DSO falls back below 50 days | Days sales outstanding | Q3 results in mid-November · CFO commentary |
| Downside | DSO stays above 60 days | Days sales outstanding | Q3 results · CFO commentary |
| Upside | Operating cash flow recovers to 0.8 times net income or more | Cash conversion | Q3 10-Q cash flow statement |
| Downside | Q4 gross margin comes in below 71% | Gross margin | Q4 results · earnings call |
| Downside | Supply commitments grow faster than revenue | Note 10 commitments | Q3 10-Q |
| Upside | OpenAI earns a rating that ends the guarantee | SB Energy guarantee terms | 8-K · 10-Q notes |
- The line that matters most is DSO. NVIDIA has disclosed extended payment terms as an ongoing condition, so a Q3 figure back under 50 days would support the view that Q2 was about contract timing, while a figure that stays above 60 would mean part of revenue is being carried by NVIDIA's own balance sheet.
What to Check Next in the OpenAI Guarantee
- The 8-K says NVIDIA would pay the gap between a guaranteed minimum lease value and recoveries, but it does not say what that minimum value is for each of the nine data centers or in which year the $105 billion cap would be reached. NVIDIA said the form of the agreements would be filed with the Q2 10-Q.
- The clause that ends the guarantee once OpenAI achieves "a satisfactory credit rating" limits NVIDIA's exposure, and it also means NVIDIA's credit supports OpenAI's lease terms until then. Shouldn't the first check be the exhibit's definition of a satisfactory rating and its phase-by-phase guarantee schedule?
Related Analysis
- TSMC (TSM) Stock: 60% Margins and Guidance It Keeps Beating
- Dell (DELL) Stock Analysis: Q2 FY2027 Earnings and Guidance
- Shopify (SHOP) Stock Analysis: Net Income vs. Equity Gains
Methodology and Sources
- The share price is $218.29 and the share count is the 24.1 billion shares on the cover of the Q2 10-Q.
- Financials come from the Form 10-Q for the second quarter of fiscal 2027, the SB Energy 8-K, and the CFO commentary, investor presentations, quarterly revenue trend sheet and call transcript in NVIDIA's quarterly results library. Annual meeting votes are from 8-K Item 5.07, ownership from Schedule 13G filings and the proxy, and fund holdings from 13F information tables.
- I built quarterly net income and operating cash flow from SEC XBRL data in code and checked each derived quarter against annual totals before building the bands from 60 month-end closes plus the latest price. I read all 15 earnings releases to pair each outlook with reported revenue. Industry data are FRED series B935RC1Q027SBEA, A34SNO and IPG3344S. Consensus figures are aggregated sell-side research, and quotes are taken verbatim from the call transcript, CFO commentary, presentations and filings.
#NVIDIA #NVDA #NVIDIAStock #NVDAStockAnalysis #AIChips #DataCenter #OpenAI #USStocks #StockAnalysis #EquityResearch #GlobalStockBrief
'US Stock Analysis' 카테고리의 다른 글
| Illumina (ILMN) Stock: What Is Left After Acquisitions (0) | 2026.09.20 |
|---|---|
| AutoZone (AZO) Stock: 36.3% ROIC and a 19.6x P/E (0) | 2026.09.17 |
| Lennar (LEN) Stock: 12.9% Incentives and a 0.89x P/B (0) | 2026.09.15 |
| Plug Power (PLUG) Stock Analysis: GAAP vs Operating Loss (0) | 2026.09.15 |
| Trip.com (TCOM) Stock Analysis: Antitrust Fine and Guidance (0) | 2026.09.14 |


