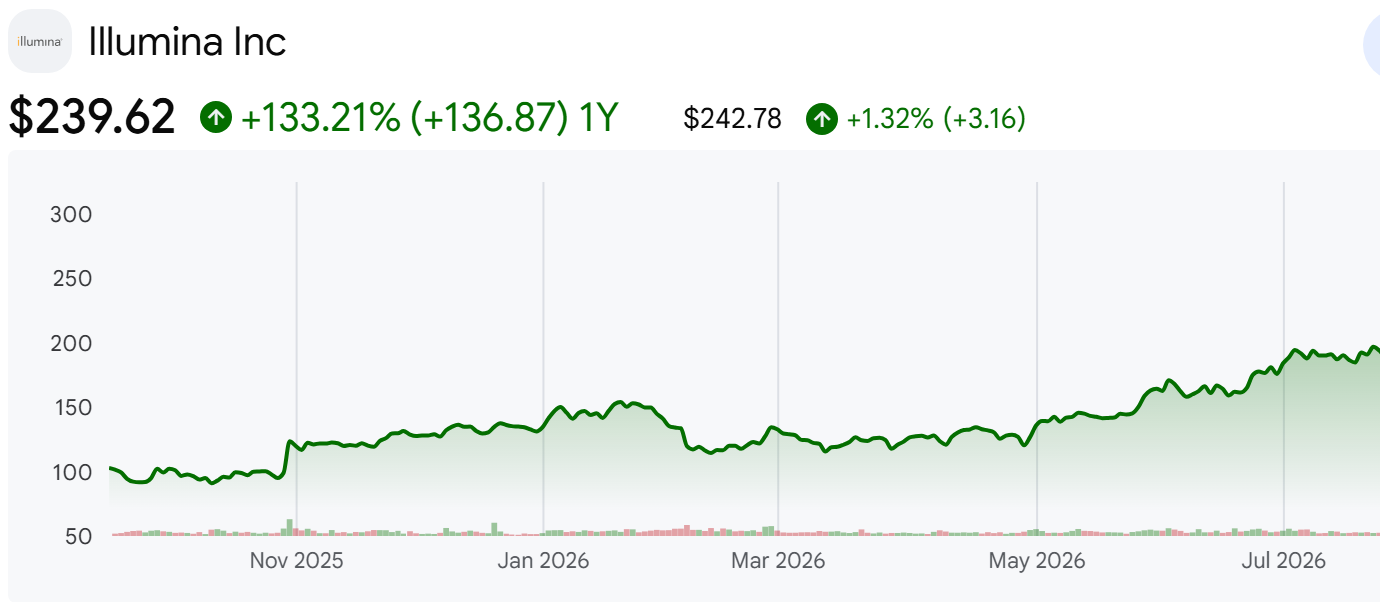
- Illumina (ILMN) is up 3.4 times in eighteen months. The stock traded at $71.20 in April 2025 and closed at $239.62, a market capitalisation of $36.18 billion. Over the same stretch the company's revenue went the other way: $4,526 million in 2021 down to $4,343 million in 2025.
- So this piece follows one number. In the second quarter of 2026 Illumina reported revenue growth of +9.5%. The company's own reconciliation takes 2.1 percentage points out for the business it bought in January and 0.9 points out for currency. What is left is 6.5%, and for the first half of the year it is 3.9%.
What the Q2 2026 Earnings Presentation Leads With
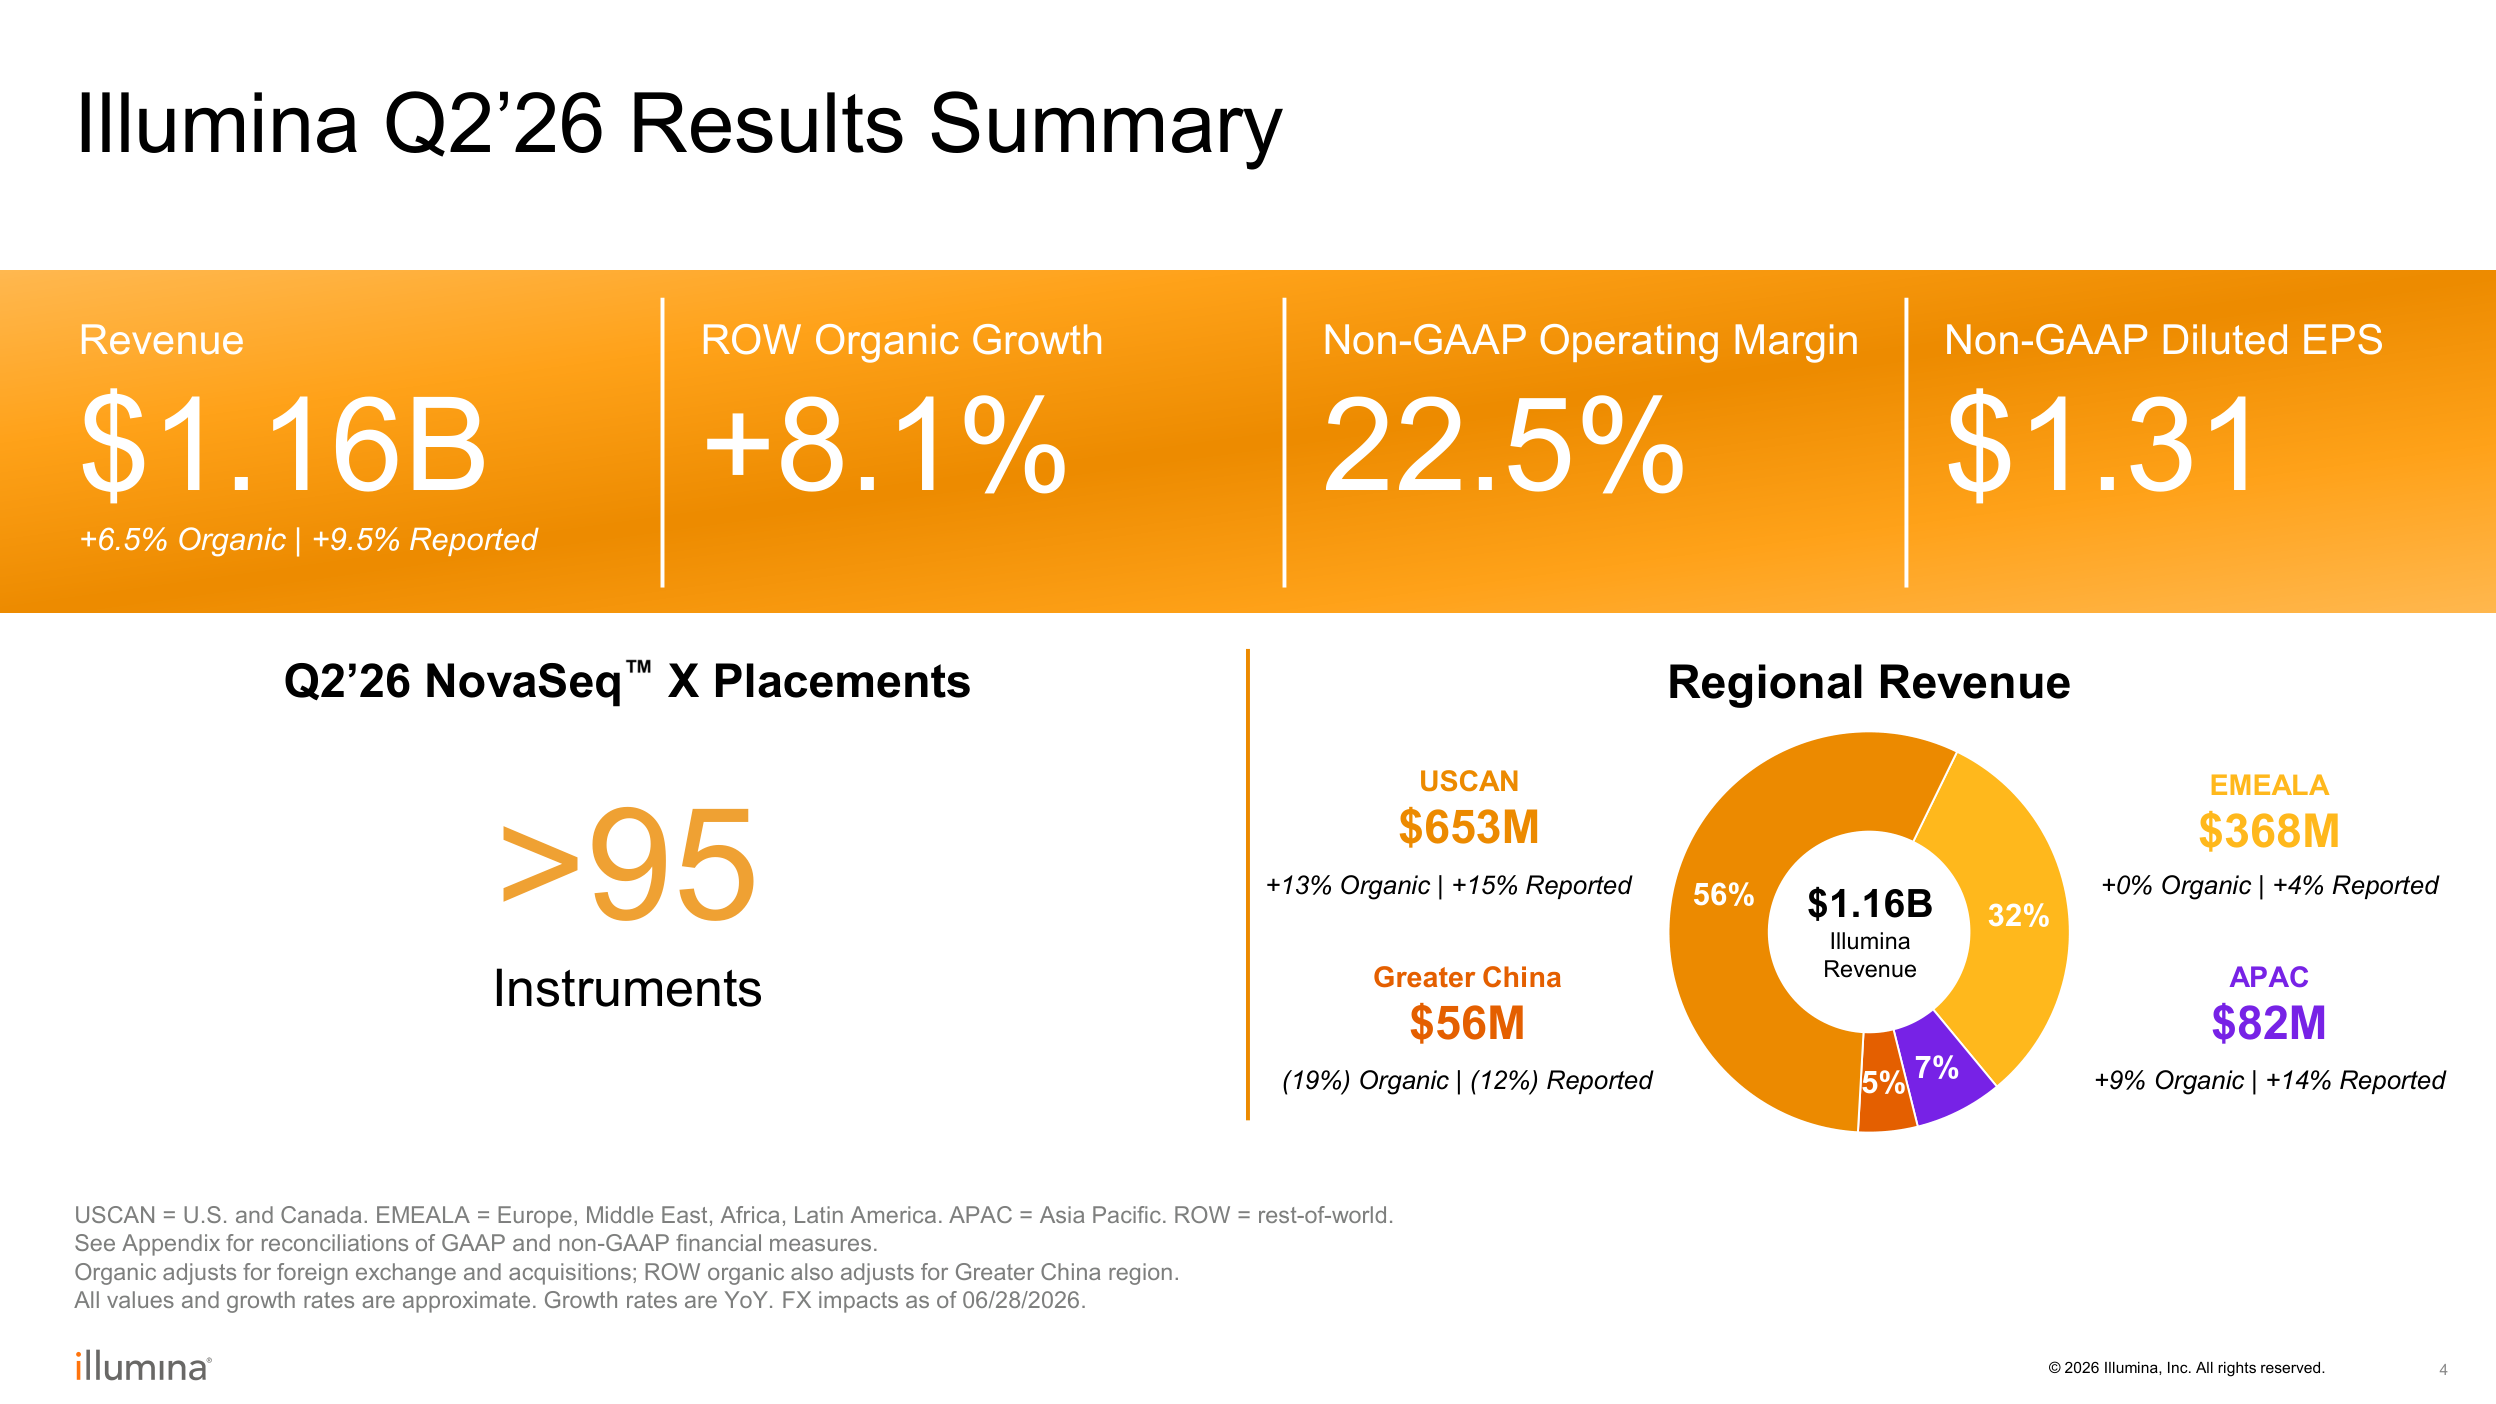
- The July 30 deck runs 22 pages and puts the quarter on page 4: revenue of $1.16 billion, a non-GAAP operating margin of 22.5%, non-GAAP diluted EPS of $1.31 and more than 95 NovaSeq X placements. The same quarter appears in the Form 10-Q for the period ended June 28, 2026, where revenue is $1,159 million and operating income is $245 million, a GAAP operating margin of 21.1%. The 1.4-point gap between the two margins is what the company excludes.
- The deck's order carries information of its own. Pages 3 and 5 introduce the chief executive and the chief financial officer, and the revenue detail starts on page 6. What page 4 leads with is not the revenue number but the growth rate, and the growth rate it chooses is the one adjusted for acquisitions, currency and China.
- Regional figures sit on the same page. The US and Canada delivered $653 million at +13% organic, EMEALA $368 million at 0%, APAC $82 million at +9%, and Greater China $56 million at -19%. One region lifts and another takes away.
- On page 10 of the same deck, non-GAAP gross margin fell from 69.4% to 68.2% and non-GAAP operating margin from 23.8% to 22.5%, while non-GAAP diluted EPS rose from $1.19 to $1.31. Margins down, per-share earnings up, in the same quarter.
- Page 6 splits revenue three ways: total revenue of $1,159 million against $1,059 million a year ago, sequencing consumables of $734 million against $690 million, and the total excluding China at $775 million against $740 million. Every line carries both a reported and an organic figure, which means the company works with two yardsticks at once and expects readers to do the same.
- Page 8 tracks the instrument transition. High-throughput volume running on NovaSeq X reached 59% in the quarter, from 27% two years earlier. The deck presents this as progress, and it is, but a cheaper read per base also means each experiment bills less.
Guidance Set Below the Quarter
- Page 12 carries the full-year outlook: revenue of $4.60 billion to $4.64 billion, organic growth above 4.0%, a non-GAAP operating margin of 23.4% to 23.6% and EPS of $5.30 to $5.40. For the third quarter the company guides to $1.14-$1.16 billion of revenue and organic growth of roughly 4.5%.
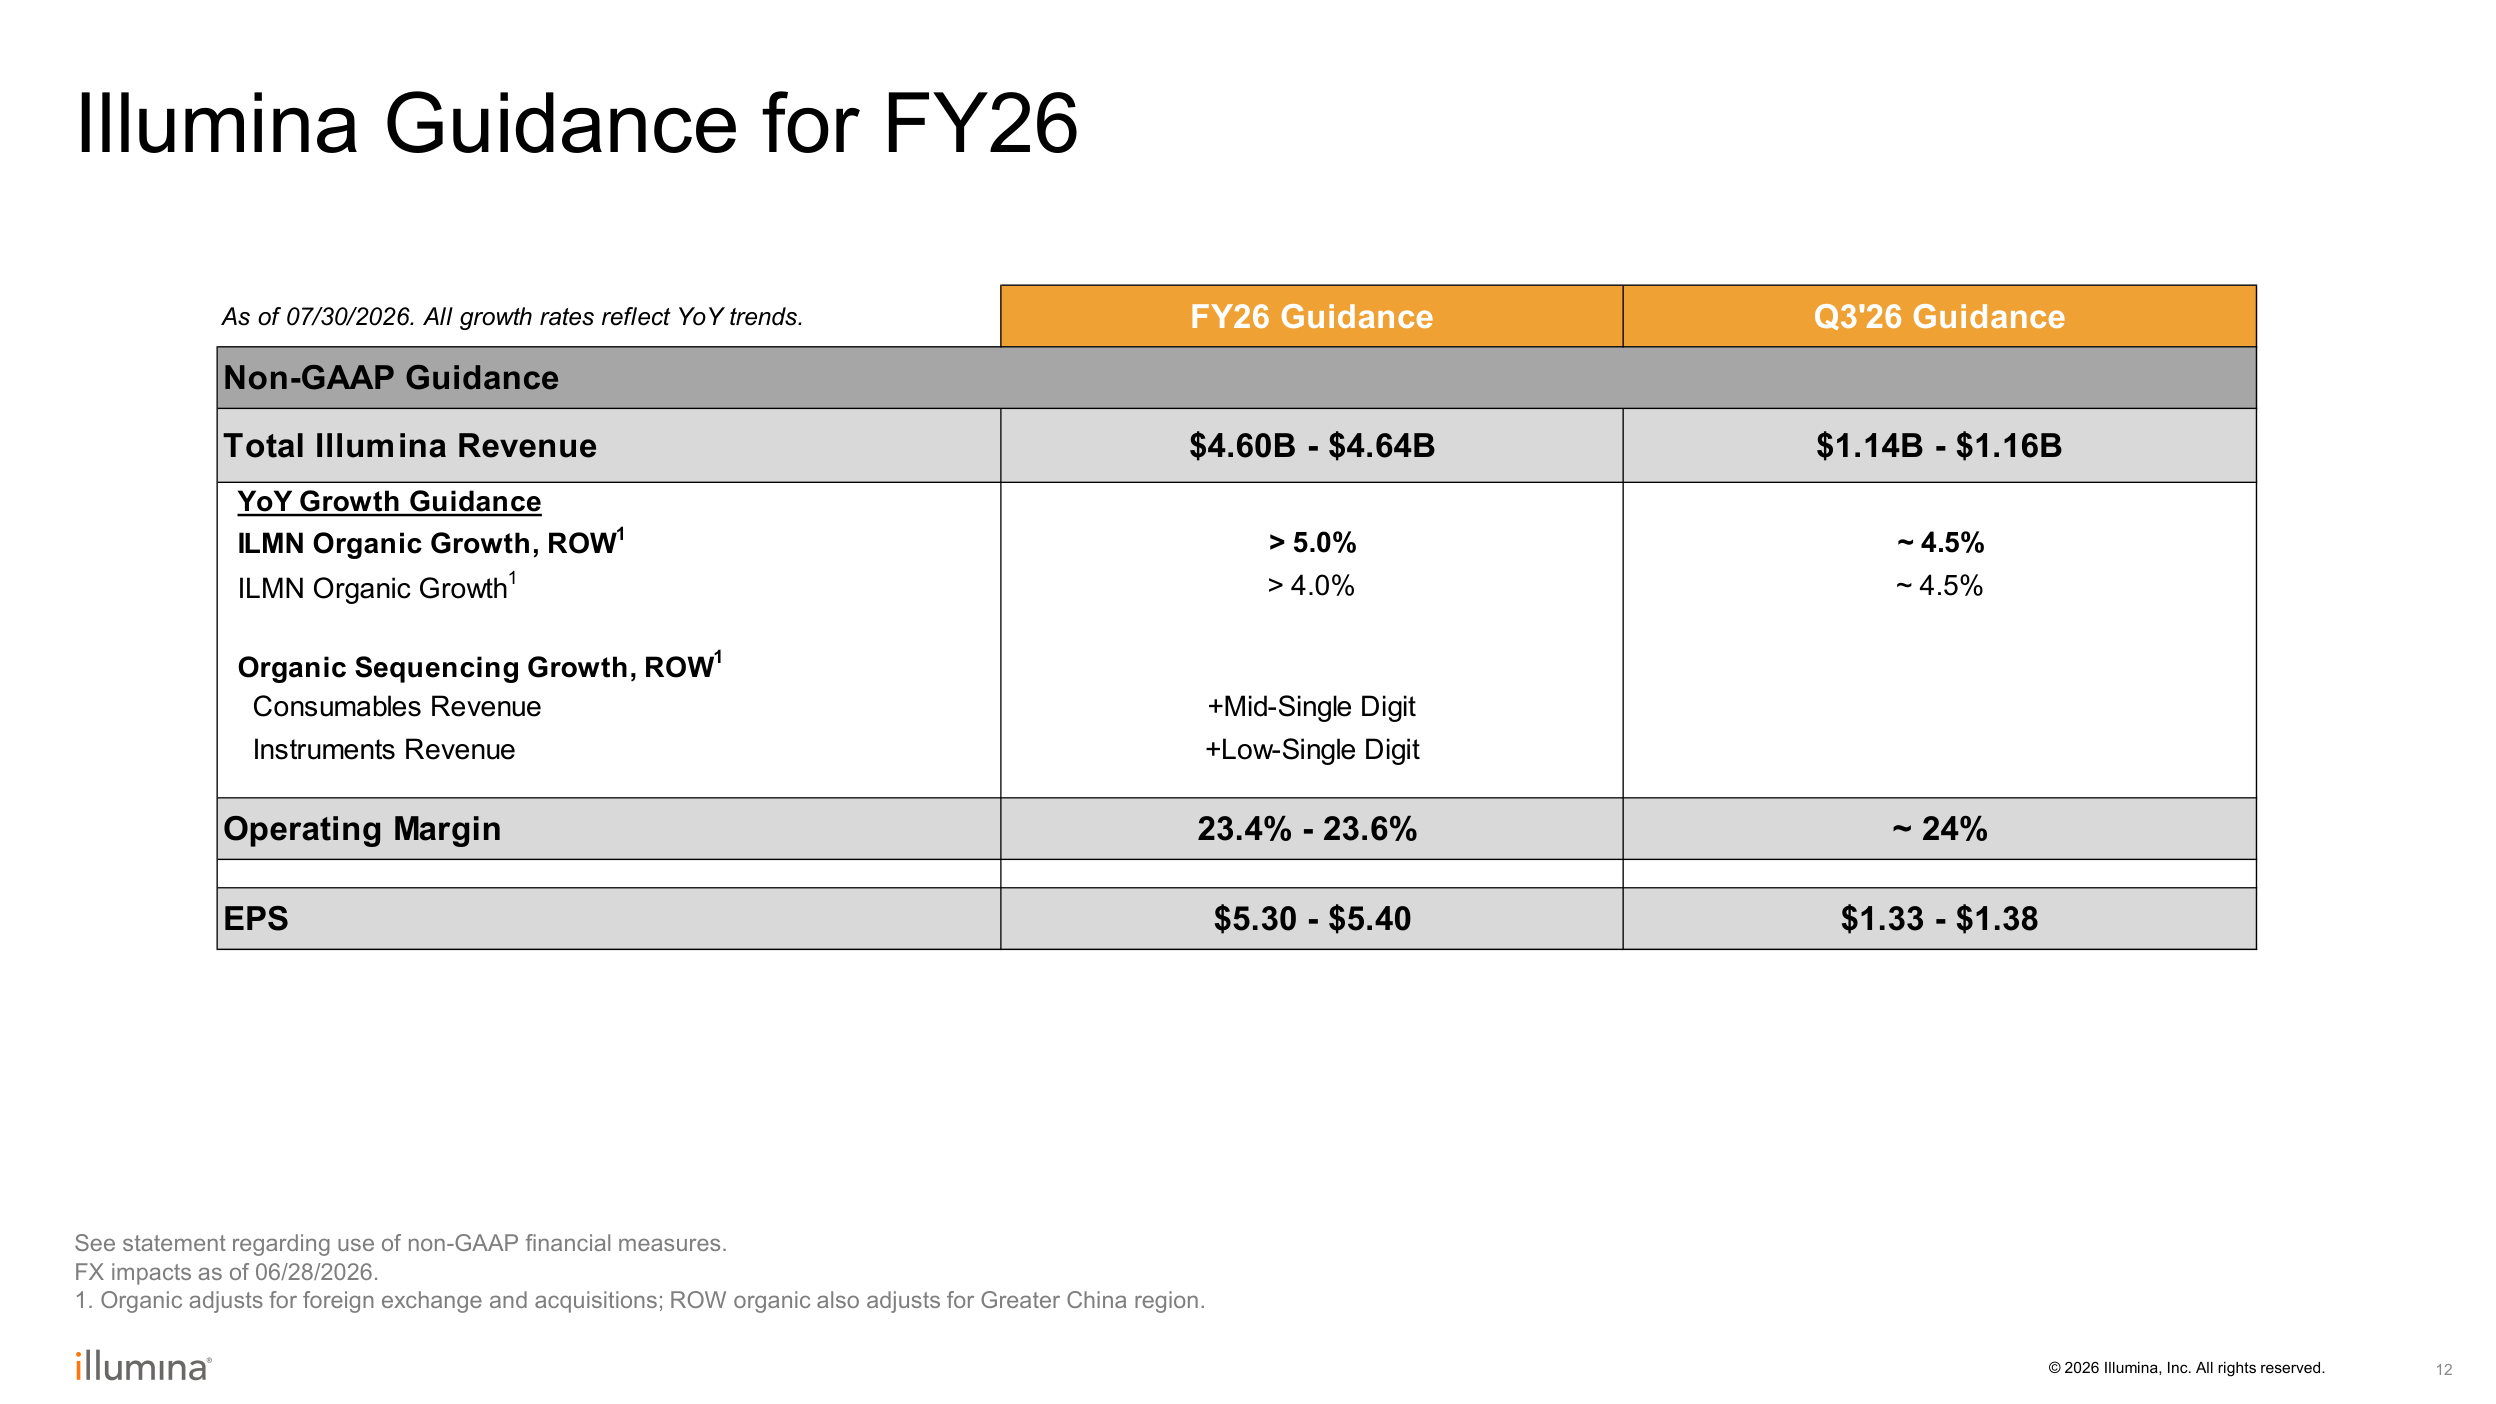
- That 4% annual figure sits below the 6.5% organic growth just reported, which says the company does not expect the pace to pick up in the second half. Against a share price of $239.62, the midpoint of the EPS range works out to 44.8 times.
Cash and the Buyback
- Page 11 covers cash. Operating cash flow of $201 million, capital expenditure of $39 million and free cash flow of $162 million for the quarter. Cash and short-term investments stand at $1.17 billion against total debt of $1.99 billion, and gross leverage is 1.6 times trailing EBITDA.
- Total debt of $1.99 billion against $1.17 billion of cash puts net debt near $820 million, which is modest next to a $36 billion market value. Leverage of 1.6 times is well inside the covenant range of the new credit agreement signed in August.
- The same page records the buyback: 0.94 million shares at an average of $129.07, for $122 million. That average purchase price is 54% of the $239.62 share price. What the company paid and what the market now asks differ by almost half.
The Growth Bridge the Company Prints Itself
- Page 16 of the deck walks the growth rate down step by step. The table is the company's own, prepared because organic growth is a non-GAAP measure.
- Company disclosure (Q2 2026 earnings presentation, page 16): reported second-quarter revenue growth of 9.5% less 2.1 points from acquisitions and 0.9 points from currency leaves organic growth of 6.5%. Adding back 1.6 points for China produces the 8.1% figure the deck prints in large type on page 4. For the first half, reported growth of 7.2% less 1.9 points and 1.4 points gives organic growth of 3.9%.
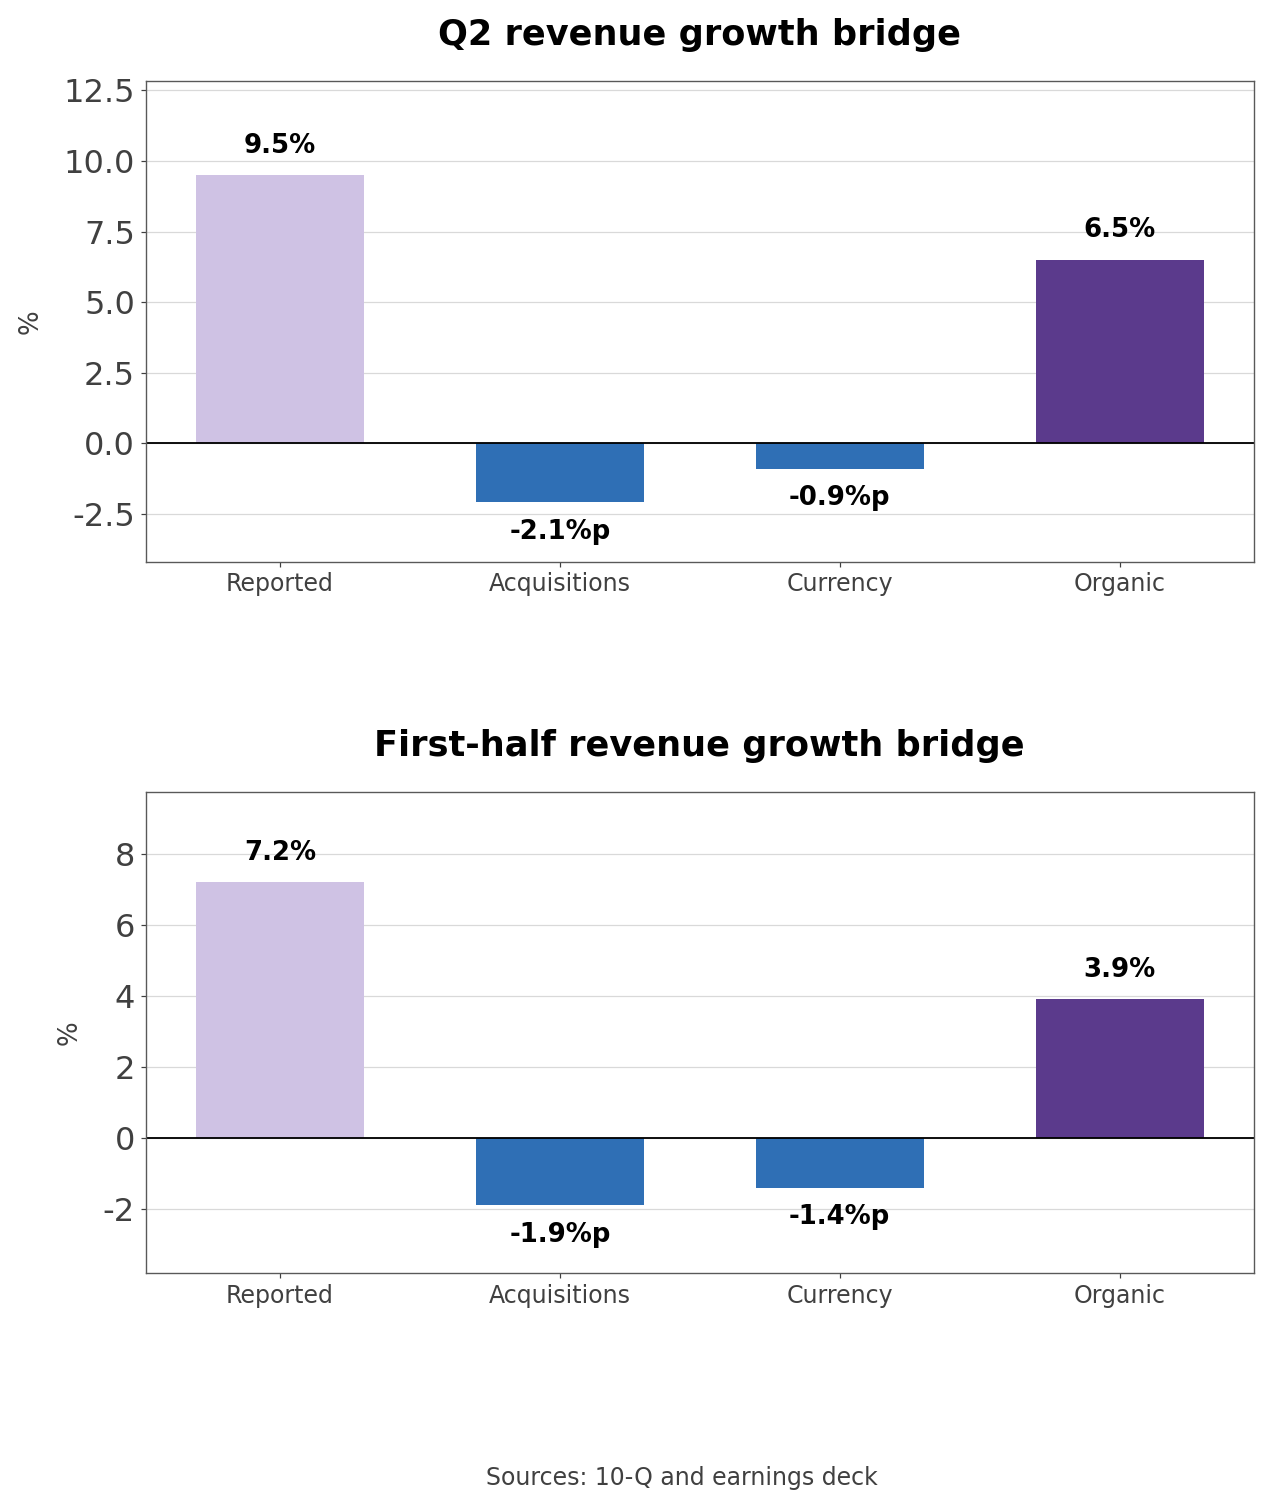
- Four numbers describe one quarter. The 9.5% is what an investor sees first. The 8.1% is what the company puts on the summary page. The 6.5% is what remains after acquisitions and currency. The 3.9% is the same calculation across six months. None of them is wrong, and that is the point.
- The acquisition effect has a name. Illumina completed the purchase of SomaLogic on January 30, 2026, which is also why the first-half contribution is 1.9 points rather than 2.1: the first quarter only carried two months of it. The effect disappears from the comparison in the first quarter of 2027.
What the Market Bought and What the Filings Say
- The story that carried the stock up runs roughly like this. The loss-making business is gone, the losses have stopped, margins have recovered, so the company deserves a growth multiple again.
- Part of that checks out. Net income of $850 million in 2025 was the first profit in three years. The GAAP operating margin has climbed from 15.8% to 21.1% across the quarters. What does not check out is the growth. Company guidance is above 4% organic for the year and the first half came in at 3.9%. A trailing P/E of 44.6x asks for something faster.
Five Years of GRAIL
- In August 2021 Illumina closed its purchase of GRAIL without regulatory clearance. GRAIL developed early cancer detection tests and had been spun out of Illumina in the first place.
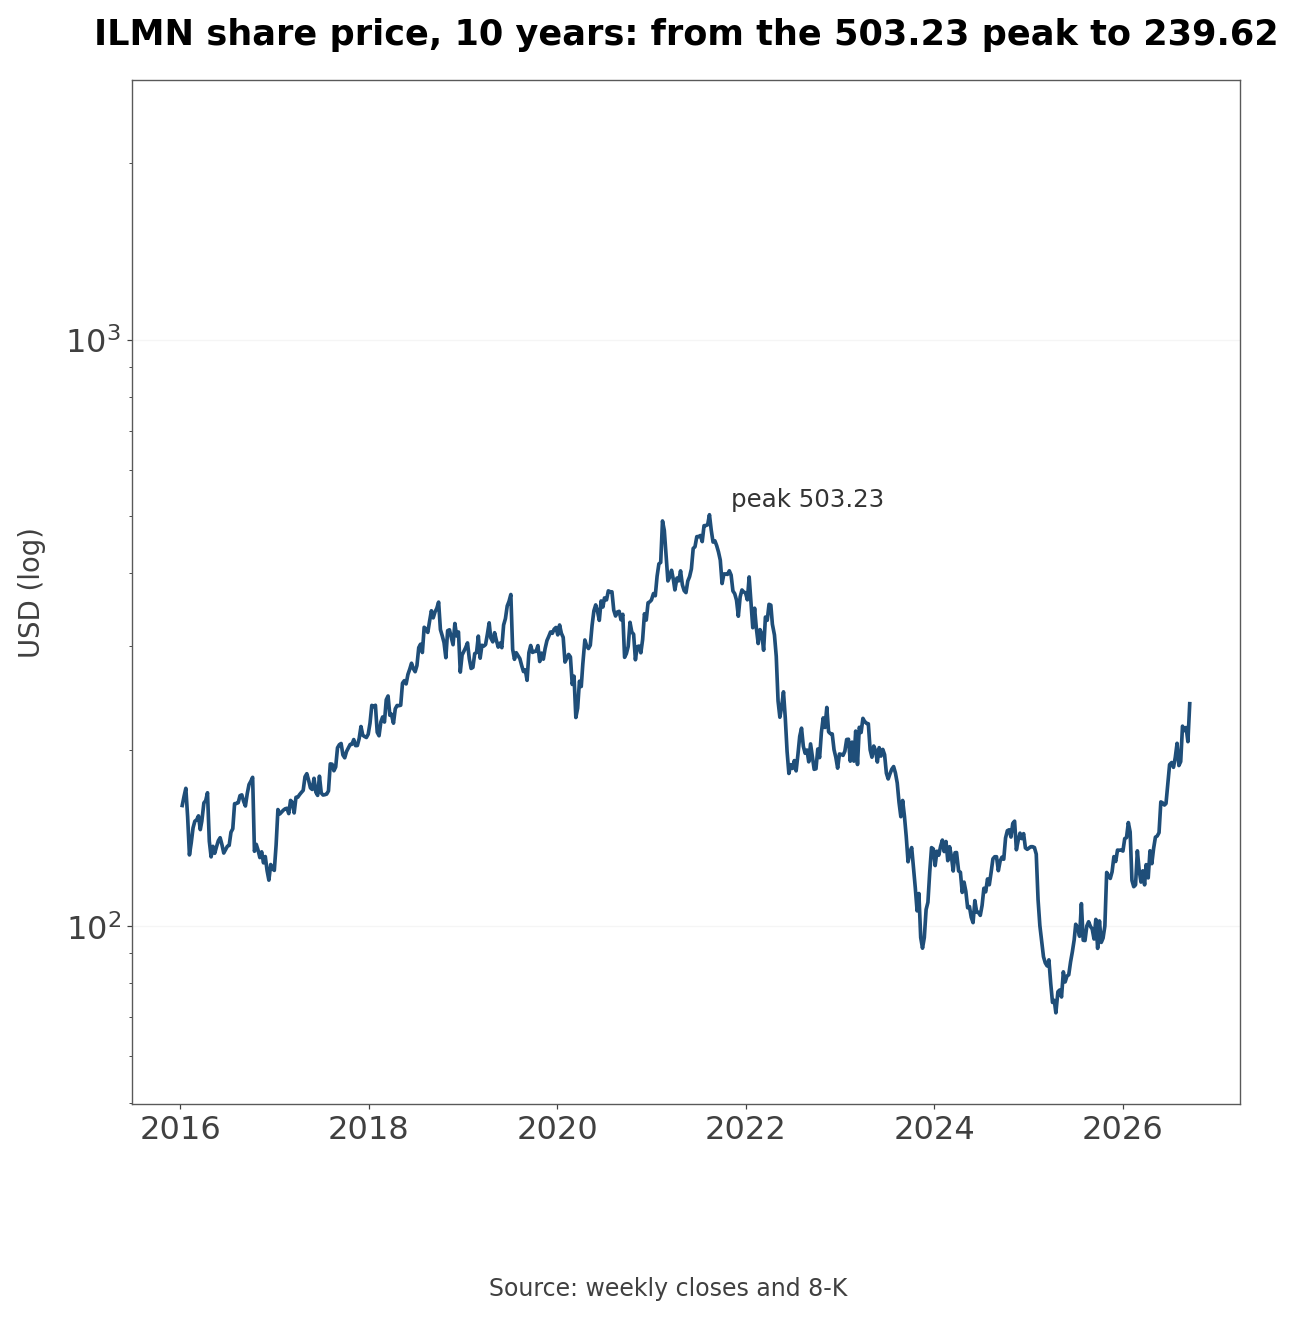
- What followed sat in the income statement as impairment. Net losses of -$4,404 million in 2022, -$1,161 million in 2023 and -$1,223 million in 2024 add to $6,788 million. Stockholders' equity fell from $10,740 million at the end of 2022 to $1,436 million in the second quarter of 2024, the quarter the spin-off completed.
- Filing note (8-K dated August 7, 2026): the derivative suit Icahn Partners brought against former chief executive Francis deSouza and eight directors in the Delaware Court of Chancery has been settled. The case concerned the GRAIL acquisition and the defendants admitted no wrongdoing. That is five years after the decision and two years after the spin-off.
- Revenue did its own thing through all of it: $4,526 million in 2021, then $4,584 million, $4,504 million, $4,372 million and $4,343 million. Down 4.0% over five years. The impairments erased the value of a business the company bought; the flat revenue happened in the business it already had.
- With the cleanup finished, Illumina started buying again. SomaLogic, closed on January 30, brings aptamer-based protein measurement, and the consideration was $460 million: $382 million of cash plus $81 million of contingent consideration at fair value, less $3 million for a pre-existing relationship. This time the accounting is a business combination, so the price lands in intangibles and goodwill rather than passing straight through the income statement.
Where Did the 9.5% Come From?
- The quarterly revenue line runs $1,104 million in the fourth quarter of 2024, then $1,041 million, $1,059 million, $1,084 million and $1,159 million through 2025, then $1,091 million and $1,159 million in 2026.
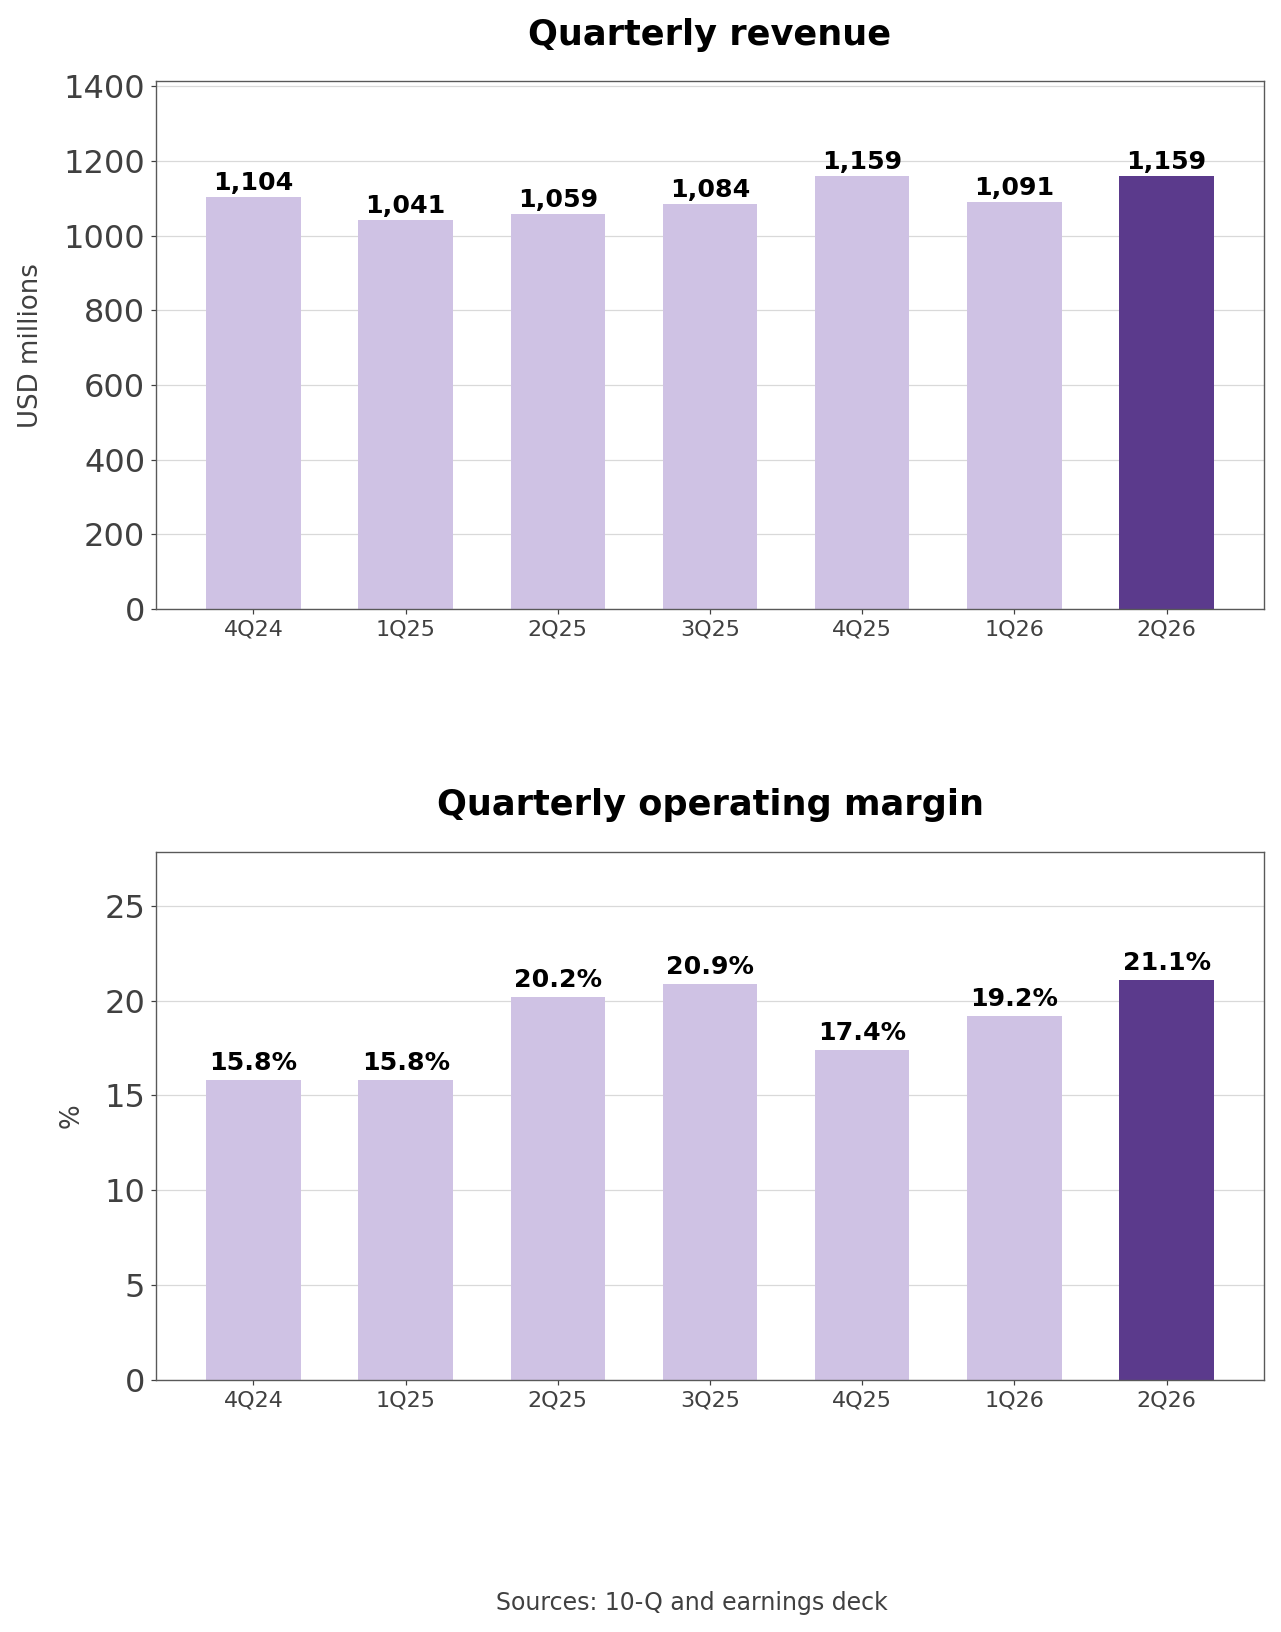
- Year on year the quarter added $100 million, from $1,059 million to $1,159 million. SomaLogic accounts for 2.1 points of that, roughly $22 million. Currency accounts for 0.9 points, about $9.5 million. Strip both and something over $68 million came from the business as it already stood.
- Own calculation (quarterly revenue and the company bridge): of the $100 million increase, the 3.0 points from acquisitions and currency work out to roughly $32 million. Across the first half the same two items account for 3.3 points of 7.2%, so the share is larger.
- By region the directions diverge. The US and Canada grew 13% organically while Greater China fell 19%. China is $56 million of quarterly revenue, and the company reports it separately for exactly this reason: excluding it lifts organic growth from 6.5% to 8.1%.
Margin Down and EPS Up in the Same Quarter
- Non-GAAP operating margin fell from 23.8% to 22.5% and gross margin from 69.4% to 68.2%. Non-GAAP diluted EPS rose 10%.
- The denominator moved. Illumina repurchased 0.94 million shares for $122 million during the quarter under the programme authorised in August 2024, and has a further programme available. Fewer shares means the same earnings divide into a larger per-share number. The 0.94 million shares are 0.6% of the 151 million outstanding; at that pace it is a little over 2% a year.
- On a GAAP basis the margin itself has improved, from 15.8% in the first quarter of 2025 to 21.1% in the second quarter of 2026. Part of that is the absence of restructuring: $39 million of charges in the first half of 2025 became zero in the first half of 2026. How far a margin built on cost removal can travel is the next question, and gross margin starting to slip is the part worth watching.
Why Only 8% of the Market Value Sits on the Books
- Stockholders' equity at quarter end was $2,838 million, which is 7.8% of the $36.18 billion market capitalisation.
- Own calculation (quarterly filings and month-end prices): against that equity the price-to-book ratio is 12.9x, where the five-year median is 5.3x. The ratio is high because the denominator is thin, so it reads better as a record of how much capital was written off than as a valuation measure.
- The debt side moved in August. Filing note (8-K dated August 12 and 17, 2026): Illumina sold $300 million of 4.950% notes due September 19, 2029, and expects to use the proceeds with cash on hand to repay the 4.650% notes maturing on September 9, 2026, of which $500 million was outstanding. On August 13 the company entered a new $1.0 billion five-year unsecured revolving credit facility, terminated the existing agreement, and kept an option to add up to $500 million more.
What Illumina Sells
- The products are instruments that read DNA sequences and the consumables those instruments consume. Sell an instrument once and reagents and flow cells follow for years, which is why most of the revenue is consumables rather than hardware.
- Customers fall into two groups. One is research: universities, government laboratories and pharmaceutical R&D. The other is clinical: hospitals and diagnostic laboratories. The company splits its revenue reporting along that line because the two budgets move on different logic. Research spending follows government appropriations and venture funding; clinical volume follows test counts and reimbursement.
- The applications that matter most are oncology and reproductive health: finding the mutations that guide a cancer treatment, and screening maternal blood for foetal chromosomal conditions. Agriculture and infectious disease surveillance sit alongside. The company employs about 8,600 people and is based in San Diego.
- Company disclosure (Q2 2026 earnings presentation, page 7): second-quarter sequencing consumables revenue was $734 million against $122 million of instruments. For 2025 as a whole it was $2,750 million of consumables against $449 million of instruments. Service and other revenue makes up the rest of the $1,159 million quarter.
- Growth splits by customer type on the same page. Clinical consumables grew +15% excluding China while research and applied fell -7%. The direction held all year: 2025 finished at +12% against -7%, and 2026 has run +20% against -12% in the first quarter and +15% against -7% in the second. Hospitals are using more and laboratories are using less, and proposed cuts to National Institutes of Health funding appear in the 10-Q risk factors.
The Life of One Instrument
- The economics come down to how much consumable revenue one instrument pulls through over its life. In 2025 that was $2,750 million of consumables against $449 million of instruments in a single year, and instruments last several years.
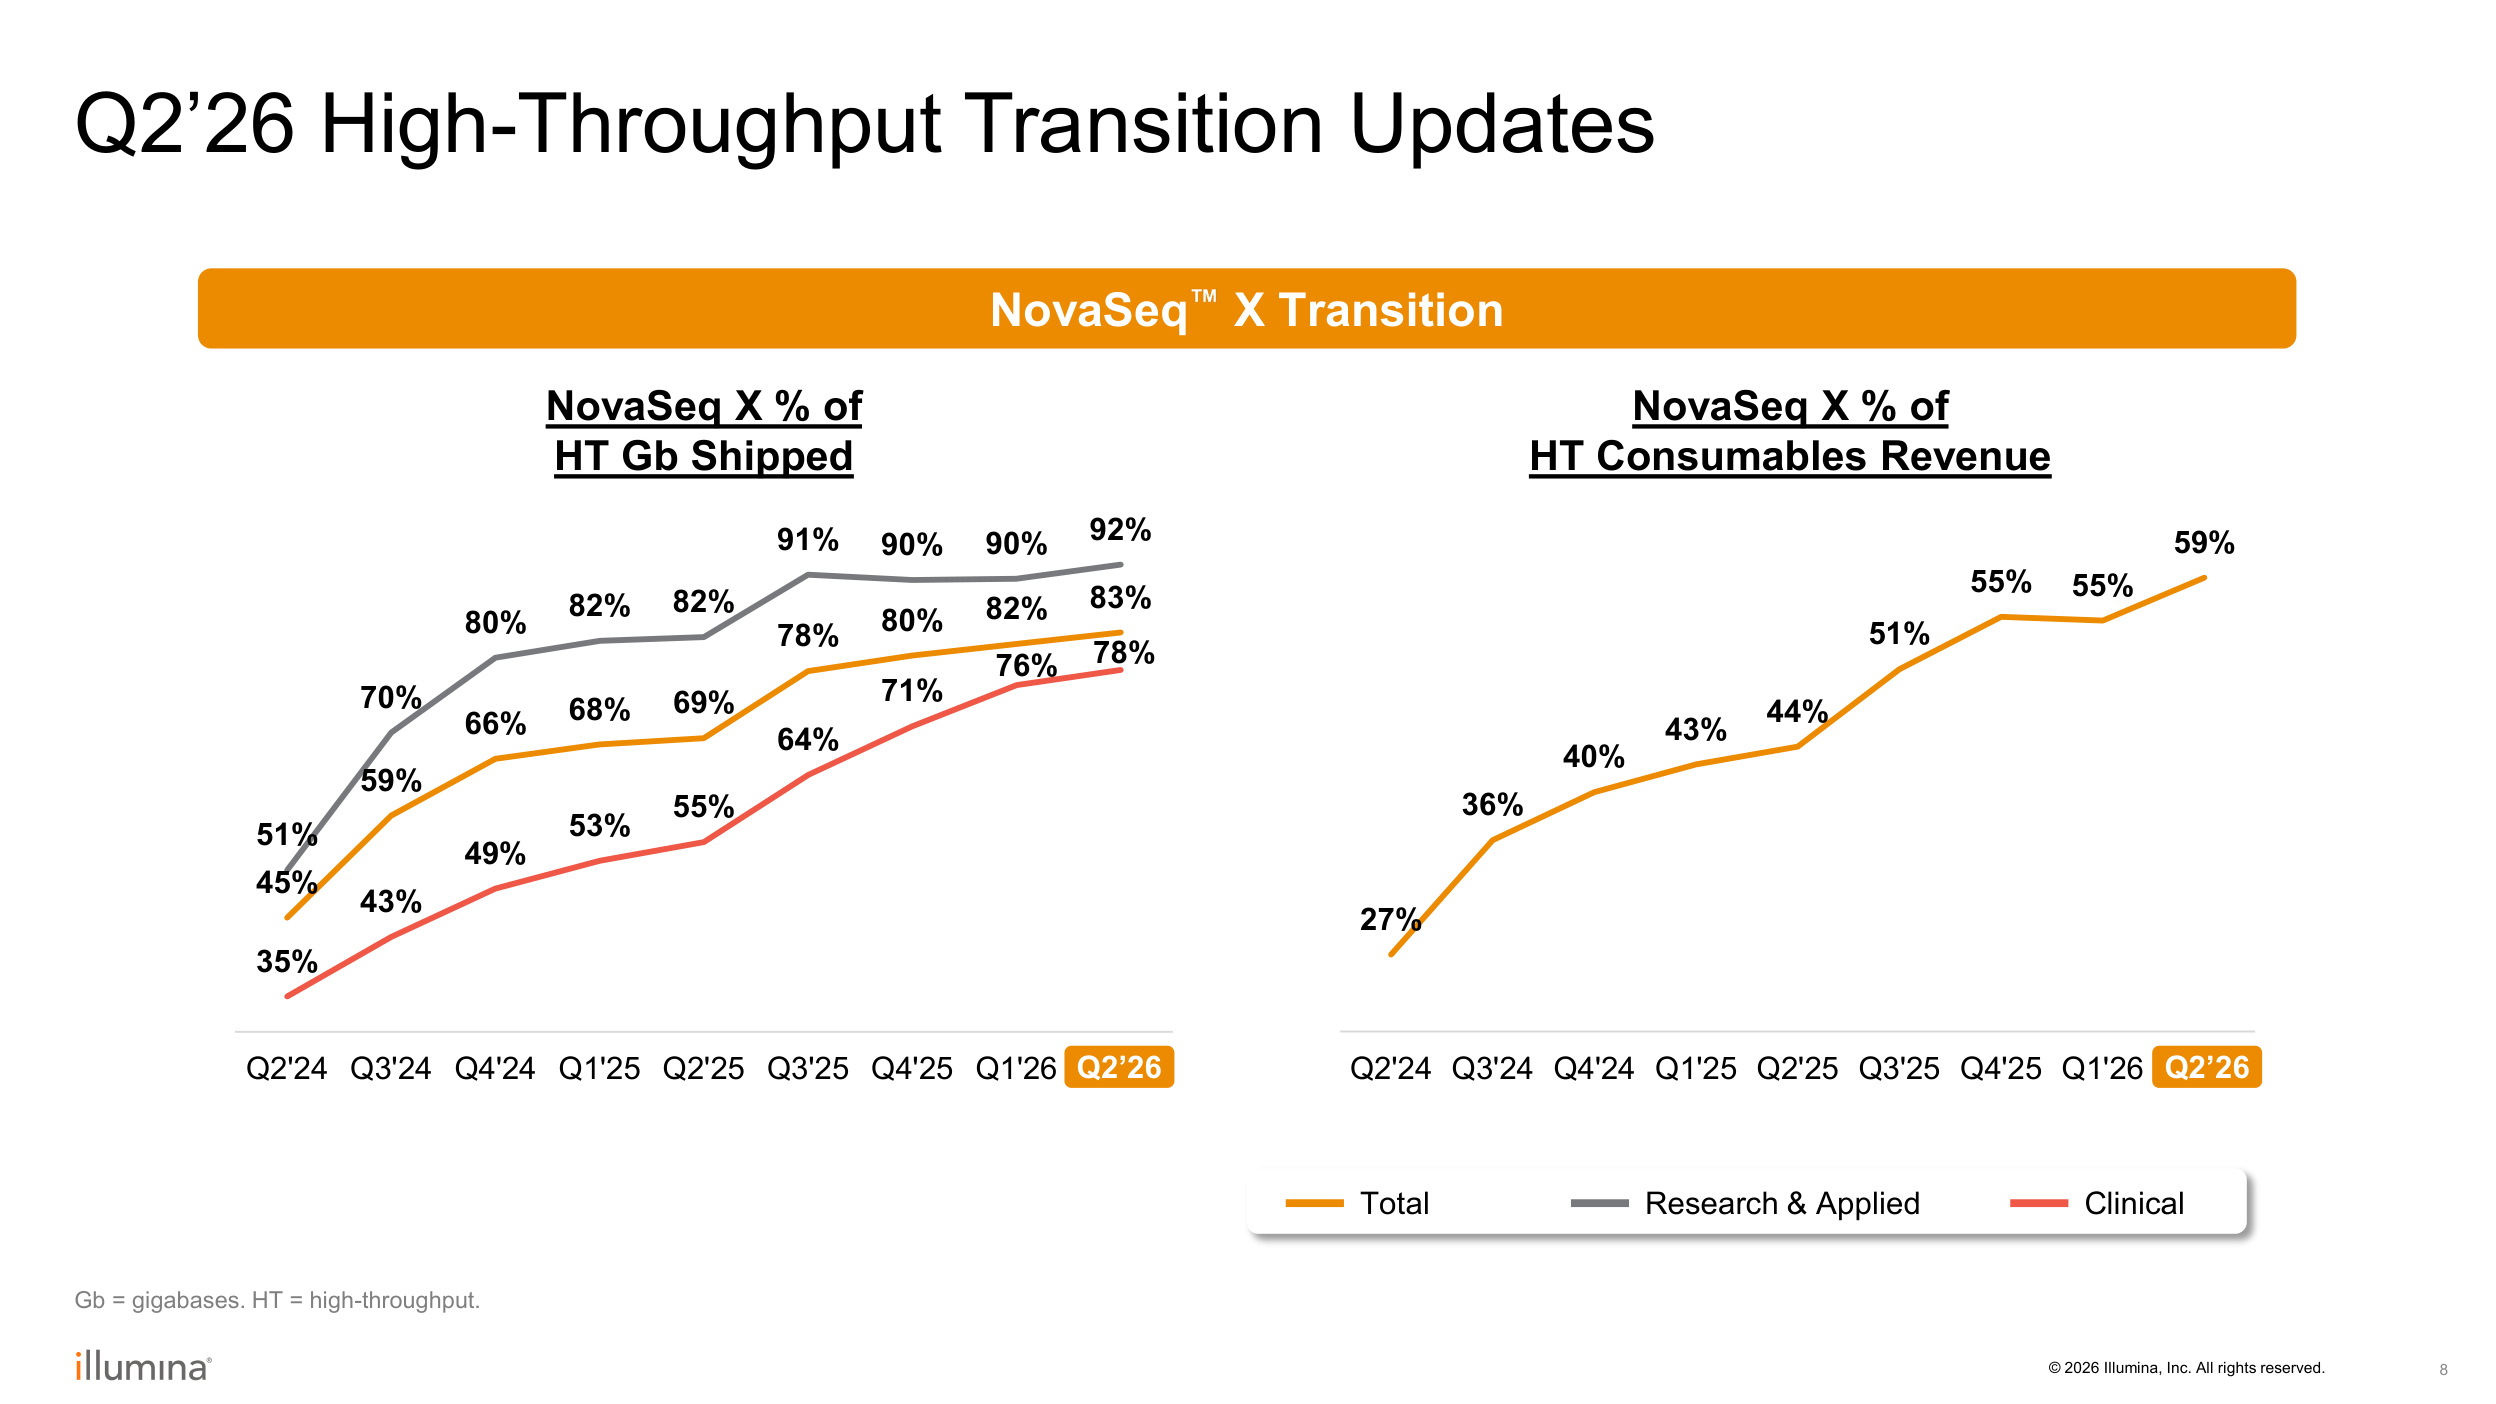
- The problem is the rate of recovery. NovaSeq X reads a base far more cheaply, so the same experiment costs the customer less. High-throughput volume on the new platform went from 27% in the second quarter of 2024 to 59% in the second quarter of 2026, and consumables revenue has not moved much across that transition: $640 million, $690 million, $707 million and $713 million through 2025, then $687 million and $734 million.
- Adding the quarters on page 7 gives first-half consumables revenue of $1,421 million is +6.8% against $1,330 million a year earlier, while instruments went from $195 million to $236 million, or +21.0%. Instruments growing faster means customers are installing, which builds the base for consumables later. Whether those consumables arrive at the old rate depends on price per base.
Five Sequencing and Life-Science Companies
- These five do not do the same thing. Thermo Fisher supplies everything a life-science laboratory needs, from reagents to analytical instruments. Qiagen is strongest in sample preparation and diagnostics. 10x Genomics builds instruments that read single cells. Pacific Biosciences competes directly with long-read sequencing, and Illumina holds most of the short-read market.
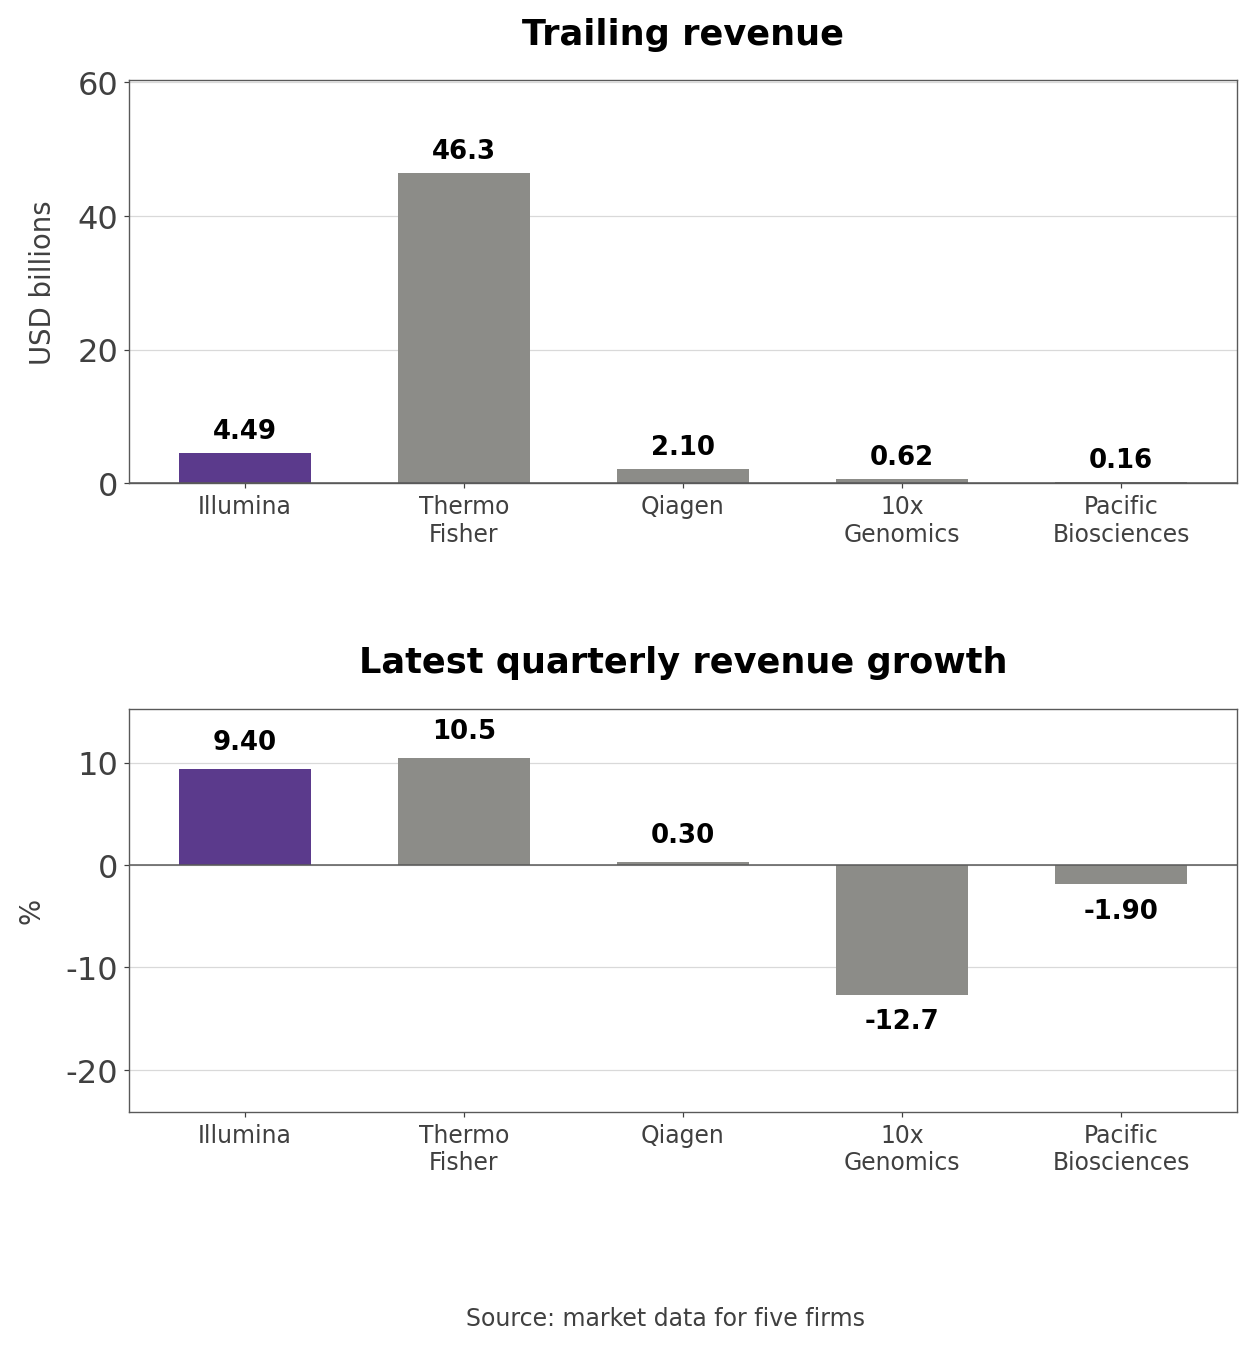
- On trailing revenue, Thermo Fisher is $46.34 billion, Illumina $4.49 billion, Qiagen $2.10 billion, 10x Genomics $617 million and Pacific Biosciences $159 million. On the latest quarter's growth, Illumina is +9.4%, Thermo Fisher +10.5%, Qiagen +0.3%, 10x Genomics -12.7% and Pacific Biosciences -1.9%. Two pure sequencing companies are shrinking, which says something about the temperature of this market. And Illumina's 9.4% contains the acquisition and the currency already discussed.
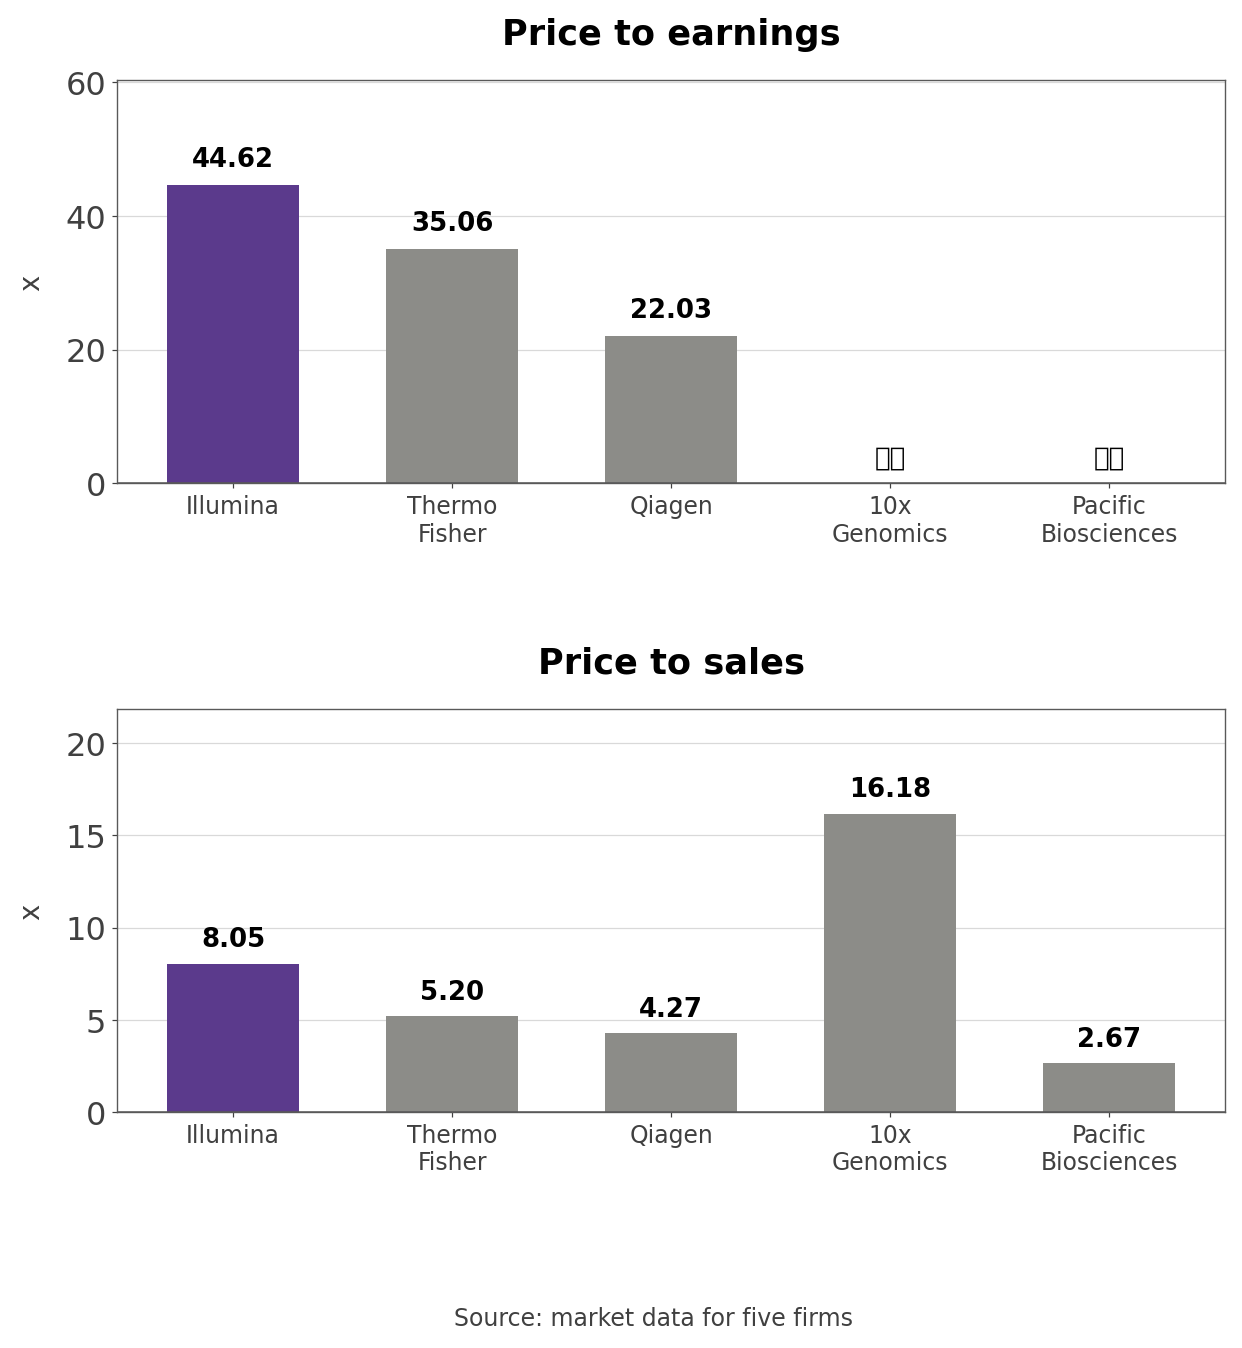
- The multiples reorder the list. On P/E Illumina is highest at 44.62x, then Thermo Fisher at 35.06x and Qiagen at 22.03x; the two loss-makers have none. On P/S, 10x Genomics leads at 16.18x and Illumina follows at 8.05x. Illumina carries a P/E more than nine points above Thermo Fisher on similar growth.
Price to Sales and Price to Book Over 60 Months
- Both ratios sit outside the upper decile line of the five-year range.

- Own calculation (month-end prices and quarterly filings, checked against aggregated market data): price-to-sales is 8.16x, at the 85th percentile of the five-year range against a median of 5.25x. Price-to-book is 12.92x, at the 95th percentile against a median of 5.34x. Self-computed market capitalisation and P/E sit within 1.3% and 0.4% of the aggregated figures.
- There is no P/E band because the company was loss-making from mid-2022 to mid-2025 and the series simply stops. The gap in the chart is the company's recent history.
- At the start of the five-year window price-to-sales was 16.35x, twice the current level, with the stock near $500 and revenue about where it is now. The low came in March and April 2025 at 2.90x and 2.84x, with the stock between $71 and $80. The multiple has roughly tripled since; revenue over the same span is up about 4%.
Three Conditions That Move the Stock
- The heaviest item is organic growth. Company guidance is above 4% for the year and the first half delivered 3.9%, with third-quarter guidance around 4.5%. From the first quarter of 2027 the SomaLogic comparison washes out of the growth rate, and what is left is the company's own pace. Whether the current multiple can live with that pace is the first thing to check.
- Acquisition accounting is the second, and it is a question of treatment more than of earnings. The new $1.0 billion revolver and the $500 million accordion list working capital and general corporate purposes as the use of proceeds. If the next deal is structured as a business combination it adds goodwill and amortisation; if it is later impaired, the whole amount arrives in one quarter, which is exactly what GRAIL did. An 8-K would show the deal.
- Demand is the third, and it comes from outside. Greater China is $56 million a quarter and fell 19% organically. Research and applied consumables have declined for a year while NIH funding cuts sit in the risk factors. Whether clinical growth of 15% keeps covering that decline is checked every quarter.
What the Next Filing Should Show
- One thing this piece cannot answer is how much SomaLogic contributes each quarter. The company discloses the acquisition effect only as 2.1 points of growth and does not break out the revenue. Working backwards gives roughly $22 million, but that is an estimate.
- So the third-quarter filing is worth reading for two numbers: whether organic growth excluding the acquisition reaches the 4.5% the company guided to, and how interest expense lands now that 4.650% notes are being replaced by 4.950% notes. The rate is 0.3 points higher, but the balance falls from $500 million to $300 million, so the net effect on interest expense runs the other way.
Related Analysis
- Plug Power (PLUG) Stock Analysis: Fair Value Charges and Losses: what happens to book value when one non-operating line dominates a quarter, which is the mechanism that emptied Illumina's balance sheet between 2022 and 2024.
- lululemon (LULU) Stock Analysis: Margin Decline and Tariffs: a gross margin sliding while the company keeps its guidance, useful next to the 120 basis points Illumina gave up this quarter.
- Lennar (LEN) Stock Analysis: Incentives and Book Value: reading a balance sheet through book value rather than earnings, which is the only way a 12.9x price-to-book makes sense.
#Illumina #ILMN #ILMNStock #Sequencing #Genomics #LifeSciences #USStocks #StockAnalysis #EquityResearch #GlobalStockBrief
'US Stock Analysis' 카테고리의 다른 글
| Halozyme (HALO) Stock: $143M of Equity and $1.3B of Notes (0) | 2026.09.21 |
|---|---|
| AutoZone (AZO) Stock: 36.3% ROIC and a 19.6x P/E (0) | 2026.09.17 |
| NVIDIA (NVDA) Stock Analysis: Guarantees and Cash Flow (0) | 2026.09.17 |
| Lennar (LEN) Stock: 12.9% Incentives and a 0.89x P/B (0) | 2026.09.15 |
| Plug Power (PLUG) Stock Analysis: GAAP vs Operating Loss (0) | 2026.09.15 |


