
- AutoZone, Inc. (NYSE: AZO) has spent $39.85 billion buying back its own stock since fiscal 1998, but its adjusted after-tax return on invested capital has now fallen for 11 straight quarters, to 36.3% in the quarter ended May 9, 2026. Trailing twelve-month (TTM) GAAP EPS is only 1.6% below where it stood at the September 2025 share price high, so nearly all of the drop in the stock came from a lower multiple. What remains open is whether the new stores and mega hubs now absorbing 47.6% of operating cash flow will lift returns before buybacks have to shrink further.
- AutoZone sells replacement parts, maintenance items and accessories through 7,856 stores: 6,766 in the United States, 933 in Mexico and 157 in Brazil. It serves do-it-yourself (DIY) customers at the counter and delivers parts to repair shops through commercial programs. At $2,849.04 a share and 16,325,355 shares outstanding on the 10-Q cover, the market capitalization is $46.51 billion.
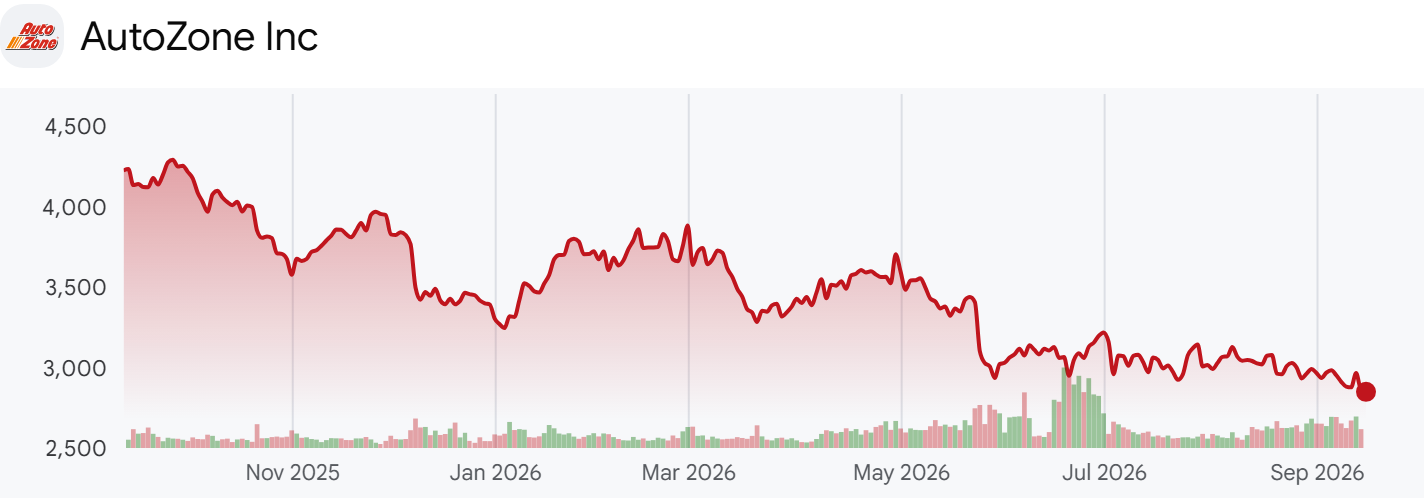
- The fiscal year ends on the last Saturday in August, and the first three quarters run 12 weeks while the fourth runs 16, so Q3 FY2026 is the 12 weeks ended May 9, 2026. ROIC here is AutoZone's own non-GAAP measure, and because stockholders' equity is negative, P/B and ROE are not meaningful. The shares are -5.8% over one month, -8.9% over three months and -32.6% over one year, and -34.6% below the ten-year closing high of $4,354.54 set on September 11, 2025. Q4 FY2026 results are expected in late September.
AutoZone History From Buybacks to Mega Hubs
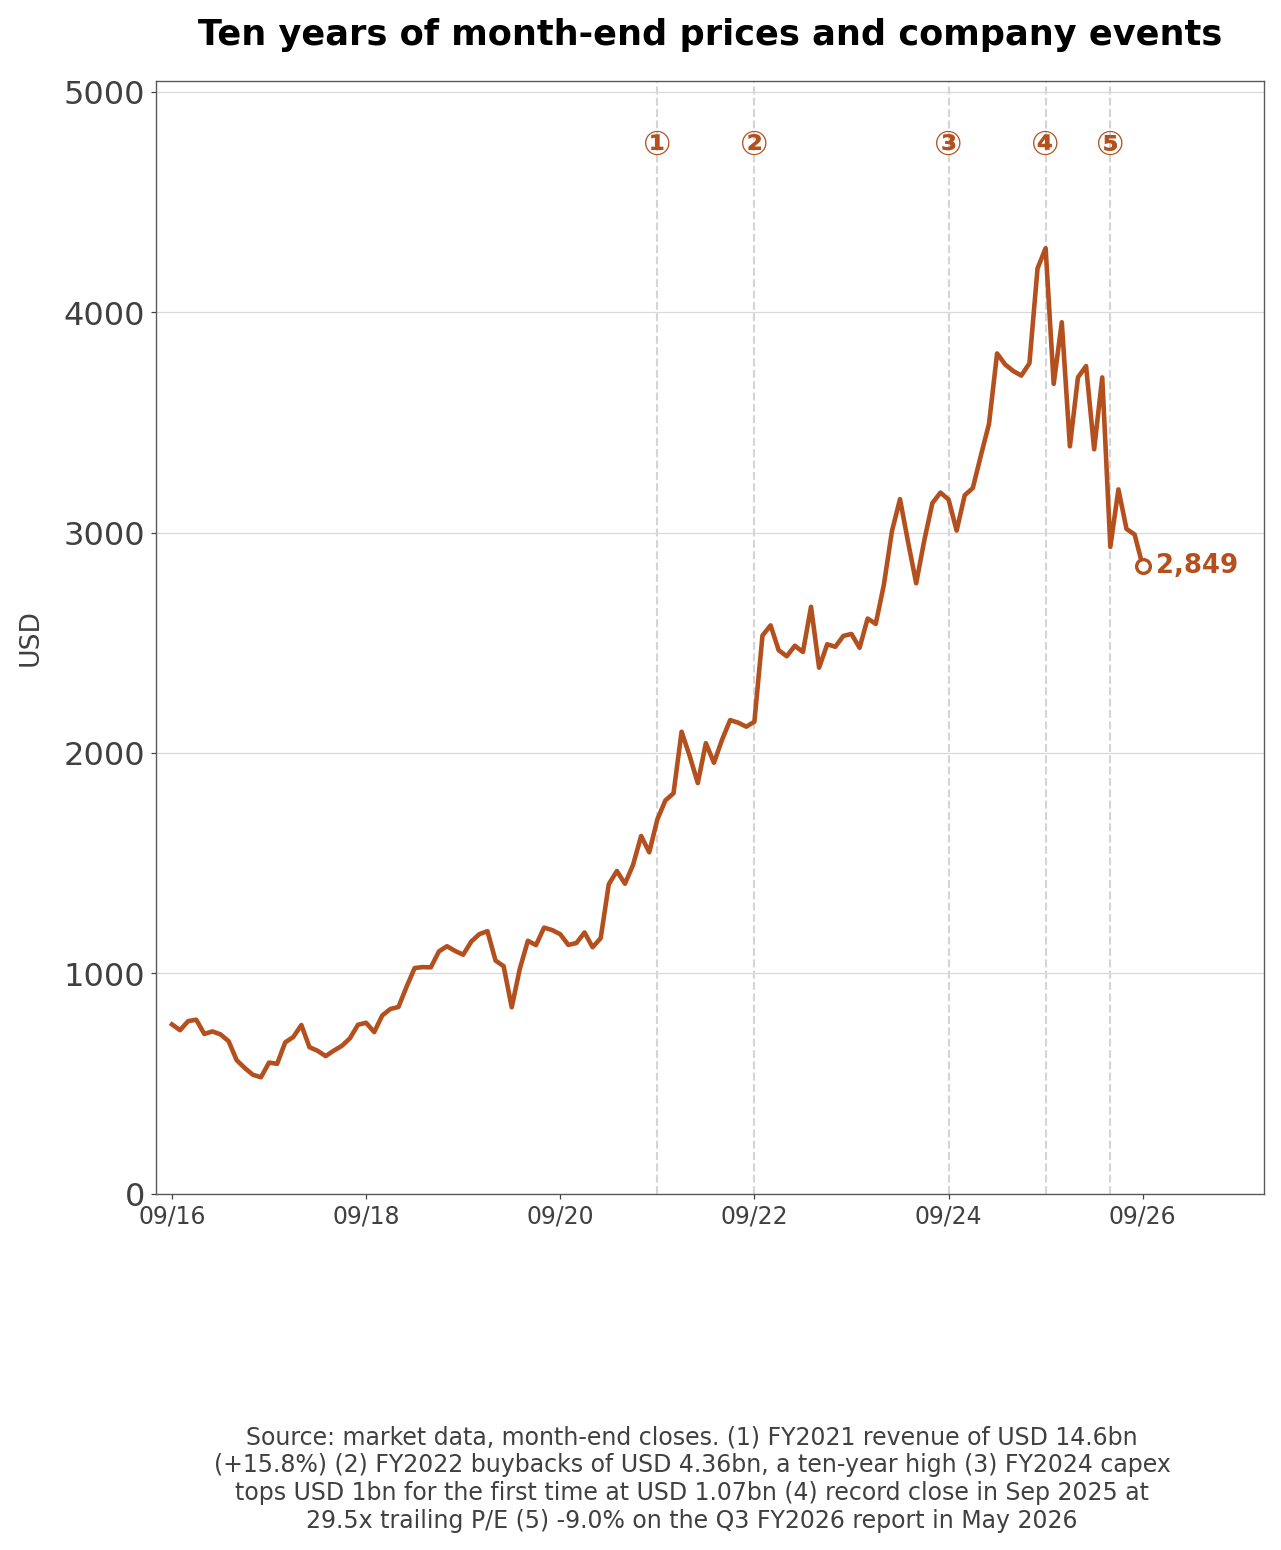
- AutoZone began operations in 1979. Three later developments explain the company investors are pricing now.
- The first is the buyback program. Cumulative repurchases since fiscal 1998 reached $39.85 billion at the end of Q3 FY2026, equal to 85.7% of today's market value, and shares outstanding fell from 25.74 million at the end of FY2018 to 16.37 million (-36.4%). AutoZone repurchased more stock than it had equity, so stockholders' equity has been negative for more than a decade, and the company reports adjusted debt to EBITDAR (earnings before interest, taxes, depreciation, amortization, rent and share-based expense) instead of a conventional leverage ratio.
- The second is the CEO handover. Bill Rhodes ran the company as CEO from 2005 and has chaired the board since 2007. In January 2024 Phil Daniele, who had been executive vice president for merchandising, marketing and supply chain and before that senior vice president for commercial from 2015 to 2021, became CEO. Rhodes moved from executive chairman to non-executive chairman in January 2026.
- The third is where the cash now goes. Capex passed $1 billion for the first time in FY2024 at $1.07 billion. Net new stores reached 304 in FY2025, 42.7% more than the year before, and FY2025 buybacks of $1.58 billion were 36.2% of the FY2022 peak.
| Year | What happened | Source |
| 2022 | Buybacks peaked at $4.36 billion | 10-K cash flow statement |
| 2024 | Phil Daniele became CEO and capex passed $1 billion | 10-K executive officers and cash flow statement |
| 2025 | Net new stores rose to 304 and the stock set a ten-year closing high in September | Earnings presentation and price history |
- The five-year financials below come from 10-K XBRL data in millions of dollars. Equity is negative in every year, so the debt ratio and ROE columns are not calculated. FY2024 had 53 weeks.
| Fiscal year-end | Revenue | Operating income | Net income | Operating margin | Net margin | Debt ratio | ROE |
| Aug 2021 | 14,629.6 | 2,944.5 | 2,170.3 | 20.1% | 14.8% | Negative equity | Negative equity |
| Aug 2022 | 16,252.2 | 3,270.7 | 2,429.6 | 20.1% | 14.9% | Negative equity | Negative equity |
| Aug 2023 | 17,457.2 | 3,474.0 | 2,528.4 | 19.9% | 14.5% | Negative equity | Negative equity |
| Aug 2024 | 18,490.3 | 3,788.7 | 2,662.4 | 20.5% | 14.4% | Negative equity | Negative equity |
| Aug 2025 | 18,938.7 | 3,610.2 | 2,498.2 | 19.1% | 13.2% | Negative equity | Negative equity |
- Revenue grew +29.5% over four years, but net income peaked in the 53-week FY2024 and was -6.2% in FY2025, when the operating margin slipped 1.4 points and AutoZone cited LIFO charges and foreign exchange.
The Five Biggest Daily Moves in AutoZone Shares
| Date | Move | Close ($) | Filings within a day | Same-day peers |
| 2024-02-27 | +6.7% | 2,770.46 to 2,954.99 | Q2 FY2024 results (8-K) | O'Reilly +1.9%, Advance Auto Parts +7.3% |
| 2025-12-09 | -7.2% | 3,766.96 to 3,496.77 | Q1 FY2026 results (8-K) | O'Reilly -3.9%, Advance Auto Parts -9.3% |
| 2026-03-03 | -6.3% | 3,882.47 to 3,637.17 | Q2 FY2026 results (8-K) | O'Reilly -1.2%, Advance Auto Parts -2.6% |
| 2026-05-26 | -9.0% | 3,406.50 to 3,100.11 | Q3 FY2026 results (8-K) | O'Reilly -2.0%, Advance Auto Parts -4.9% |
| 2026-07-06 | -6.4% | 3,159.28 to 2,957.71 | None (shelf registration and note prospectus the next day) | O'Reilly -6.7%, Advance Auto Parts -8.5% |
- Four of the five days were earnings days. AutoZone reports before the market opens, so the reaction shows up in that day's close, and three of those earnings days came after December 2025.
- The largest drop came with Q3 results on May 26, 2026. EPS of $38.07 was 5.26% above the average estimate, yet the stock closed -9.0% while O'Reilly was -2.0%. On the earnings call management said domestic same store sales grew only 1.3% in the last two weeks of the quarter and pointed to unseasonably cool weather. Q2 results on March 3 also beat the average estimate, by 1.24%, and the stock still closed -6.3%.
- July 6, 2026 had no AutoZone filing, and the whole group fell: O'Reilly -6.7% and Advance Auto Parts -8.5%. The shelf registration and prospectus filed the following day cover a 2031 note issue.
DIY and Commercial Sales at AutoZone
- Half of AutoZone's sales are parts that fail. The 10-K splits sales into three product groups.
| Product group | FY2025 sales ($m) | Share | Change vs FY2024 |
| Failure | 9,291.6 | 49.1% | +3.5% |
| Maintenance items | 6,807.3 | 35.9% | +2.9% |
| Accessories and other | 2,839.8 | 15.0% | -1.8% |
- The 10-K lists batteries, starters and alternators, fuel pumps, radiators and water pumps among failure parts, and brake pads and rotors, oil, filters, spark plugs and wipers among maintenance items. FY2024 had 53 weeks, which makes these growth rates look lower than the underlying trend. Accessories were the only group that shrank in FY2025.
- Customers split between people fixing their own cars and repair shops. Shops are served by commercial programs that deliver from nearby stores on credit, and domestic commercial sales were $1.40 billion in Q3, 29.0% of total sales against 27.5% for FY2025.
- On the Q3 earnings call management said DIY same store sales grew 2.2% while same-SKU inflation ran a little above 7%, which lifted the average DIY ticket by 5.6%, and DIY transaction counts fell 3.6%. Commercial tickets rose about 6% and transactions about 2%, and management put commercial at about 34% of domestic sales. DIY growth came from price while fewer customers came through the door, and management said declines in the 3% range for several quarters in a row have been rare for the business.
- Inventory placement is how AutoZone competes. Regular stores are replenished from the nearest distribution center, while hub stores carry 40,000 to 50,000 unique SKUs and mega hub stores 80,000 to 110,000, and both send parts the same day to nearby stores and shops. AutoZone ended FY2025 with 367 domestic hubs and 53 international hubs, including 133 domestic mega hubs, 24 more than a year earlier. On the Q3 call management said it opened 14 mega hubs in the quarter to reach 156 and plans about 15 more in Q4, for 38 in FY2026. It targets about 300 at full build-out and expects at least 40 openings in FY2027.
- International same store sales rose 16.6% in dollars but only 1.6% in constant currency. The Q3 release quotes Daniele: "While international performance has been below our plan, we believe our market share continues to grow as we outpace our competition in both international marketplaces." AutoZone also sells its Duralast private-label parts and ALLDATA diagnostic and repair software for shops.
Why Is AutoZone's ROIC Falling?
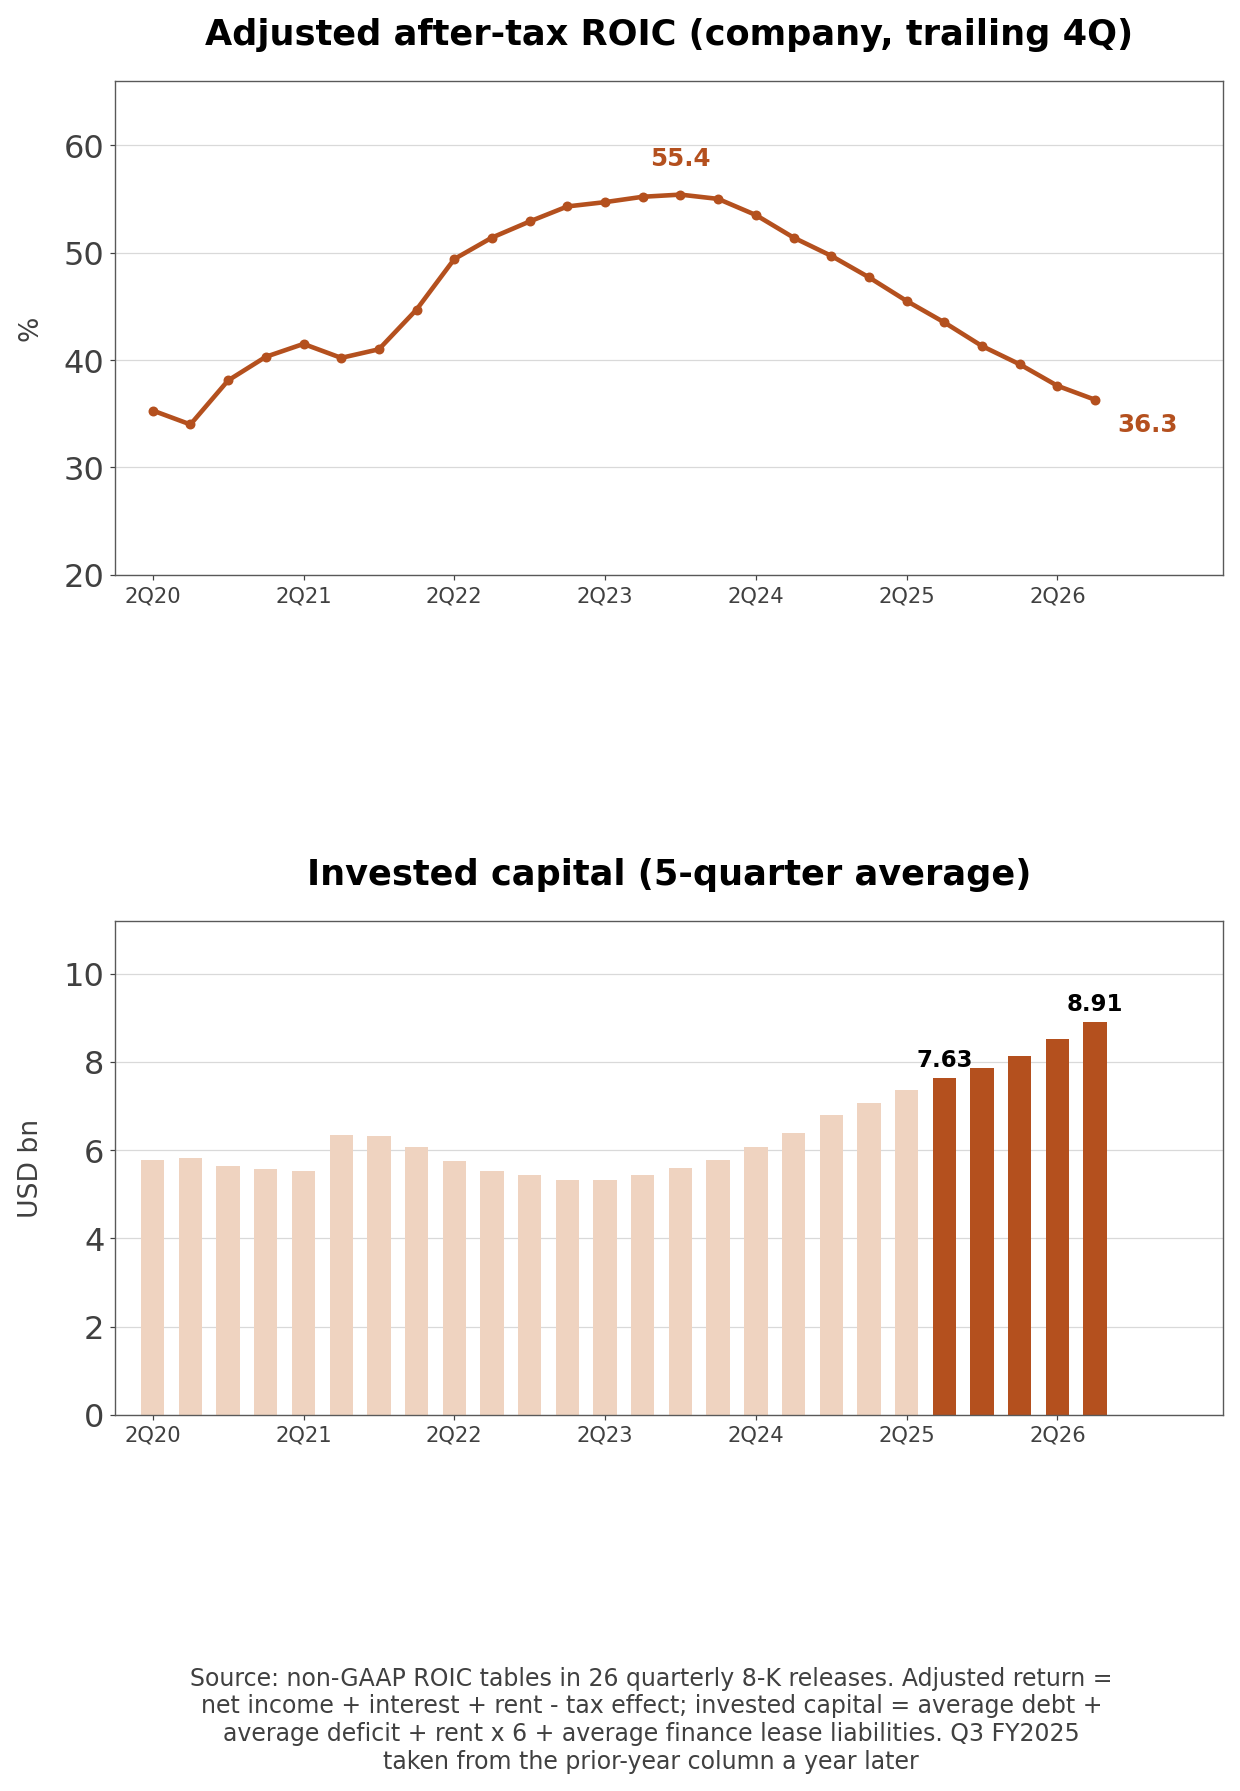
- The adjusted after-tax ROIC that AutoZone publishes in every earnings release fell from 55.4% in Q4 FY2023 to 36.3% in Q3 FY2026, 7.2 points below the 43.5% of a year earlier.
- Company disclosure (Q3 FY2026 8-K earnings release, non-GAAP ROIC table): Adjusted after-tax return is trailing four-quarter net income plus interest and rent, less the tax effect. Invested capital adds five-quarter averages of debt and stockholders' deficit, six times rent and average finance lease liabilities. The return was $3.24 billion against $3.31 billion a year earlier, and invested capital was $8.91 billion against $7.63 billion.
| Invested capital component ($m, five-quarter average) | A year earlier | Q3 FY2026 | Change |
| Average debt | 8,987.7 | 8,839.9 | -147.8 |
| Average stockholders' deficit | -4,538.6 | -3,262.1 | +1,276.5 |
| Rent times 6 | 2,792.0 | 2,920.7 | +128.6 |
| Average finance lease liabilities | 385.3 | 413.7 | +28.4 |
| Invested capital | 7,626.5 | 8,912.2 | +1,285.7 |
- Own calculation (same ROIC table): Holding invested capital at last year's level, ROIC would be 42.5%. Holding the return at last year's level, it would be 37.2%. The smaller average stockholders' deficit accounts for 99.3% of the $1.29 billion increase in invested capital.
- More than 6 of the 7.2 points came from the denominator. The deficit shrank because AutoZone bought back less stock than it earned: $1.77 billion of repurchases against $2.48 billion of net income over the last four quarters. Stockholders' deficit was $2.78 billion at the end of Q3 against $3.97 billion a year earlier.
- The retained cash went into stores and inventory. Net property and equipment rose $1.07 billion to $7.80 billion over the year and inventory rose $736 million, while accounts payable rose only $514 million, so payables fell from 115.6% to 111.1% of inventory. AutoZone's own cash now carries more of the inventory that suppliers used to finance, and the ROIC decline is the same cash seen from two sides: an accounting effect of slower buybacks and a real investment in stores and stock.
Is AZO Stock Cheap at 19.6 Times Earnings?
- Trailing P/E sits a little below the middle of its five-year range, and price to sales is at its lowest in 60 months. In the year-end table P/B is not calculated because equity is negative, AutoZone pays no dividend, and FCF is operating cash flow minus capex.
| Fiscal year-end | Year-end price | P/E | P/B | Dividend yield | FCF ($m) |
| Aug 2021 | $1,548.49 | 16.3x | Negative equity | None | 2,896.8 |
| Aug 2022 | $2,163.02 | 18.5x | Negative equity | None | 2,538.7 |
| Aug 2023 | $2,453.40 | 18.5x | Negative equity | None | 2,144.1 |
| Aug 2024 | $3,181.48 | 21.3x | Negative equity | None | 1,931.4 |
| Aug 2025 | $4,198.53 | 29.0x | Negative equity | None | 1,790.1 |
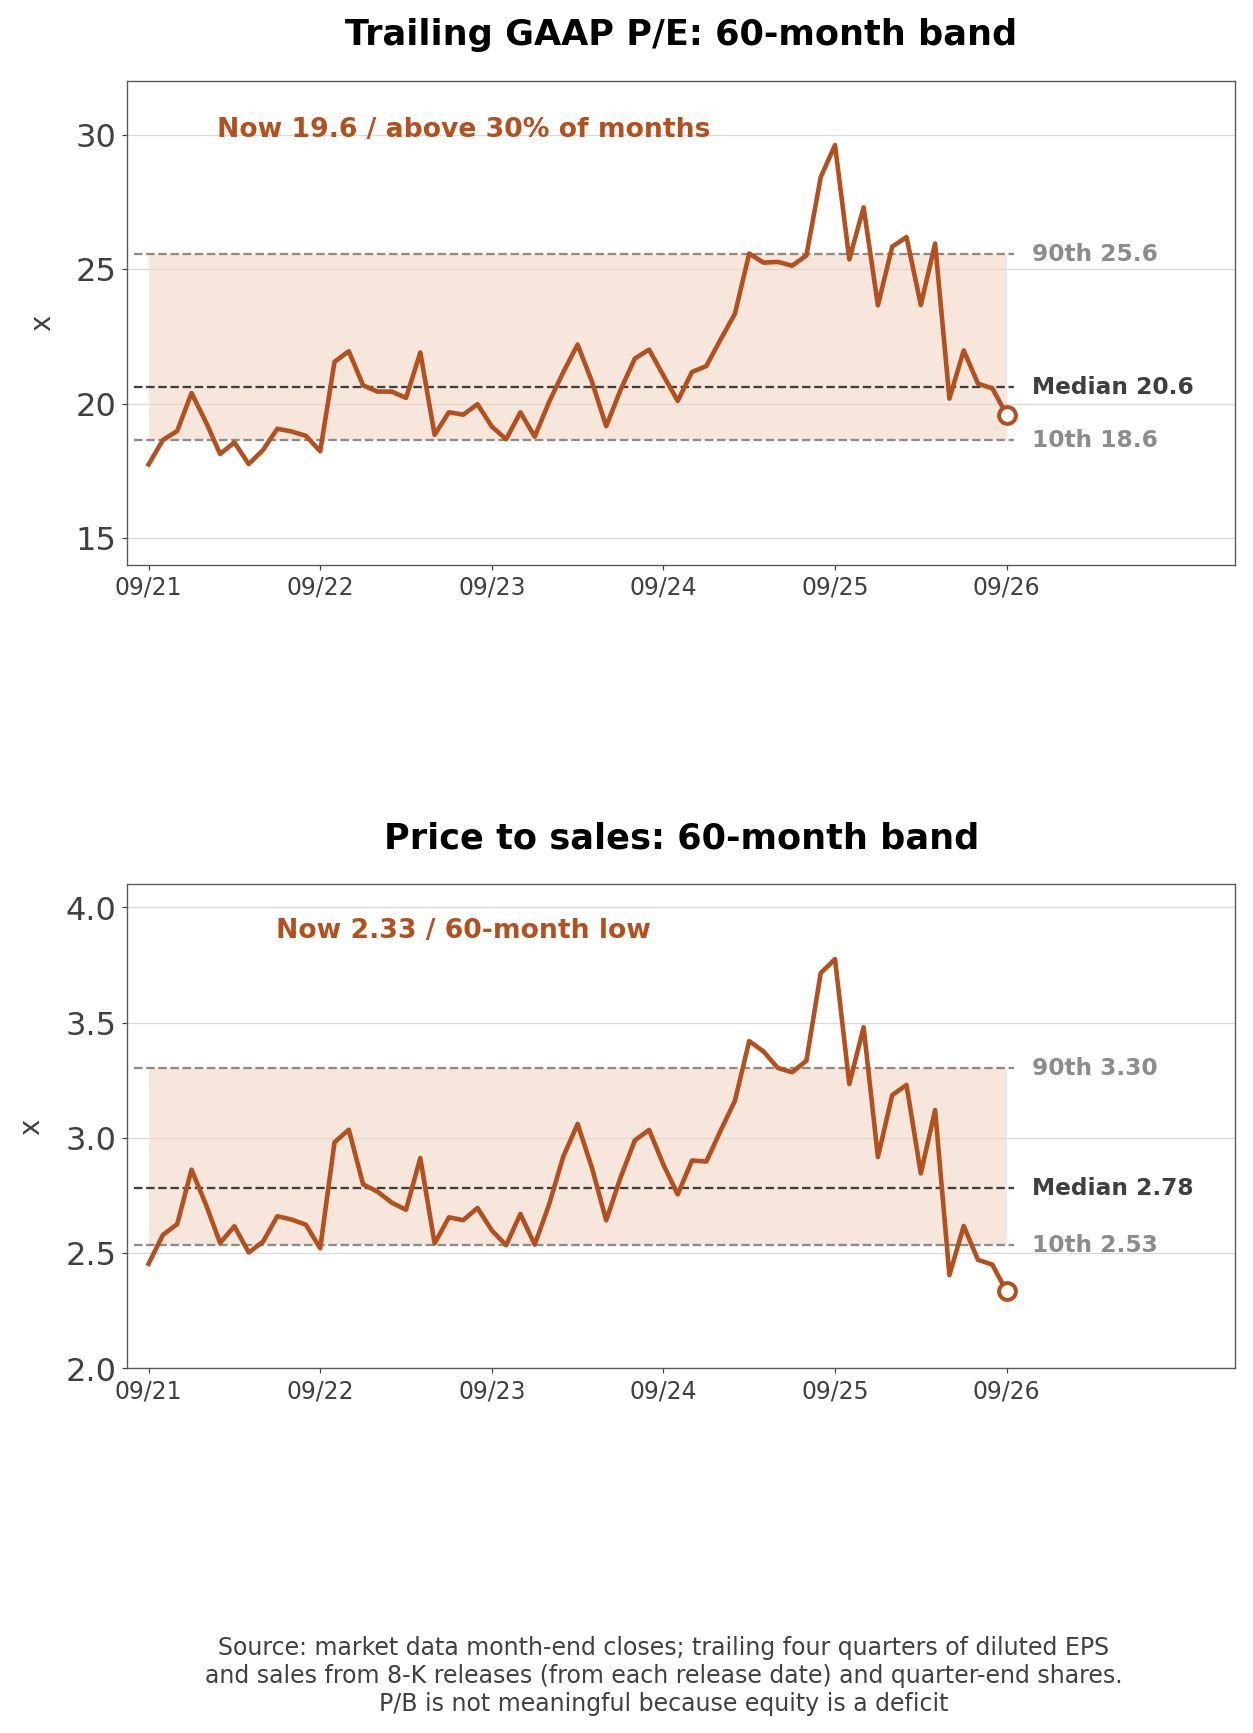
- I rebuilt both multiples from 60 month-end closes between September 2021 and August 2026, using diluted EPS and sales for the four quarters released by each month-end and quarter-end shares outstanding. The 16-week Q4 plus three 12-week quarters add up to a full year.
- The trailing GAAP P/E of 19.59x (TTM EPS of $145.45) is higher than 30% of those months and below the 20.62x median. Its range runs from 17.74x in September 2021 to 29.61x in September 2025. Price to sales of 2.33x is the lowest of the 60 months, below the previous low of 2.40x at the end of May 2026. The price-to-sales median is 2.78x and the high was 3.78x in September 2025.
- Aggregator cross-check (two market data aggregators): One shows a trailing P/E of 19.69x and a forward P/E of 16.28x, and its TTM revenue of $19.99 billion matches the sum of the last four earnings releases. The other shows price to sales of 2.41x on a revenue window one quarter older.
- At the September 11, 2025 high the trailing P/E was 29.47x on EPS of $147.75. EPS is now $145.45 (-1.6%) and the P/E is 19.59x (-33.5%). On a log basis, 96.3% of the price decline came from the lower multiple and 3.7% from lower EPS.
- The multiple peaked while ROIC was already falling. The Q3 FY2025 figure published before the high, 43.5%, was the seventh straight decline, and over the next four quarters of decline the P/E lost almost 10 points. Price to sales hit its low because revenue kept growing with new stores while the share price did not follow.
What the Q3 FY2026 Earnings Presentation Claims
- AutoZone's quarterly earnings presentations run 12 to 13 pages, and the last content page repeats the same case for owning the stock. Page 13 of the Q4 FY2025 deck and page 11 of the Q3 FY2026 deck both list "Consistent, steady EPS growth," "Powerful Free Cash Flow generation" and "Disciplined Capital Allocation," and they define the last item as investing in existing assets, driving growth and "Excess cash returned to shareholders." Growth priorities are domestic commercial and DIY, hub and mega hub expansion, better assortment and international expansion. Each claim below is set against the 10-K, the 10-Q and the earnings release.
- One line changed between the two decks. "Improve the customer experience and drive efficiencies" in the Q4 FY2025 version became "Leverage technology to improve the customer experience" in Q3 FY2026, and the word efficiencies dropped out.
- The first claim, steady EPS growth, runs into AutoZone's own Q4 FY2025 deck. Pages 7 and 8 show FY2025 diluted EPS of $144.87 against $149.55 in the 53-week FY2024 (-3.1%) and against $146.14 excluding the extra week (-0.9%). The same pages say "LIFO negatively impacted EBIT ($64 million) and EPS ($2.84)" and that foreign exchange reduced EPS by $3.58.
- FY2026 has not restored the trend yet. Pages 5 and 6 of the Q3 deck show Q3 net sales up 8.4% and gross margin down 57 basis points to 52.2%. Diluted shares were 2.1% lower, and EPS of $38.07 was up 7.7%. Over 36 weeks, sales rose 8.3% while operating profit fell 0.3% and net income fell 1.2%, and EPS of $96.69 was +0.5% against $96.17. The footnote shows a $177 million non-cash LIFO charge for the 36 weeks against a $16 million LIFO benefit a year earlier.
- Own sensitivity calculation (Q3 FY2026 deck page 6 tax rates and diluted shares): Taxing the $177 million charge at 21.2% and dividing by 17.0 million diluted shares gives $8.20 per share, and the prior-year benefit was $0.74. Excluding both, 36-week EPS would be $104.89 against $95.43, 9.9% higher. AutoZone does not report this figure.
- On the Q3 call management said a peso about 13% stronger than a year earlier added $74 million to sales, $20 million to EBIT and $0.83 to EPS, and it put Q3 EPS growth excluding LIFO at 12.5%. That 12.5% therefore includes the currency tailwind that had cost $3.58 of EPS in FY2025. The Q3 tax rate was 21.1% against 19.4% a year earlier, while interest expense was flat at $110 million against $111 million.
- Steady EPS growth holds only if LIFO charges are treated as a one-time item. Over 36 weeks net income fell while EPS rose because diluted shares were -1.7%, and that gap narrows as buybacks slow.
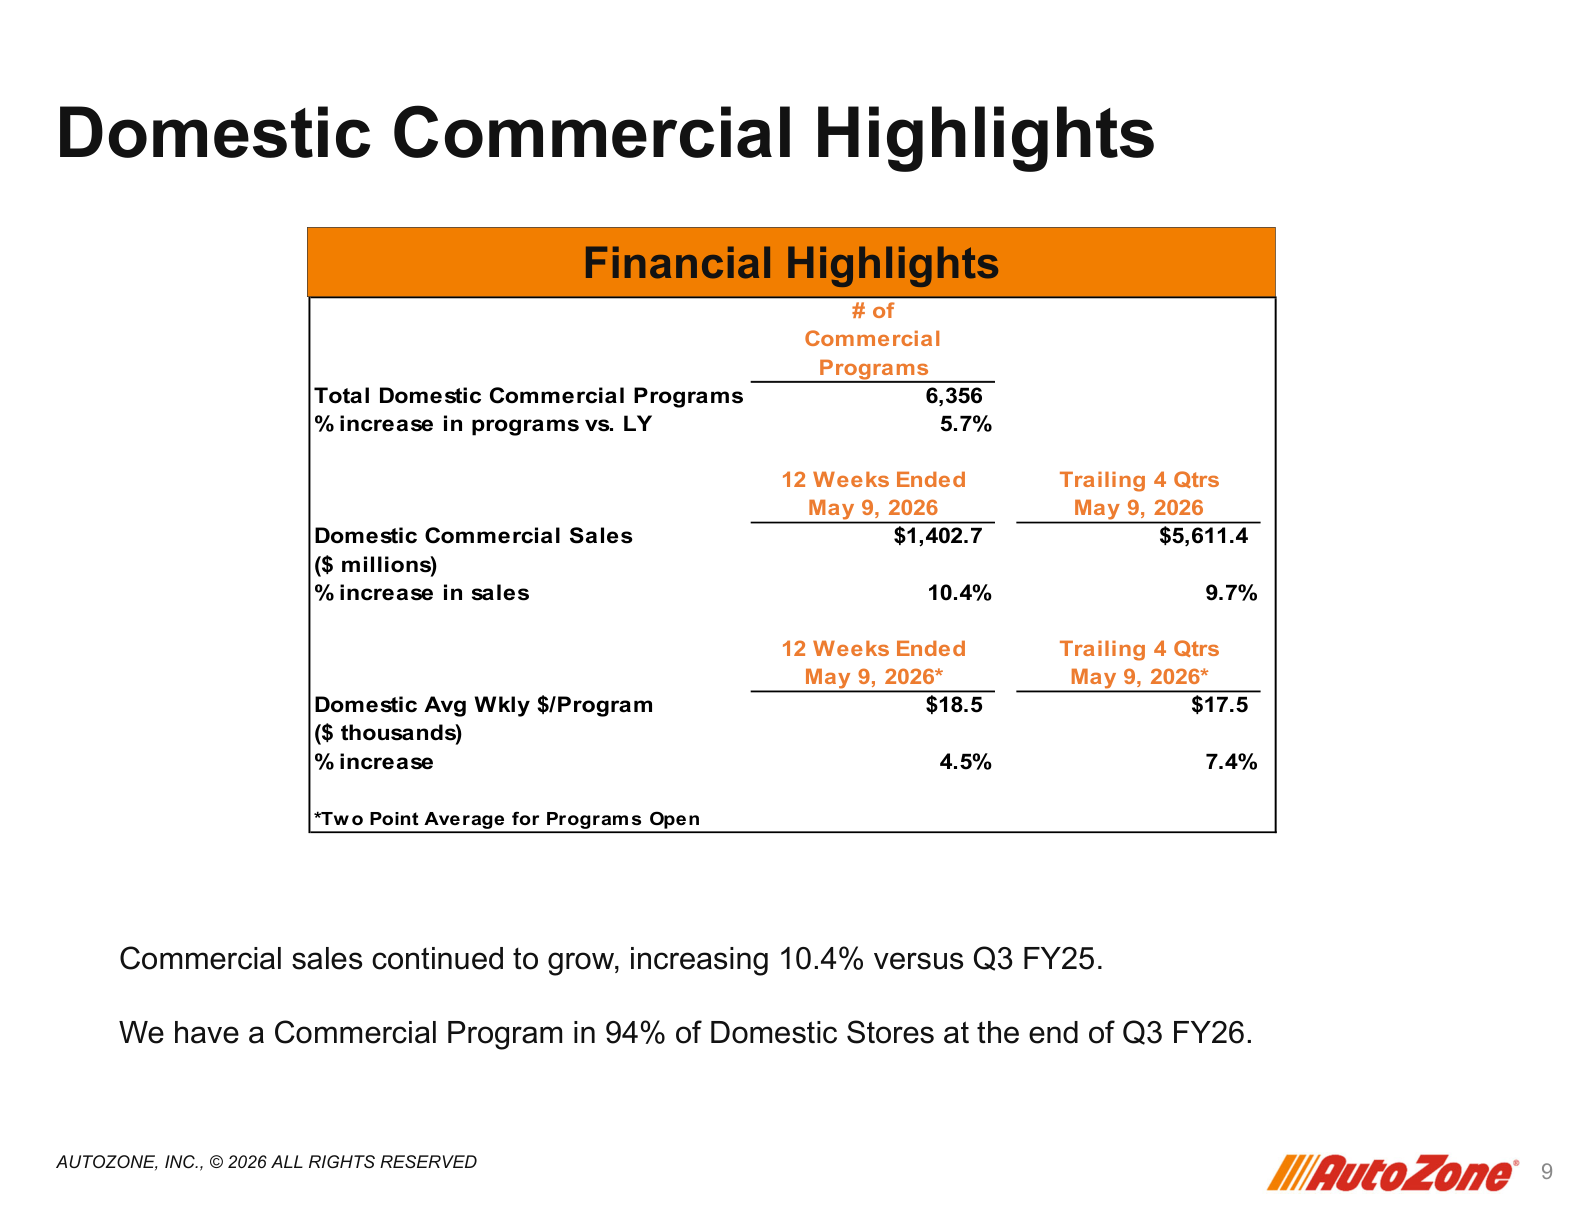
- Page 9 says "Commercial sales continued to grow, increasing 10.4% versus Q3 FY25," with 6,356 domestic commercial programs, 5.7% more than a year earlier, and "a Commercial Program in 94% of Domestic Stores at the end of Q3 FY26." Trailing four-quarter commercial sales were $5.61 billion, up 9.7%, and average weekly sales per program were $18,500, up 4.5%.
- These growth numbers match the release, and program growth times sales per program comes to the 10.4% total. Management said on the call that the average commercial ticket rose about 6%, so sales per program growing +4.5% implies transactions per program of about -1.4%. Commercial growth came from new programs and price rather than more orders from existing programs.
- Coverage limits that route. Programs sat in 92% of domestic stores at the end of FY2025 according to page 11 of the Q4 FY2025 deck and in 94% now, so fewer existing stores are left to add a program, and future commercial growth leans more on new stores and sales per program. The same Q4 FY2025 page shows commercial sales growth of +6.7% for FY2025, against +9.7% over the latest four quarters.
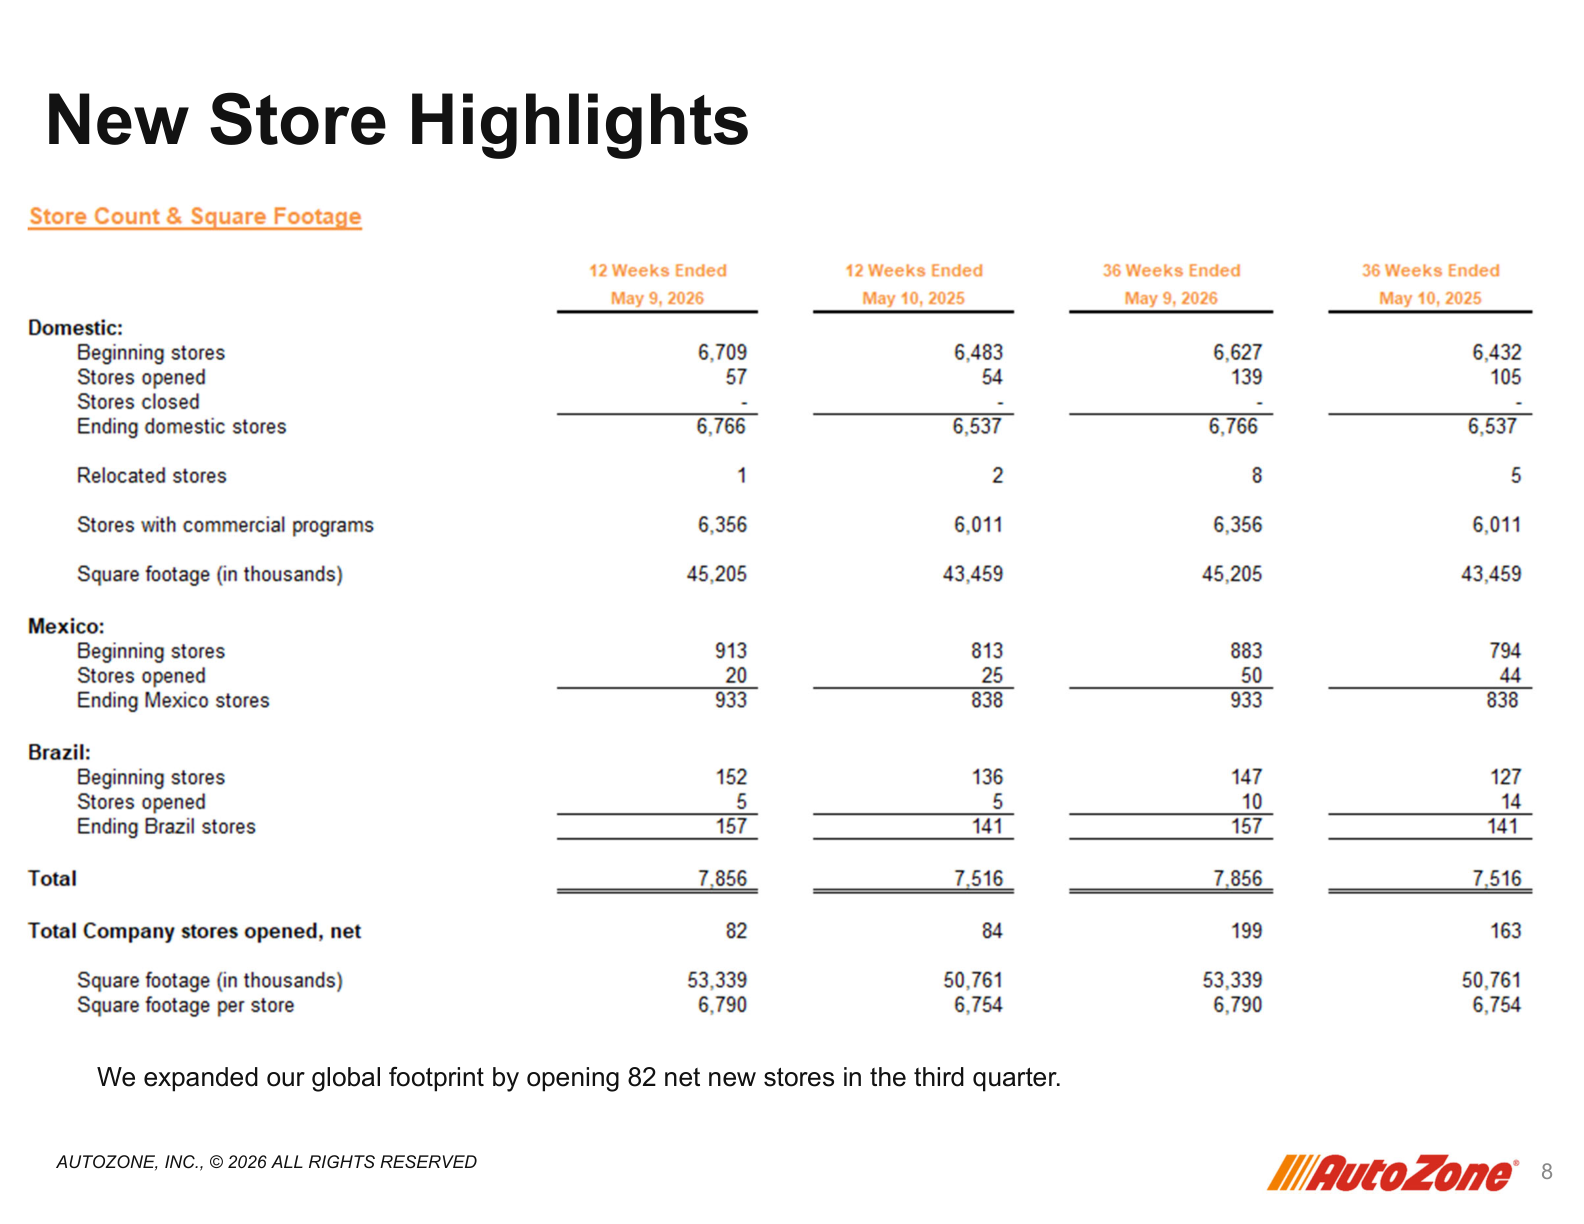
- Page 8 shows 82 net new stores in Q3 (57 US, 20 Mexico and 5 Brazil). Over 36 weeks AutoZone added 199 stores against 163 a year earlier, and square footage per store rose to 6,790 from 6,754. Over the year the US store count grew +3.5% and Mexico and Brazil +11.3% each, while total square footage grew +5.1%, faster than the store count. The Q3 release expects AutoZone "to open approximately 355-365 stores for the full fiscal year," which leaves 156 to 166 openings for the 16-week Q4. New stores hit capex and operating expenses first, and the 36-week operating expense ratio was 34.3%, 20 basis points worse than a year earlier.
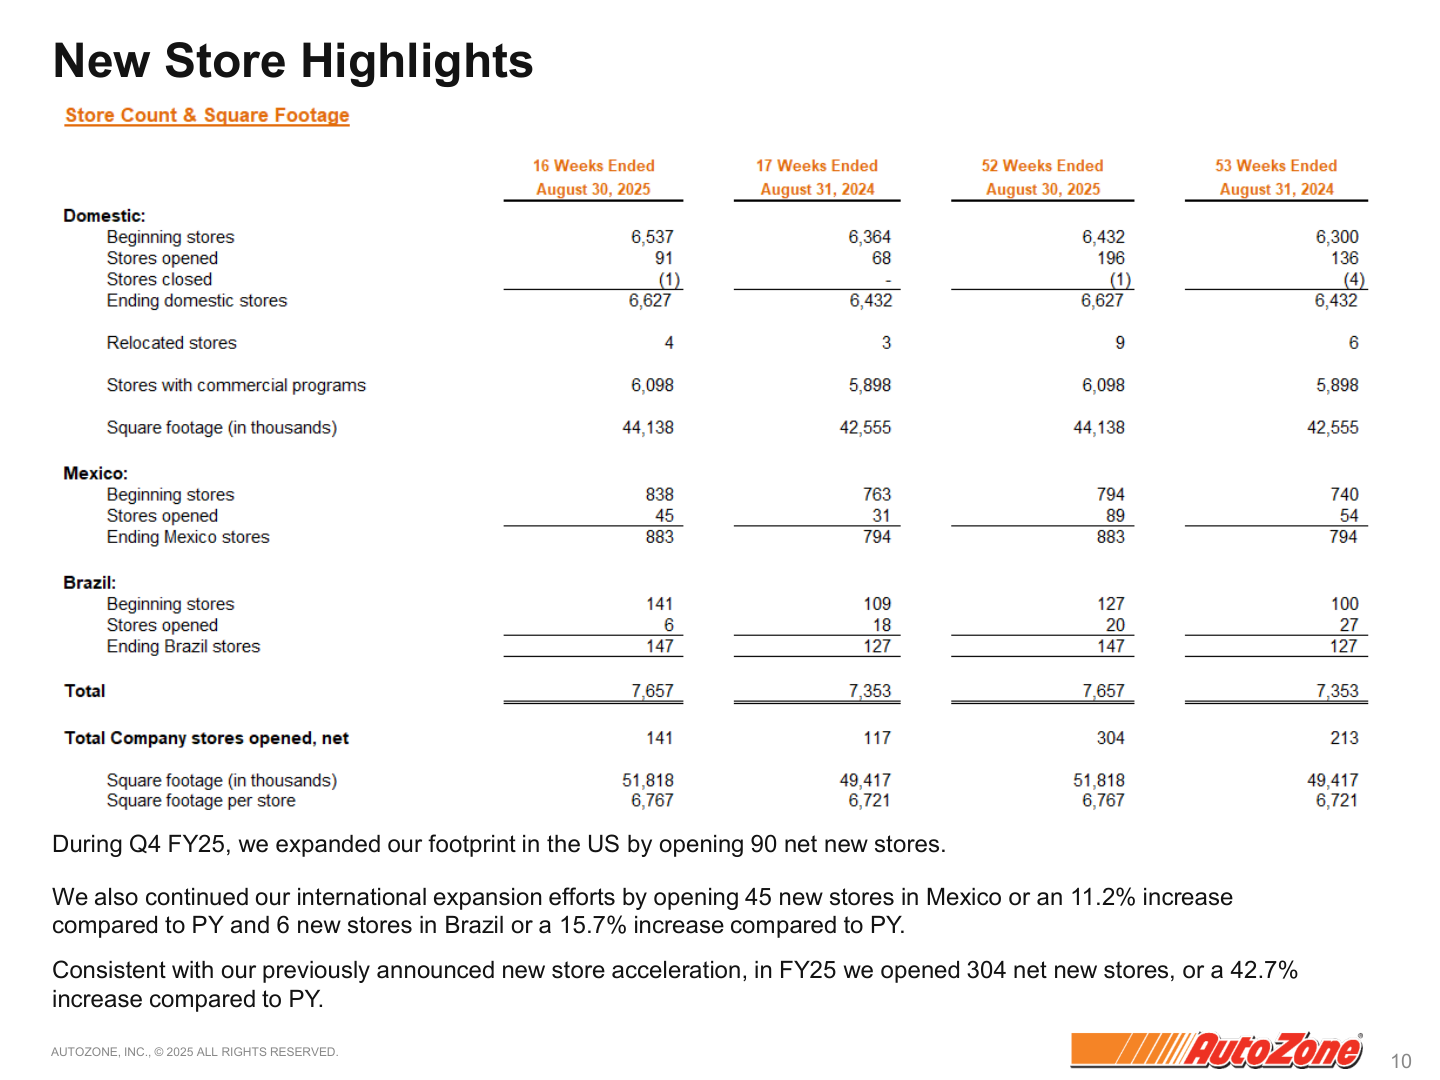
- Page 10 of the Q4 FY2025 deck shows 304 net new stores in FY2025, 42.7% more than the 213 of FY2024, with 196 US openings and one closure, 89 in Mexico and 20 in Brazil. On the Q3 call management said stores opened over the last five years are beating the sales and profit plans they were approved on. Neither the deck nor the 10-K gives returns by store or by opening year, so the only filed number that can test that statement is company-wide ROIC.
- The second claim, powerful free cash flow, holds in size but not in direction. Free cash flow for the 36 weeks was $1.12 billion against $1.28 billion a year earlier (-12.3%), while capex was +17.8%. Page 10 of the Q3 deck shows inventory up 10.8%, inventory per store up 6.0% and inventory turns down from 1.4x to 1.3x. Net property and equipment rose 15.9% and debt 1.8%. Inventory net of payables moved from negative $1,065 million to negative $842 million, so AutoZone's own cash now funds $223 million more inventory than a year earlier.
- The third claim, excess cash returned to shareholders, does not fit the 36-week numbers. Page 6 says "FY26 YTD, we repurchased $1,328 million in AutoZone stock," 1.18 times free cash flow for the same period, and in July, two months after the quarter ended, AutoZone issued $850 million of new senior notes.
- The commercial program growth, the store openings and the build-up in inventory and property hold up against the filings. Steady EPS growth needs LIFO excluded, and powerful free cash flow and excess cash returned do not match 36 weeks in which free cash flow fell and buybacks exceeded it.
LIFO Inventory Charges and Tariff Inflation
- LIFO charges have cut AutoZone's earnings for four straight quarters, peaking at $98 million in Q1 FY2026 and easing to $20 million in Q3.
- AutoZone values domestic inventory on a last-in, first-out basis. The most recent and most expensive purchases flow into cost of sales first, so when tariffs or inflation raise purchase costs, the difference reduces profit as a LIFO charge. The charge is an accounting adjustment with no separate cash outflow, but it reflects purchase costs that AutoZone did pay in cash.
| Quarter | LIFO impact ($m) | LIFO effect on gross margin vs prior year | Domestic same store sales |
| Q4 FY2025 (16 weeks) | -80 | -128 bps | 4.8% |
| Q1 FY2026 | -98 | -212 bps | 4.8% |
| Q2 FY2026 | -59 | -138 bps | 3.4% |
| Q3 FY2026 | -20 | -77 bps | 4.1% |
| Q4 FY2026 plan | About -30 | Not reported yet | Not reported yet |
- The Q3 release says "The decrease in gross margin was driven by a 77 basis point net non-cash LIFO impact partially offset by other gross margin improvements," and management said on the call that gross margin excluding LIFO was 20 basis points higher than a year earlier despite faster growth in lower-margin commercial sales.
- The FY2025 10-K ties the cost pressure to trade policy: "During fiscal 2025, new global trade tariffs were announced on imports to the United States, including additional tariffs on various countries from which the Company directly or indirectly imports and/or sources merchandise, including Canada, China and Mexico, among others."
- On the Q3 call management planned a Q4 LIFO charge of about $30 million, which would bring FY2026 to $207 million against $64 million in FY2025. It expects the average ticket to grow in the mid-4% range in Q4 as prices start to lap last year's tariff-driven increases.
- Q4 compares with an $80 million LIFO charge a year earlier, so a smaller charge would flatter EPS growth, and the Q4 estimate probably includes some of that comparison. The other side is that as inflation cools, the ticket growth that has carried DIY sales fades together with the LIFO charge, and the decline in DIY transactions would show more clearly in sales.
Capex and Buybacks Compete for Operating Cash Flow
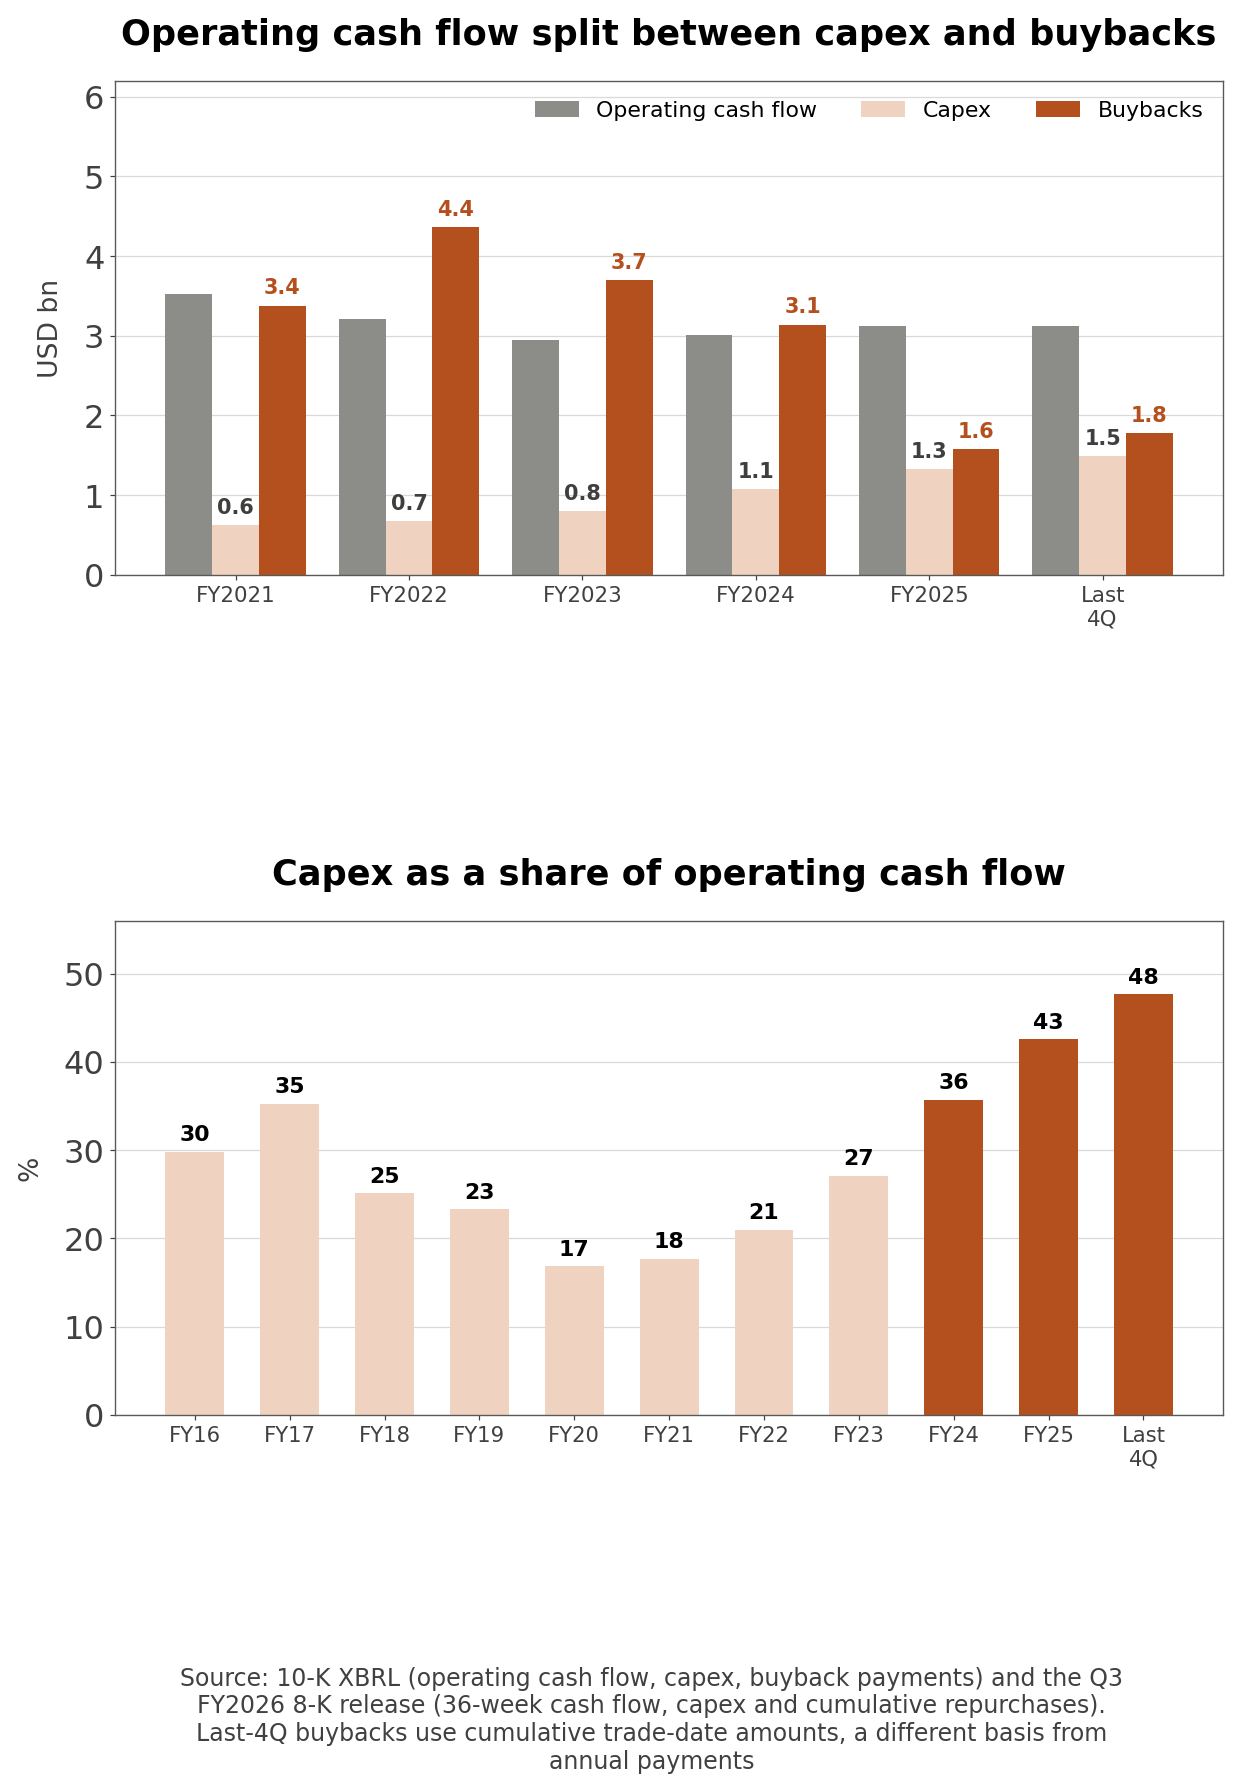
- Capex took 17.7% of operating cash flow in FY2021, 42.6% in FY2025 and 47.6% over the latest four quarters. Operating cash flow stayed near $3 billion while capex more than doubled, which left less for buybacks.
| Fiscal year | Operating cash flow ($m) | Capex ($m) | Free cash flow ($m) | Buybacks ($m) | Buybacks / FCF |
| FY2021 | 3,518.5 | 621.8 | 2,896.8 | 3,378.3 | 1.17x |
| FY2022 | 3,211.1 | 672.4 | 2,538.7 | 4,360.0 | 1.72x |
| FY2023 | 2,940.8 | 796.7 | 2,144.1 | 3,699.6 | 1.73x |
| FY2024 | 3,004.1 | 1,072.7 | 1,931.4 | 3,140.9 | 1.63x |
| FY2025 | 3,117.3 | 1,327.3 | 1,790.1 | 1,578.2 | 0.88x |
| Last four quarters | 3,117.7 | 1,485.3 | 1,632.5 | 1,774.9 | 1.09x |
- Annual buybacks are cash payments from the 10-K cash flow statement, while the last-four-quarter figure is the change in cumulative repurchases in the earnings releases, a trade-date basis that differed by about 3% in FY2025.
- From FY2022 to FY2024 buybacks ran at 1.6 to 1.7 times free cash flow, and long-term debt rose from $5.27 billion at the end of FY2021 to $9.02 billion at the end of FY2024. AutoZone pulled buybacks below free cash flow in FY2025, then went back above it over the latest four quarters.
- The Q3 release shows adjusted debt to EBITDAR at 2.5x in each of the last six quarters, with TTM EBITDAR of $4.89 billion, the same as a year earlier. If the ratio stays at 2.5x and EBITDAR does not grow, borrowing capacity for buybacks does not grow either. The board approved another $1.5 billion of buyback authorization on June 16 after Q3 ended with $804 million remaining, and in July AutoZone issued $850 million of 4.950% senior notes due 2031, closing on July 14.
- Management said on the call that capex will be about $1.6 billion this year and similar next year. That is 51.3% of TTM operating cash flow and leaves $1.52 billion, $257 million less than the $1.77 billion of buybacks over the last four quarters. Unless operating cash flow grows, buybacks either need more borrowing or have to shrink, and the Q3 average repurchase price of $3,582 is 25.7% above the current share price.
| Number | Value | Why it matters |
| Adjusted after-tax ROIC (company, a year earlier 43.5%) | 36.3% | Eleven straight declines, most of the last year's drop from a larger invested capital base as the deficit shrank |
| Share of the decline from the high explained by P/E (log split) | 96.3% | EPS barely moved and the market applied a lower multiple |
| Last-four-quarter capex / operating cash flow (FY2021 17.7%) | 47.6% | Store and mega hub spending took cash that used to fund buybacks, which again exceed free cash flow |
| 36-week FY2026 LIFO charge (a year earlier a $16 million benefit) | $177 million | Excluding it, 36-week EPS growth would be 9.9% instead of 0.5% |
| Price to sales (60-month low; P/E above 30% of months) | 2.33x | Cheapest on sales in five years while P/E sits close to its 20.62x median |
Six Bull Case Arguments Checked Against the Filings
- The case for owning AutoZone starts with buybacks growing EPS and ends with a P/E that has fallen back toward its five-year median. I split the presentation's argument and common investor reasoning into six links and checked each against the 10-K, the 10-Q and the earnings releases.
| # | The thesis | Evidence | Verdict |
| 1 | Buybacks keep EPS growing steadily | Shares -36.4% since FY2018; FY2025 EPS -3.1%; 36-week EPS +0.5% | Overstated |
| 2 | Mega hubs will lift ROIC again | ROIC down 11 quarters in a row; 156 mega hubs toward about 300; no returns disclosed by store | Conditional |
| 3 | LIFO charges are non-cash and can be ignored | $177 million over 36 weeks; same-SKU inflation above 7%; about $30 million planned for Q4 | Partly holds |
| 4 | Free cash flow covers the buybacks | 0.88x in FY2025; 1.09x over four quarters; $850 million of notes in July | Partly holds |
| 5 | Commercial growth offsets fewer DIY visits | Commercial sales +10.4%; DIY same store sales +2.2%; DIY transactions -3.6% | Holds |
| 6 | A P/E near 19x makes the stock cheap | P/E above 30% of 60 months; P/S at a 60-month low; ROIC still falling | Conditional |
- Holds means the filings confirm it, Partly holds means part of the claim is confirmed, Conditional means it depends on a number not yet reported, and Overstated means the direction is right but the size is not. One link holds, two partly hold, two are conditional and one is overstated. The weakest link is number 2: if new stores and mega hubs do not stop the ROIC decline, the buyback capacity in link 4 and the valuation call in link 6 both rest on lower returns.
Q4 Estimates and Analyst Price Target Cuts
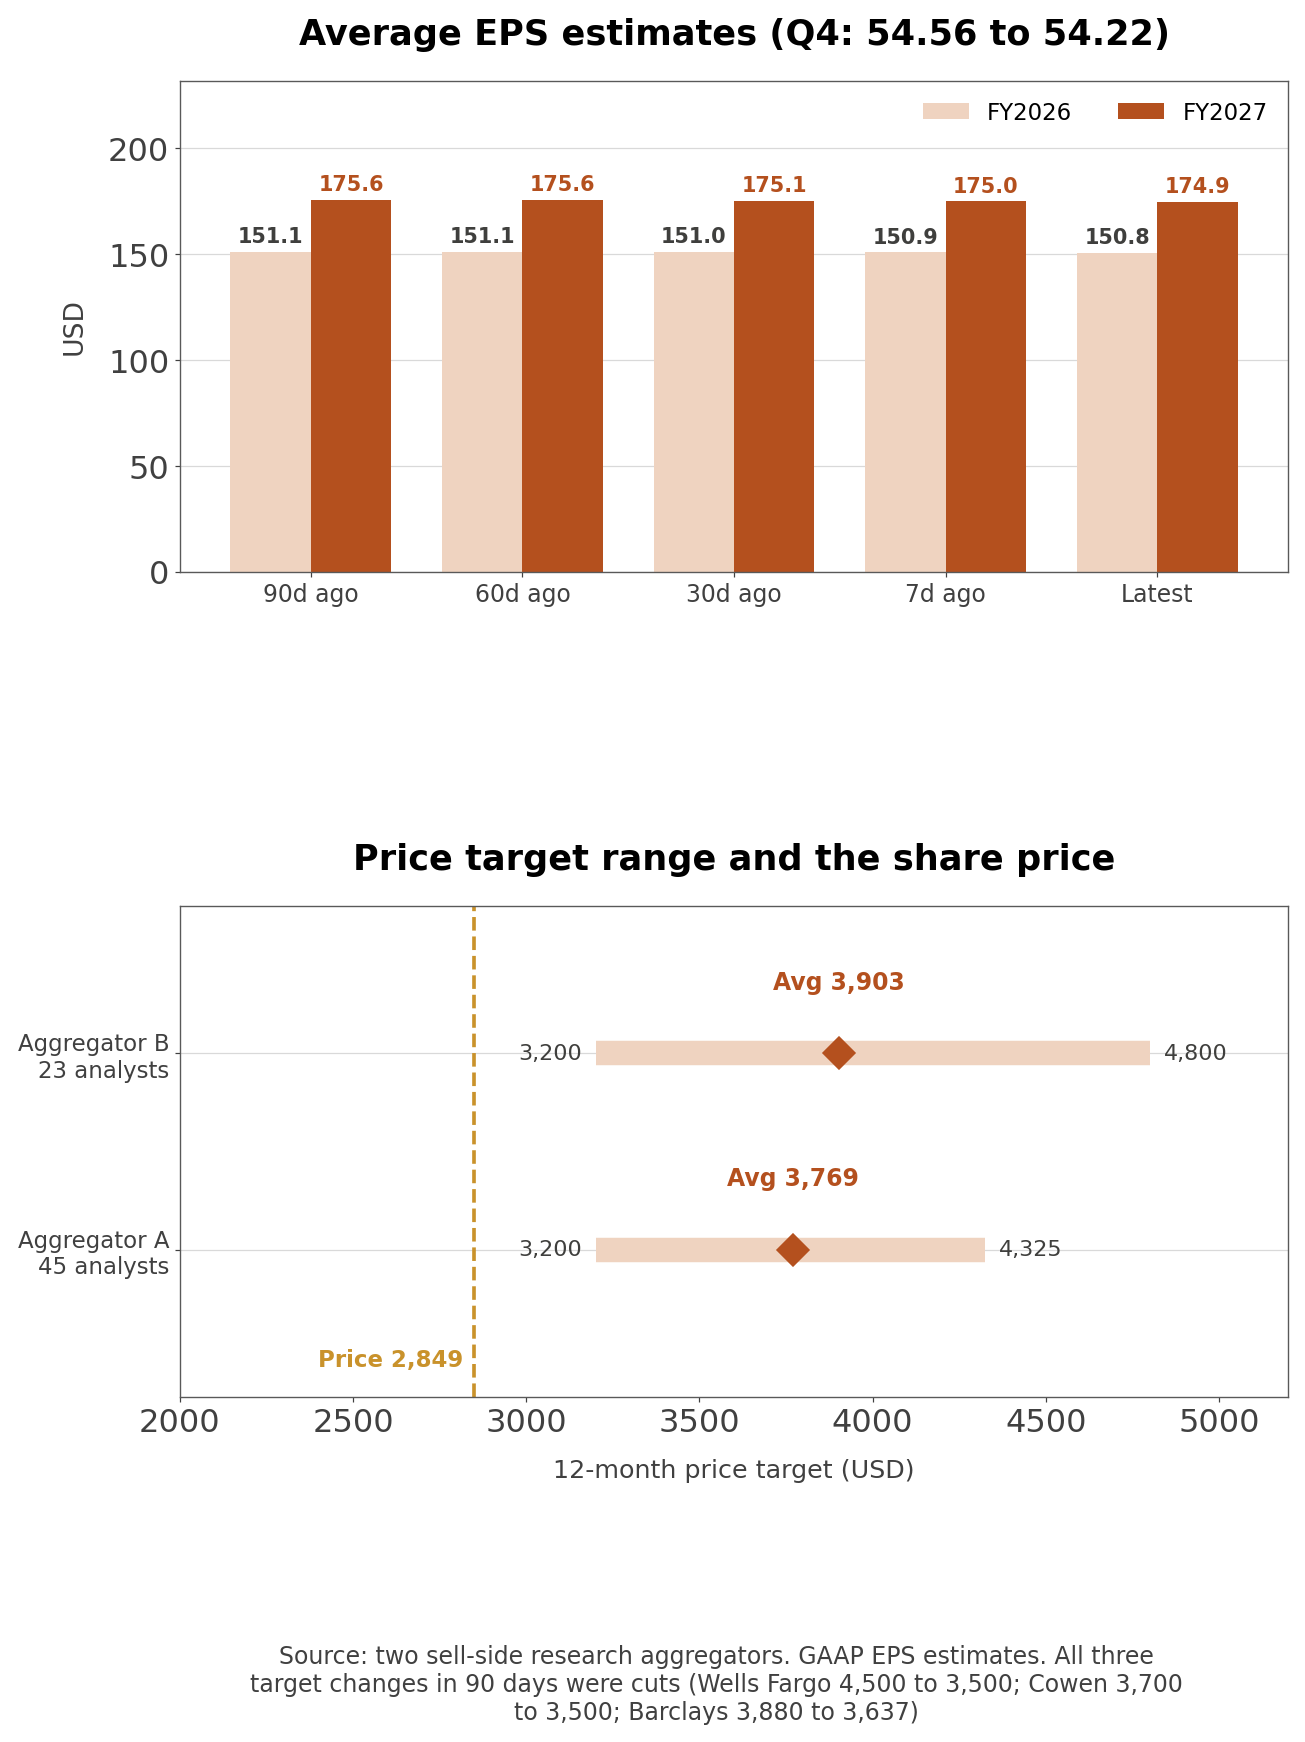
- The average Q4 EPS estimate is $54.22, +11.3% above the $48.71 of Q4 FY2025, but it has drifted down from $54.56 ninety days ago. AutoZone does not give quarterly EPS guidance. On the Q3 earnings call management reiterated 355 to 365 store openings for FY2026, capex of about $1.6 billion this year and next, a Q4 LIFO charge of about $30 million and average ticket growth in the mid-4% range.
- Aggregated sell-side research shows 45 analysts, 32 at Buy and 12 at Hold. Their average 12-month target is $3,769, in a range of $3,200 to $4,325. A second aggregator shows an average of $3,903, between $3,200 and $4,800. AutoZone beat the average EPS estimate in two of the last eight quarters.
| Date | Broker | Rating | Target ($) |
| 2026-09-10 | Wells Fargo | Overweight, reiterated | 4,500 to 3,500 |
| 2026-08-31 | Cowen | Buy, reiterated | 3,700 to 3,500 |
| 2026-08-04 | Barclays | Overweight, reiterated | 3,880 to 3,637 |
- Outside view (Wells Fargo, Cowen and Barclays target changes, Aug to Sep 2026): All three kept their ratings and cut their targets, and UBS and Citigroup reiterated Buy ratings in mid-September. There were no upgrades or downgrades in the 90 days.
- Even the lowest target of $3,200 is +12.3% above the share price, but the three brokers that moved targets all landed below the average. None of the three changed its rating along with the target.
- Estimate revisions have run one way. FY2026 EPS is estimated at $150.76, +4.1% above FY2025, and FY2027 at $174.87, +16.0% above that, with three analysts cutting FY2027 in the last 30 days. On those estimates the stock trades at 18.9x FY2026 and 16.3x FY2027 EPS. The FY2027 number needs lower LIFO charges and profit from new stores to arrive at the same time.
JPMorgan and Vanguard Stakes and the CEO Handover
- Two holders report more than 5%, both above 7%.
| Holder | Shares | Reported stake | Filed |
| JPMorgan Chase | 1,235,814 | 7.5% | 13G/A, 2026-07-27 |
| Vanguard Capital Management | 1,241,699 | 7.53% | 13G, 2026-04-29 |
- At the 10-Q cover share count those stakes are 7.57% and 7.61%, worth $3.52 billion and $3.54 billion at the price in this article. JPMorgan's reported stake rose from 4.2% in June 2025 to 6.8% in May 2026 and 7.5% in July. The Vanguard Group reported 0% in a March 13G/A, and Vanguard Capital Management filed its own 13G in April.
- Of 25 well-known managers whose 13F information tables I checked, eight held AutoZone common stock at June 30, 182,159 shares in total or 1.12% of shares outstanding, with options excluded. Renaissance Technologies was the largest at 84,260 shares, up from 34,190 at March 31. Point72 went from 26,219 to 58,104 shares, and Citadel opened a 7,834-share position. D.E. Shaw cut from 44,034 shares to 364 and Two Sigma from 54,867 to 7,455. Berkshire Hathaway, Pershing Square and 15 other concentrated long-term investors held none, so every holder on the list is a quant, multi-manager or macro fund.
- The CEO handover was an internal succession, and its timing matters for the numbers above. An 8-K filed October 8, 2025 moved Rhodes from executive chairman to chairman effective January 2026, with $250,000 a year in immediately vested restricted stock units, and announced another $1.5 billion of buyback authorization the same day. Daniele came up through the commercial business, and commercial sales and mega hub spending are exactly what grew fastest after he took over. At the December 2025 annual meeting all 11 directors were elected and 10.0% of votes cast opposed the say-on-pay proposal.
How AutoZone Compares With O'Reilly and Advance Auto Parts
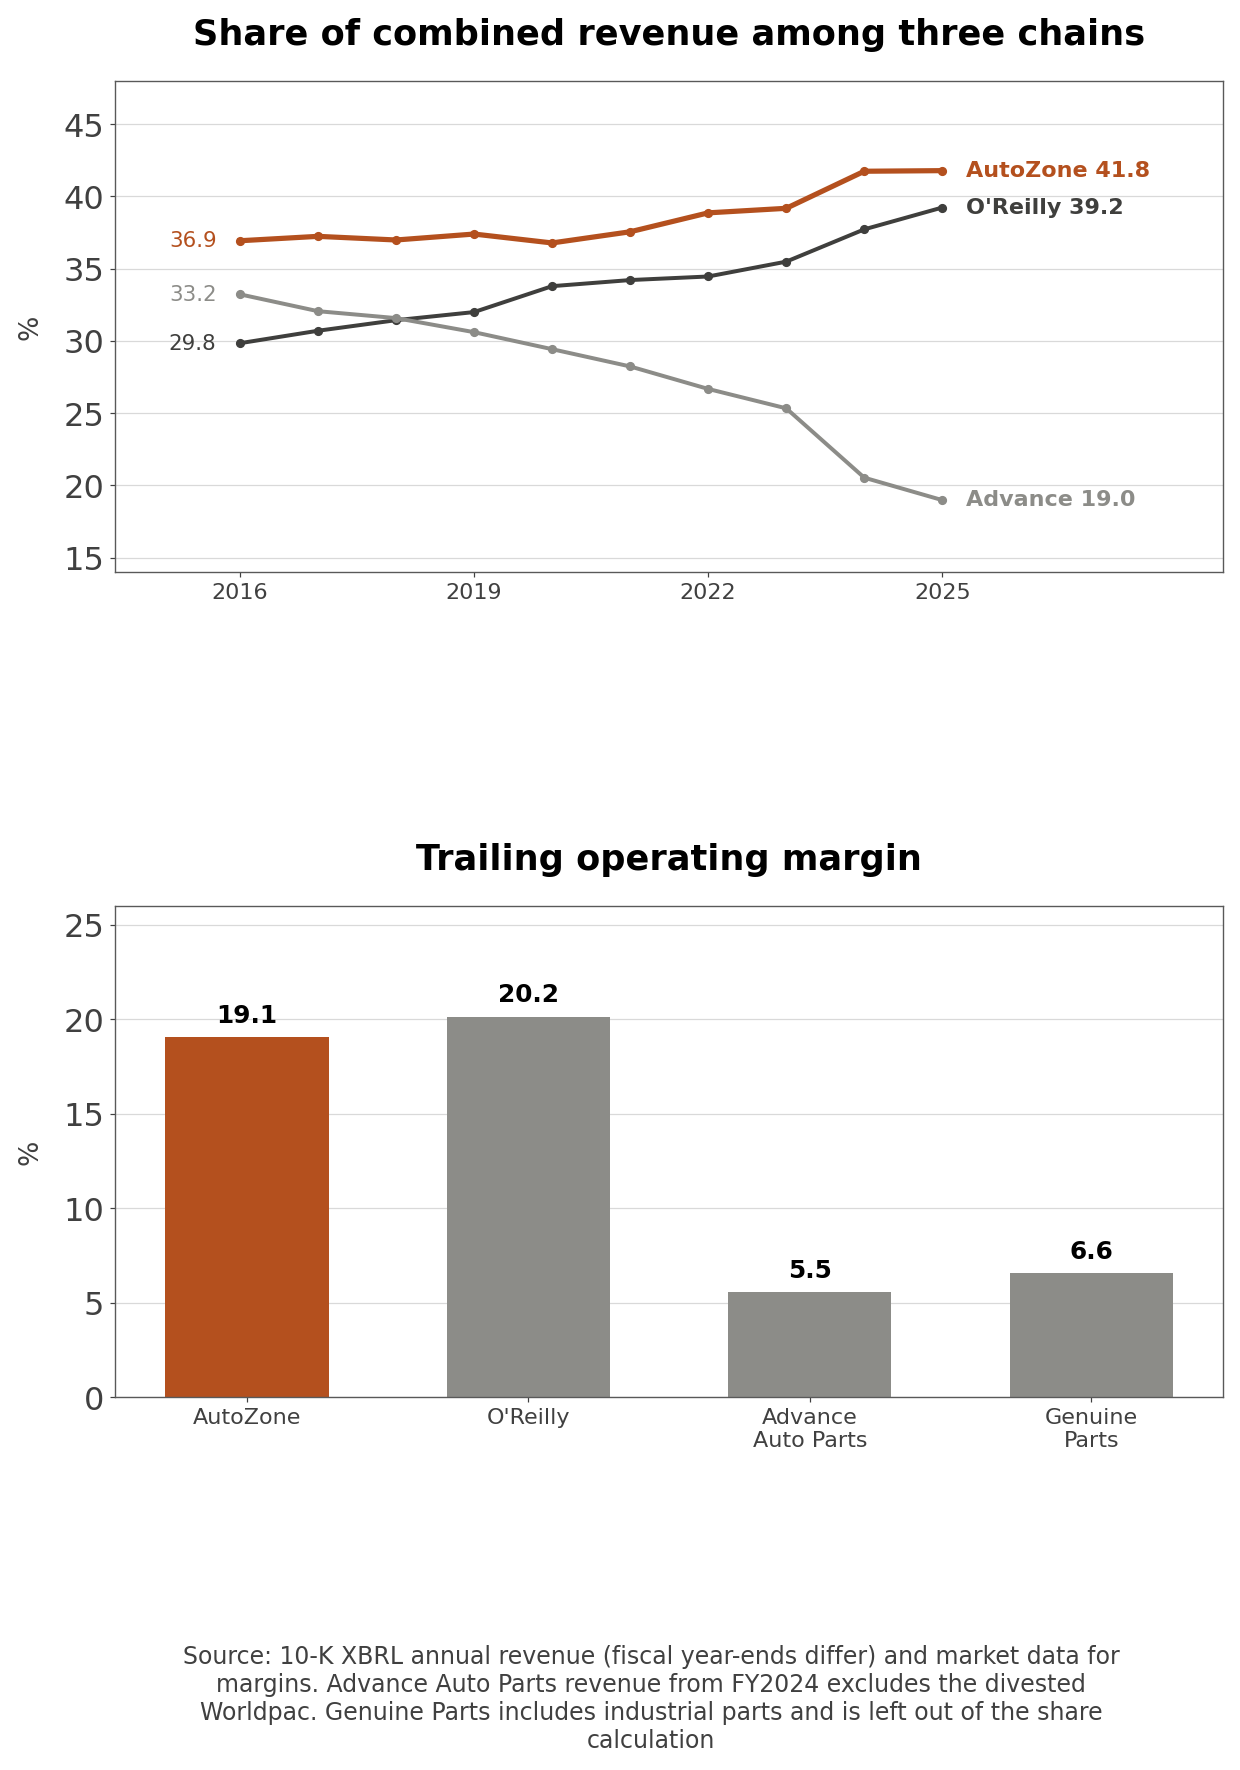
- Among the three US-listed auto parts retail chains, AutoZone's share of combined revenue rose from 36.9% in FY2016 to 41.8% in FY2025, while O'Reilly's rose faster, from 29.8% to 39.2%, and Advance Auto Parts fell from 33.2% to 19.0%. This is a share of three companies' revenue, not market share.
- AutoZone belongs in the mature large-cap bucket, where growth is in single digits and returns come from capital allocation. That bucket gets three tests: multiples, operating margin and how each company splits cash between capex and buybacks. The peers are O'Reilly Automotive, Advance Auto Parts and Genuine Parts, which owns the NAPA distribution network.
| Company | Ticker | Market cap ($bn) | Trailing P/E | Forward P/E | EV/EBITDA | Trailing operating margin |
| AutoZone | AZO | 46.5 | 19.7x | 16.3x | 13.9x | 19.1% |
| O'Reilly Automotive | ORLY | 67.7 | 27.0x | 22.9x | 18.5x | 20.2% |
| Advance Auto Parts | AAP | 2.5 | 24.2x | 10.8x | 8.0x | 5.5% |
| Genuine Parts | GPC | 18.0 | n/m | 15.7x | 11.7x | 6.6% |
- This table uses aggregator definitions. AutoZone's 19.7x trailing P/E is the aggregator figure, slightly different from the 19.59x trailing GAAP P/E in my band because the EPS windows differ, and Genuine Parts' trailing P/E is above 500x on very low trailing net income, so it is shown as not meaningful.
| Company | Fiscal year-end | Free cash flow ($m) | Buybacks ($m) | Capex ($m) | Buybacks / FCF |
| AutoZone | Aug 2025 | 1,790 | 1,578 | 1,327 | 0.88x |
| O'Reilly Automotive | Dec 2025 | 1,593 | 2,097 | 1,169 | 1.32x |
| Advance Auto Parts | Dec 2025 | -298 | 7 | 252 | n/m |
| Genuine Parts | Dec 2025 | 421 | 0 | 470 | 0.00x |
- O'Reilly still buys back more than its free cash flow while spending less on capex than AutoZone, and Advance Auto Parts, with negative free cash flow, has nearly stopped. Of the four, AutoZone is the only one with capex above $1 billion and buybacks below free cash flow in its last fiscal year.
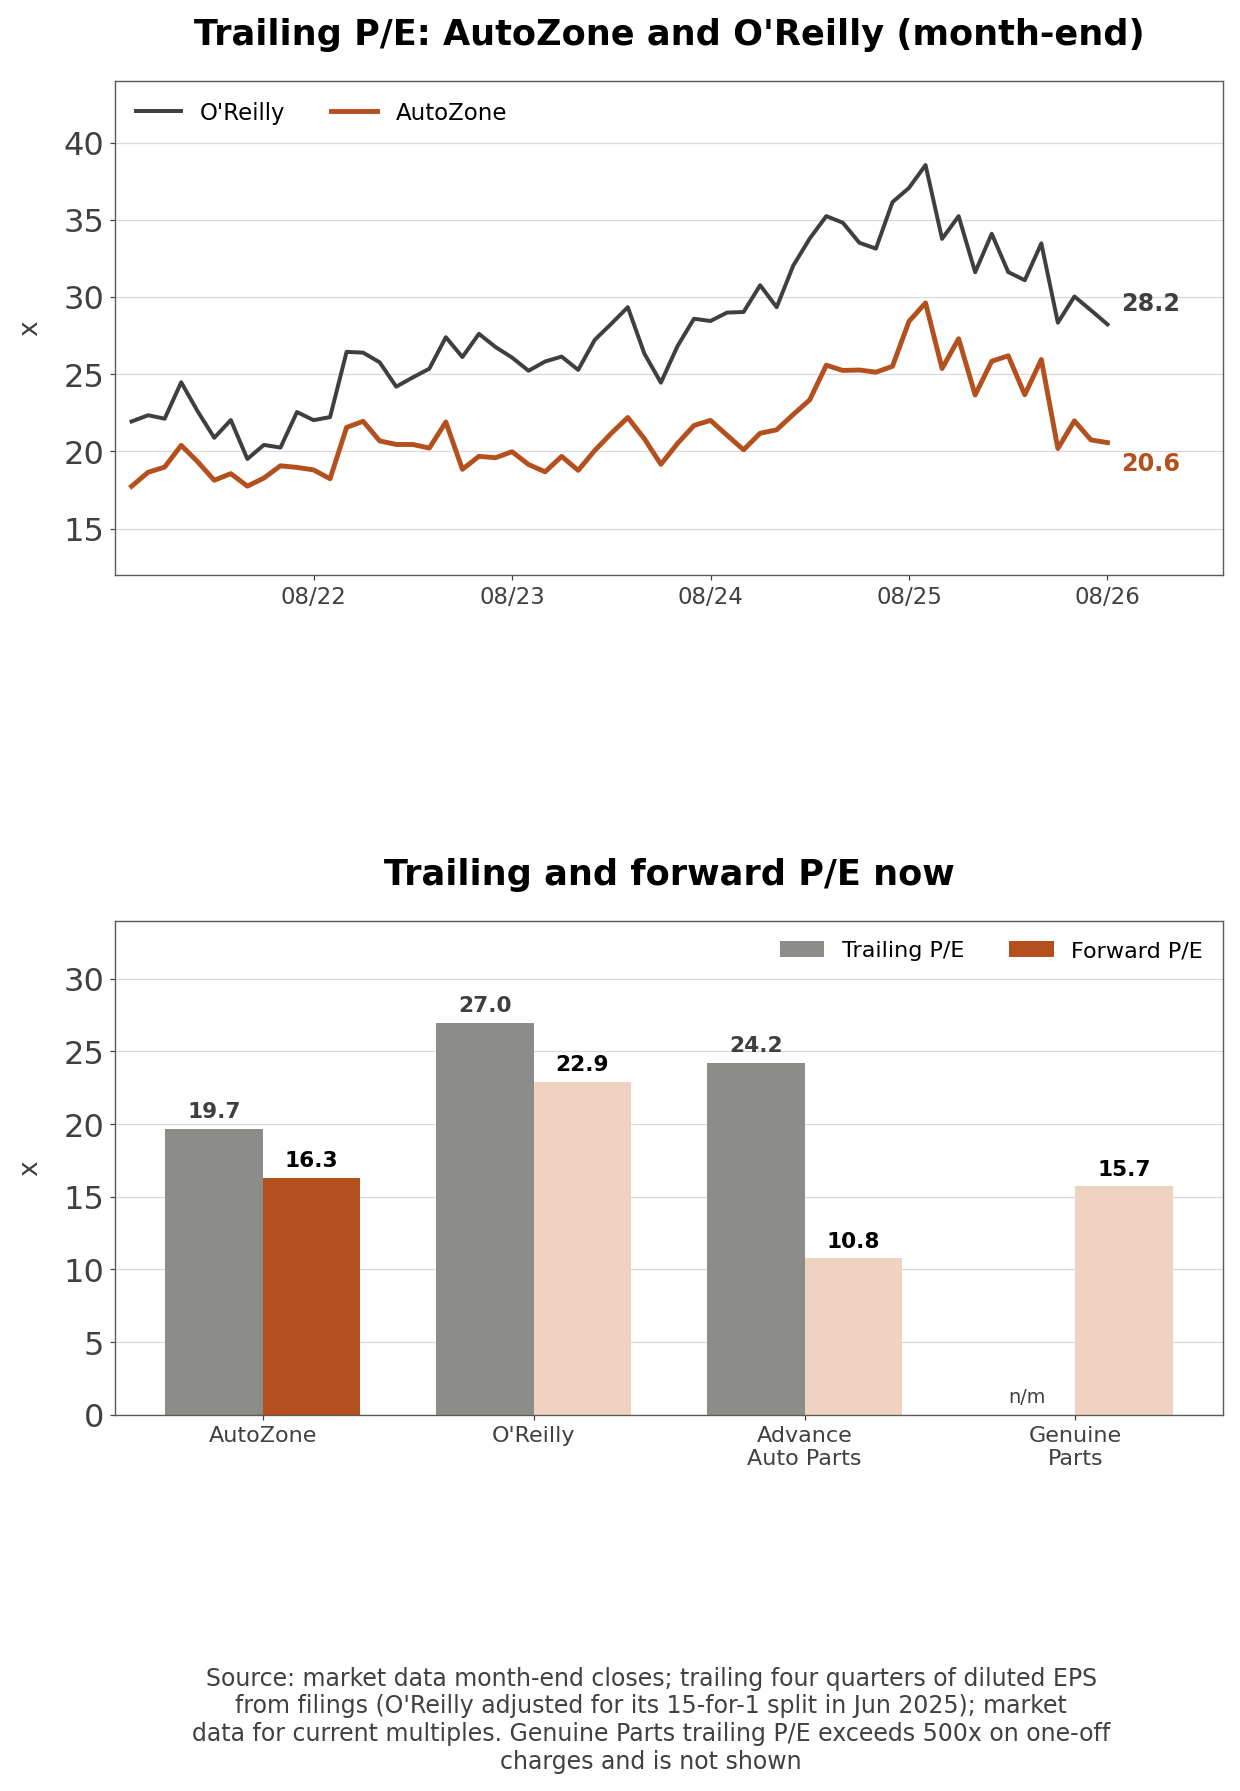
- On my own month-end calculation, O'Reilly's trailing P/E is 26.59x against 19.59x for AutoZone, a 7.0-point gap. Over 60 months the gap ranged from 1.2 points in June 2022 to 10.6 points, and it sits in the upper part of that range now. O'Reilly's EPS history is adjusted for its 15-for-1 split in June 2025.
- The operating margin difference between the two is only 1.1 points, yet the P/E gap is wide. The revenue share shift toward O'Reilly points the same way, and AutoZone management said on the Q3 call that nearby competitors have much higher commercial mixes, which is why it called domestic commercial share its top priority for FY2026.
- The number of competitors and market share cannot be verified. The 10-K lists national, regional and local auto parts chains, independent parts stores, online marketplaces, wholesale distributors, jobbers, repair shops, dealers and mass merchants as competitors without giving a share, and Census retail sales include tire stores and miss part of sales to repair shops, so AutoZone's revenue cannot be divided by them.
US Auto Parts Sales and Parts Inflation
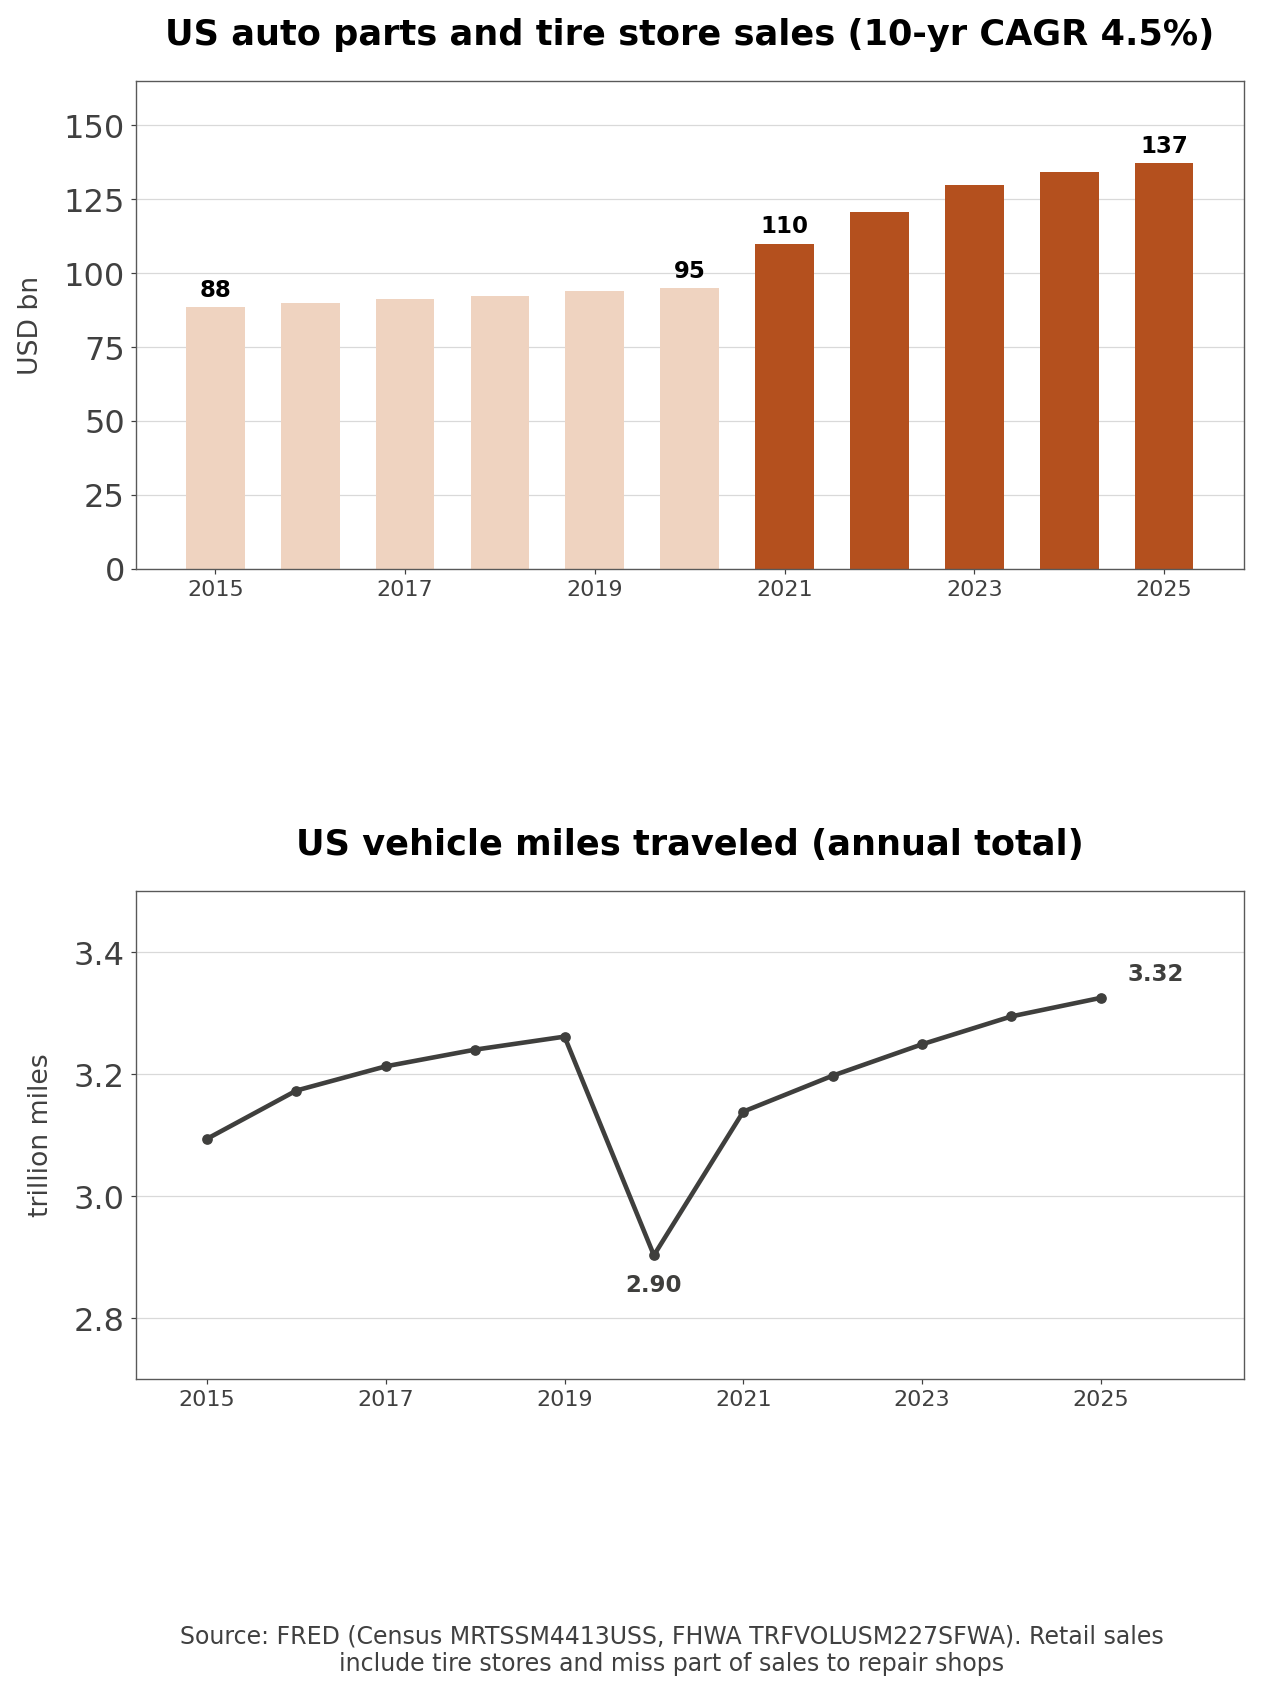
- US auto parts, accessories and tire store sales grew from $88.4 billion in 2015 to $137.0 billion in 2025, a compound annual growth rate of 4.48%, but only 2.2% in 2025.
- Official statistics (FRED MRTSSM4413USS and TRFVOLUSM227SFWA, seasonally adjusted monthly data): Sales reached $109.9 billion in 2021, 15.7% above 2020. Growth slowed in each of the next four years, to 2.2% in 2025. The latest twelve months are 3.2% above the prior twelve. Vehicle miles traveled fell from 3.261 trillion in 2019 to 2.903 trillion in 2020 and reached 3.325 trillion in 2025.
- Miles driven in 2025 were +1.9% above 2019, so the wear that drives parts demand is back above pre-pandemic levels. Management pointed on the call to a growing and aging car fleet and expensive new and used cars as tailwinds for DIY demand. AutoZone's FY2025 sales grew 4.5% excluding the 53rd week, faster than the industry's 2.2%, although the fiscal and calendar years are four months apart.
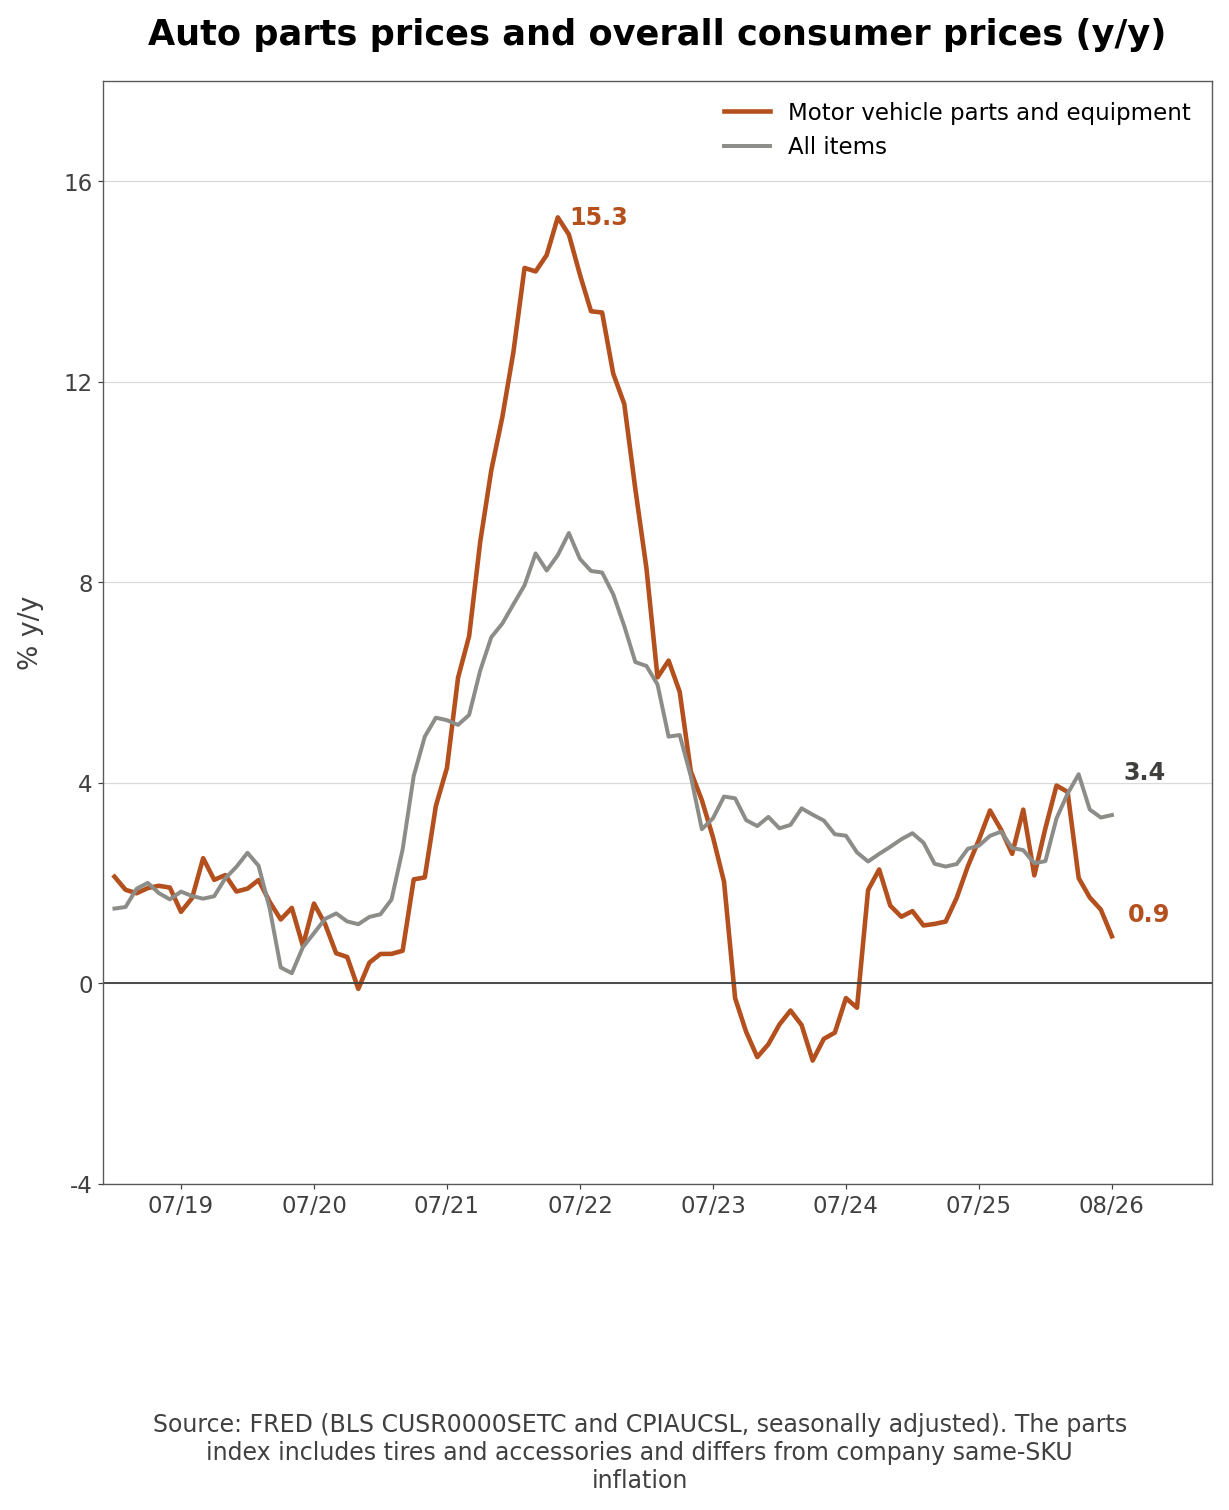
- Consumer price inflation for motor vehicle parts and equipment peaked at 15.3% in May 2022 (FRED CUSR0000SETC and CPIAUCSL). It reached 3.4% in August 2025, above 2.9% for all items, and slowed to 0.9% in August 2026, below 3.4% for all items. Motor vehicle maintenance and repair services inflation was 5.2% in the same month (CUSR0000SETD).
- A year after the tariffs, parts inflation is cooling. AutoZone's same-SKU inflation above 7% measures its own selling prices on identical items, while the official index covers consumer prices including tires and accessories, so the levels differ, but both face tougher comparisons from Q4.
- When parts prices rise more slowly than overall prices, the price-driven part of sales growth shrinks and so do LIFO charges. Repair service prices rising faster than parts prices make shop repairs more expensive, and DIY transaction counts will show whether some drivers go back to fixing their own cars.
Conditions That Would Move AZO Stock
| Scenario | Condition | Indicator to check | When · Source |
| Upside | ROIC stops falling and holds at 36% or higher | Adjusted after-tax ROIC table | Q4 results in late September · 8-K release |
| Downside | ROIC drops below 35% | Adjusted after-tax ROIC table | Q4 results · 8-K release |
| Upside | Q4 LIFO charge of about $30 million or less | LIFO footnote | Q4 results · earnings presentation |
| Downside | DIY transactions down 4% or more | DIY traffic comments | Q4 earnings call |
| Upside | Domestic commercial sales growth near 10% | Commercial sales growth | Q4 results · earnings presentation |
| Downside | Buybacks above free cash flow with more note issuance | Cash flow statement and 8-K filings | FY2026 10-K |
- The first two rows carry the most weight. While buybacks stay below net income, invested capital keeps rising, so ROIC stops falling only if the after-tax return grows faster than invested capital. Q4 compares a planned LIFO charge of about $30 million with $80 million a year earlier, which favors the numerator; a further ROIC decline in that quarter would suggest the returns from new investment are arriving late.
What Mega Hub Returns Still Need to Show
- AutoZone says mega hubs lift sales at surrounding stores and that new stores beat their plans, but it does not disclose returns on mega hubs or new stores. The ROIC in the release mixes existing stores with new investment, so the 11-quarter decline cannot be split between investments that have not matured and existing stores earning less.
- Holding invested capital at $8.91 billion, getting ROIC back to last year's 43.5% would require an after-tax return of $3.88 billion, $639 million or 19.7% more than today. With 156 mega hubs open, a target of about 300 and capex of about $1.6 billion planned again for next year, which disclosure would show whether the $1.07 billion of property added over the last year earns that return: sales lift by mega hub cohort, or commercial sales per program in markets where a mega hub opened?
Related Analysis
- Texas Instruments (TXN) Stock Analysis: Cash Flow and Capex: compare another company whose rising capex cut into the free cash flow it used to return to shareholders.
- lululemon (LULU) Stock Analysis: Margin Decline and Tariffs: see how a retailer explained tariff costs in its gross margin, next to AutoZone's LIFO charges.
Methodology and Sources
- The share price is $2,849.04 and the share count is 16,325,355 from the cover of the Q3 FY2026 10-Q. Monthly band multiples use quarter-end shares outstanding.
- Company figures come from the Q3 FY2026 Form 10-Q, the FY2025 Form 10-K, the Q3 FY2026 earnings 8-K, AutoZone's 8-K earnings releases and the quarterly earnings presentations on its investor relations site. Industry data come from FRED series MRTSSM4413USS, TRFVOLUSM227SFWA, CUSR0000SETC, CPIAUCSL and CUSR0000SETD, and peer and consensus figures from market data and sell-side research aggregators.
- I parsed all 33 earnings releases from Q3 FY2018 to Q3 FY2026 in code and used the 26 quarters that include the non-GAAP ROIC table. Cash flows reconcile ten fiscal years of 10-K XBRL data with the 36-week figures in the 10-Q, and I read 11 earnings presentations from Q1 FY2024 onward. The bands use 60 month-end closes from September 2021 to August 2026 plus the latest price. Call figures come from management's remarks and are used where the release and presentation do not report them. This analysis is not investment advice.
#AutoZone #AZO #AZOStock #AZOStockAnalysis #AutoParts #RetailStocks #ShareBuybacks #USStocks #StockAnalysis #EquityResearch #GlobalStockBrief
'US Stock Analysis' 카테고리의 다른 글
| Halozyme (HALO) Stock: $143M of Equity and $1.3B of Notes (0) | 2026.09.21 |
|---|---|
| Illumina (ILMN) Stock: What Is Left After Acquisitions (0) | 2026.09.20 |
| NVIDIA (NVDA) Stock Analysis: Guarantees and Cash Flow (0) | 2026.09.17 |
| Lennar (LEN) Stock: 12.9% Incentives and a 0.89x P/B (0) | 2026.09.15 |
| Plug Power (PLUG) Stock Analysis: GAAP vs Operating Loss (0) | 2026.09.15 |


