- Plug Power (NASDAQ: PLUG) is a vertically integrated hydrogen company that sells fuel cells for warehouse forklifts, PEM electrolyzers for industrial hydrogen projects, and hydrogen fuel from its own plants in Georgia, Tennessee and Louisiana. At a $2.10 share price the market capitalization is about $2.93 billion. This PLUG stock analysis works through the gap between operating loss and net loss in the second quarter of 2026, the convertible notes and warrants that created that gap, the revenue mix underneath a 2.5% headline growth rate, the cost of electricity that sets the floor under hydrogen margins, peer comparisons against Bloom Energy, Ballard Power, FuelCell Energy, Air Products and Linde, and the valuation bands that two different multiples disagree about.
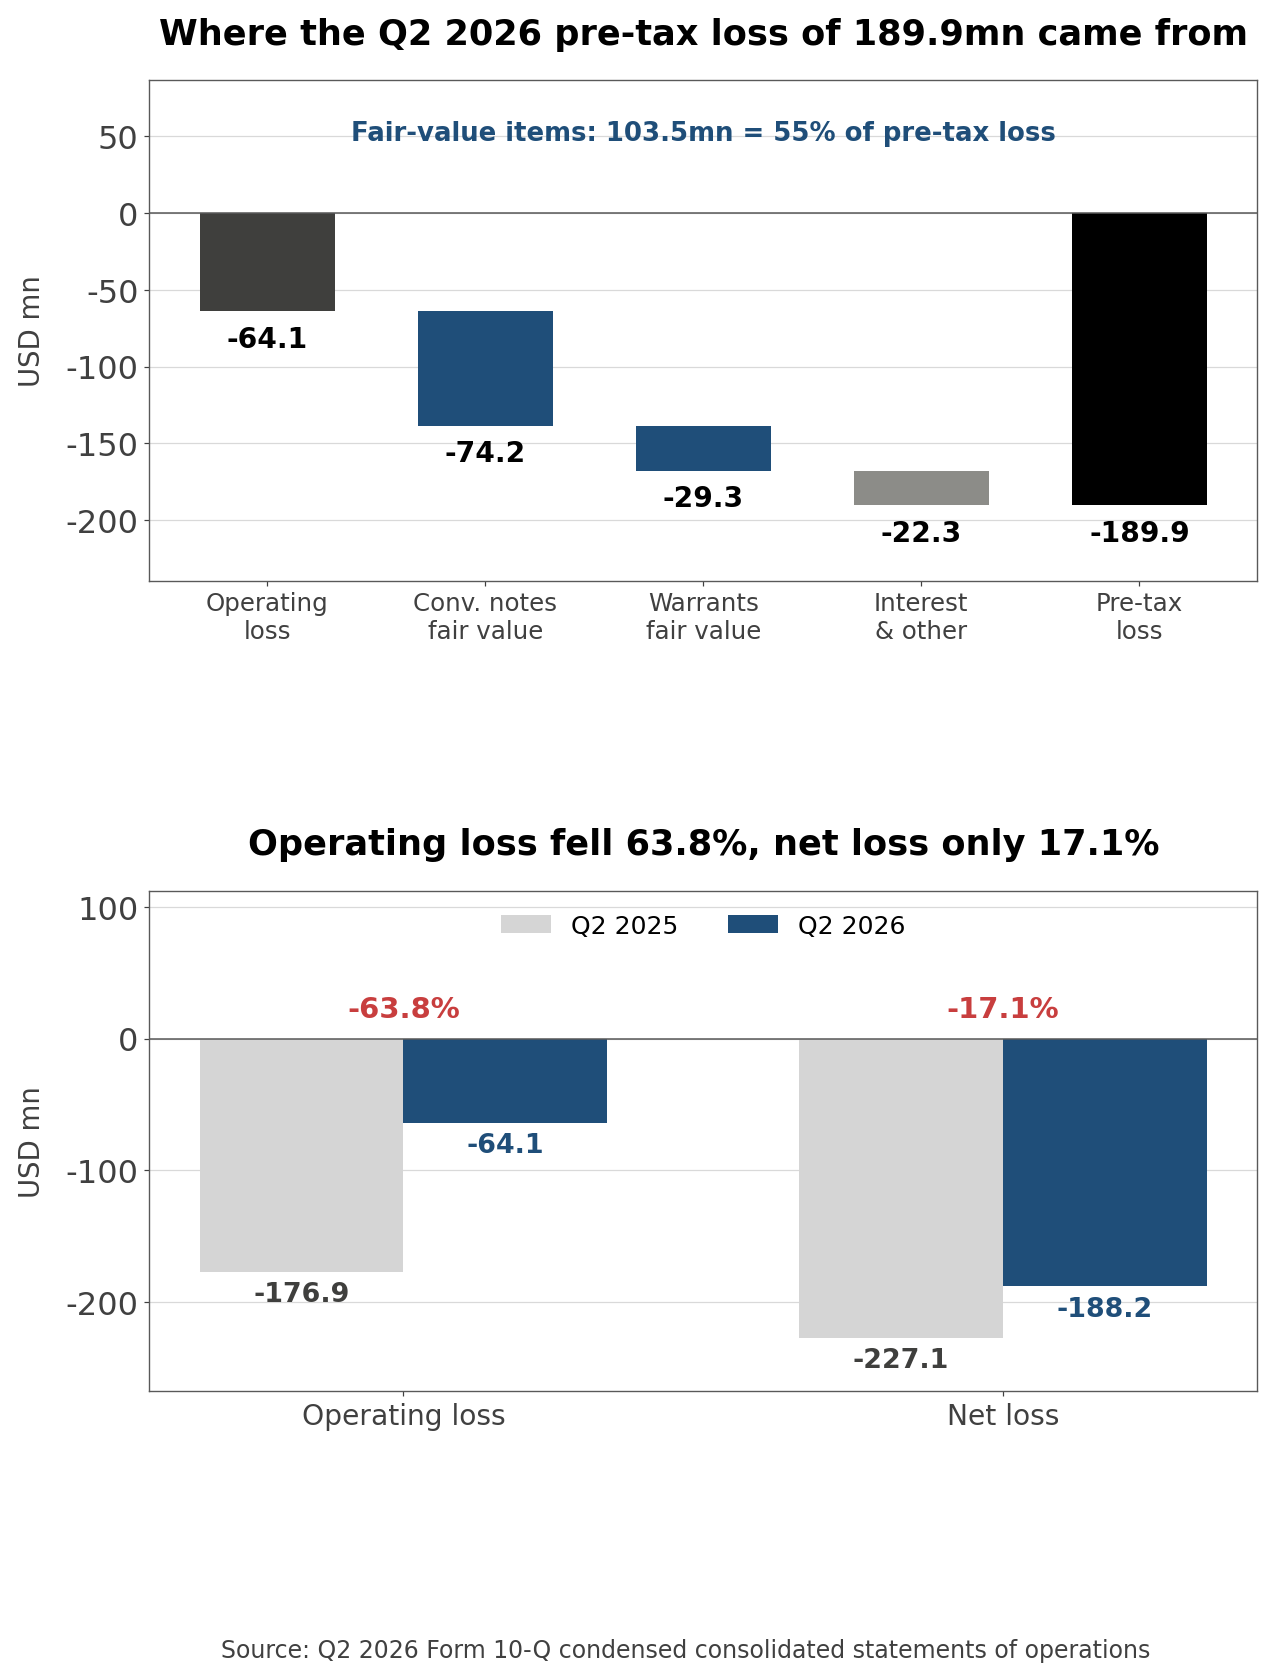
- Here is the part that is easy to miss. Plug cut its operating loss from $176.95 million to $64.11 million in a year, a decline of 63.8%. Net loss attributable to shareholders fell only 17.1%, from $227.10 million to $188.21 million. Of the $112.84 million the company saved at the operating line, $73.95 million never reached the bottom line. Two line items explain almost all of it, and both of them got worse because the stock went up.
What the April 2026 Investor Deck Is Selling
- Plug Power posted an 18-page investor presentation on April 8, 2026, and followed it with a 15-page annual meeting deck on June 11. Read side by side, the two documents show what the company wants to sell and, more usefully, which sentence it changed in the two months between them.
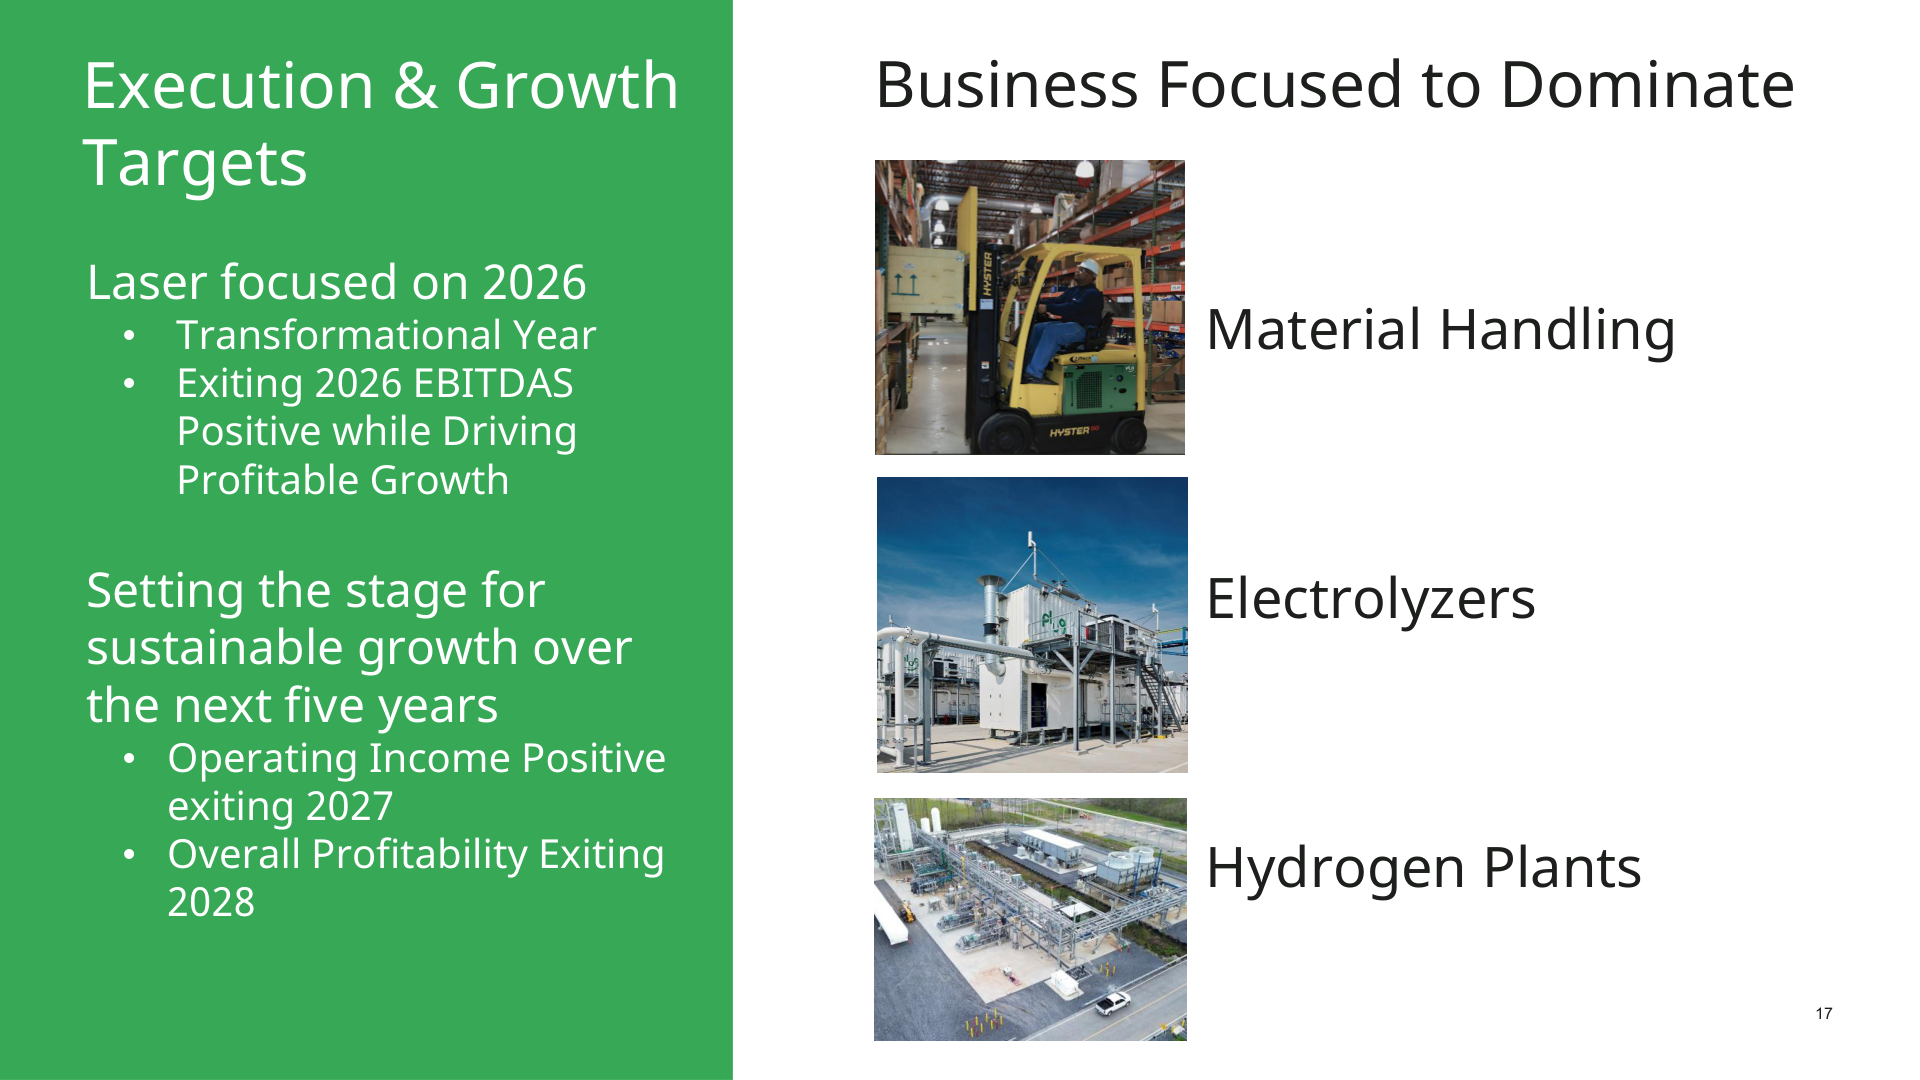
- Company disclosure (investor presentation p5 and p17, April 2026): Plug frames itself as three businesses, material handling fuel cells, electrolyzers and hydrogen plants, and hangs one target on each of the next three years. "Exiting 2025: Gross Margin Positive" carries a checkmark. Then "Exiting 2026: EBITDAS Positive," "Exiting 2027: Operating Income Positive," and "Exiting 2028: Overall Profitability."
- The same slide appears on page 4 of the June deck with one edit. April's "Exiting 2025: Gross Margin Positive" became "YE 2025: Gross Margin Neutral." Positive was downgraded to neutral.
- The June wording is the more honest one. Q4 2025 gross margin was +2.4%, but Q1 2026 came in at minus 13.2% and Q2 at minus 0.9%. April turned a single positive quarter into a checked box; June looked at the two quarters that followed and softened the claim. A company that visibly corrects its own slide is, if anything, a point in favor of reading the rest of the deck seriously.
- One more detail on the cover: it reads "Copyright 2023, Plug Power Inc." A deck posted in April 2026 carrying a three-year-old copyright line is a template that was reused rather than rebuilt. That matters for the electricity slide below.
Three Numbers the Deck Uses for Scale
- Plug measures itself with three figures. Lining up the values from the April deck, the June deck and the August earnings release shows which business is actually moving.
| Metric | April investor deck | June annual meeting deck | August earnings release |
| GenDrive units installed | 72,000+ | 74,000+ | 76,000+ |
| Sites | 275 | 280+ | 280+ |
| Cumulative operating hours | 1 billion+ | not shown | not shown |
| Electrolyzers deployed | 320 MW, 70+ units, 6 continents | not shown | not shown |
| Own hydrogen capacity | Georgia 15, Louisiana 15, Tennessee 10 TPD | same | about 40 tons per day |
- Company disclosure (investor presentation p8, p10 and p13, April 2026): Material handling is described as "72,000+ installed and 275 locations, 1 billion+ operational hours, 45+ tons hydrogen dispensed everyday, 95+ MW of electricity abated from the grid." Electrolyzers are "320 MW across more than 70 units on 6 continents." Hydrogen plants are "Georgia 15TPD, Louisiana 15TPD, Tennessee 10TPD," 40 tons a day combined.
- The installed base grew by 4,000 units in four months, which lines up with 1,666 deployments in Q2 alone. That is the same direction as fuel cell system revenue, up 105.2% in the quarter. Of the three businesses, material handling is the only one whose deck numbers and income statement numbers move at the same speed.
- Electrolyzers run the other way. Cumulative deployment sits at 320 MW in both decks, and Q2 electrolyzer revenue was $13.22 million. Page 11 states "2.5GW+ of installed electrolyzer stack annualized capacity." A factory able to build 2.5 GW a year has, over the company's entire history, shipped 320 MW, or 13% of one year's output. The company's own figures say the electrolyzer bottleneck is not on the manufacturing side.
- The hydrogen numbers carry a different catch. Page 8 says Plug dispenses more than 45 tons a day; page 13 puts its own capacity at 40 tons. The June deck adds a footnote to that 40: "'live capacity' refers to nameplate or designed capacity and not actual utilization." If actual output runs below nameplate, the gap to 45 tons widens, and every ton of that gap is bought from someone else. The sellers are the industrial gas majors, Linde and Air Products. That is roughly half the explanation for a fuel segment gross margin of minus 48.8%. When a company still buys more hydrogen than it makes, the market sets the selling price and the supplier sets the cost.
Testing the Slide That Says 2025 Revenue Covered Cash Burn
- The strongest claim in the deck is on page 16.
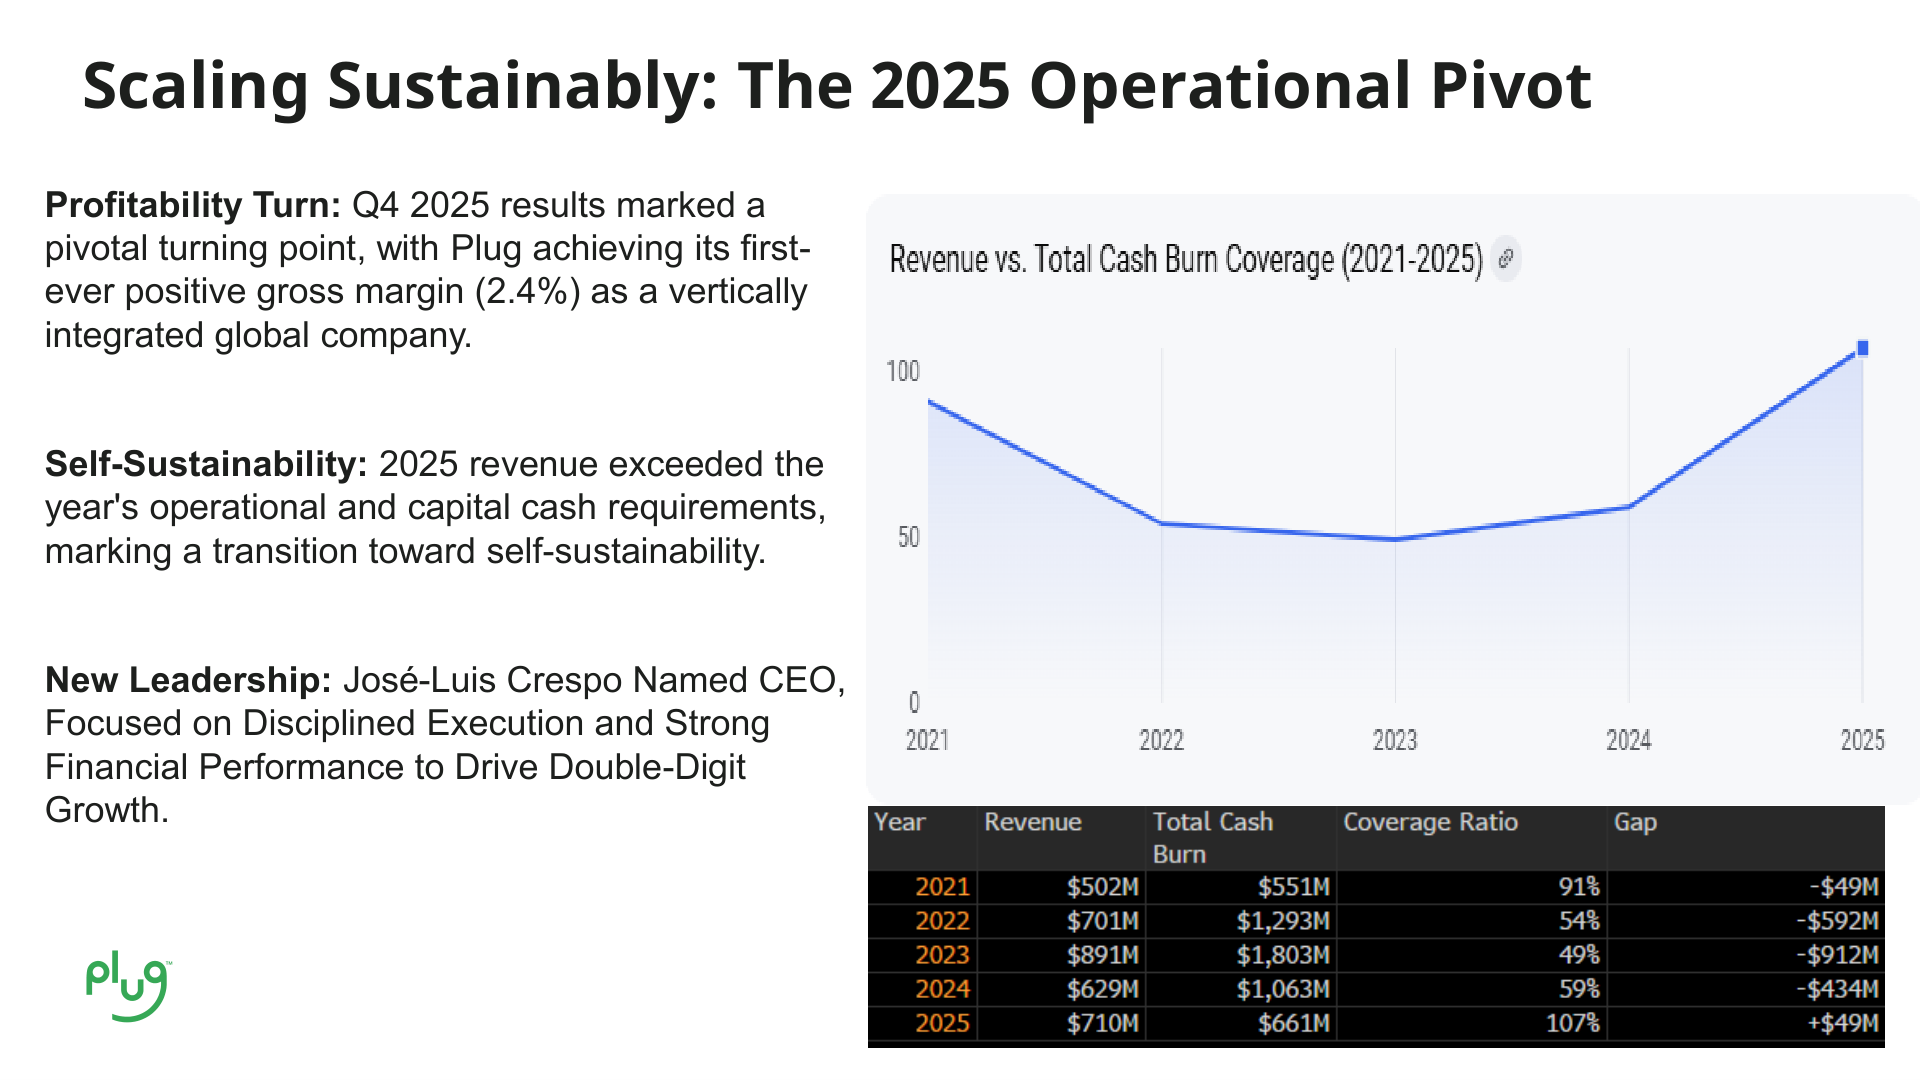
- Company disclosure (investor presentation p16, April 2026): "Self-Sustainability: 2025 revenue exceeded the year's operational and capital cash requirements, marking a transition toward self-sustainability." Beside it sits a table titled "Revenue vs. Total Cash Burn Coverage (2021-2025)": 2021 revenue $502 million against burn $551 million (91%), 2022 $701 million against $1,293 million (54%), 2023 $891 million against $1,803 million (49%), 2024 $629 million against $1,063 million (59%), 2025 $710 million against $661 million (107%).
- The first question is what "Total Cash Burn" contains.
- Own calculation (XBRL annual cash flow statements, CIK 1093691, 2021 to 2025): Operating cash outflow plus purchases of property, plant and equipment comes to $530 million for 2021, $1,265 million for 2022, $1,772 million for 2023, $1,016 million for 2024 and $647 million for 2025. The deck's $551, $1,293, $1,803, $1,063 and $661 million run $14 million to $31 million higher each year, which looks like finance lease principal added on top. The table itself reconciles to the filings.
- The problem is the comparison. Revenue is not cash. While $710 million of revenue came in during 2025, operating activities consumed $536 million and capital expenditure took another $111 million. Even after collecting every dollar of sales, the company was $647 million short. "Revenue exceeded cash requirements" places gross revenue next to net cash outflow, and those two figures are not in the same units.
- What the 107% coverage ratio does say is this: through 2024, cash burn exceeded revenue, and 2025 was the first year burn fell below it. That is true and it matters, because burn dropped from $1,063 million to $661 million, a cut of 38%. It is not the place for the word self-sustainability. Self-sustainability arrives when operating cash flow turns positive, and in 2025 that figure was minus $536 million.
- Extending the table into the first half of 2026 keeps the direction intact. Operating outflow of $244.11 million plus capital expenditure of $8.71 million is $252.82 million, down 33% from $376.45 million a year earlier. That annualizes near $500 million. If 2025 revenue of $710 million grows 15% to 16% as guided, revenue reaches about $820 million and the company's coverage ratio climbs into the 160s. The higher that number goes, the wider the distance between the company's yardstick, revenue over burn, and the one that actually matters, positive operating cash flow.
The Electricity Slide Cuts Both Ways for Plug
- Page 7 is the clearest statement of the sales pitch.
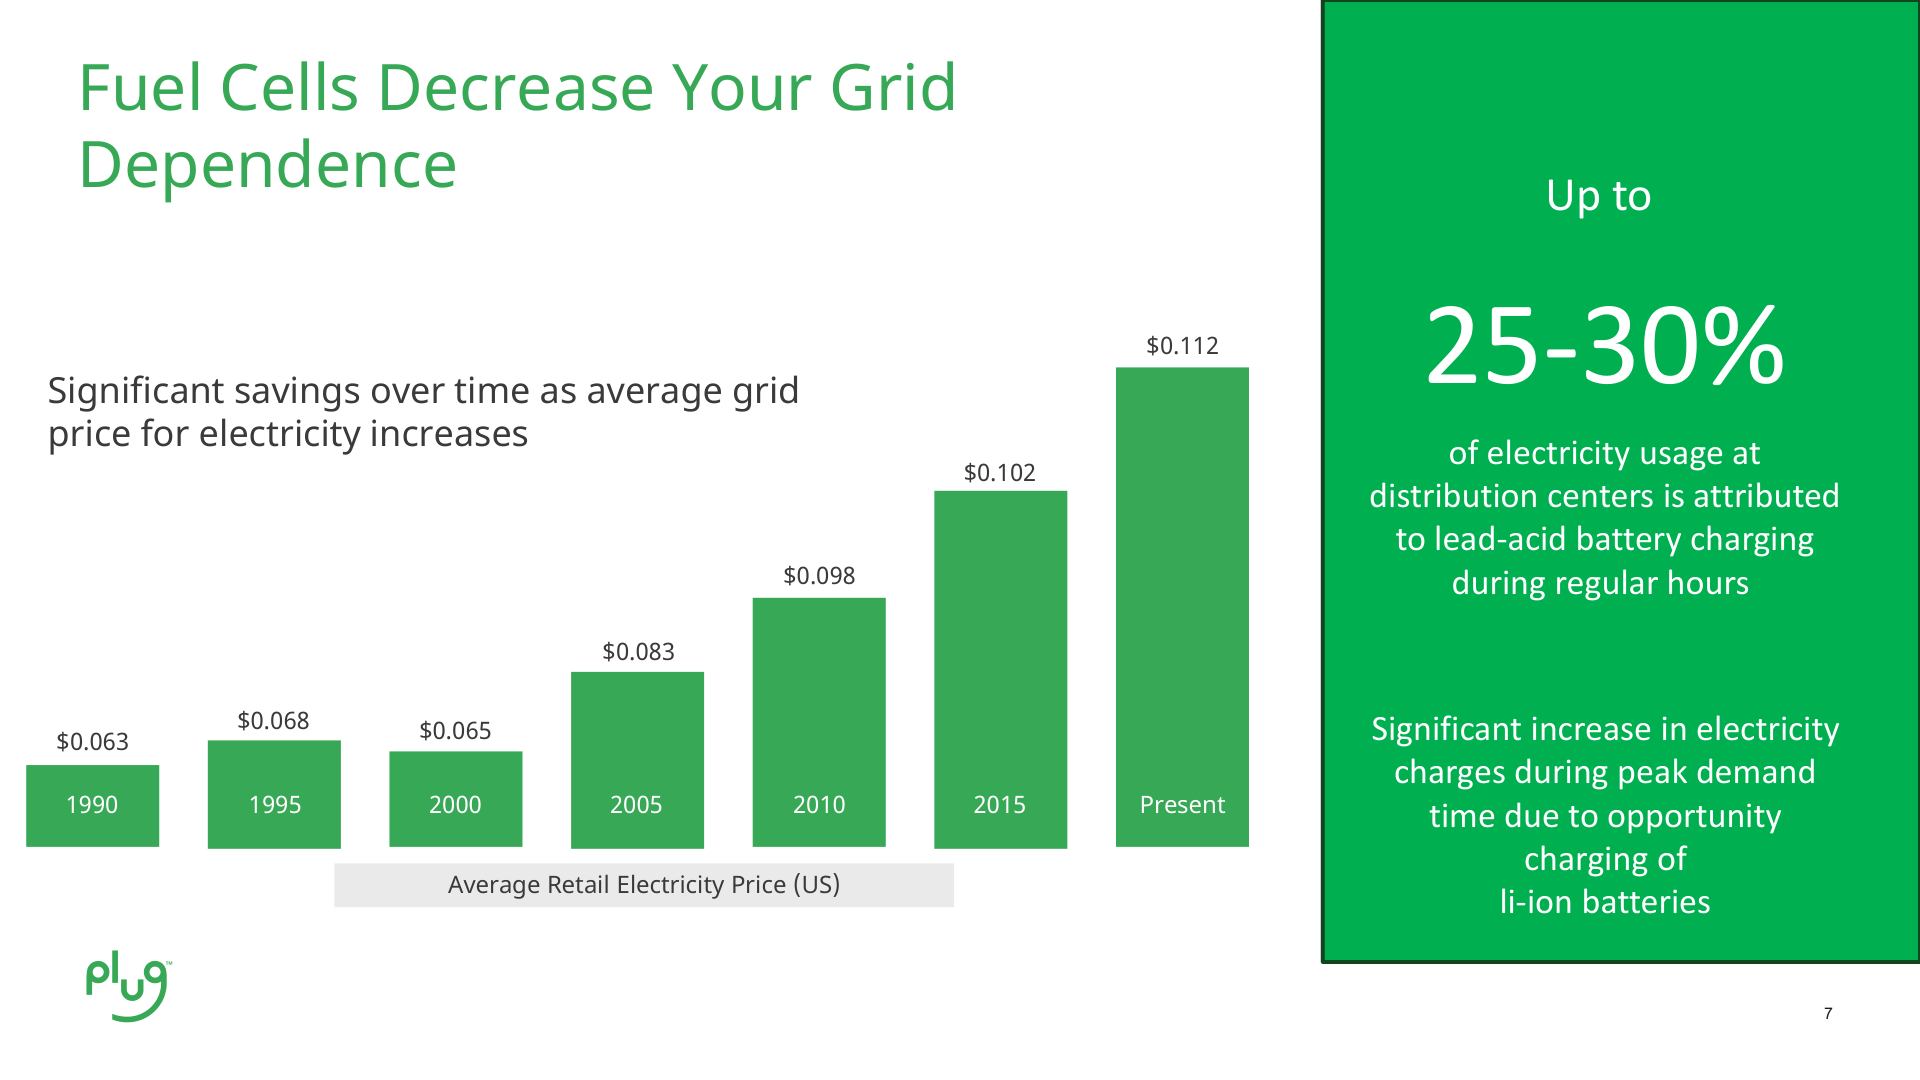
- Company disclosure (investor presentation p7, April 2026): The title is "Fuel Cells Decrease Your Grid Dependence." The slide says 25% to 30% of electricity use at distribution centers goes to charging lead-acid batteries, that opportunity charging of lithium-ion batteries drives a "significant increase in electricity charges during peak demand time," and it charts average US retail electricity from $0.063 per kWh in 1990 to $0.112 at "Present." The takeaway line reads "Significant savings over time as average grid price for electricity increases."
- The logic is simple. The more expensive electricity gets, the better a hydrogen forklift looks against a battery forklift. That is correct. The complication is that Plug is not a company that sells electricity. It is a company that buys electricity to make hydrogen.
- Official statistics (FRED APU000072610, August 2026): The US city-average retail electricity price stood at $0.196 per kWh in August 2026. The $0.112 the deck labels "Present" is not a 2026 figure on any basis. The cover's 2023 copyright shows up again here; this slide was built years ago and reused as is.
- If electricity has risen further than the deck shows, that is a stronger sales point for forklift customers. The same rise is a cost line at the Georgia, Tennessee and Louisiana plants. The industrial electric power producer price index up 14.4% in the three months to August 2026, covered in the industry section below, is that bill arriving. The deck shows only the front of the coin. A variable that is a tailwind for one of three businesses and a headwind for the other two is drawn only as a tailwind.
- That is less a fault of the company than a property of investor decks, which are selling documents. The reader's job is to trace where the single variable "electricity price" lands on the income statement and with what sign: positive for fuel cell sales, negative for fuel cost of goods, negative for the project economics of electrolyzer customers.
Quantum Leap Savings Target Already Met on the Opex Run Rate
- Page 15 lists the path to profitability in nine lines, beginning with "Project Quantum Leap driving $150-$200M in cost savings," then vertical integration, pricing increases across material handling, fixed-cost leverage from equipment sales, supply chain cost-downs, a service cost roadmap, inventory and asset monetization, a sustainable operating cost profile, and consolidation of operating sites.
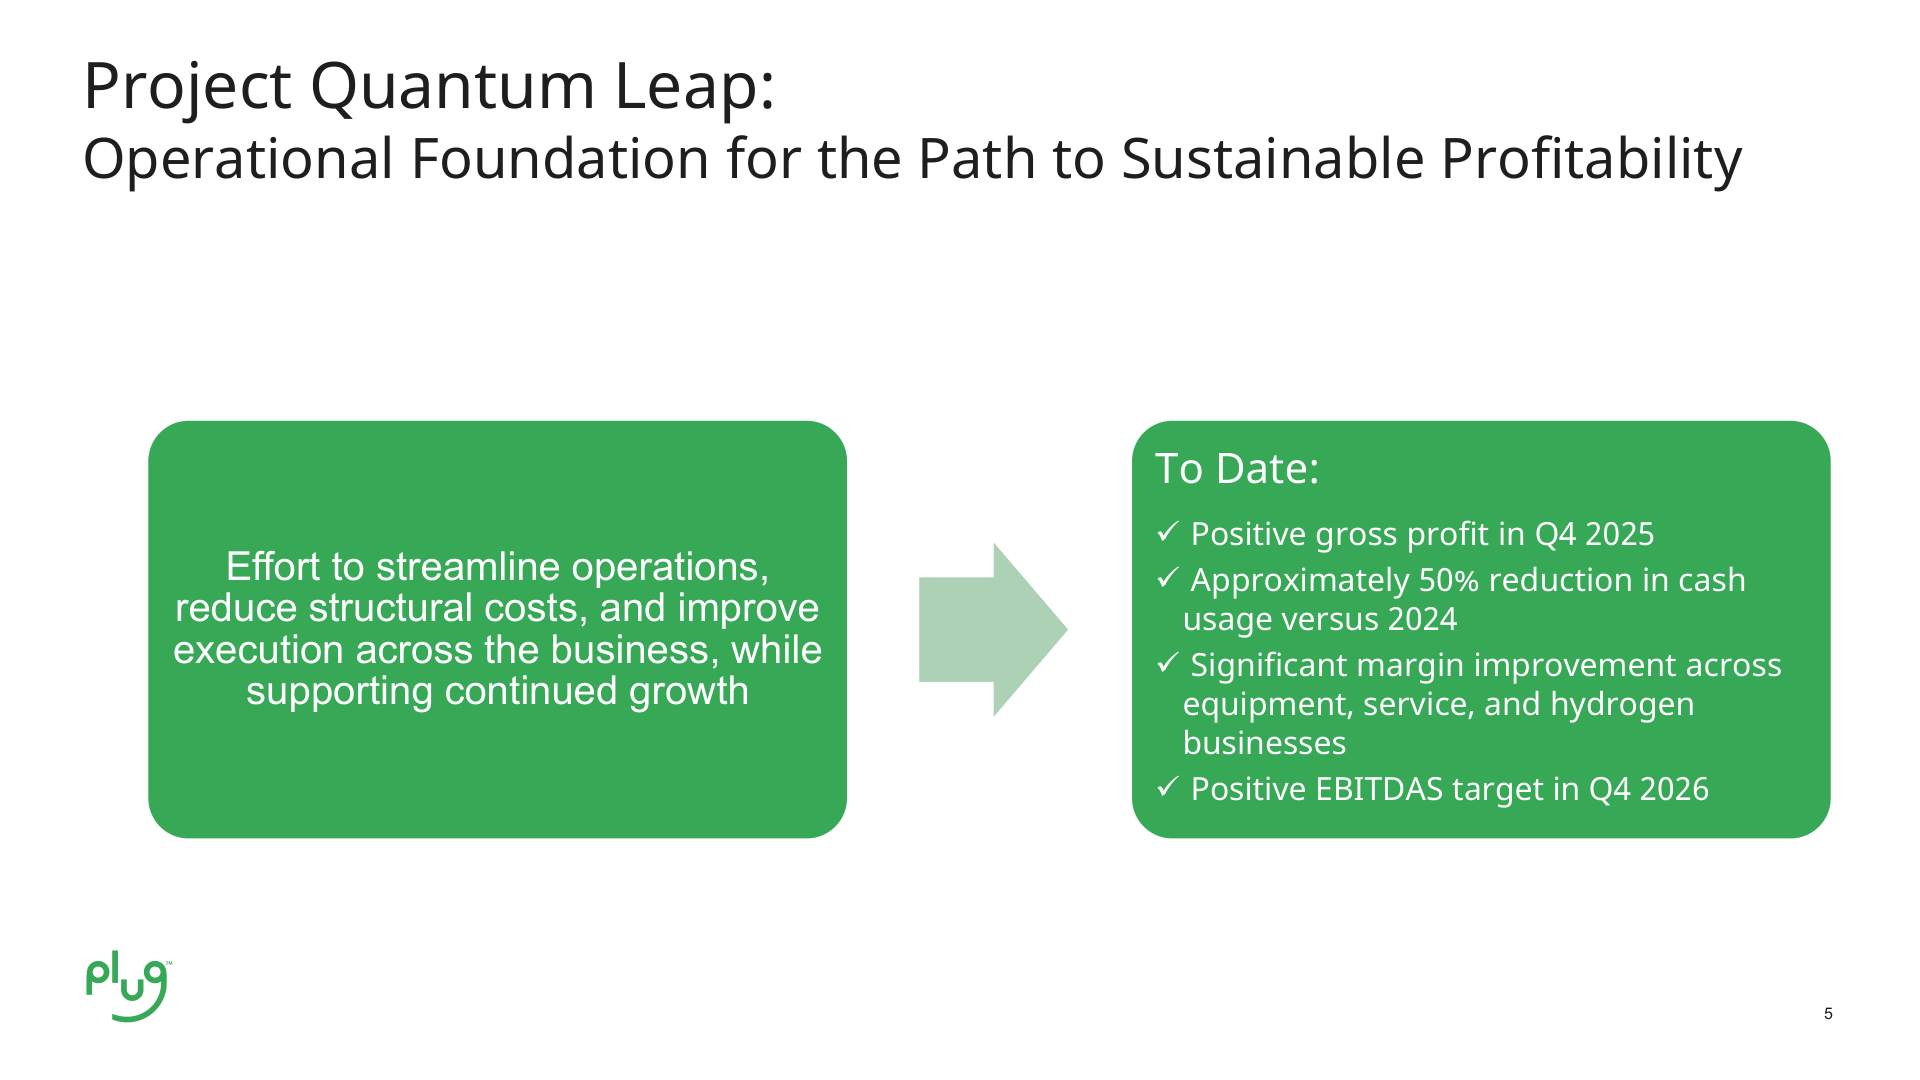
- Company disclosure (annual meeting presentation p5, June 2026): Under "To Date," the Quantum Leap slide lists four items: "Positive gross profit in Q4 2025," "Approximately 50% reduction in cash usage versus 2024," "Significant margin improvement across equipment, service, and hydrogen businesses," and "Positive EBITDAS target in Q4 2026."
- Start with the savings figure.
- Own calculation (Form 10-Q statements of operations, first half 2025 vs first half 2026): Operating expenses fell from $228.08 million to $150.32 million, a reduction of $77.76 million, or $156 million annualized. Q2 alone dropped from $123.48 million to $62.43 million, $61.05 million lower and $244 million annualized. Q2 2026 operating expenses include a $39.70 million recovery of previously impaired assets, so the underlying level is higher than the print. Management said on the call that stripping such items out leaves a run rate of roughly $75 million a quarter. Moving from the first-half 2025 average of $114.04 million to $75 million is $39.04 million per quarter, or $156 million a year.
- By that arithmetic the $150 million to $200 million target has just cleared its lower bound. A number the April deck set as a goal, the August results delivered. Part of the saving is depreciation that stopped growing because capital expenditure was cut to a ninth, and the rest is headcount and site consolidation. As the capex section notes, the bill for that first part has not arrived yet.
- "Approximately 50% reduction in cash usage versus 2024" is true or not depending on the base year. On the deck's own page 16 table, 2024 burn of $1,063 million fell to $661 million in 2025, a 38% decline. Getting to 50% requires comparing the first-half 2026 run rate of roughly $500 million against 2024, which produces 52%. The 50% in the June deck is a 2026 run rate set against 2024, not a 2025 result. It is not wrong, but under a heading that says "To Date" it skips a year.
- Page 9 deserves one line. "Global installed electrolyzer capacity is forecasted to reach approximately 300 GW by 2030," "Green hydrogen share: 1.6% of global hydrogen capacity, up from <0.1% in 2021," and "Its cost is now only 1.5-2x higher than fossil-based hydrogen." A 1.6% share and a cost still 1.5 to 2 times fossil hydrogen are the company's own numbers. Put the industry section's gas price, down 10.6% over seven years, next to industrial power, up 41.4%, and the same deck tells you which direction that 1.5 to 2 times multiple is moving. It is not narrowing.
- Reduced to one sentence, five slides say this: the savings target was met, the gross margin promise was kept, and the installed base is growing. Where the deck says self-sustainability, the cash flow statement says minus $536 million, and where the deck draws electricity prices as a tailwind, two of the three businesses feel it as a headwind. That gap is the backdrop for the income statement analysis that follows.
Plug Power Q2 2026 Earnings: Operating Loss vs Net Loss
- Above the operating line, the quarter was good. Revenue rose 2.5% to $178.30 million while cost of revenue fell 20.9% from $227.44 million to $179.97 million. Gross loss narrowed from $53.47 million to $1.68 million, which is a gross margin of minus 0.9% against minus 30.7% a year earlier. Operating expenses were cut roughly in half, from $123.48 million to $62.43 million.
- Below the operating line, the direction reversed.
| Line item | Q2 2026 | Note |
| Operating loss | -$64.11mn | -$176.95mn a year earlier |
| Interest income | +$2.59mn | |
| Interest expense | -$16.89mn | includes $7.38mn on convertible notes |
| Other expense, net | -$7.20mn | |
| Change in fair value of convertible notes | -$74.24mn | non-cash |
| Change in fair value of warrant liabilities | -$29.29mn | non-cash |
| Extinguishment loss and equity method loss | -$0.77mn | |
| Loss before income taxes | -$189.90mn |
- The below-the-line items took $125.79 million, and $103.53 million of that sits in the two fair-value rows. Those two rows are 54.5% of the pre-tax loss and 1.61 times the operating loss. The company spent a year taking cost out of the operating line, and two accounting entries erased more than it saved.
- Filing footnote (Q2 2026 Form 10-Q, condensed consolidated statements of operations): The line labeled "Change in fair value of debt" shows $3,408 thousand twice in the published table. Those two figures belong to the Q2 2025 and first-half 2025 columns, not to 2026. The R-file rendering drops empty cells, so the numbers slide left visually. I confirmed the assignment by summing each column against the reported pre-tax loss. Reading it as a 2026 item would push the fair-value total to $106.99 million and break the reconciliation.
What Did Plug Power Disclose in Note 7?
- The mechanism is spelled out in the quarterly report. Note 7 carries the Black-Scholes inputs Plug used to value its warrant liability, and the company published both measurement dates side by side.
| Input | Dec 31, 2025 | Jun 30, 2026 |
| Underlying stock price | $1.97 | $2.71 |
| Exercise price | $7.75 | $7.75 |
| Volatility | 80.00% | 104.00% |
| Expected average term | 2.22 years | 1.72 years |
| Fair value per share | $0.28 | $0.73 |
| Warrant liability | $52.32mn | $136.25mn |
- The exercise price is $7.75 against a $2.71 stock. Nobody was going to exercise those warrants at either measurement date. The liability on the balance sheet still went from $52.32 million to $136.25 million in six months, because the stock moved 74 cents and the volatility assumption moved 24 points.
- Own calculation (Q2 2026 Form 10-Q, Note 7): Multiplying the disclosed fair value per share of $0.73 by the 185,430,464 warrants outstanding gives $135.36 million against a carrying value of $136.25 million, a difference of 0.7%. The disclosed inputs reproduce the balance.
- Note 7 also explains the classification. The $7.75 warrants carry a change-of-control cash election, meaning the holder can require Plug to buy the warrant for its Black-Scholes value in cash if control changes hands. Under ASC 815 that conditional obligation blocks equity classification, so the warrants sit in liabilities and get remeasured every quarter.
- Their origin matters too. Plug sold common warrants in a March 2025 registered direct offering, then induced the holder to exercise them in October 2025. The inducement was a fresh tranche: 185,430,464 new warrants struck at $7.75. Plug pulled cash forward and issued the next invoice to do it.
How Much Does a $1 Move in PLUG Stock Add to the Books?
- The convertible notes are the bigger of the two. Plug issued $431.3 million of 6.75% convertible senior notes on November 21, 2025, due December 1, 2033, and elected fair value accounting for them.
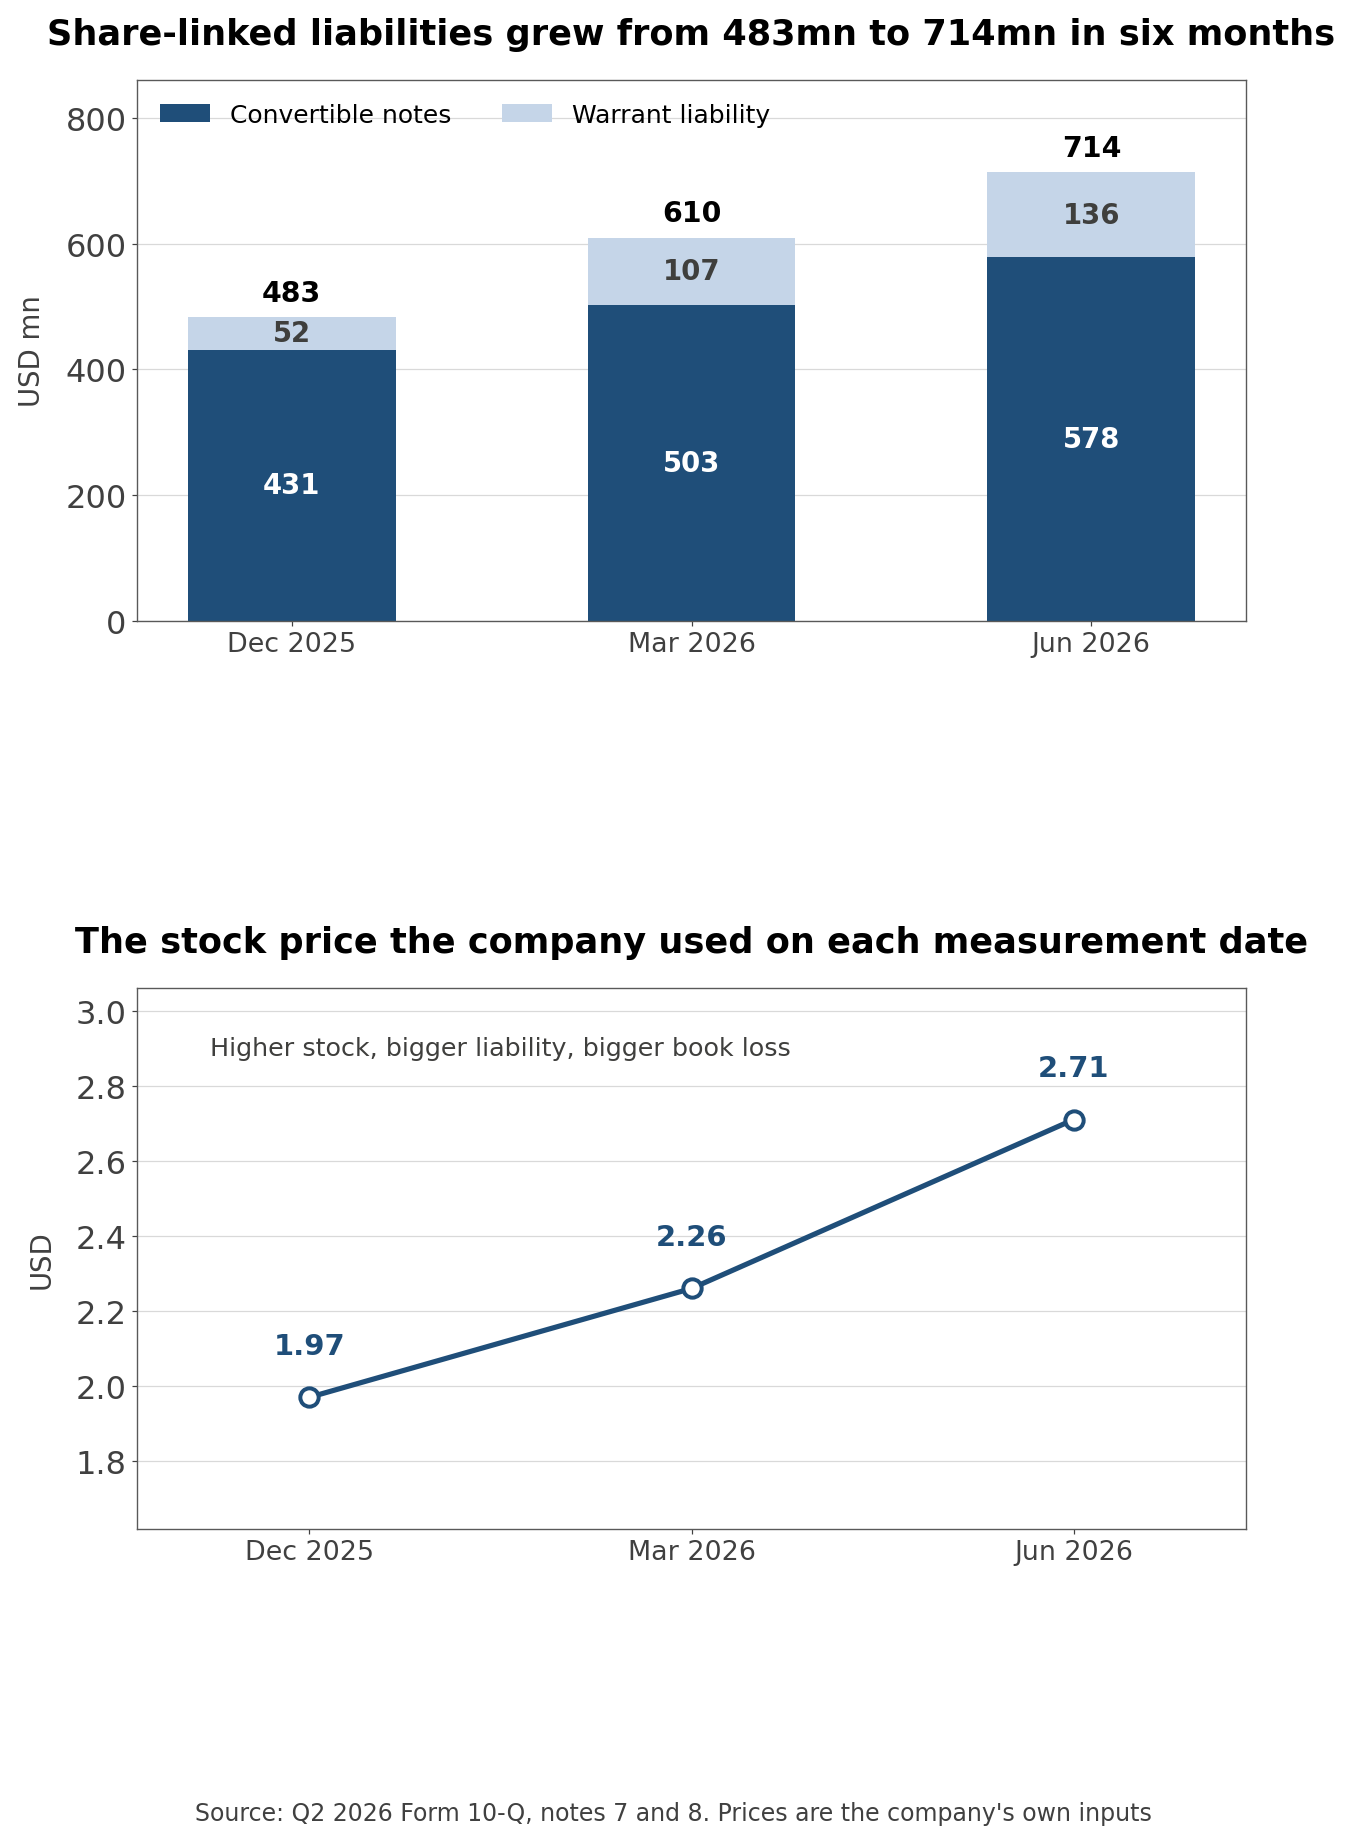
| Date | Convertible notes | Warrant liability | Total | Stock price used |
| Dec 31, 2025 | $431.01mn | $52.32mn | $483.34mn | $1.97 |
| Mar 31, 2026 | $502.77mn | $106.96mn | $609.73mn | $2.26 |
| Jun 30, 2026 | $578.00mn | $136.25mn | $714.25mn | $2.71 |
- Share-linked liabilities grew $230.91 million in six months. Strip out $1.97 million of discount amortization and $228.95 million of that ran through the income statement as a fair-value loss.
- Own calculation (Form 10-Q Notes 7 and 8, shares outstanding as of June 30, 2026): Over the same six months the stock rose 74 cents, from $1.97 to $2.71. Against 1,397,924,047 shares outstanding, that is $1,034.46 million of market value created for shareholders. The accounts recorded $228.95 million of losses over the identical period. Shareholders gained a billion dollars while the company booked $229 million of losses, so 22.1% of the gain came back as an accounting charge. Per dollar of share price, the drag is $309.39 million.
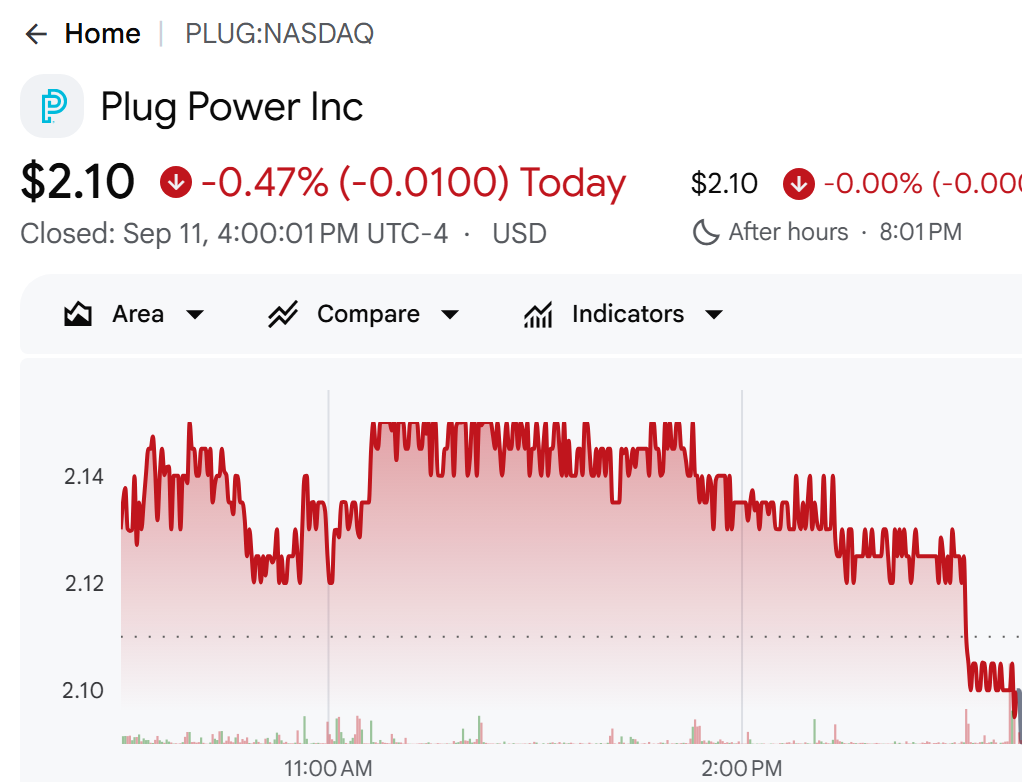
- The symmetry is the point. The stock has since fallen to $2.10, down 22.5% from the $2.71 that set the June valuation. If the quarter ends anywhere near there, the same two rows swing to gains. The size depends on the September 30 close, which is not knowable yet, but the sign is not in doubt.
- That creates a reading problem for the next print. If Q3 net loss shrinks sharply, the honest first question is whether the business improved or the stock fell. In this company those two things move in opposite directions.
- Plug says as much in its own risk language. The earnings release lists among its risk factors "fluctuations in the Company's operating results due to non-cash changes in the fair value of its convertible debt instruments and warrant liabilities."
Why PLUG Adjusted EPS of $0.07 Needs a Second Look
- Plug published GAAP EPS of -$0.14 alongside adjusted EPS of -$0.07. The reconciliation table is the first image in this article.
- Filing footnote (Q2 2026 earnings release, non-GAAP reconciliation): Starting from a GAAP net loss of $188.21 million, Plug adds back impairment of $19.37 million, restructuring and supplier contract modification of $0.18 million, transaction fees related to an investment tax credit of $3.14 million, and a $0.20 million change in contingent consideration fair value. It then subtracts $39.70 million for recovery of previously impaired assets and adds $103.62 million for extinguishment losses and changes in the fair value of convertible debt, finance obligations and warrant liabilities. Adjusted net loss is $101.41 million.
- Net adjustments total $86.80 million, and the fair-value row alone is $103.62 million. Because the other items partly cancel, the halving of EPS is almost entirely the fair-value reversal.
- Is the adjustment wrong? No. No cash moved and none of it reflects operations. Plug is also consistent about it: the same table adds back $19.37 million of impairment and then subtracts $39.70 million of impairment recovery, which makes the adjusted loss bigger, not smaller. A company picking only its favorable adjustments would not do that.
- The limit is what the reversal does not remove. The $136.25 million warrant liability and the $578.00 million of convertible notes are still on the balance sheet, and the notes pay cash interest until 2033. Of the $16.89 million of interest expense in the quarter, $7.38 million went to those notes. Non-cash means no cash left this year. It does not mean no cash leaves later.
Plug Power Revenue Breakdown by Product Line
- A 2.5% headline growth rate hides almost everything that happened inside it.
| Product or service | Q2 2025 | Q2 2026 | Change |
| Fuel cell systems | $15.56mn | $31.93mn | +105.2% |
| Services | $16.37mn | $29.84mn | +82.3% |
| Fuel delivered to customers | $34.40mn | $39.47mn | +14.7% |
| Power purchase agreements | $23.63mn | $26.93mn | +14.0% |
| Cryogenic equipment and liquefiers | $26.84mn | $26.70mn | -0.5% |
| Electrolyzers | $44.87mn | $13.22mn | -70.5% |
| Hydrogen infrastructure | $11.60mn | $8.22mn | -29.1% |
| Other | $0.70mn | $1.99mn | +184.6% |
- Fuel cell systems doubled while electrolyzers fell to a third. Plug deployed 1,666 GenDrive units in the quarter against 739 a year earlier, and an installed base that large pulls service and fuel revenue behind it. That is why services grew 82.3% from the same root.
- Electrolyzers need a longer look. Down 70.5% for the quarter, they are flat for the half: $54.10 million against $54.08 million. The 2025 revenue landed in Q2 and the 2026 revenue landed in Q1. Electrolyzer projects are sold as contracts and recognized on a percentage-of-completion basis, so quarterly figures swing hard. Reading the quarterly decline as a collapse would be wrong.
- Reading it as smooth sailing would also be wrong. The electrolyzer news in the quarter was a 30 MW final investment decision in the UK, a 275 MW FEED award in Quebec, and a 50 MW order in Australia. All of those are future revenue. What landed in this quarter's income statement was $13.22 million.
From Minus 132% Gross Margin to Almost Breakeven
- How far the operating business has come shows up best as a series.
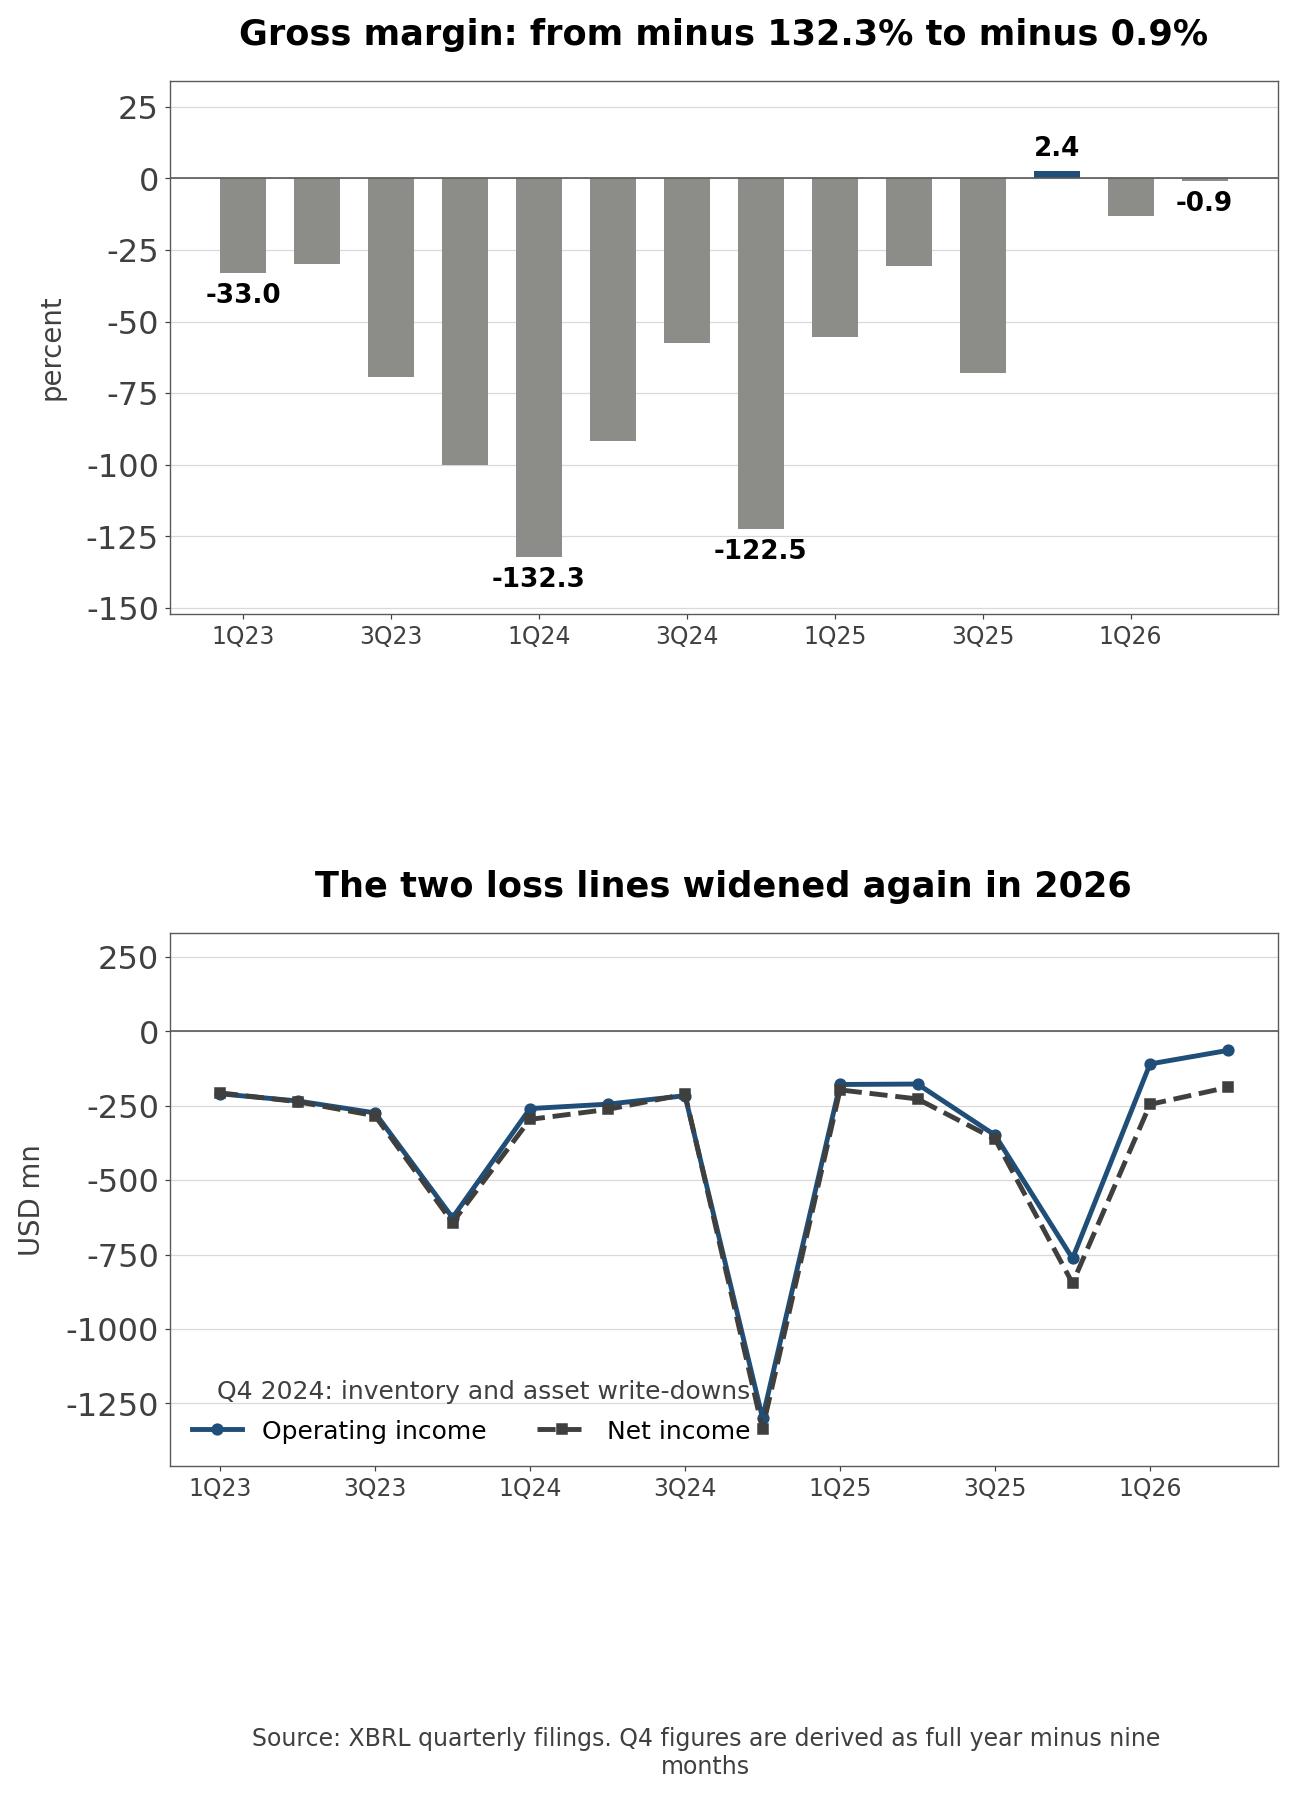
- In Q1 2024 gross margin was minus 132.3%. Plug sold $120.26 million and spent $279.34 million making it. Every sale deepened the hole. From there the series runs minus 91.6%, minus 57.6%, and on to a first positive print of +2.4% in Q4 2025 before settling at minus 0.9% in Q2 2026.
- None of that came from fair-value accounting. It came from actual cost. Plug lifted fuel gross margin from minus 91% to minus 48.8% by raising utilization and production efficiency across the Georgia, Tennessee and Louisiana plants, and the service business is already at 27% positive.
- Company disclosure (quarterly earnings releases, Aug 2025 and Mar 2026): In its August 2025 materials Plug wrote that it "expects to achieve gross margin breakeven on a run-rate basis in Q4 2025." In the March 2026 annual materials it listed "Achieved positive gross margin for Q4 2025" as a goal met. The Q4 2025 print was positive, so that promise held.
- Other promises did not. I parsed all 50 earnings-related 8-K filings Plug has made since 2019 and pulled every sentence containing a profitability target. In March 2024 the company said, "We've modeled this so that the company can become operational and cash flow positive in '25." Operating cash flow in 2025 was negative.
- Laid out chronologically the promises change character. The 2023 and 2024 versions point a direction: "path to profitability," "clear path to margin expansion." From August 2025 onward they carry quarters and metrics: gross margin breakeven in Q4 2025, positive EBITDAS in Q4 2026, positive operating income by the end of 2027, full profitability by the end of 2028. Since Plug started naming dates, it has not missed one. The sample is short, which is worth saying out loud.
Capex Fell 89%: What Plug Bought and What It Gave Up
- Cash moved the same direction as margin.
- First-half operating cash flow was an outflow of $244.11 million against $297.38 million a year earlier. Net cash usage for the quarter was $61 million, down 58% sequentially by the company's own measure, and unrestricted cash finished at $161.89 million.
- The investing line moved further. First-half purchases of property, plant and equipment fell from $79.07 million to $8.71 million, a cut of 89.0%. That single decision did more for the burn rate than anything else.
- It also cuts against the strategy. Plug's pitch is vertical integration, and it describes roughly 40 tons per day of combined capacity across three plants. Utilization is one of the stated reasons fuel margin is still minus 48.8%, and utilization improves by building more network, not less. Preserving cash is defensible at this stage. It was not free.
- The cash figure deserves one more line. Next to the $161.89 million of unrestricted cash sits $509.63 million of restricted cash. Total cash is $671.53 million and 75.9% of it is tied up.
- Company disclosure (Q2 2026 earnings call, August 10, 2026): Management described more than $115 million of restricted cash released in the first half and roughly $155 million scheduled to release over the following twelve months, calling the stream a form of non-dilutive funding. Plug also targets more than $275 million from data center asset monetization and said $47 million arrived in July and August.
- Calling released collateral a funding source is not wrong. It does produce cash without issuing shares. It is worth remembering what the collateral was posted against in the first place.
Industrial Electric Power Prices Rose 14.4% in Three Months
- There are two ways to make hydrogen. Reform natural gas, or split water with electricity. The first tracks the gas price and the second tracks the power price. Plug's electrolyzers and its own hydrogen plants sit on the electricity side.
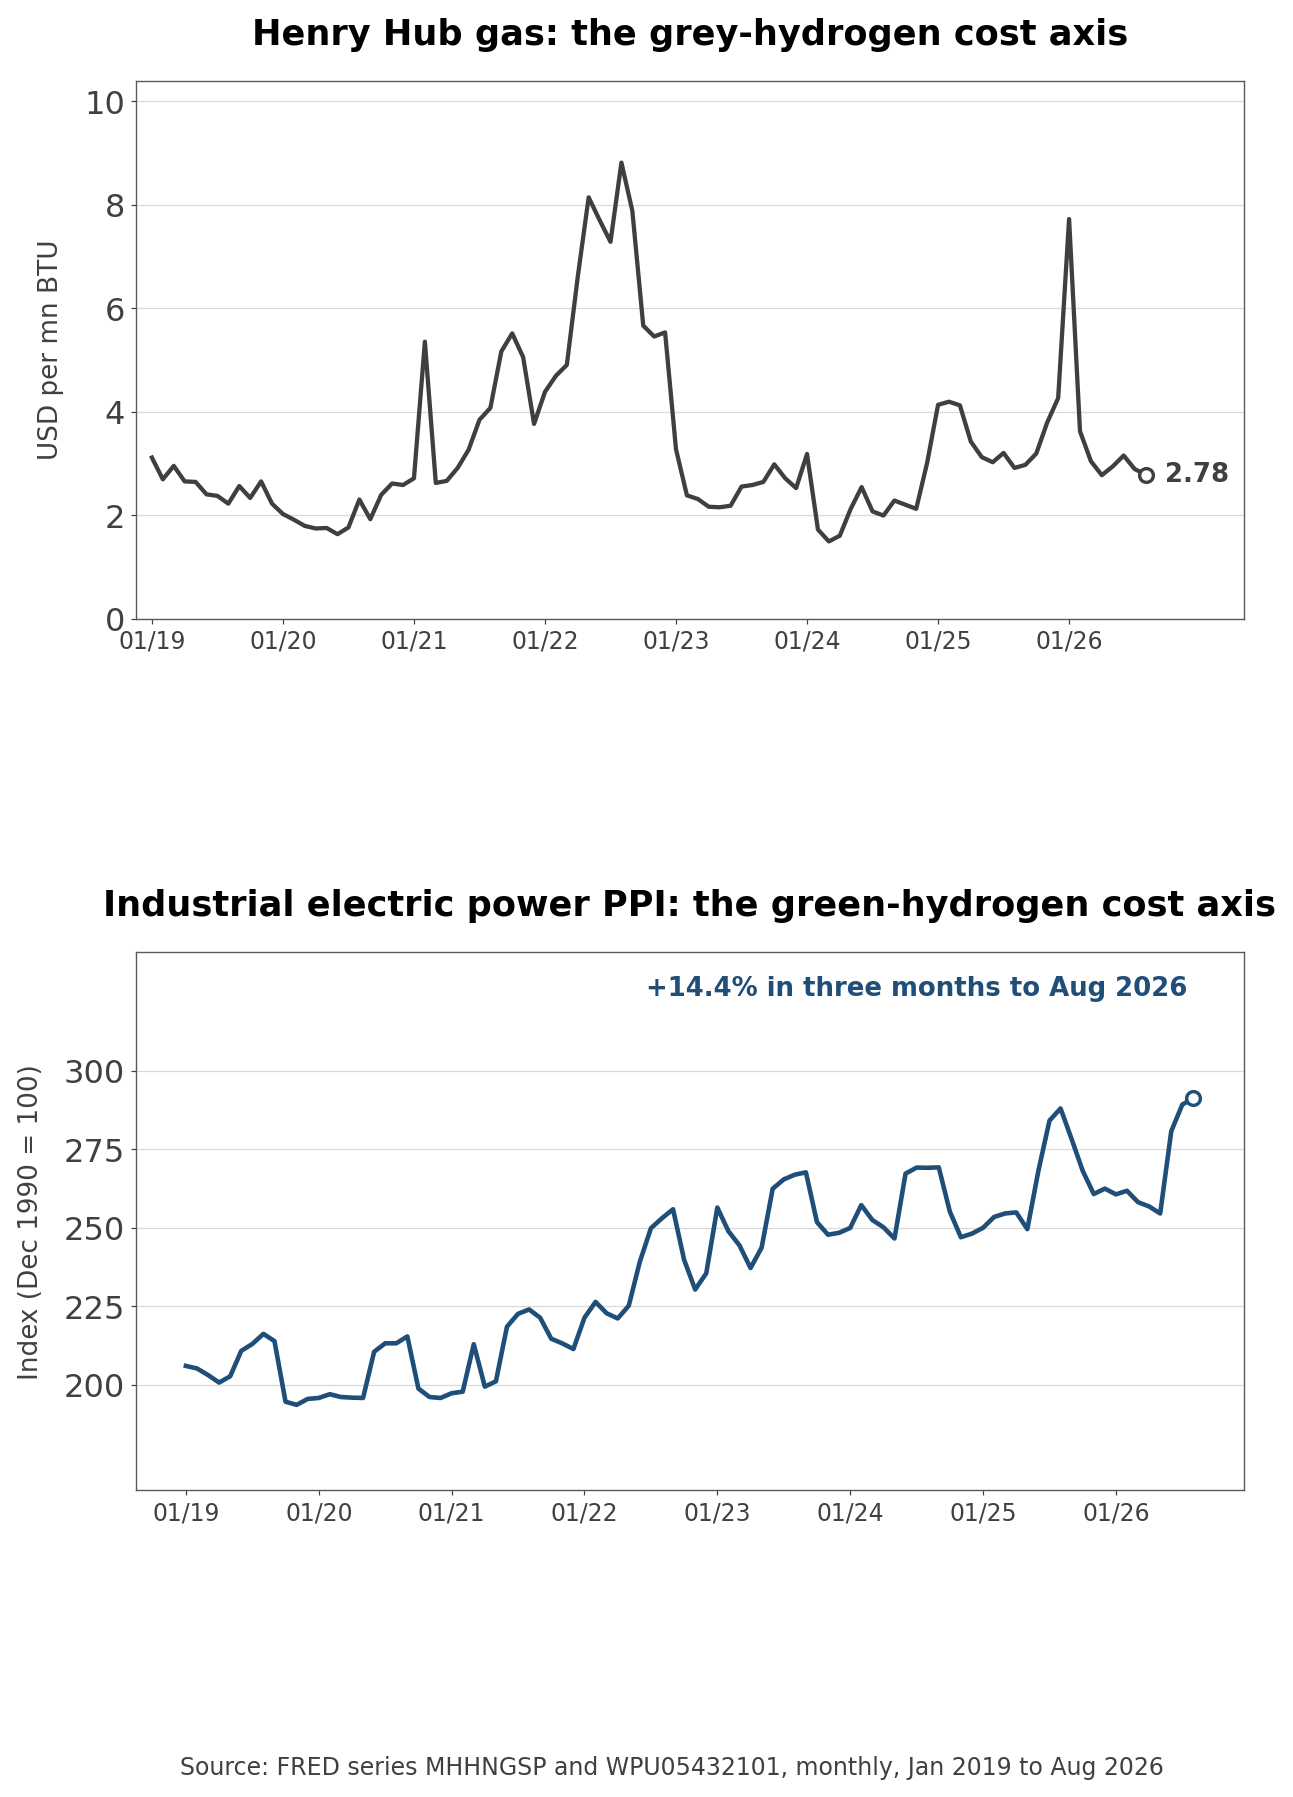
- Official statistics (FRED MHHNGSP and WPU05432101, August 2026): Henry Hub natural gas spot was $2.78 per million BTU in August 2026 against $3.11 in January 2019. The industrial electric power producer price index went from 206.0 to 291.2 over the same span.
- Across seven years the feedstock for grey hydrogen got 10.6% cheaper and the feedstock for green hydrogen got 41.4% dearer. Green hydrogen catches grey hydrogen when power gets cheap. In the United States it went the other way.
- The last three months were steeper still. The industrial power index went from 254.5 in May 2026 to 291.2 in August, a move of 14.4%. More than a third of the seven-year rise landed in that window. Data center demand is pulling wholesale power up, and that bill arrives at anyone making hydrogen from electricity.
Why Industrial Gas Prices Do Not Lift Plug's Fuel Margin
- If input costs rose, what about output prices?
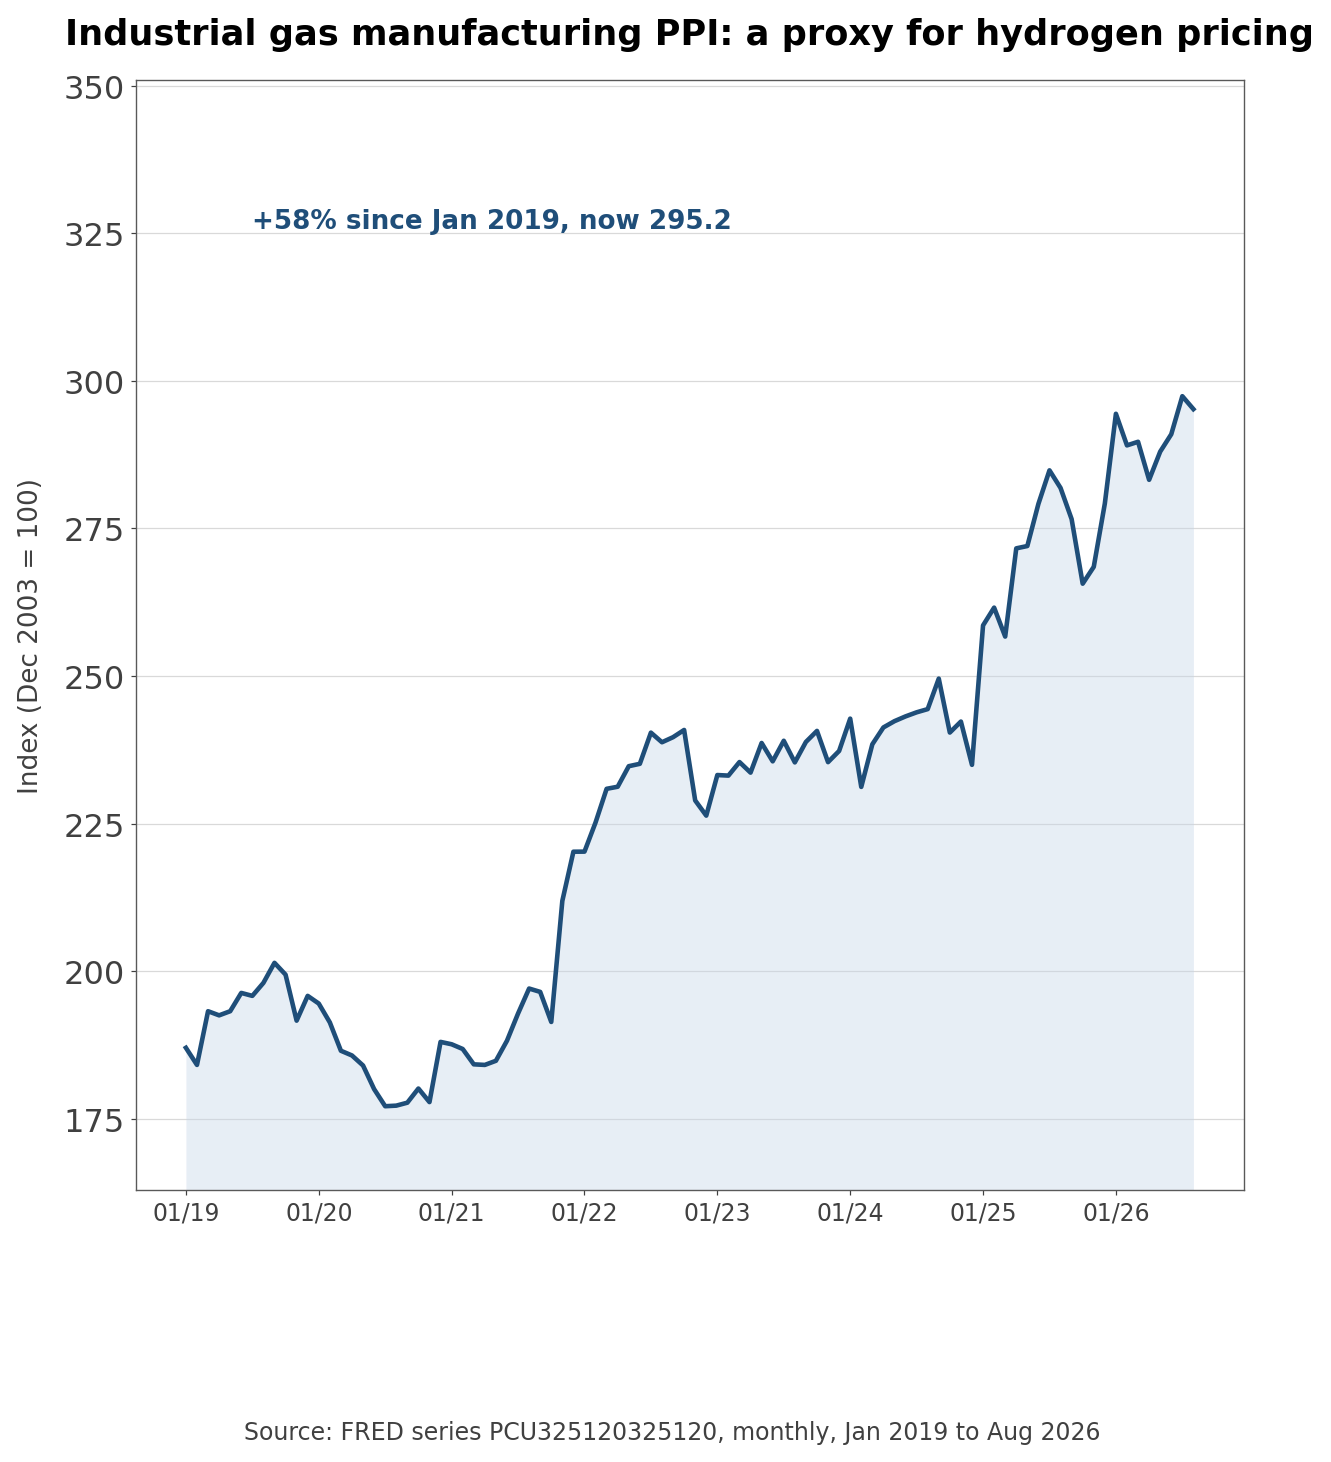
- Official statistics (FRED PCU325120325120, August 2026): The industrial gas manufacturing producer price index stood at 295.2 in August 2026 against 187.0 in January 2019. That is a faster climb than the industrial power index managed over the same period.
- Industrial gas prices are up 57.9% over seven years against 41.4% for industrial power. An industry whose selling price outruns its input cost sounds like good news. The index covers oxygen, nitrogen and argon as well as hydrogen, and the companies holding that market are Linde and Air Products. Linde posted a 47.7% gross margin in the latest quarter and Air Products 32.8%.
- Plug's fuel segment gross margin is minus 48.8%. That is a real improvement from minus 91% a year ago. It still means that after seven years of rising industry prices, this company sells hydrogen for less than it costs to make.
- Same index, different position. Scale differs, utilization differs, and distribution differs most of all. An improving industry price series does not carry Plug's margin with it.
Plug Power vs Bloom Energy: Same Basket, Opposite Sides
- The hydrogen and fuel cell names split apart in 2026.
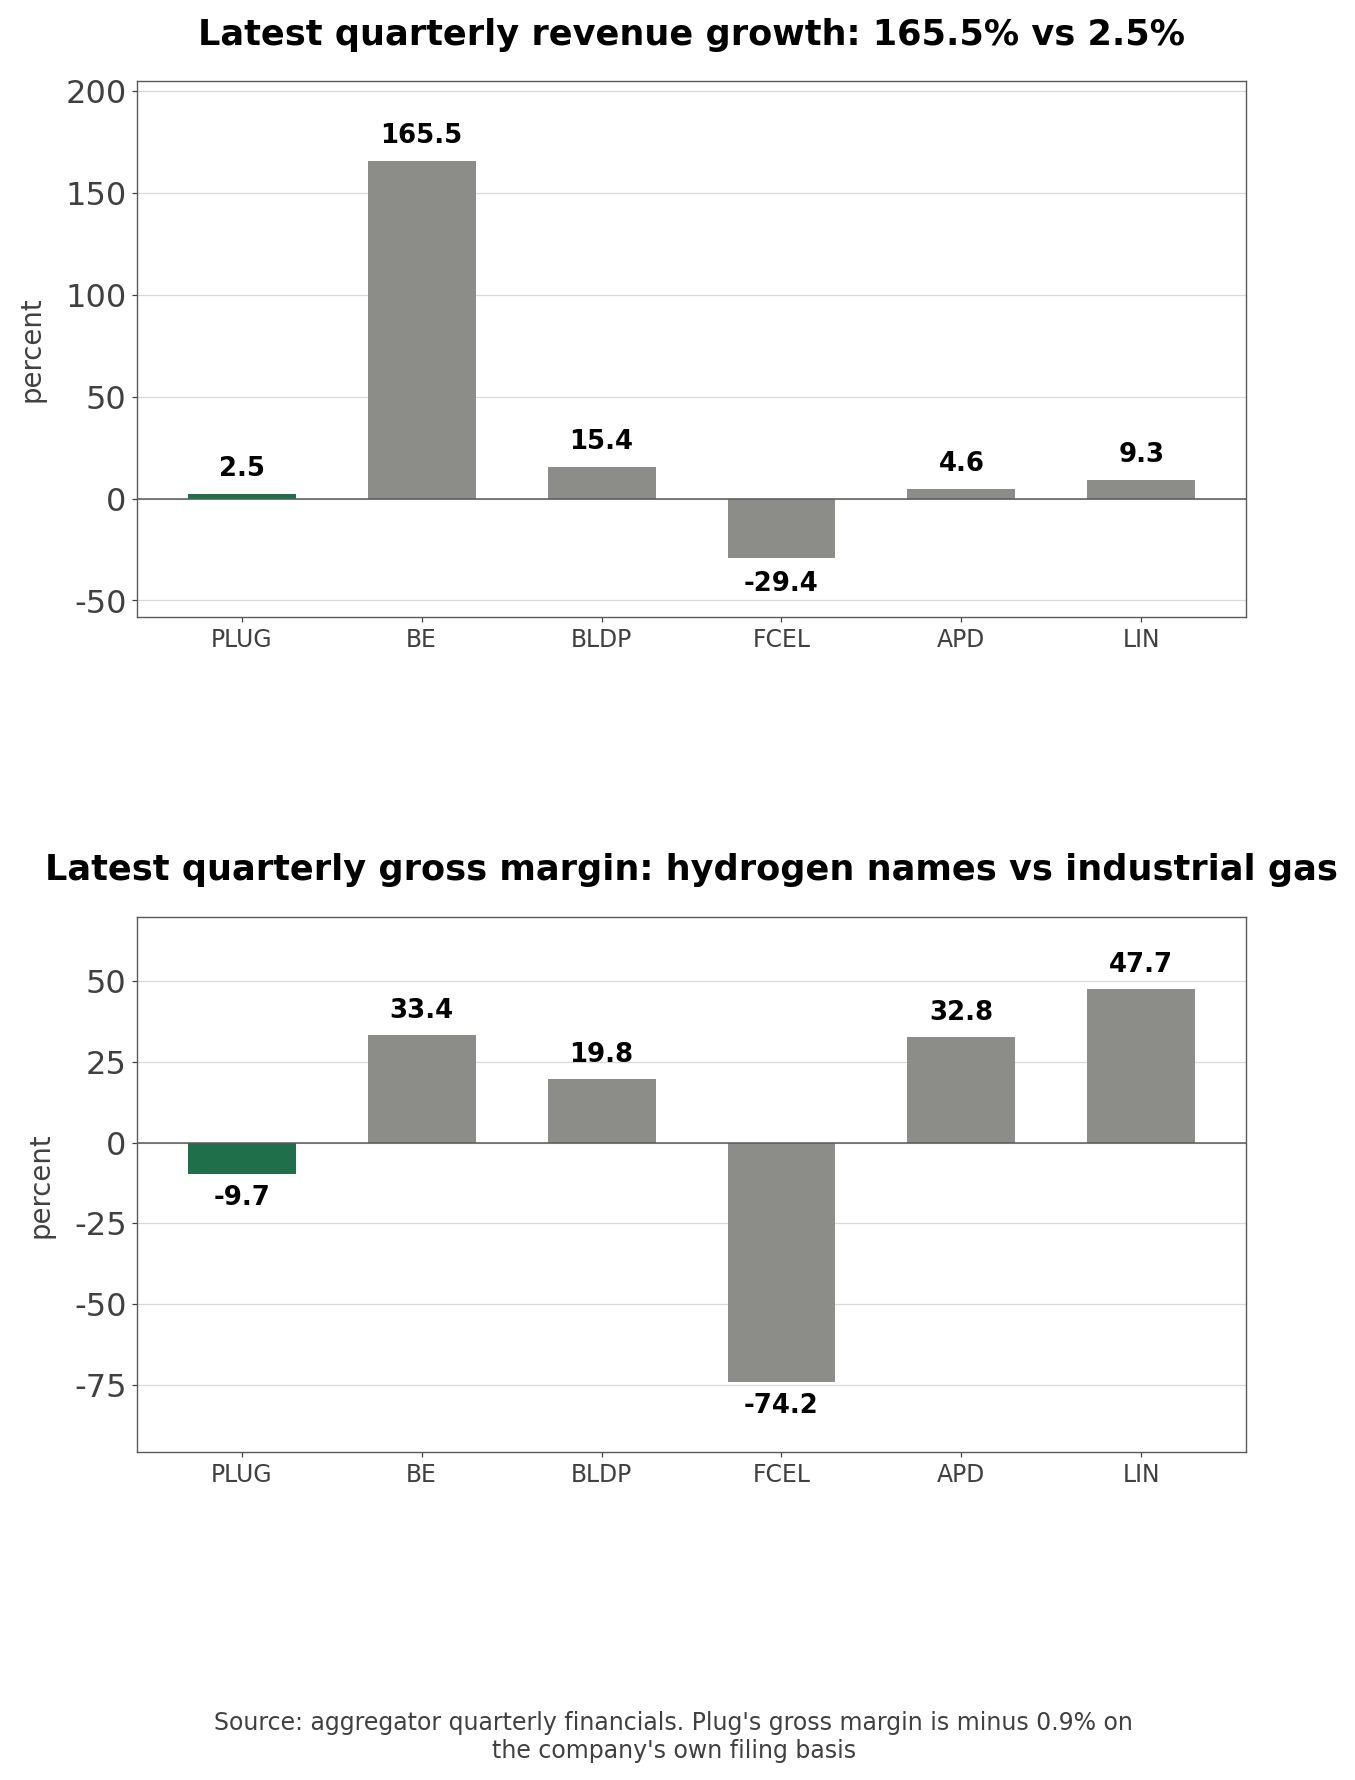
| Company | Ticker | Quarterly revenue | YoY | P/S | P/B | Market cap |
| Plug Power | PLUG | $178.30mn | +2.5% | 3.94x | 5.04x | $2.93bn |
| Bloom Energy | BE | $1,065.0mn | +165.5% | 26.09x | 50.18x | $81.22bn |
| Ballard Power | BLDP | $20.60mn | +15.4% | 6.29x | 1.19x | $0.67bn |
| FuelCell Energy | FCEL | $33.00mn | -29.4% | 8.24x | 1.30x | $1.27bn |
| Air Products | APD | $3,161.0mn | +4.6% | 5.15x | 4.67x | $64.90bn |
| Linde | LIN | $9,289.0mn | +9.4% | 6.06x | 5.50x | $214.92bn |
- Bloom Energy is the one that stands out. Revenue up 165.5% in a year, a 17.1% operating margin, and a market capitalization 27.7 times Plug's. Both companies sell fuel cells.
- The split comes from what the fuel cell is for. Bloom sells solid oxide fuel cells as on-site power generation for data centers. It makes electricity where electricity is short. The power price increase in the previous section is a demand signal for that business.
- Plug sits on the other side of the same trade. It puts hydrogen into forklifts and converts electricity into hydrogen with electrolyzers. When power gets more expensive, Plug's cost of goods gets more expensive. The same data center electricity demand shows up as revenue for one company and as cost for the other.
- That is the sharpest contrast in this quarter's numbers. Anyone treating "hydrogen" as a single theme is holding two opposite bets.
- Comparing loss-making companies in transition needs more than multiples. It needs distance traveled.
| Company | Gross margin | Year ago | Change | Growth-adjusted P/S | Equity | Market cap / equity |
| Plug Power | -0.9% | -30.7% | +29.8pp | 1.58 | $581.8mn | 5.04x |
| Ballard Power | 19.8% | not shown | not shown | 0.41 | $561.0mn | 1.19x |
| FuelCell Energy | -74.2% | not shown | not shown | not meaningful | $977.0mn | 1.30x |
| Bloom Energy | 33.4% | not shown | not shown | 0.16 | $1,619.0mn | 50.18x |
- Growth-adjusted P/S divides the price-to-sales multiple by the quarterly revenue growth rate; lower means cheaper for the growth delivered. FuelCell Energy does not produce a figure because revenue shrank. Plug's gross margin and the change are on a filing basis; on an aggregator basis the figure is minus 9.7%. Equity is implied by dividing market capitalization by the price-to-book multiple.
- Plug carries the highest growth-adjusted multiple of the three that produce one. It is being priced for the margin trajectory, not for the growth rate it just delivered.
PLUG and BLDP Have the Same Equity, 4.4x the Market Cap
- One more comparison from that table.
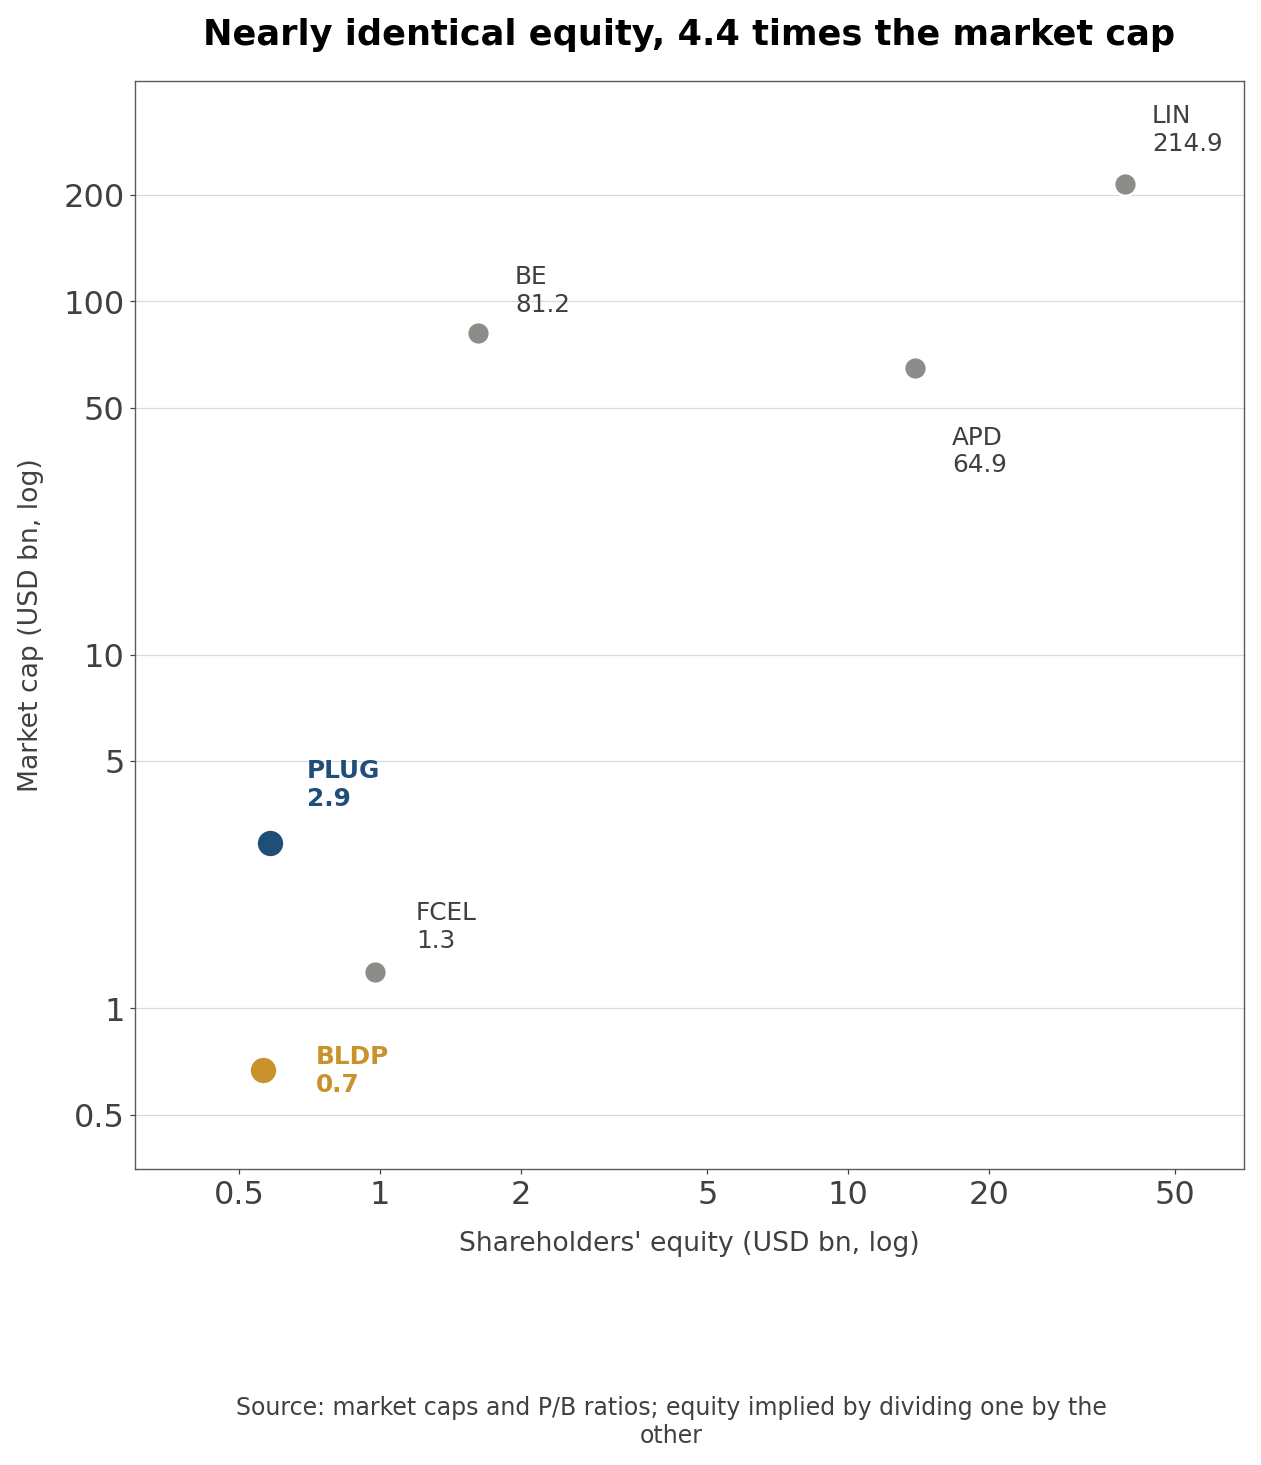
- Aggregator cross-check (sell-side research aggregators): Ballard Power's market capitalization is $667 million at a price-to-book of 1.19, which implies about $561 million of shareholders' equity. Plug's equity is $581.8 million, essentially the same number, and its market capitalization is $2.93 billion. That is 4.4 times for the same book value.
- FuelCell Energy makes the point again from the other side. Its equity of $977 million is larger than Plug's, and its market capitalization is $1.27 billion.
- The gap is not about assets. It is about what the market thinks those assets can become. Plug's revenue is 8.7 times Ballard's, and it has a gross margin series that traveled from minus 132% to minus 0.9%. Ballard already prints a positive 19.8% gross margin, but on $20.60 million of quarterly revenue, which leaves operating margin at minus 62%.
- Put plainly, PLUG stock carries a premium for the idea that a little more margin on this revenue base changes the arithmetic. The next section is where that premium becomes visible.
PLUG Valuation: P/B at the 93rd Percentile, P/S at the 46th
- Start with what cannot be drawn. There is no price-to-earnings band for this company. Trailing twelve-month net income has been negative for five straight years, so the denominator never exists. The count of valid observations over sixty months is zero.
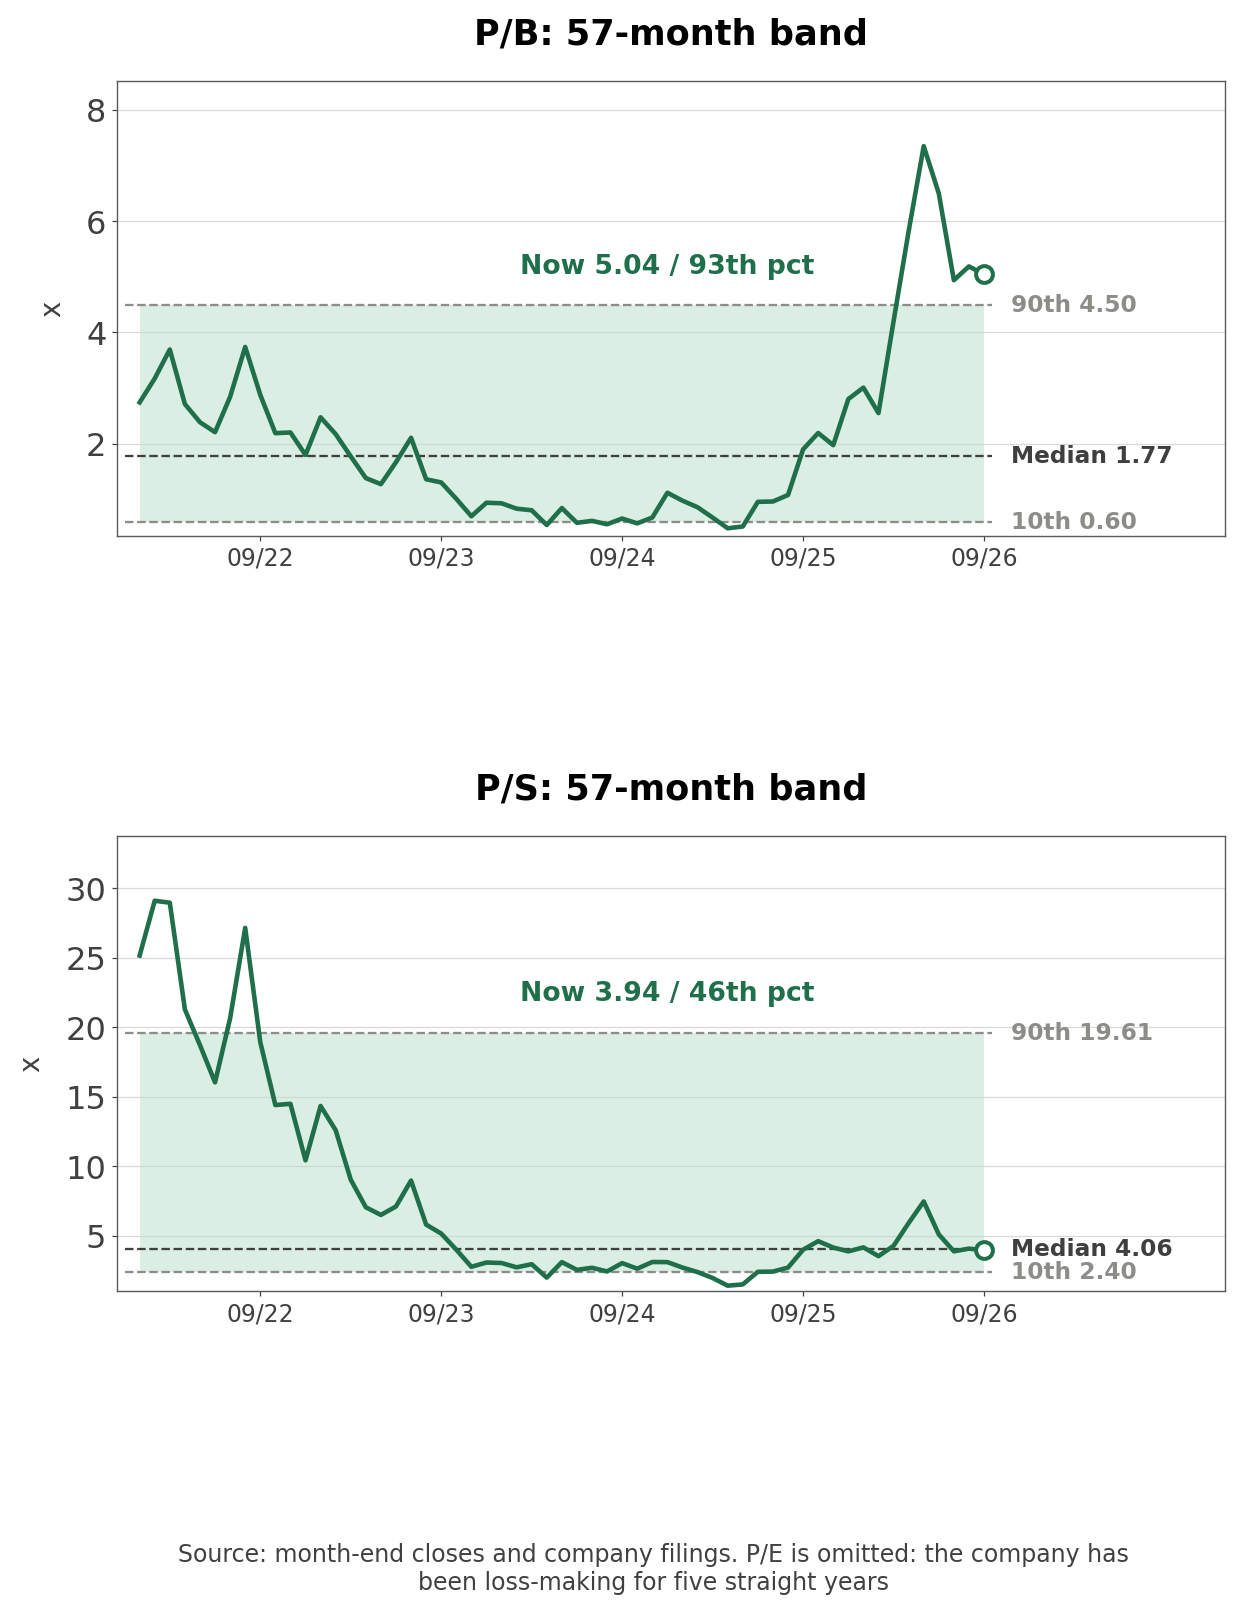
| Multiple | Current | 57-month median | 90th percentile | Position |
| Price to book | 5.04x | 1.77x | 4.50x | 93rd percentile |
| Price to sales | 3.94x | 4.06x | 19.61x | 46th percentile |
- Same market capitalization, same date, two answers. Measured against sales the stock sits at the middle of its own five-year history. Measured against book value it sits in the top 7%.
- Own calculation (57 month-end closes and XBRL quarterly financials, CIK 1093691): The denominators explain it. Trailing twelve-month revenue went from $891.34 million in 2023 to $744.09 million as of Q2 2026. Shareholders' equity went from $3,921.65 million in Q1 2023 to $581.75 million. Sales held roughly steady while book value melted, so only the multiple with the shrinking denominator moved.
- Revenue is down 16.5% over that span and equity is down 85.2%. The band starts in January 2022 for a reason. Plug's full-year 2020 revenue was negative $93.24 million, the result of charging customer warrants against revenue. That negative year distorts trailing twelve-month revenue through 2021 and pushes price-to-sales to between 701 and 733 times, which would destroy the percentiles. The window begins where the denominator is continuous and positive.
- A company that once reported negative annual revenue because it gave equity to customers tells you something about how it buys business. The warrants moving the income statement today belong to the same family of instrument.
Shareholders Put In $9.2 Billion; $582 Million Remains
- Where the equity went is one line on the balance sheet.
- Additional paid-in capital is $9,227.98 million. That is what shareholders have contributed. Below it, accumulated deficit is $8,659.55 million. Of everything put in, 93.8% has been consumed, leaving $581.75 million of equity against $2,192.57 million of total assets, or 26.5%.
- Share count tells the same story. Weighted average shares went from 589.2 million in Q1 2023 to 1,391.2 million in Q2 2026, a multiple of 2.36 in three years and three months. There is more that has not become stock yet.
- Filing footnote (Form 10-Q, earnings per share note, June 30, 2026): Potentially dilutive securities, consisting of stock options, restricted stock units, warrants and other equity instruments on an as-converted basis, total 440,501,973 shares. The figure a year earlier was 340,788,077. The current number equals 31.5% of the 1,397,924,047 shares outstanding. Because Plug is in a net loss position all of them are antidilutive and excluded from diluted EPS, which is not the same as absent.
- Authorized shares also went from 1.5 billion to 3.0 billion during the first half of 2026. That is not an announcement of issuance. It is room for it.
- Plug is clearly aware of the sensitivity. Describing asset sales and restricted cash releases as non-dilutive funding, repeatedly, is a signal aimed at exactly this concern.
PLUG Price Targets and Analyst Revisions
- Two research aggregators disagree about this stock more than they usually do.
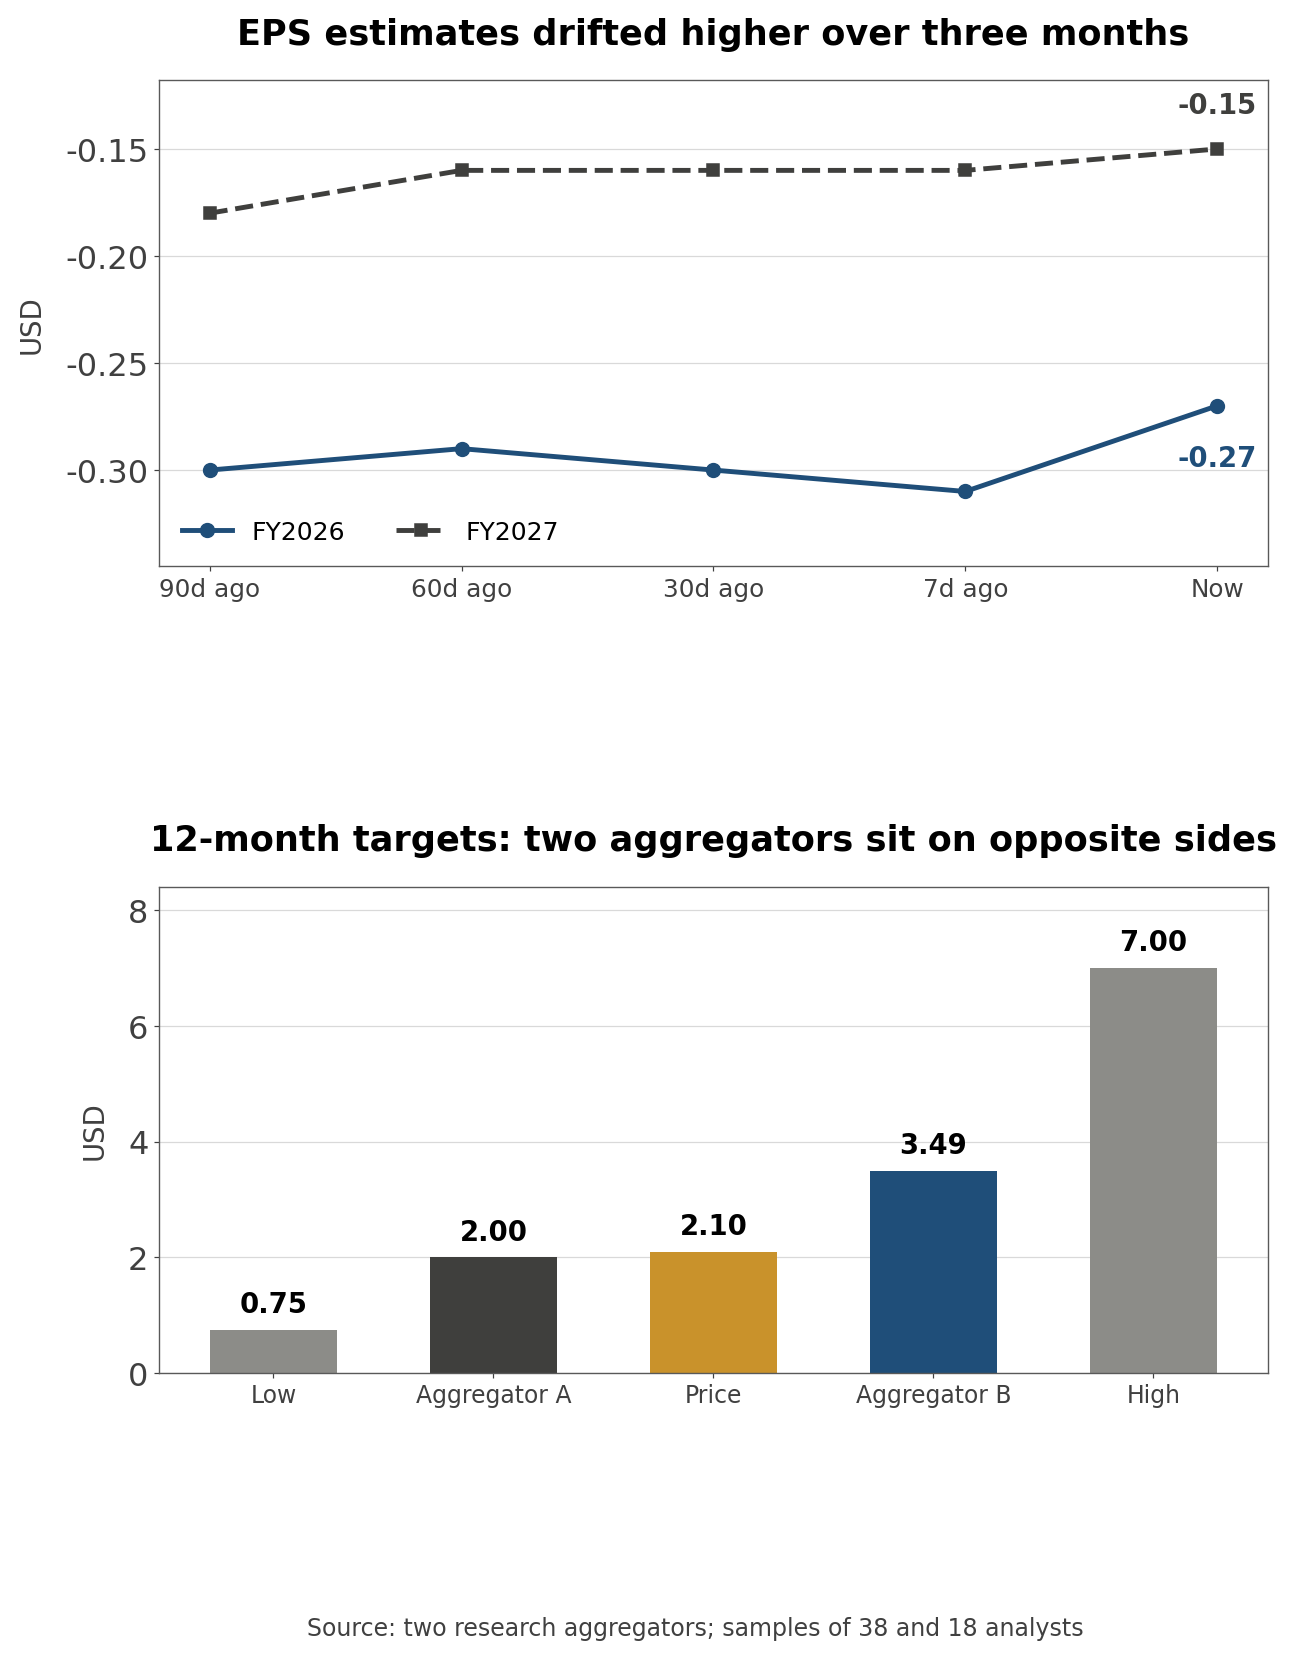
| Item | Aggregator A | Aggregator B |
| Analysts covering | 38 | 18 |
| 12-month target | $2.00 | $3.49 average |
| Versus current price | -11.9% | +66.6% |
| Distribution | 17 buy, 16 hold, 5 sell | high $7.00, low $0.75 |
- Aggregator cross-check (aggregated sell-side research, two aggregators): One aggregator puts the median target below the current price and the other puts the average 66.6% above it. Sample sizes of 38 and 18 and different methodologies produce the spread. Neither is treated here as the answer.
- Rating activity over the past ninety days was thin.
| Date | Firm | Rating | Target |
| 2026-08-12 | Roth Capital | Buy, maintained | unchanged |
| 2026-08-11 | UBS | Buy, maintained | $3.00 to $5.00 |
| 2026-08-11 | Oppenheimer | Perform, maintained | unchanged |
| 2026-07-09 | Morgan Stanley | Underweight, maintained | $2.00 maintained |
- No upgrades, two target changes. UBS raised a target without changing its rating, and Morgan Stanley kept an underweight with a target below the current price.
- Earnings estimates have drifted the right way. The 2026 consensus moved from minus $0.30 ninety days ago to minus $0.27, and 2027 from minus $0.18 to minus $0.15. Three to four analysts revised upward over the last thirty days against one downward.
- Aggregator cross-check (last eight quarterly reports): Plug has beaten the EPS consensus in zero of the last eight quarters. The average surprise is minus 185.2%.
- Eight consecutive misses says the number is hard to forecast, and a good share of that difficulty comes from the fair-value items above. An analyst can model the operating business correctly and still be wrong by a wide margin depending on where the stock closes on the last day of the quarter.
What Gross Margin Does Q4 EBITDAS Breakeven Require?
- Plug has now said three quarters running that it will reach positive EBITDAS in Q4 2026. That claim can be turned into a number.
- The definition first. Plug defines EBITDAS as earnings before interest, income tax, depreciation, amortization and share-based expense, which is EBITDA plus stock compensation. The company states in its own materials that the target "cannot be reconciled to the most directly comparable GAAP measure, net income (loss), without unreasonable effort." Hitting it would not end the net loss.
- Own calculation (first-half 2026 cash flow statement and management commentary on the earnings call): First-half depreciation of $12.87 million and intangible amortization of $1.82 million work out to $7.35 million per quarter, and share-based compensation of $26.89 million works out to $13.44 million. Quarterly add-backs are therefore $20.79 million. Applied to the Q2 2026 operating loss of $64.11 million, EBITDAS was roughly minus $43.32 million.
- Management described operating expenses running toward roughly $75 million per quarter. Holding that, the gross profit required to bring EBITDAS to zero is $54.21 million.
| Q4 revenue assumption | Gross profit needed | Gross margin needed |
| $230mn | $54.21mn | 23.6% |
| $250mn | $54.21mn | 21.7% |
| $270mn | $54.21mn | 20.1% |
- Q2 2026 came in at minus 0.9%, and the best quarter on record was +2.4% in Q4 2025.
- Guidance frames the revenue side. Plug raised full-year growth to a range of 15% to 16%, citing "the historically second-half-weighted cadence of our business and the strength of our commercial backlog." Applied to 2025 revenue of $709.92 million that is $816 million to $823 million for the year. Subtract first-half revenue of $341.81 million and the second half needs $474 million to $481 million. With Q4 as the seasonal peak, Q4 revenue lands somewhere around $250 million to $270 million.
- So Q4 EBITDAS breakeven requires revenue and margin to arrive together. Neither one alone gets there. Two things are worth holding at once: the target has stayed in the same place for three quarters, and the last dated promise this company made was kept.
What Would Change the Call
| Scenario | Condition | Indicator to check | When · Source |
| Upside | Gross margin turns positive in double digits | Quarterly gross margin, fuel segment margin against minus 48.8% | Q3 2026 results, expected early November |
| Upside | The $275mn asset monetization converts to cash | Unrestricted cash, restricted cash released, quarterly net cash usage | Q3 2026 results |
| Upside | Electrolyzer awards move into revenue recognition | Form 10-Q Note 11 electrolyzer line, contract liabilities | Q3 2026 Form 10-Q |
| Downside | The stock rallies and fair-value losses expand again | Quarter-end close, warrant and convertible note carrying values | Each quarter end |
| Downside | Capex restraint stalls plant utilization gains | Purchases of property, plant and equipment, fuel segment margin | Q3 2026 results |
| Downside | Non-dilutive funding stalls and equity issuance resumes | Shares outstanding, use of the 3bn authorized pool, capital raise filings | Ongoing, via 8-K |
- The third downside item carries the most weight. Unrestricted cash of $161.89 million against quarterly net cash usage of $61 million is about 2.7 quarters on simple arithmetic. Restricted cash releases and asset sales extend that, and if either slips the remaining path runs through the newly authorized share pool.
Related Analysis
- Linde (LIN) Stock: Price, Volume and Margin
- Shopify (SHOP) Stock: Net Income and Equity Gains
- CrowdStrike (CRWD) Stock: GAAP vs Non-GAAP
Methodology and Sources
- A $2.10 share price is used throughout. Returns were recalculated from daily closes rather than taken from aggregator displays: -8.30% over one month, -25.80% over three months and -4.98% over six months.
- Financial figures come from the Q2 2026 Form 10-Q Plug Power filed on August 10, 2026 and from the earnings release attached to the 8-K filed the same day. I read the statements of operations, balance sheet, cash flow statement and Notes 6 through 11 and 15 directly, and cross-checked every fair-value figure against the rollforward tables in Notes 7 and 8.
- The fourteen-quarter series was built from XBRL company facts for CIK 1093691. Fourth quarters have no quarterly tag, so they were derived as full year minus nine months, and quarterly sums were reconciled to annual filings for 2023, 2024 and 2025 with zero difference in all three years. The profitability promises were assembled by parsing all 50 earnings-related 8-K filings since 2019 and extracting the original sentences.
- Valuation bands use 57 month-end closes and XBRL quarterly financials. Current values were cross-checked against aggregator figures: price to book of 5.04 against 5.07, price to sales of 3.94 against 3.95. Industry series are from the Federal Reserve Bank of St. Louis. Analyst consensus and peer multiples come from aggregated sell-side research, and where two aggregators disagreed both figures are shown.
- One correction is recorded above: the "Change in fair value of debt" line of $3,408 thousand belongs to the 2025 columns, confirmed by reconciling each column to its reported pre-tax loss.
- This article is for information only and is not investment advice.
#PlugPower #PLUG #PLUGStock #PLUGStockAnalysis #HydrogenFuelCell #Electrolyzer #ConvertibleNotes #USStocks #StockAnalysis #EquityResearch #GlobalStockBrief
'US Stock Analysis' 카테고리의 다른 글
| NVIDIA (NVDA) Stock Analysis: Guarantees and Cash Flow (0) | 2026.09.17 |
|---|---|
| Lennar (LEN) Stock: 12.9% Incentives and a 0.89x P/B (0) | 2026.09.15 |
| Trip.com (TCOM) Stock Analysis: Antitrust Fine and Guidance (0) | 2026.09.14 |
| Bitmine (BMNR) Stock Analysis: mNAV Below 1 and Dilution (0) | 2026.09.14 |
| Sumitomo Electric (5802) Stock Analysis: Data Center Optics (0) | 2026.09.13 |


