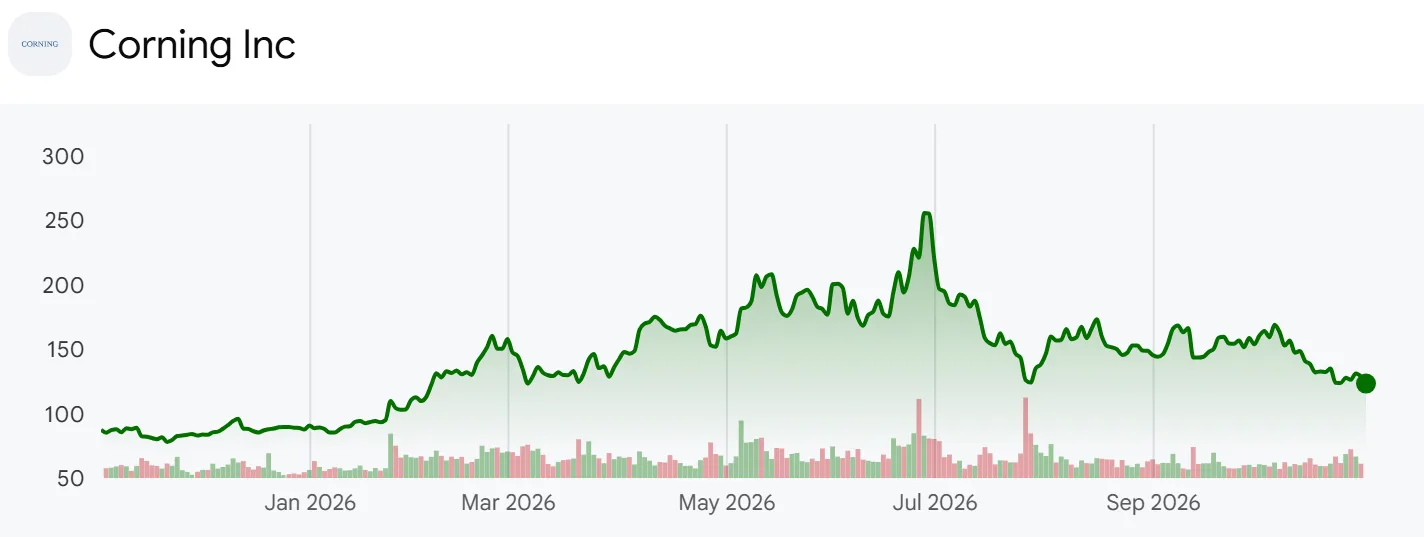
Corning (NYSE: GLW) posted third-quarter 2026 core sales of $5.08 billion and core EPS of $0.91, up +18.9% and +35.8% from a year earlier and above the top of the range it gave in July ($4.9 billion to $5.0 billion and $0.85 to $0.89). The October month-end close of $123.31 still sits -51.7% below the June month-end peak of $255.43. Underneath the beat is a funding question: $1.0 billion of the $2.27 billion in nine-month adjusted free cash flow was a customer’s upfront deposit, and in September Corning signed up to sell as much as $2.0 billion of new stock into the market.
Corning, based in Corning, New York, is a glass and ceramics materials company. It reports five businesses: Optical Communications (fiber, cable and data center connectivity), Glass Innovations (display glass substrates and Gorilla Glass cover glass), Automotive, Solar, and Life Sciences with other emerging businesses. Optical produced almost half of Q3 sales. The company is worth about $106.2 billion on market data, and Wendell Weeks is chairman, CEO and president.
Corning one-year share price chart
The question here is how the NVIDIA partnership changed who pays for Corning’s capacity build, and whether the current pace reaches the $40 billion annualized sales run rate Corning has promised by the end of 2030. The analysis lines up the Q3 2026 earnings release, the Q3 2026 10-Q, the 39-page Q3 deck on the IR site, 15 quarterly earnings releases from Q1 2023, the May NVIDIA 8-K and the September ATM 8-K.
Two caveats apply. Core sales and core EPS are Corning’s non-GAAP measures, which restate hedged foreign currency exposure at the company’s hedge rates and remove one-off items; on a GAAP basis Q3 sales were $4.86 billion and EPS $0.78. Figures run through Q3 2026, and the share count is the 861.4 million on the 10-Q cover.
What the Q3 IR Deck Says About the Beat
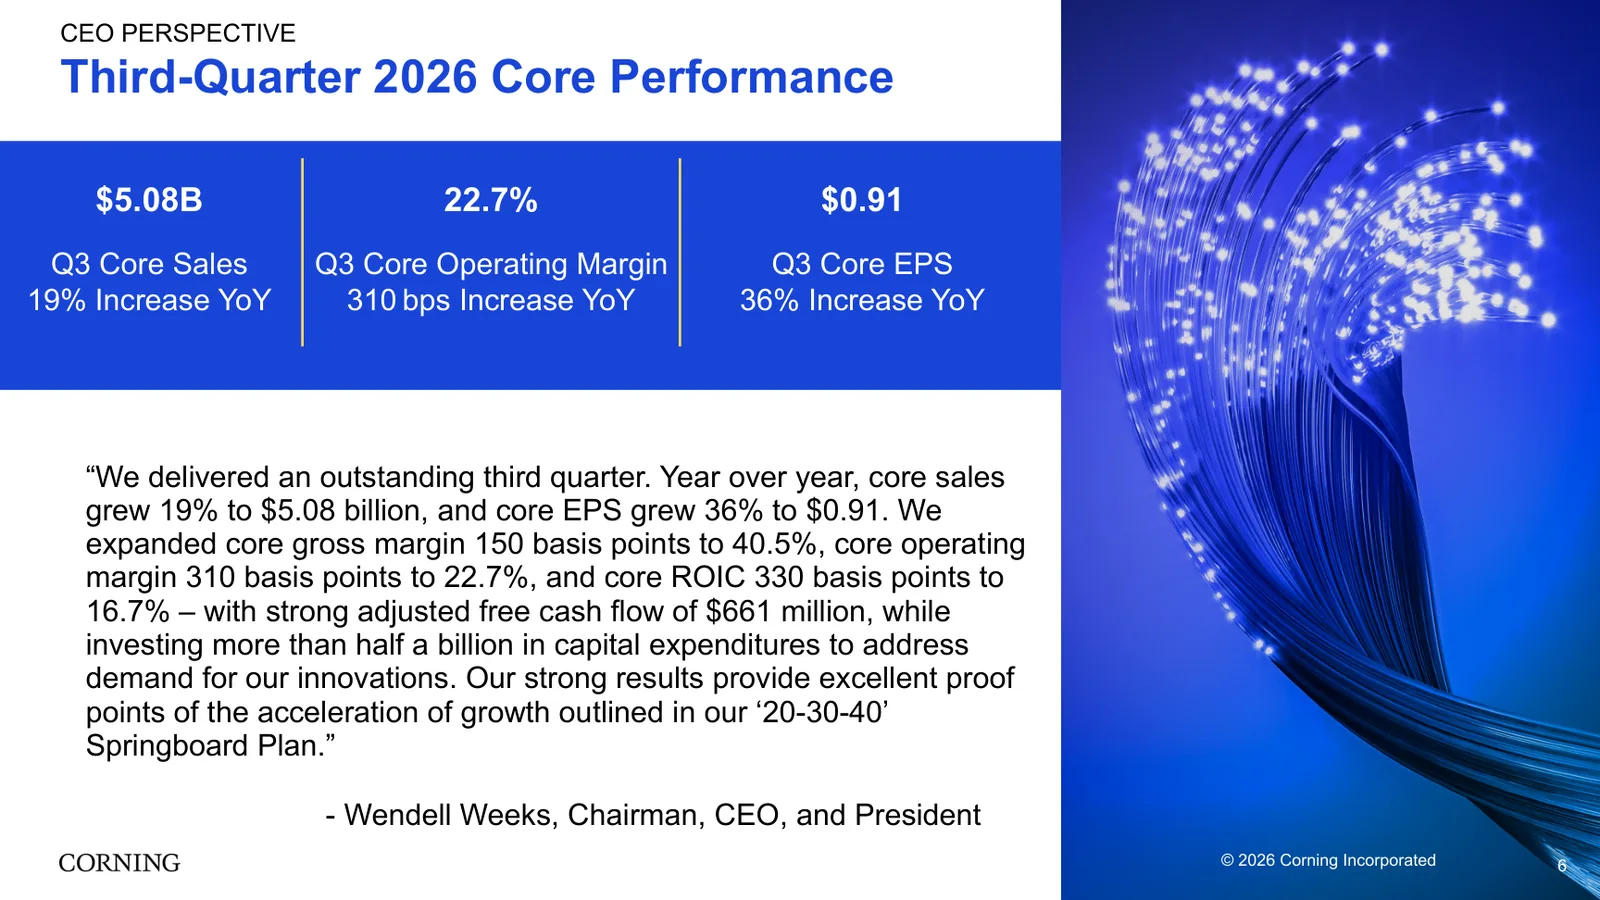
Q3 earnings deck page 6: core sales and core operating margin and core EPS
Page 6 of the 39-page deck reduces the quarter to three numbers: core sales of $5.08 billion, +19%; core operating margin of 22.7%, up 310 basis points; and core EPS of $0.91, +36%. The CEO quote on the same page opens “We delivered an outstanding third quarter.” and adds core gross margin of 40.5%, core return on invested capital (ROIC) of 16.7% and adjusted free cash flow of $661 million, calling the results “excellent proof points of the acceleration of growth outlined in our ‘20-30-40’ Springboard Plan.”
Company disclosure (Q3 2026 earnings release, October 27, 2026): Corning guided Q4 core sales to $5.2 billion to $5.3 billion, about +19% year over year, and core EPS to $0.96 to $1.00, about +36%. It also said it signed four long-term, multibillion-dollar customer agreements in the quarter, including with Verizon and AT&T.
Own calculation (15 quarterly releases): Adding the Q4 guide to the first three quarters puts 2026 core EPS at $3.35 to $3.39, +32.4% to +34.0% on 2025’s $2.53.
Page 28 holds Q4 operating expenses level with Q3 and lists a full-year tax rate of about 18.5% and capital expenditures of about $2 billion. Page 13 says many of the customer relationships and long-term agreements behind the outlook are already in place, built on co-innovation and a stated aim: “We seek to appropriately share risks and rewards as we deliver that vision”. The 10-Q’s $2.7 billion of contract liabilities partly backs that up, but contract-by-contract values and terms are not disclosed.
Checked against the filings, the growth came from one place. Of the $809 million year-over-year increase in core sales, $727 million (89.9%) came from Optical Communications, while Glass Innovations sales were -3.5% lower. In July Corning had guided Q3 growth to about +16%, below Q2’s +17%; the quarter came in at +18.9%, $81 million above the top of the range.
The Springboard Plan and the Customer Deposit
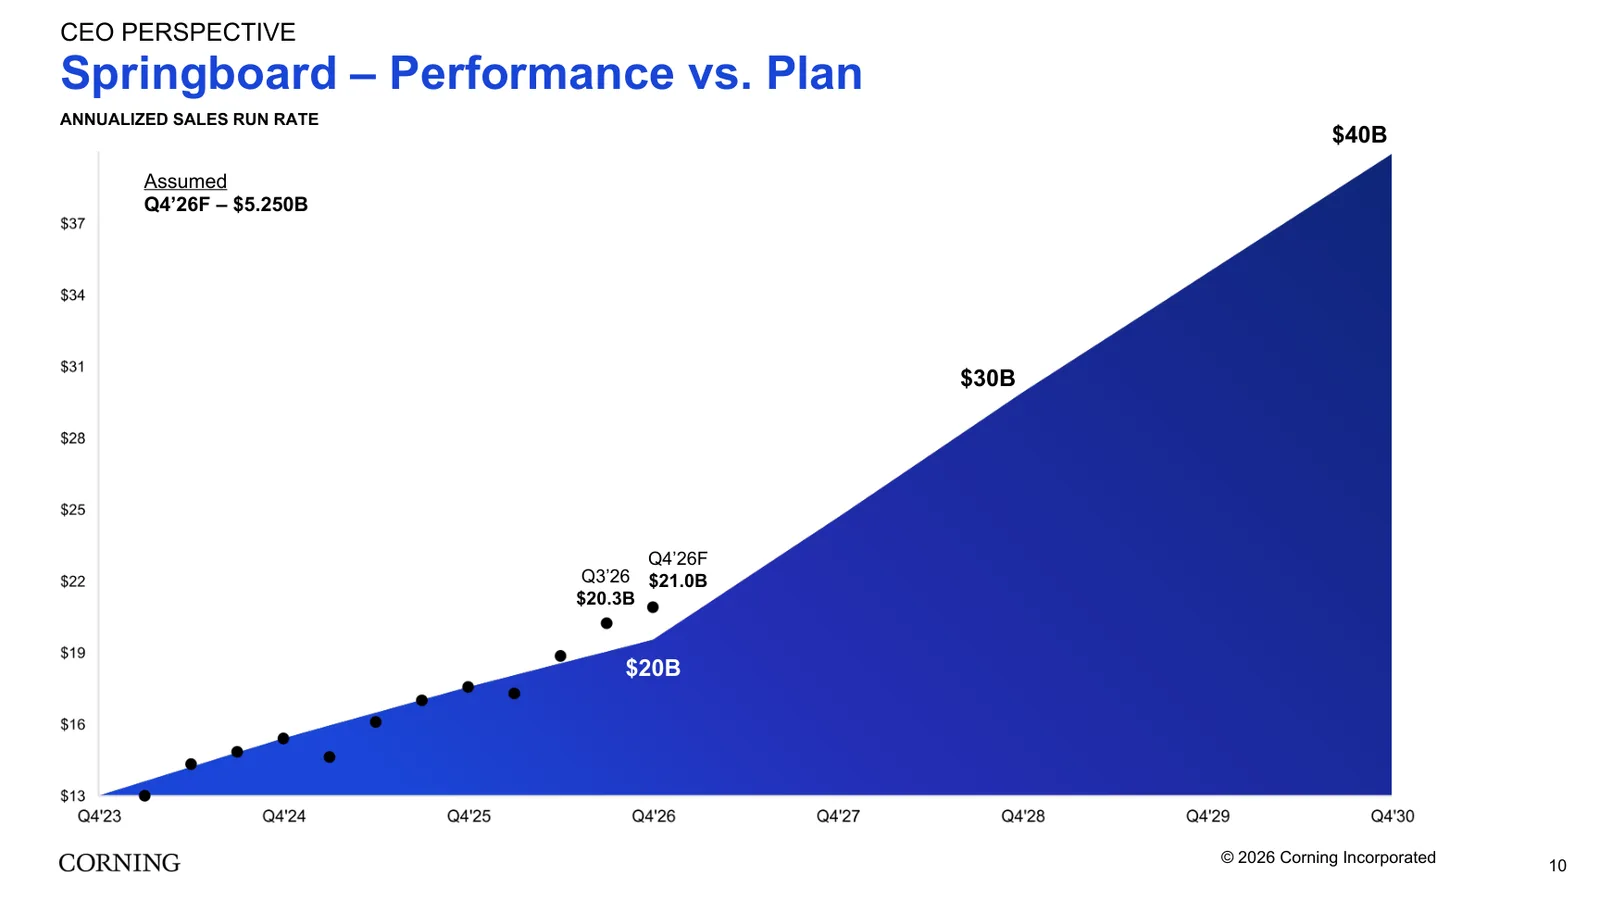
Q3 earnings deck page 10: Springboard run-rate plan against results
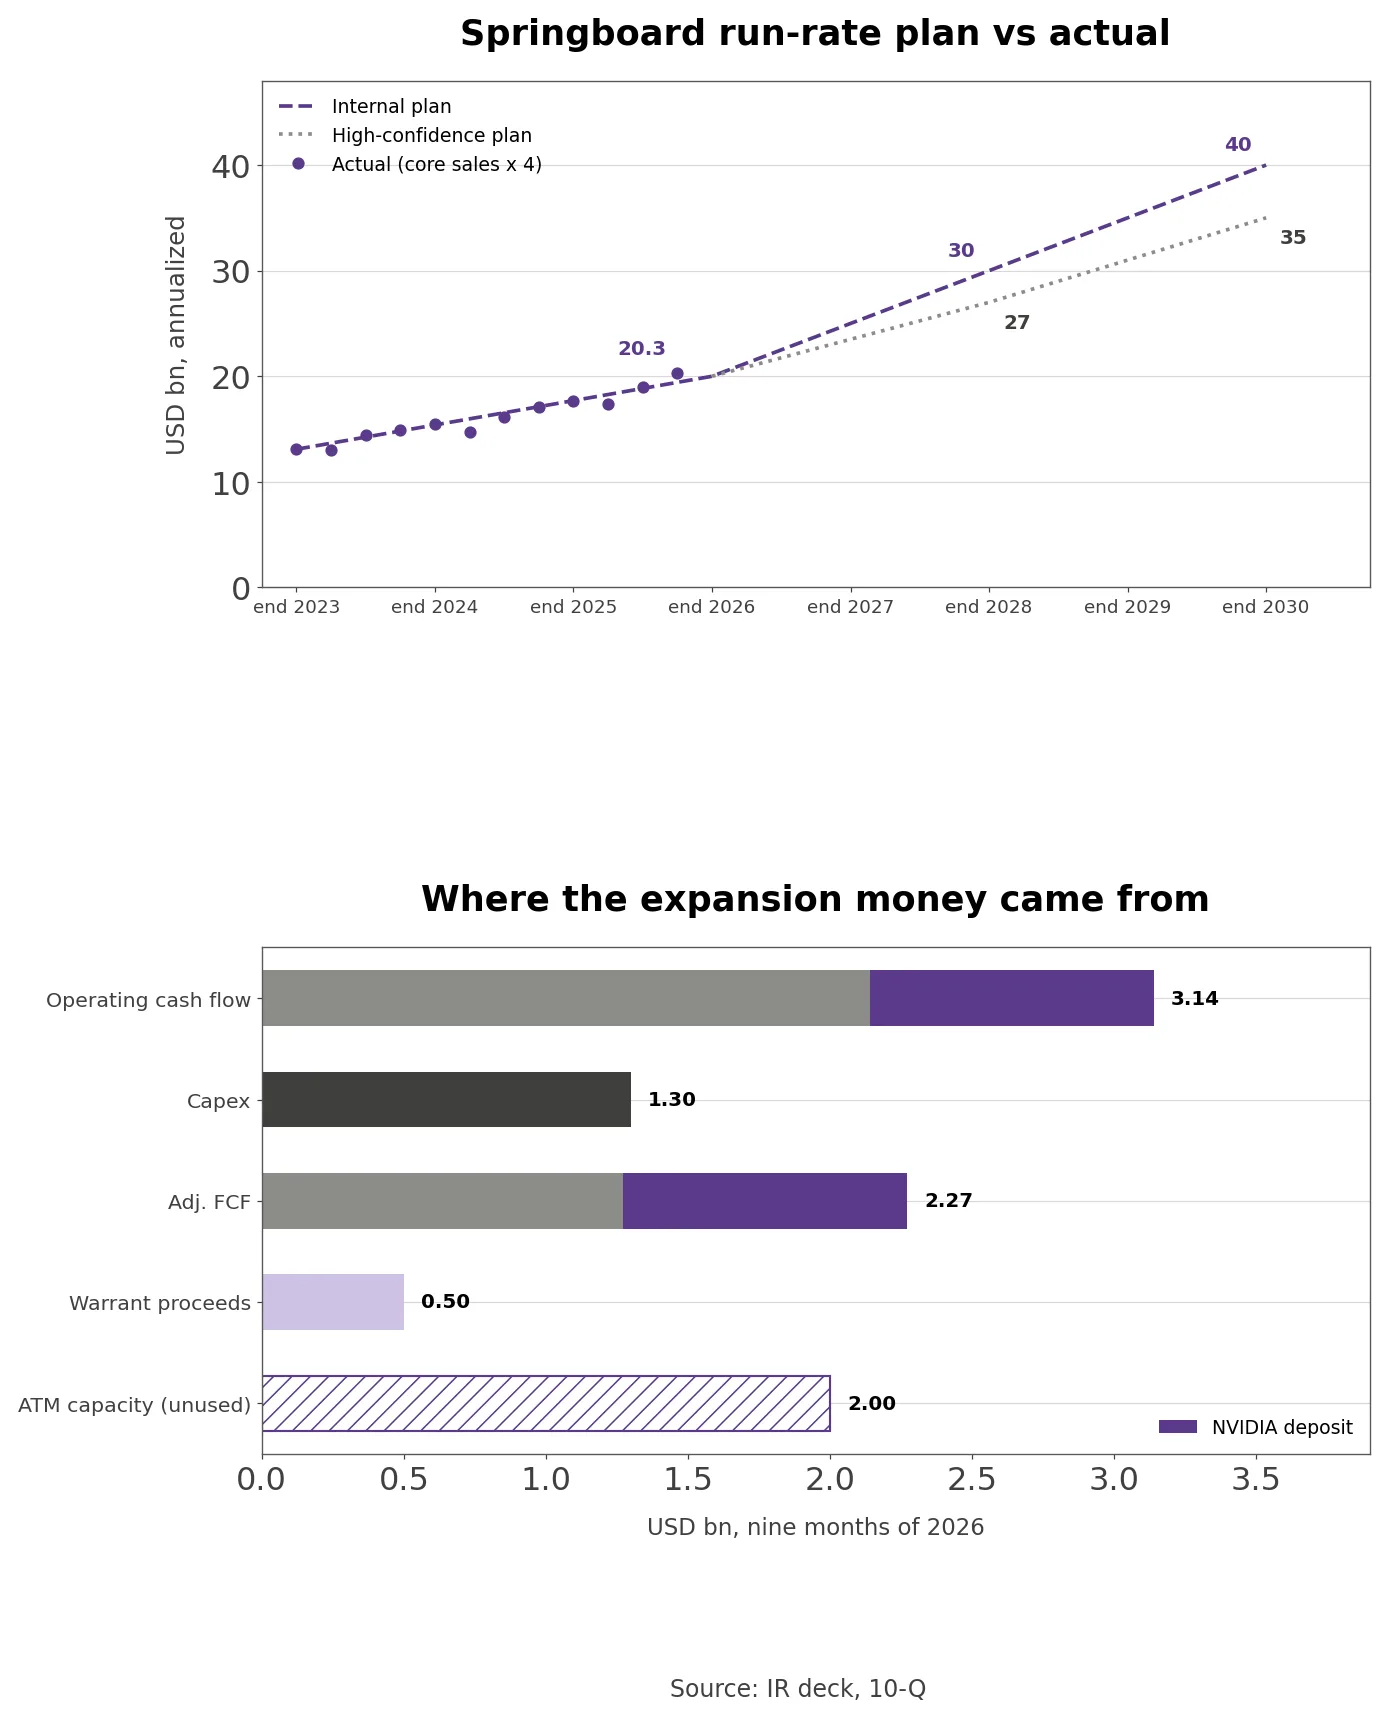
Page 10 tracks Springboard, the plan Corning unveiled in July 2024 with Q4 2023 as its baseline. Q3 core sales times four give an annualized run rate of $20.3 billion, one quarter ahead of the $20 billion end-2026 target, and the midpoint of Q4 guidance ($5.25 billion) would take it to $21.0 billion. Page 7 shows two paths: an internal plan of $20 billion at the end of 2026, $30 billion at the end of 2028 and $40 billion at the end of 2030, and a high-confidence plan of $27 billion and $35 billion for the last two dates.
Page 8 splits the internal plan into two speeds: a +15% compound annual growth rate from Q4 2023 to Q4 2026 and +19% from there to Q4 2030. The releases show the first leg ran faster than plan, at 17.4% a year over the 11 quarters to Q3 2026. Because Corning is a quarter ahead, starting from the $21.0 billion Q4 estimate, which page 10 marks as assumed, the internal plan needs +17.5% a year, below the 19% on the slide.
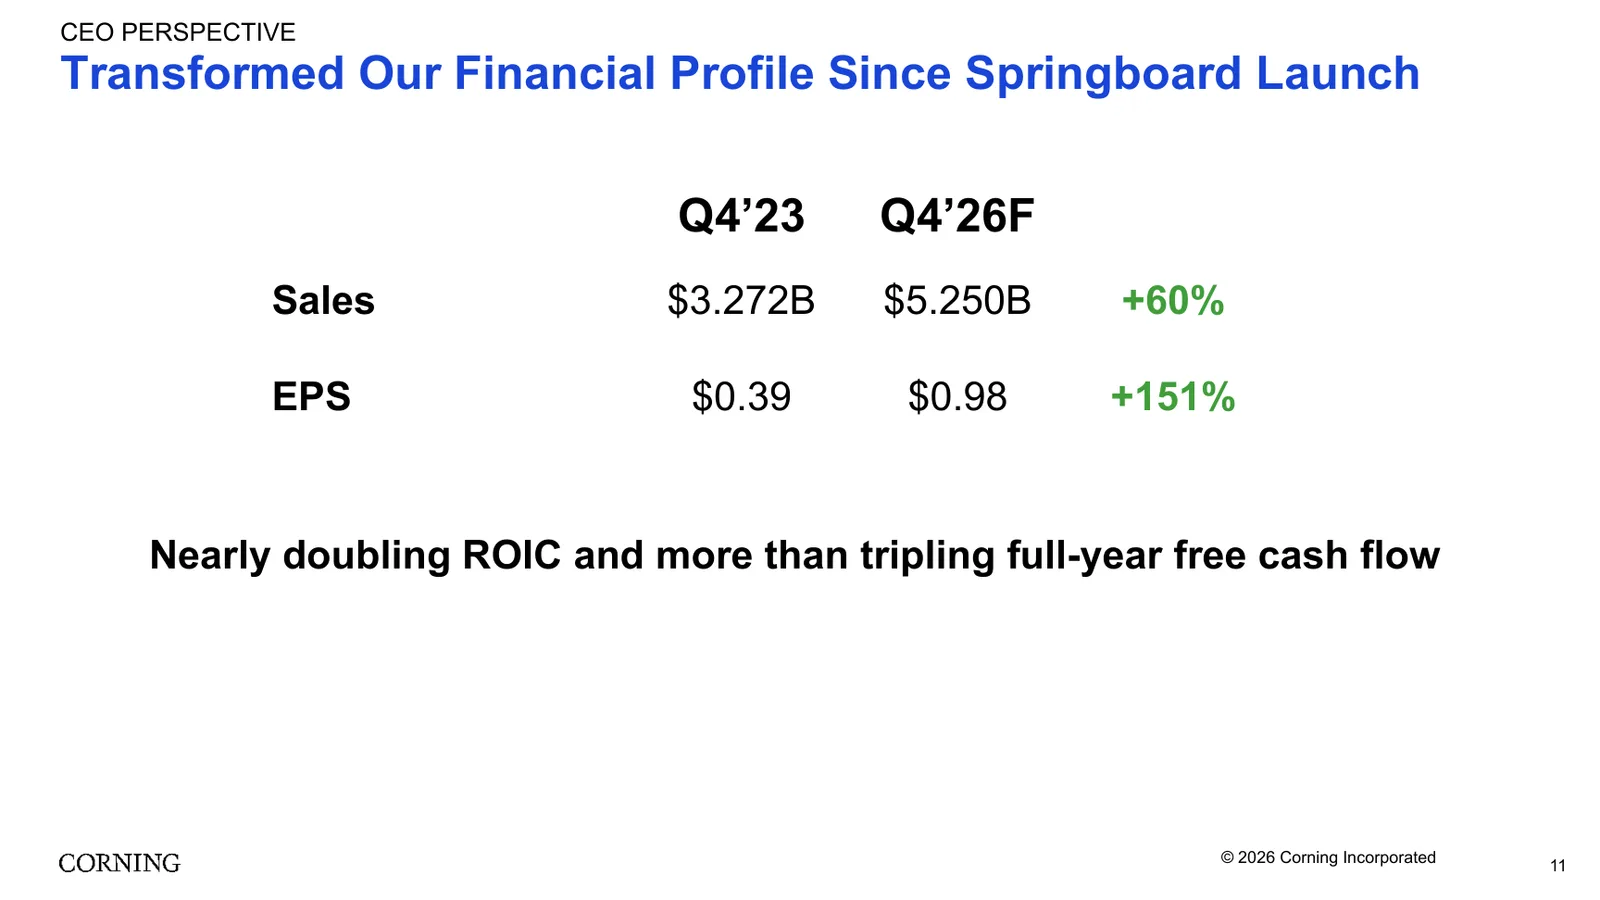
Q3 earnings deck page 11: sales and EPS against the Q4 2023 baseline
Page 11 compares against the baseline: Q4 2023 core sales of $3.272 billion and EPS of $0.39 against Q4 2026 estimates of $5.250 billion and $0.98, or +60% and +151%, with ROIC nearly doubling and full-year free cash flow more than tripling. Page 12 lists the next-phase goals: grow EPS significantly faster than sales, expand ROIC and deliver robust free cash flow while investing.
Page 22 is where funding comes in. Corning says customer agreements de-risk its investments and that it will “Use multiple mechanisms in our agreements to achieve the appropriate balance, including upfront funding from customers”, and it points to $2.3 billion of free cash flow generated over the first nine months while adding capacity. Page 23 ranks organic growth first, describes the balance sheet as “One of the longest debt tenors in the S&P 500” and says Corning will “continue strong track record of returning excess cash to shareholders”.
Checked against the filings, 44.0% of the $2.27 billion in nine-month adjusted free cash flow cited on page 22 is a $1.0 billion upfront customer deposit received under a long-term supply agreement, and the reconciliation on page 33 leaves it in. Q3 on its own produced $661 million of adjusted free cash flow against $545 million of capital spending, a $116 million surplus. Shareholder returns over the nine months were dividends only, with zero buybacks, and in the same quarter Corning set up an ATM program that lets it sell stock rather than buy it.
The Bull and Bear Case for Corning Stock
The bull case is acceleration backed by contracts. Core EPS grew nearly twice as fast as sales in Q3, the Q4 guide repeats that pace, and each long-term agreement like the Verizon and AT&T deals locks in volume behind the 2030 target.
The bear case is concentration and funding. Optical produced 89.9% of the growth, much of the cash behind the build came from a customer deposit and warrant proceeds, and the warrants and ATM already in place could add up to 4.0% to the share count.
From Optical Fiber to the NVIDIA Deal
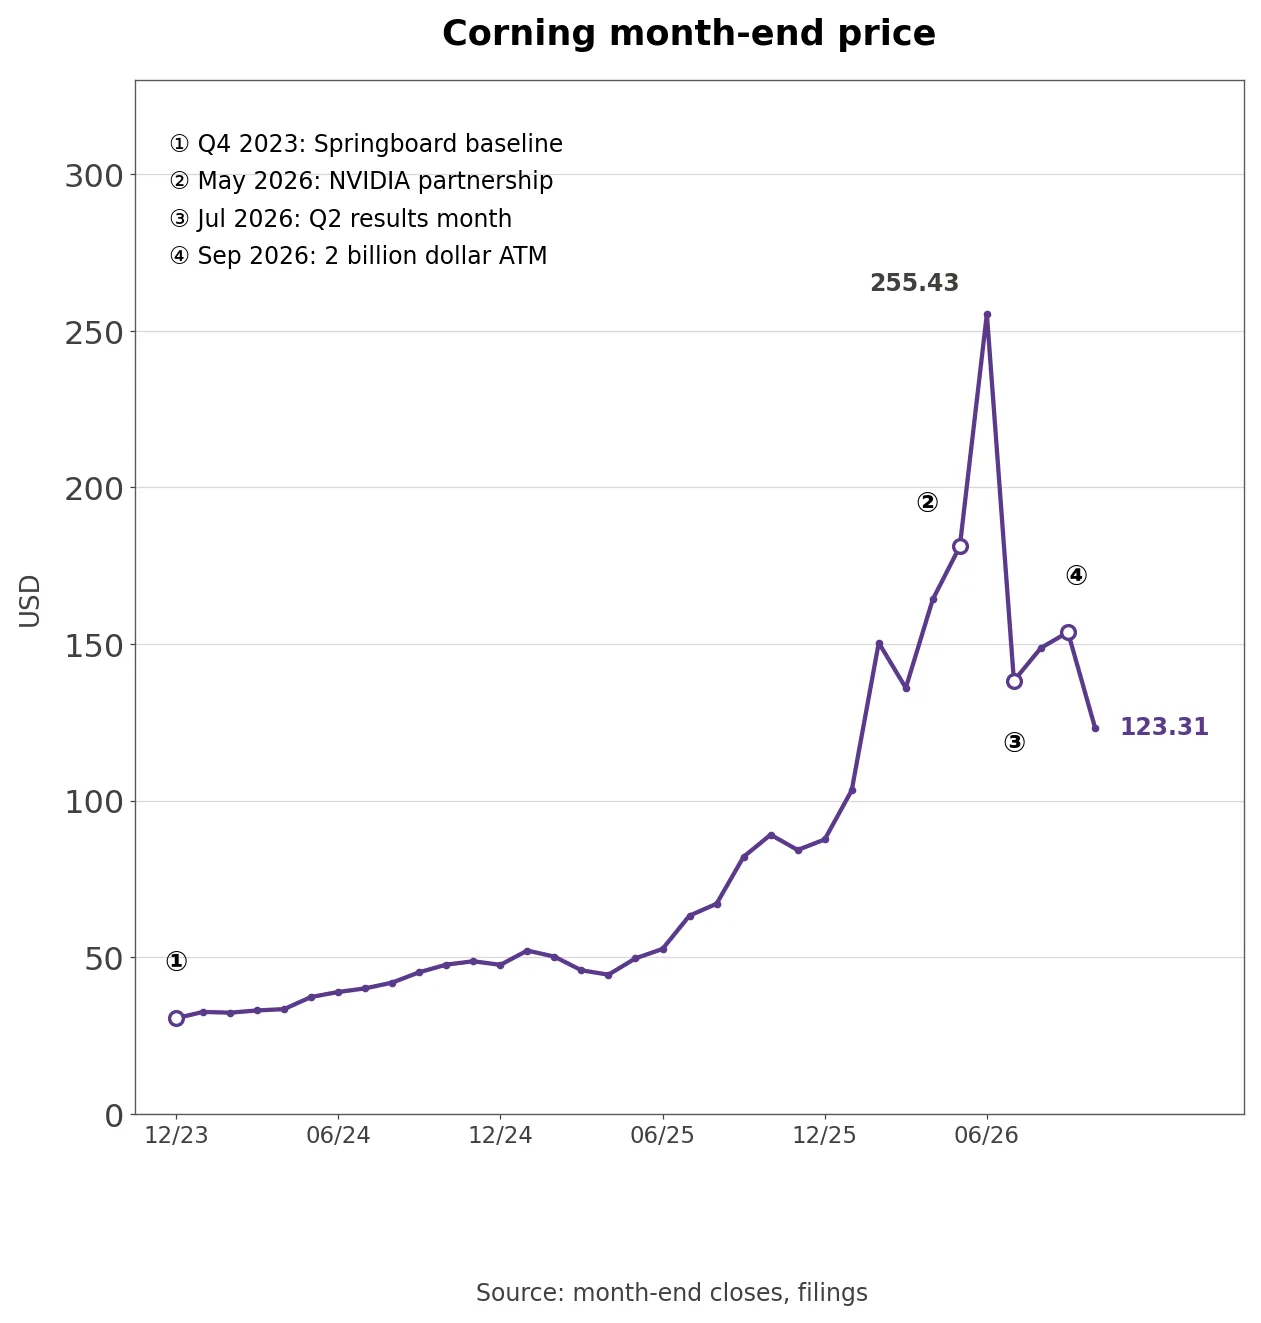
Corning month-end share price with four dates
Corning was founded in 1851 as a glass maker, and in 1970 its researchers produced the first optical fiber with losses low enough for telecommunications. When the fiber bubble burst in 2000 the stock gave up more than nine-tenths of its peak value, and the company leaned on LCD glass substrates and on Gorilla Glass, which went into the first iPhone in 2007.
The current run starts with Springboard. Corning unveiled the plan with preliminary Q2 results in July 2024 and set Q4 2023 as its baseline, when the December month-end close was $30.45. On May 6, 2026, alongside the NVIDIA partnership 8-K, Corning said it would expand U.S. fiber capacity by more than 50% and build three plants in North Carolina and Texas, and the joint release put the headline as “Corning will increase its U.S.-based optical connectivity manufacturing capacity by 10x”. The investor event the same day extended the plan to 2030. The May close rose +10.3% to $181.16, and the June close of $255.43 was the high of the period.
With Q2 results on July 28 Corning guided Q3 core sales growth to about +16%, and the July close fell -45.9% to $138.25. On September 11 the ATM 8-K disclosed the $2.0 billion equity program, and the October close of $123.31 is 4.05 times December 2023.
Core Results vs GAAP Results
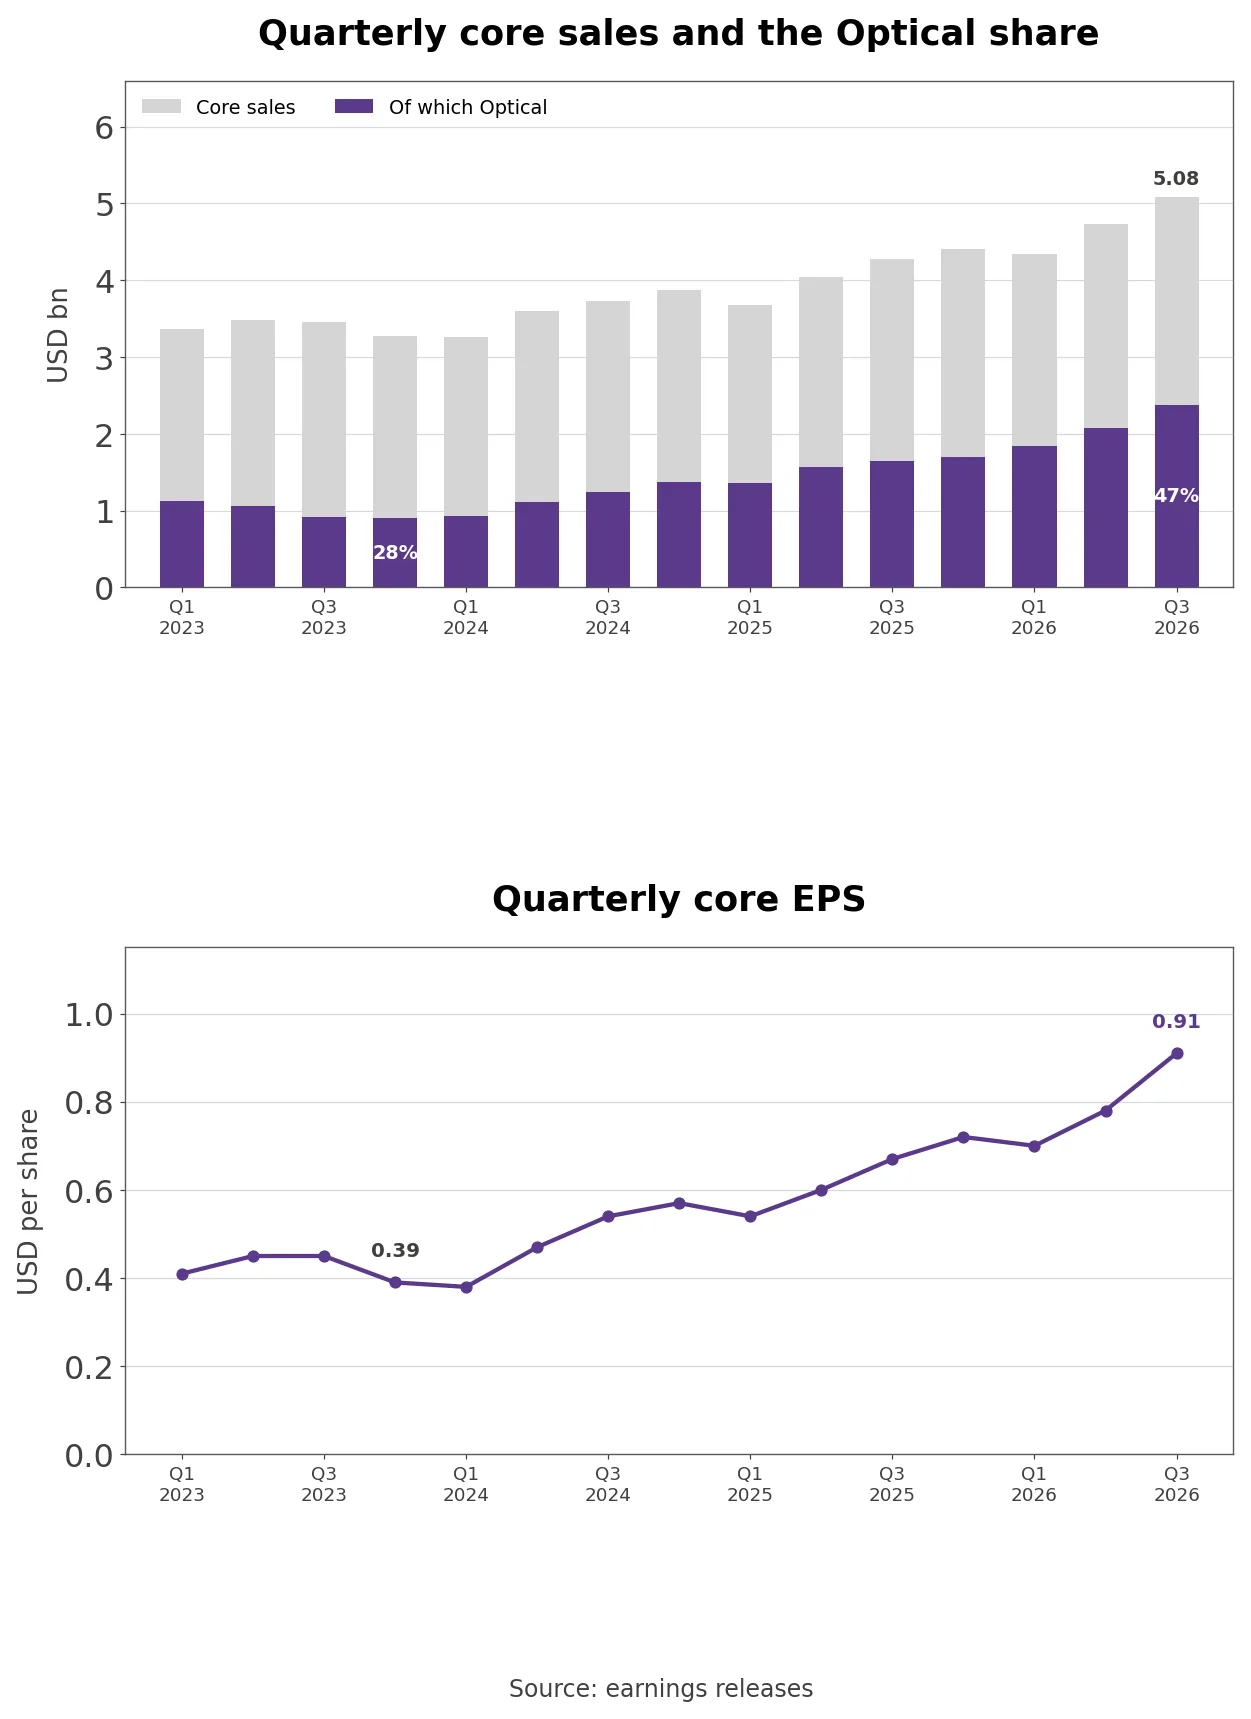
Corning quarterly core sales with Optical sales and quarterly core EPS
Corning reports two sets of numbers, and the release attributes most of the gap between GAAP EPS of $0.78 and core EPS of $0.91 to adjustments for hedged exposures and discrete tax items. Per the 10-Q, the largest adjustment is the Japanese yen exposure in Glass Innovations, and since Q2 2026 Corning has used this hedged-exposure method in place of the earlier constant-currency rates, so year-ago figures were calculated differently.
Own calculation (15 quarterly releases): Quarterly core sales rose from $3.272 billion in Q4 2023 to $5.081 billion in Q3 2026, +55.3%, and core EPS from $0.39 to $0.91, 2.33 times. Optical sales went from $903 million to $2.379 billion, 2.63 times.
Earnings outgrew sales because of Optical’s margin. Optical segment net income was 22.4% of segment sales in Q3, and Corning’s core operating margin rose 3.1 points in a year. Solar went the other way: sales rose +36.7% but early ramp costs pushed it into a loss.
Who Paid the $1.0 Billion Deposit?
Corning Springboard run-rate plan against actual and the sources of 2026 expansion funding
Nine-month operating cash flow in the 10-Q was $3.14 billion, 1.91 times the $1.643 billion of a year earlier, and the first reason Corning gives is a $1.0 billion upfront customer deposit tied to a long-term supply agreement that runs through December 31, 2029. The 10-Q explains that “Customer deposits allow customers to secure rights to products produced by Corning under long-term supply agreements” for up to 10 years; as products ship, Corning recognizes revenue and applies the deposit against receivables. It is future sales cash collected in advance, and contract liabilities rose from $2.3 billion at the end of 2025 to $2.7 billion.
Who is the customer? The 10-Q does not name it, but the same sentence nets $267 million for the long-term portion of a warrant issued to that customer, and the only warrants Corning issued in 2026 went to NVIDIA. Under the May 8-K, NVIDIA received a traditional warrant for up to 15 million shares at $180.00 and a pre-funded warrant for up to 3 million shares at $0.0001, for $500 million in total. Corning treats the $296 million fair value of the $180 warrant as consideration paid to a customer: “The fair value of the warrant will be recognized as a reduction of revenue as sales occur under the agreement.”
In 2000 Corning built fiber capacity and waited for orders; this time a customer’s money is paying for the plants first.
Own calculation (10-Q, IR deck pages 28 and 33, May and September 8-Ks): Excluding the $1.0 billion deposit, nine-month adjusted free cash flow was $1.272 billion, short of $1.299 billion in capital expenditures. Hitting the roughly $2 billion capex guide means about $700 million more in Q4 alone, before spending on the three new plants ramps. Adding NVIDIA’s 18 million warrant shares to a full $2.0 billion ATM at $123.31 gives up to 34.2 million new shares, 4.0% of the 861.4 million on the 10-Q cover.
The remaining device is equity. On September 11 Corning entered an equity distribution agreement to sell up to $2.0 billion of common stock at the market, and per the 10-Q “No shares were sold under the ATM program during the three months ended September 30, 2026”. Cash rose to $2.537 billion from $1.526 billion at the end of 2025, total debt eased to $8.2 billion from $8.434 billion, and debt to total capital went from 41% to 36%. The $180 strike is 46.0% above the October close. About $3.0 billion remains on the 2019 buyback authorization, against $158 million repurchased in the first nine months of 2025, and the $0.28 quarterly dividend yields 0.91%.
How the Five Businesses Make Money
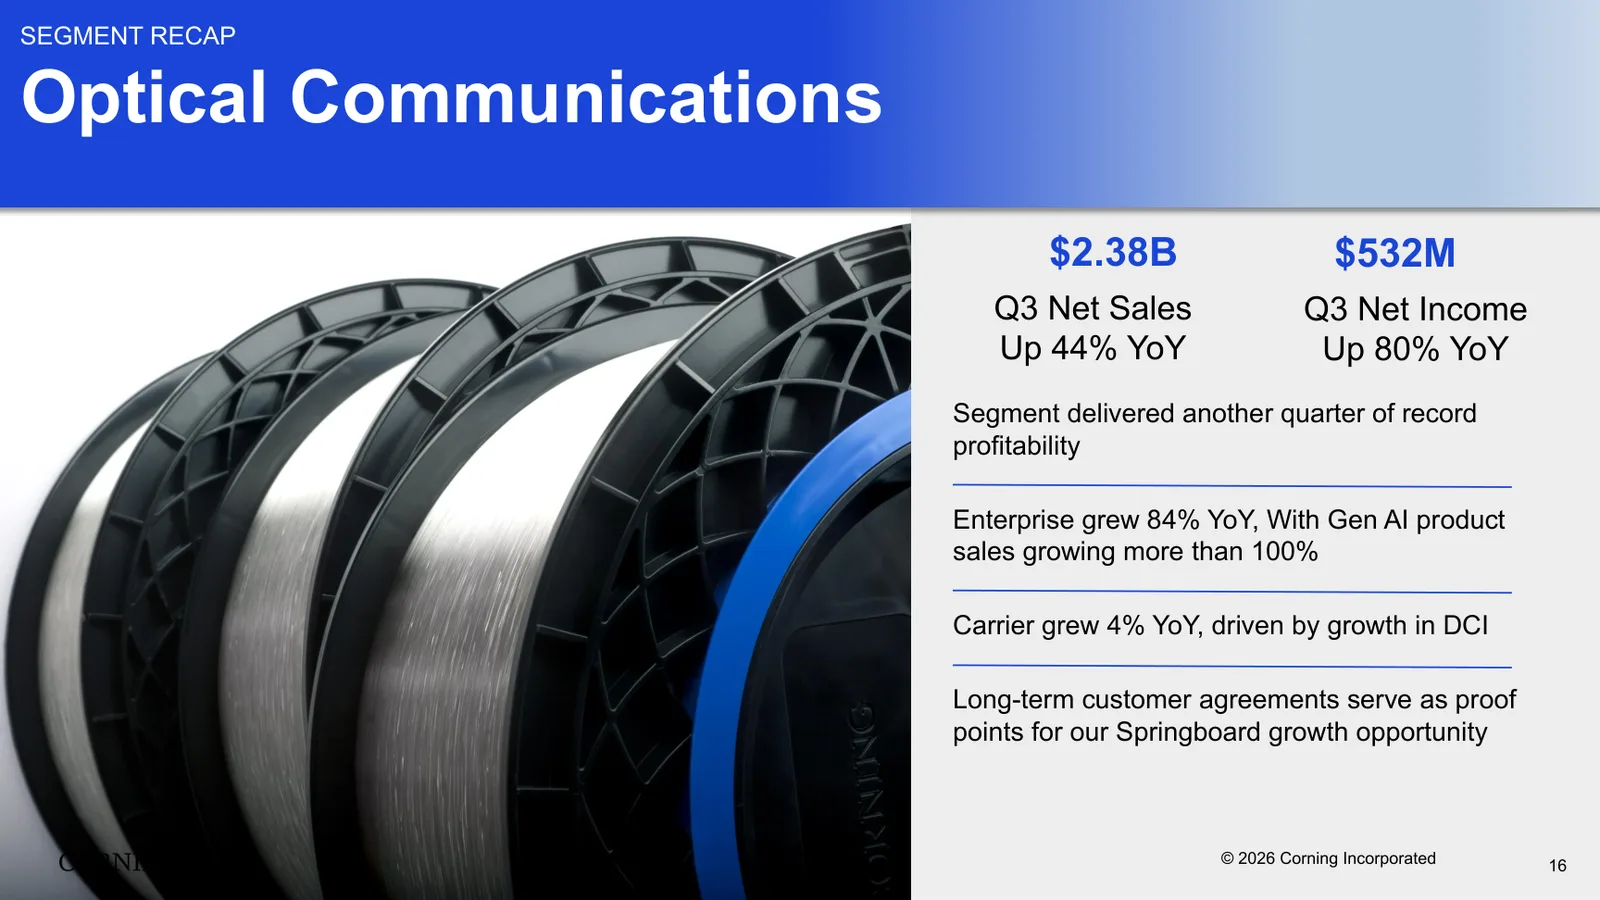
Q3 earnings deck page 16: Optical Communications sales and net income
By business, Q3 core sales of $5.081 billion split into Optical Communications 46.8%, Glass Innovations 29.6%, Automotive 9.3%, Solar 8.6% and Life Sciences and other businesses 5.7%. Optical sells fiber, cable and connectivity hardware. Its carrier customers are telecom operators such as Verizon and AT&T, and its enterprise business supplies the optical connections between servers and switches inside hyperscale data centers. Q3 Optical sales rose +44.0% to $2.379 billion and segment net income +80.3% to $532 million, 6.05 times the $88 million of the Q4 2023 baseline.
Page 16 says enterprise grew 84% with Gen AI product sales up more than 100%. In the release tables, enterprise sales of $1.525 billion (a $6.1 billion annualized pace) are 64.1% of Optical and 30.0% of company core sales, and +20.2% above Q2’s $1.269 billion. Carrier grew +4.0% to $854 million on data center interconnect demand. Optical accounts for 46.8% of core sales and 59.6% of the $892 million in combined segment net income.
In its Q1 release Corning said Optical’s “new Photonics Market-Access Platform will serve Gen AI OEM customers”, which widens the business from fiber and cable toward optical components that sit next to AI hardware.
Q3 earnings deck page 17: Glass Innovations sales and net income
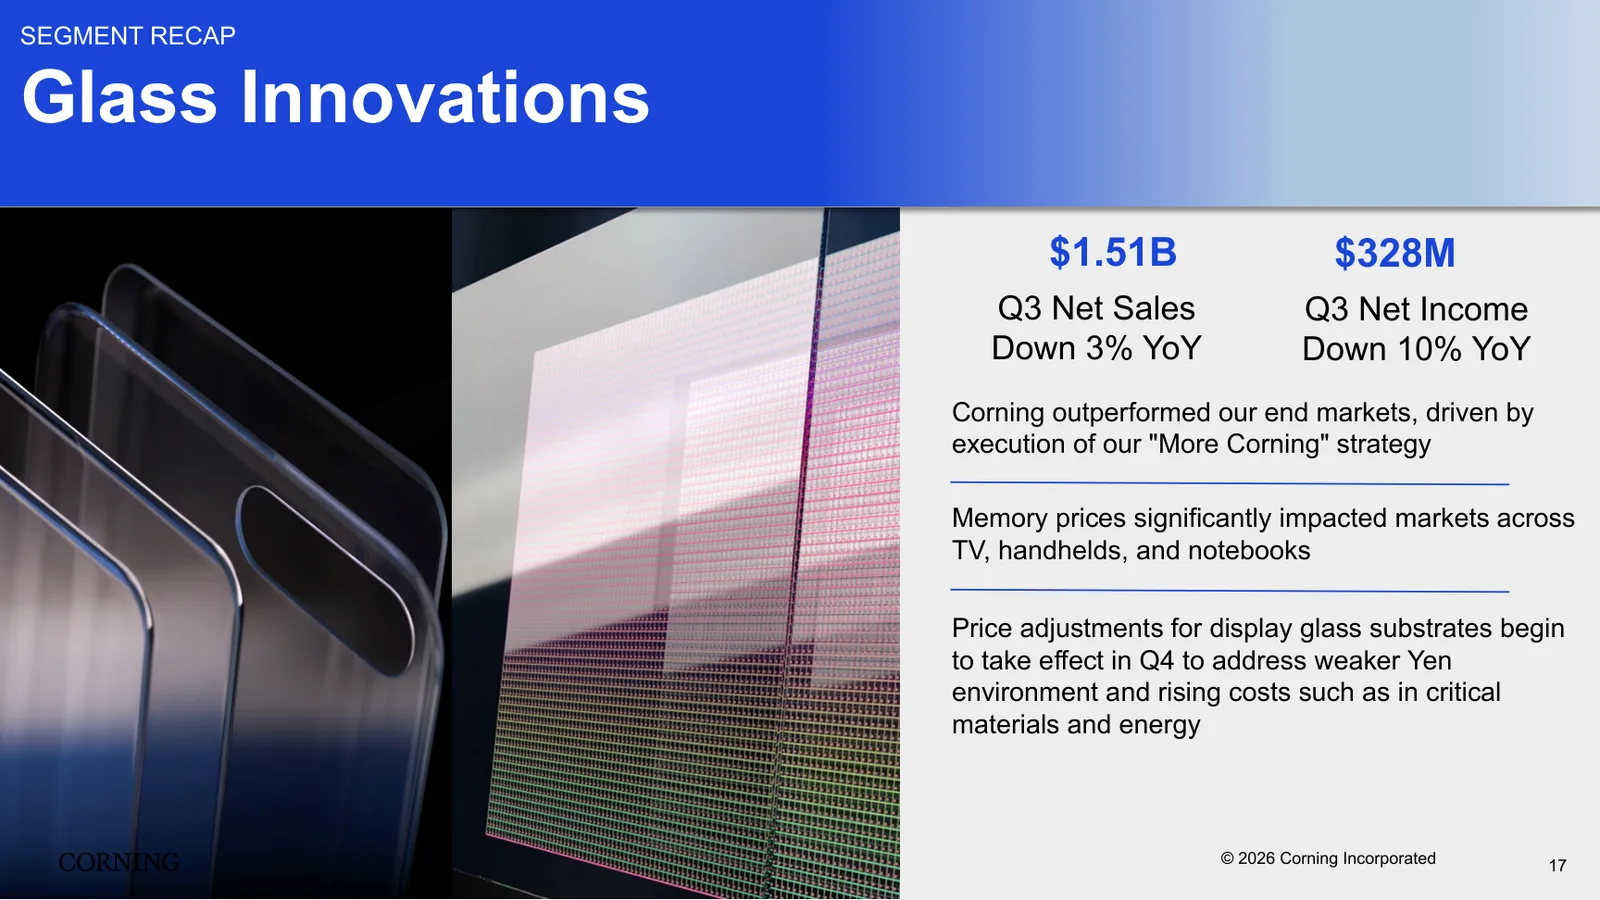
Glass Innovations combined the Display and Specialty Materials businesses in Q1 2026. It sells LCD and OLED glass substrates for TV, notebook and monitor panels and Gorilla Glass for phones and tablets. Q3 sales were $1.506 billion and net income fell -9.6% to $328 million. Page 17 says memory prices hit TV, handheld and notebook markets, and that “Price adjustments for display glass substrates begin to take effect in Q4 to address weaker Yen environment and rising costs”. Even so, the segment’s net margin of 21.8% is close to Optical’s 22.4%, which keeps it the second profit pillar.
Solar combines polysilicon maker Hemlock Semiconductor with wafer and module plants. Q3 sales were $436 million but the segment lost $7 million, against $30 million of net income a year earlier. Page 19 says productivity gains will lift output and profitability, cites Section 232 trade action and says Corning is “Making solid progress building a more than $3B revenue stream”; Q3 sales times four come to $1.744 billion, 58.1% of that.
Automotive, which sells emissions-control ceramic filters and auto glass, earned $67 million on $470 million of sales, a 14.3% margin, and page 18 says a recovery in North American Class 8 trucks offset a light-duty market that was 3% smaller than a year earlier. Life Sciences, which sells laboratory ware and consumables, and the other emerging businesses had $290 million of sales and a $28 million loss, which page 20 attributes to investment in emerging growth programs.
Corning vs Amphenol Coherent and Lumentum
Revenue growth and operating margin at Corning Amphenol Coherent and Lumentum
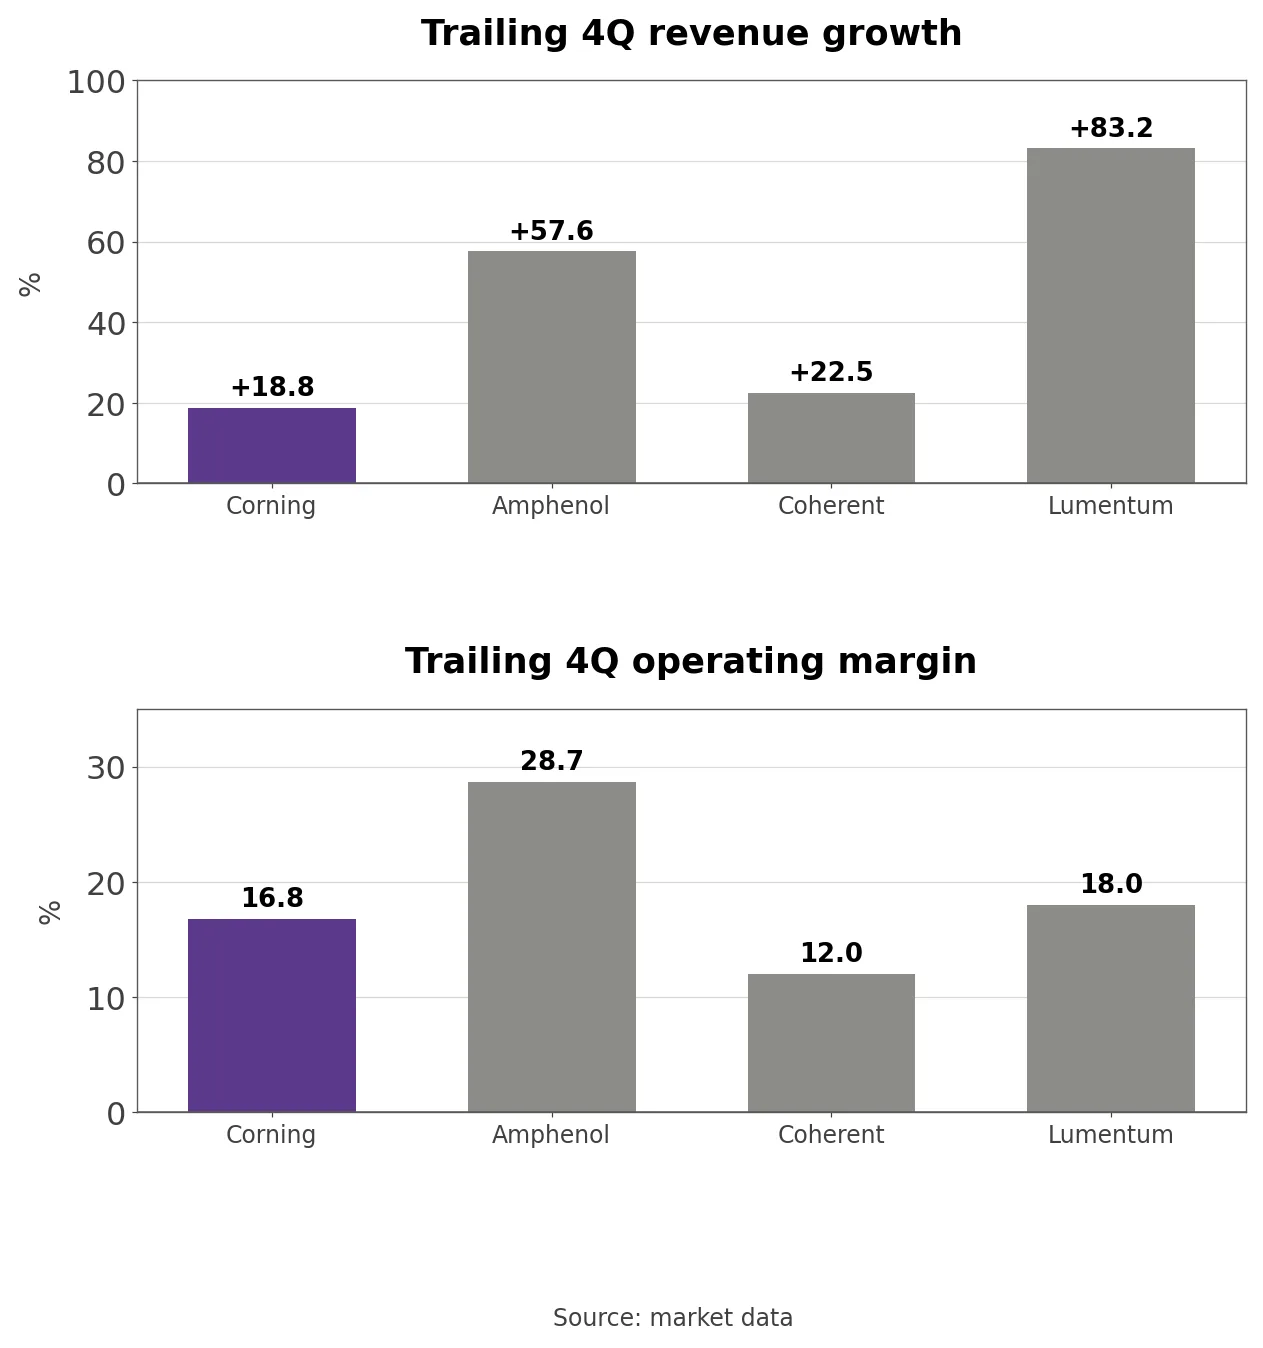
The comparison uses three suppliers to AI data center connectivity. Amphenol makes connectors and cable assemblies and overlaps with Corning in data center interconnect, while Coherent and Lumentum make the transceivers and lasers that sit at the ends of Corning’s fiber. On market data, trailing-twelve-month (TTM) revenue growth was slowest at Corning, +18.8%, and fastest at Lumentum, +83.2% (Coherent and Lumentum report through June).
Market value is $195.8 billion at Amphenol, $106.2 billion at Corning, $76.2 billion at Lumentum and $41.4 billion at Coherent, and Lumentum has about one-sixth of Corning’s TTM revenue but 72% of its market value. Operating margins are 28.7% at Amphenol, 18.0% at Lumentum, 16.8% at Corning and 12.0% at Coherent; Corning’s glass, solar and life sciences businesses pull its margin below Optical’s. All four lean on the same AI spending, and the difference is how much of their revenue it touches: enterprise optical is 30.0% of Corning’s core sales, and the other 70.0% comes from businesses at some distance from AI capex.
Forward P/E and price to sales at Corning Amphenol Coherent and Lumentum
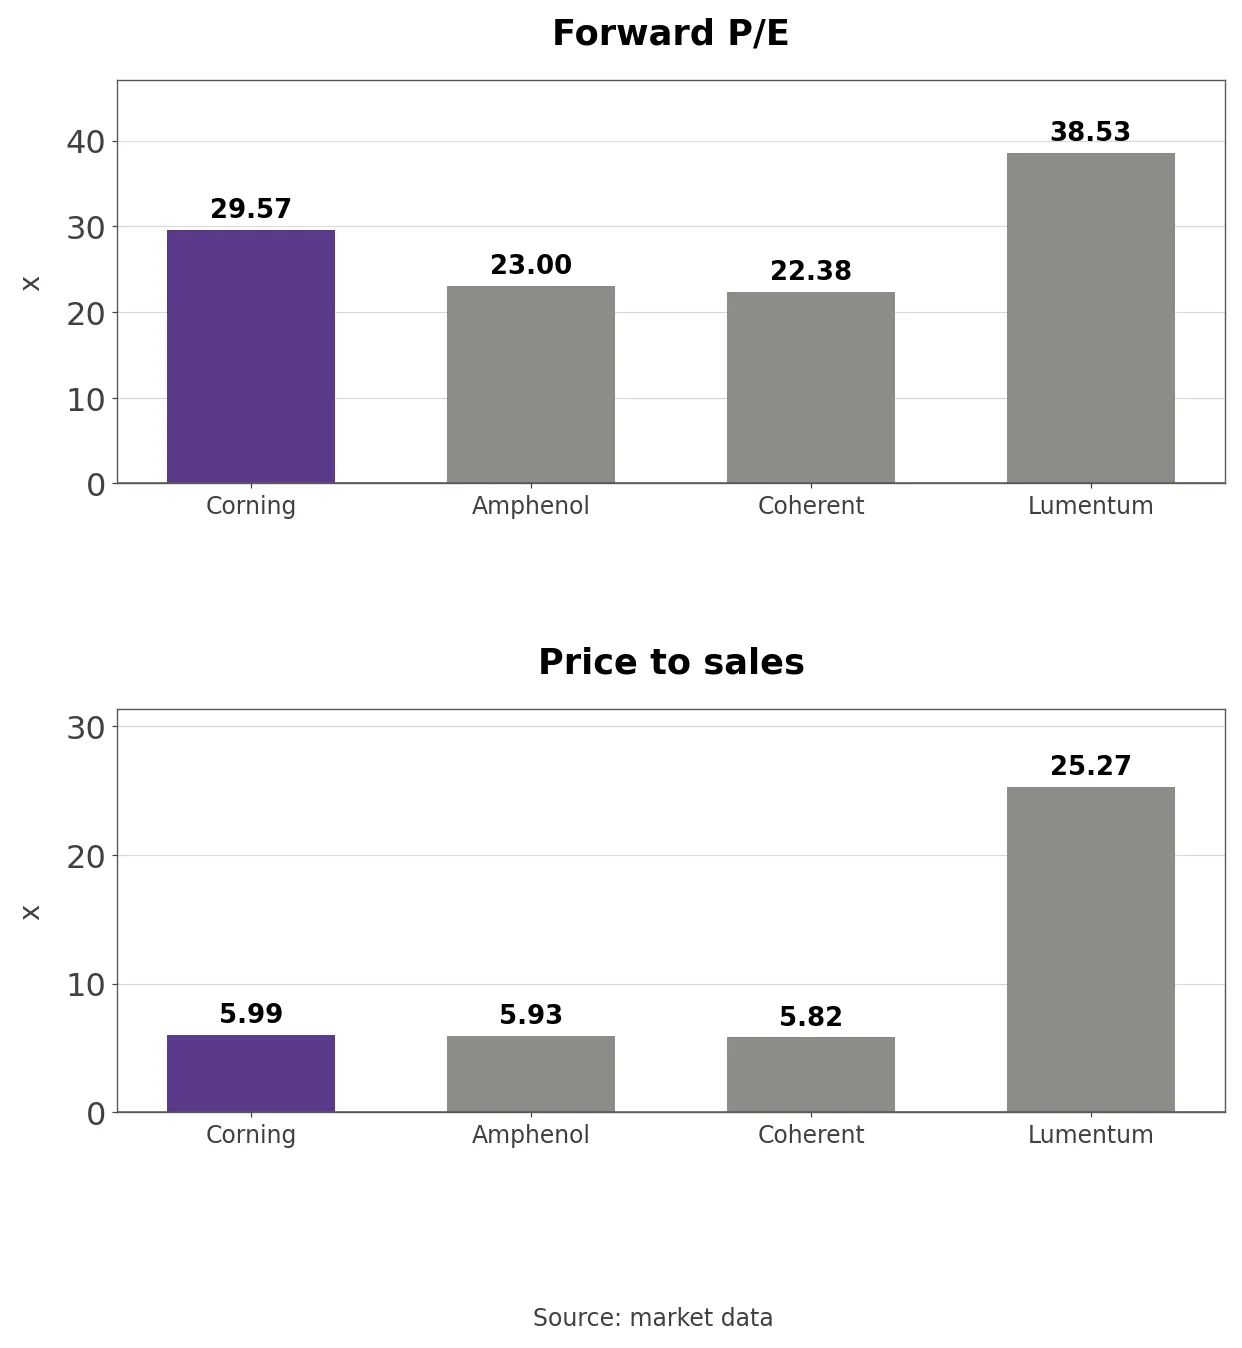
Forward P/E is 29.57 at Corning, 23.00 at Amphenol, 22.38 at Coherent and 38.53 at Lumentum, and price to sales is 5.8 to 6.0 at the first three against 25.27 at Lumentum. The slowest grower carries a higher forward P/E than Amphenol and Coherent, while its one-year change in market value, +37.3%, trails Lumentum’s +408.4% and Coherent’s +92.6%. Estimates already build the post-Q4 acceleration and contracted volumes into earnings.
The Core P/E and Price-to-Sales Band
Corning P/E on core EPS and price to sales over 34 months
Quarterly core EPS from the releases starts in Q1 2023, so the band covers 34 months from January 2024. GAAP P/E is left out because yen hedge gains and losses swing it every quarter, and price to sales uses XBRL GAAP revenue and the cover-page share count.
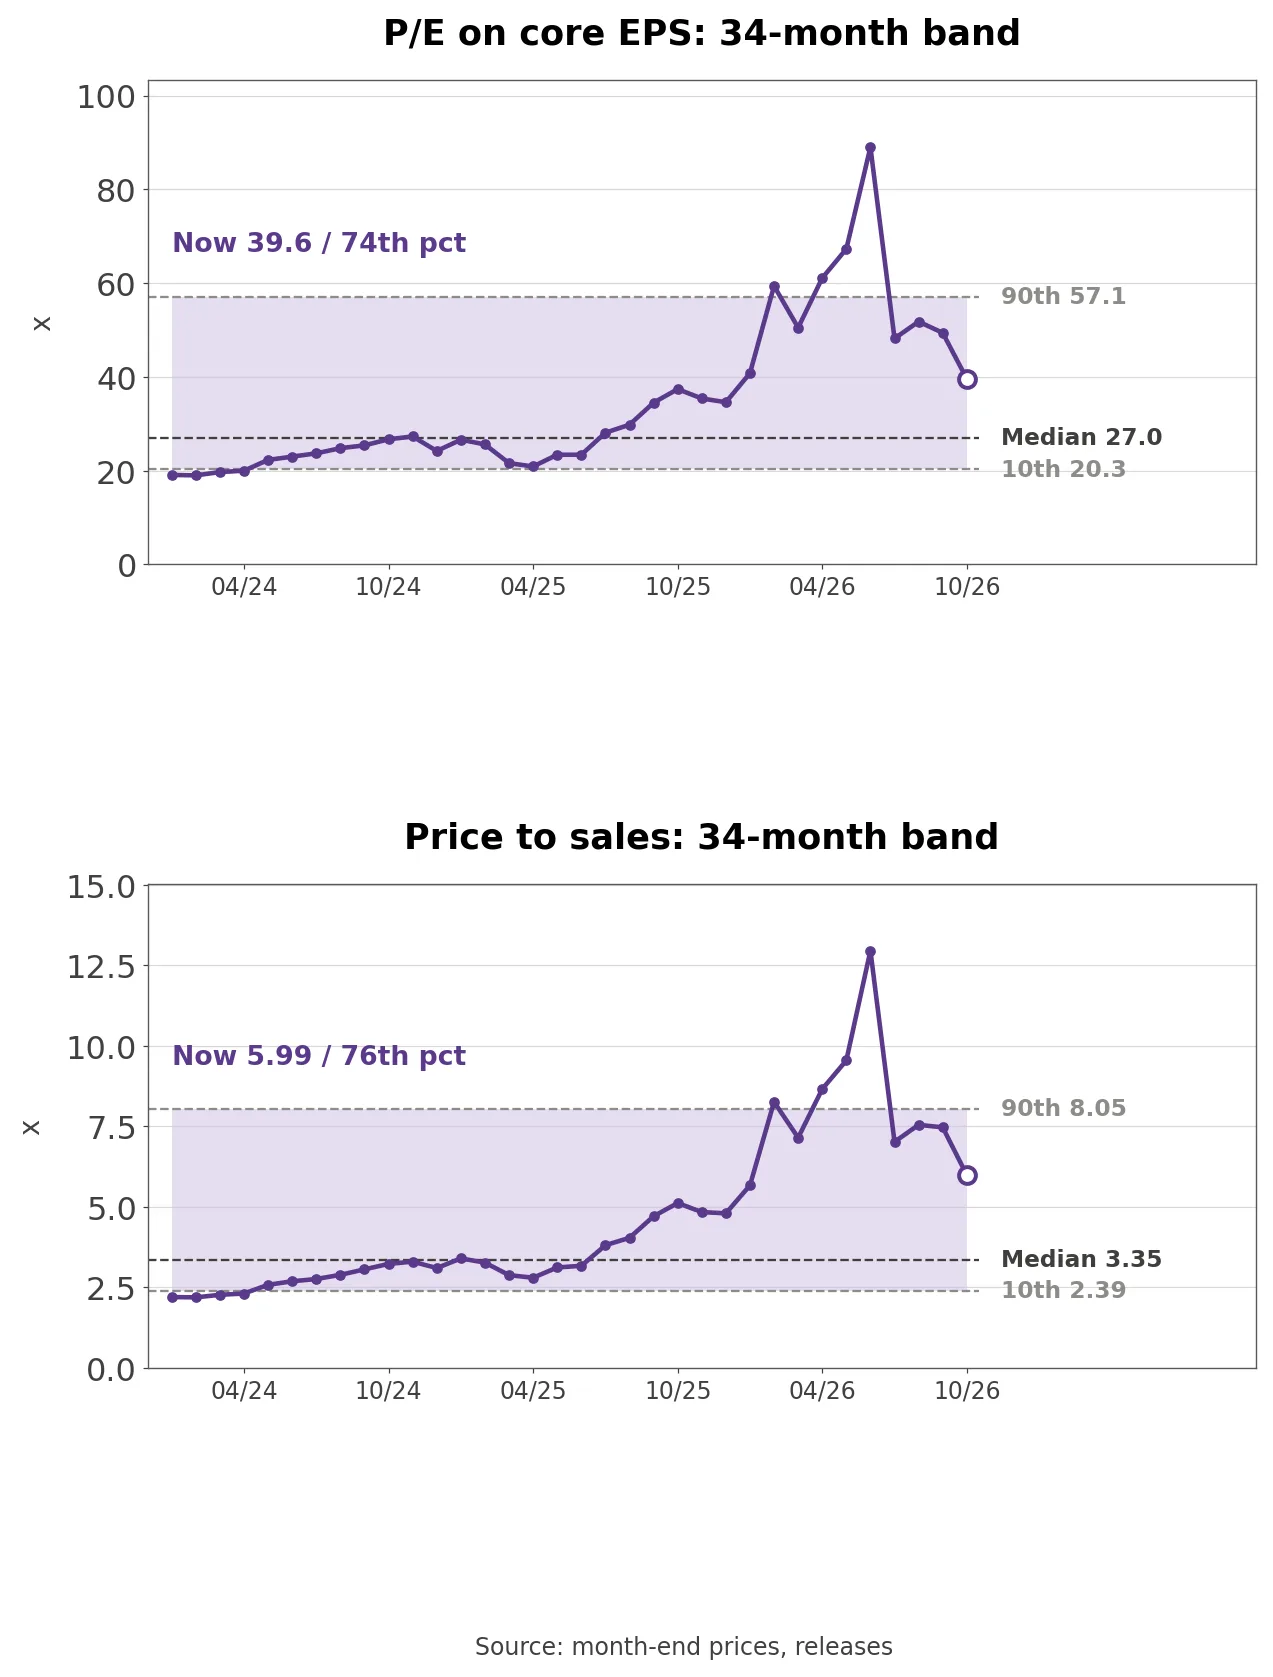
Own calculation (month-end prices and releases): On trailing core EPS of $3.11, the P/E of 39.6 sits at the 73.5th percentile of 34 months (median 27.0), and price to sales of 5.99 sits at the 76.5th percentile (median 3.35).
The P/E peaked at 89.0 in June 2026 and bottomed at 19.0 in February 2024. Since June the stock has more than halved while core EPS kept rising, bringing the P/E down to 39.6, still above the median. On the Q4 guide midpoint of $0.98 annualized to $3.92 the P/E is 31.5, and it only reaches the median if EPS keeps outgrowing sales as Corning says it will.
Three Conditions That Move the Stock
Annualized core sales are the scorecard Corning picked for itself. Getting from a $20.3 billion run rate in Q3 to $40 billion by the end of 2030 takes +17.3% a year for 17 quarters. Q4 core sales above the guide midpoint, a $21.0 billion run rate and 2027 growth at that pace would support the stock; growth under 13.6% a year would put even the high-confidence plan out of reach.
Enterprise optical sales show whether the NVIDIA partnership and hyperscaler agreements turn into volume. More long-term agreements and enterprise sales rising quarter after quarter would support the shares; a slowdown in data center spending that drags enterprise growth toward carrier’s pace would expose a company earning 59.6% of segment profit in one business.
The share count is the last source of funding. Covering roughly $2 billion of 2026 capex and next year’s plant spending from operating cash without ATM sales would support the stock; ATM sales starting, or free cash flow excluding deposits falling behind capex, would weigh on it.
What to Watch in the Q4 Report
The Q4 report, likely in late January, should show whether core sales landed in the $5.2 billion to $5.3 billion range and whether the run rate passed $21.0 billion. Corning guides only one quarter ahead, so the Q1 outlook in the same release will show whether growth near 17% continues. The 10-K that follows should show how much customer deposits and contract liabilities grew, whether any shares went out through the ATM, and how far the display glass price adjustments restored margins in Glass Innovations.
One question stays open. NVIDIA’s deposit and warrant payment pulled Corning’s expansion forward, and in return Corning books the $296 million warrant value as a revenue reduction and has committed volume through 2029. If customers sharing the cost of capacity spreads to other hyperscaler agreements, will Corning’s growth be tied more tightly to a few customers’ spending cycles, or will pre-sold demand make it less cyclical?