Sandisk (NASDAQ: SNDK) reported fiscal first-quarter 2027 revenue of $11.03 billion and GAAP net income of $8.10 billion for the quarter ended October 2, 2026. Revenue was +378% on a year earlier and GAAP gross margin went from 29.8% to 85.0%. Yet the company sold only about 10% more storage capacity measured in exabytes, and cost of revenue barely moved, from $1.621 billion to $1.653 billion. Almost all of the profit came from NAND flash prices, and Sandisk is now trying to lock those prices into long-term contracts.
Sandisk, based in Milpitas, California, is a NAND flash memory company. It sells enterprise SSDs to data centers, embedded flash and SSDs for phones, PCs and cars (its Edge business), and memory cards and portable drives under its own brand (Consumer). Its wafers come from a joint venture with Japan’s Kioxia that splits output roughly in half. Western Digital spun the company off in February 2025, and at $1,150.89 a share it is worth about $163.8 billion on market data.
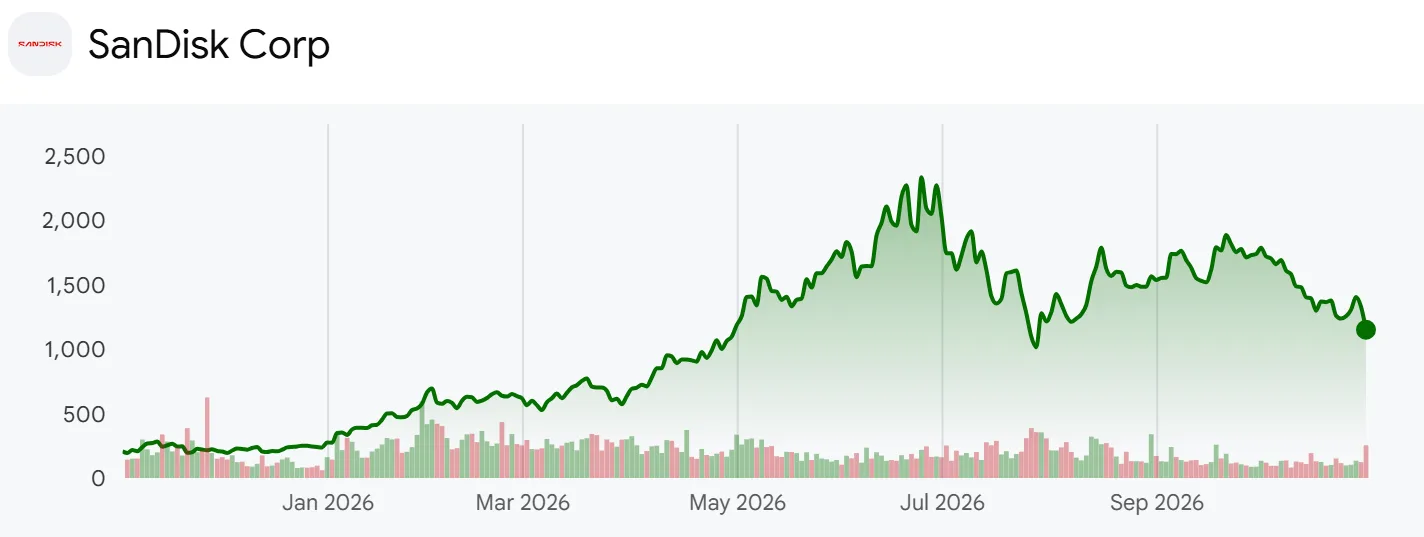
Sandisk one-year share price chart
The question here is how much of an 85% gross margin can survive a price cycle, and whether the long-term agreements Sandisk calls New Business Models (NBMs) and its buybacks answer that question. The analysis lines up the Q1 FY27 earnings release, the Q1 FY27 10-Q, the 25-page Q1 deck on the IR site, all seven earnings releases since the listing and the 8-K on the Nanya Technology stake.
Two caveats apply. Sandisk has announced an 8-for-1 stock split, with split-adjusted trading from November 20, but every per-share figure here is pre-split. The fiscal year starts in early July, and figures run through the quarter ended October 2, 2026.
What the Q1 Deck Says About Price and Volume
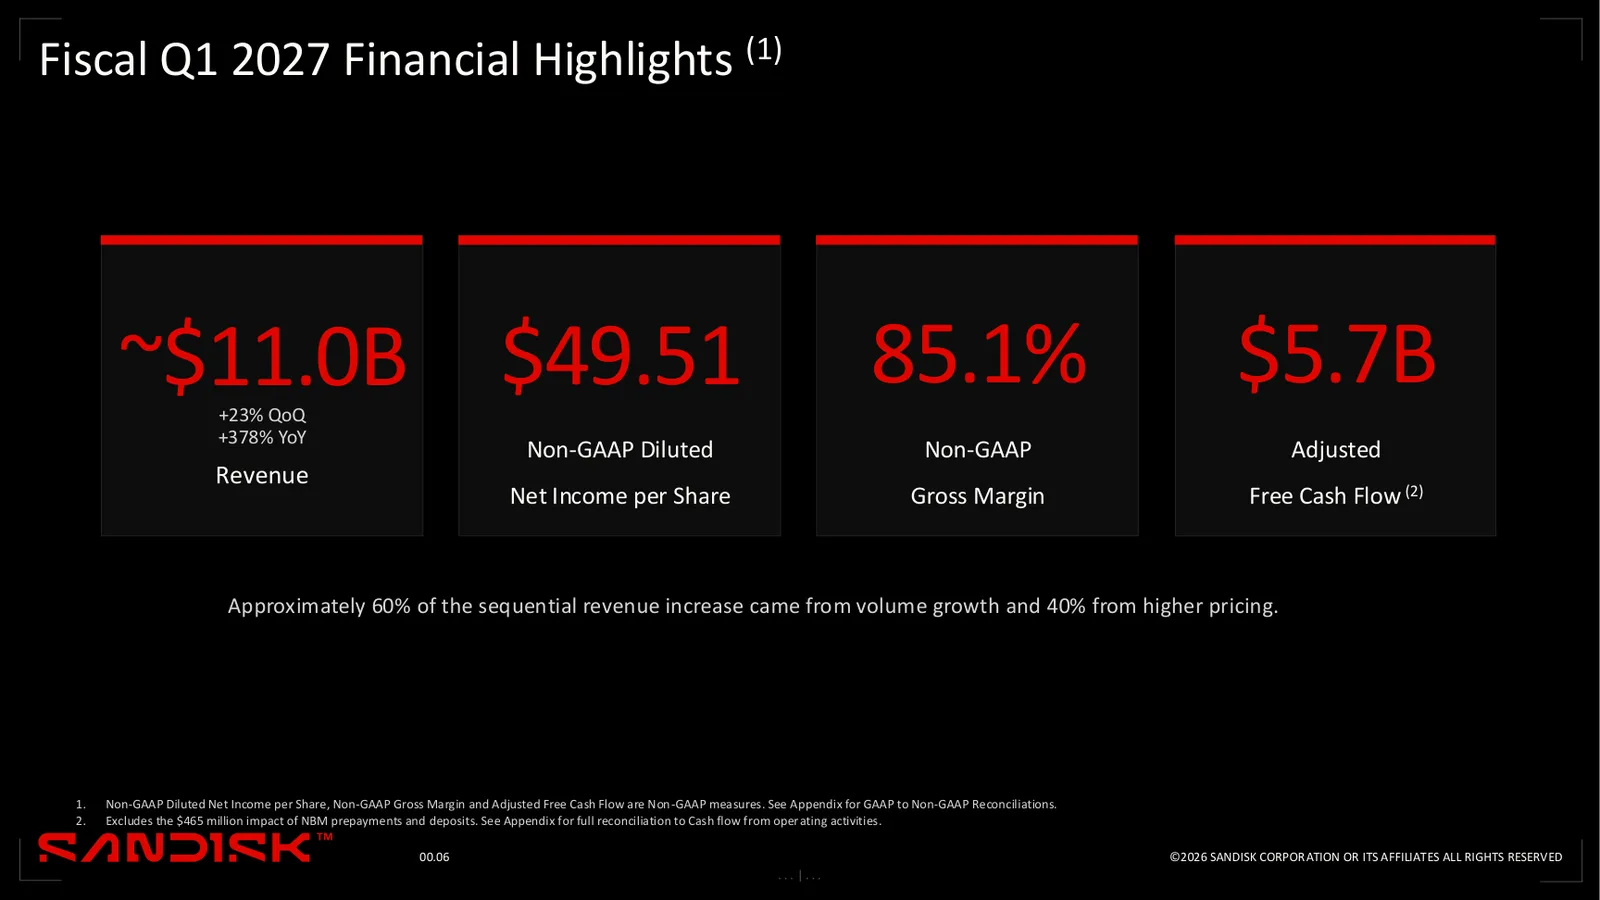
Q1 FY27 deck page 6: revenue and non-GAAP gross margin and adjusted free cash flow
Page 6 of the 25-page deck sums up the quarter with four numbers: about $11.0 billion of revenue, an 85.1% non-GAAP gross margin, $5.7 billion of adjusted free cash flow and $49.51 of non-GAAP diluted EPS. Underneath, it states that “Approximately 60% of the sequential revenue increase came from volume growth and 40% from higher pricing”, and a footnote says adjusted free cash flow excludes $465 million of NBM prepayments and deposits. Chairman and CEO David Goeckeler said in the release: “We have started fiscal year 2027 with another quarter of strong performance, with robust and growing demand for our products driving outpaced growth in our data center business.”
Company disclosure (Q1 FY27 earnings release, October 29, 2026): Sandisk guided Q2 revenue to $12.2 billion to $12.6 billion, non-GAAP gross margin to 84.5% to 85.5% and non-GAAP diluted EPS to $55.00 to $57.00 pre-split. It bought back about 3.2 million shares for $5.0 billion in Q1.
The August guide for Q1 was $10.30 billion to $10.80 billion of revenue and $44.00 to $46.00 of non-GAAP EPS; actual revenue beat the top by $231 million and EPS by 7.6%. Page 16 assumes about 151 million diluted shares for Q2, down from 157 million in Q4 and 154 million in Q1.
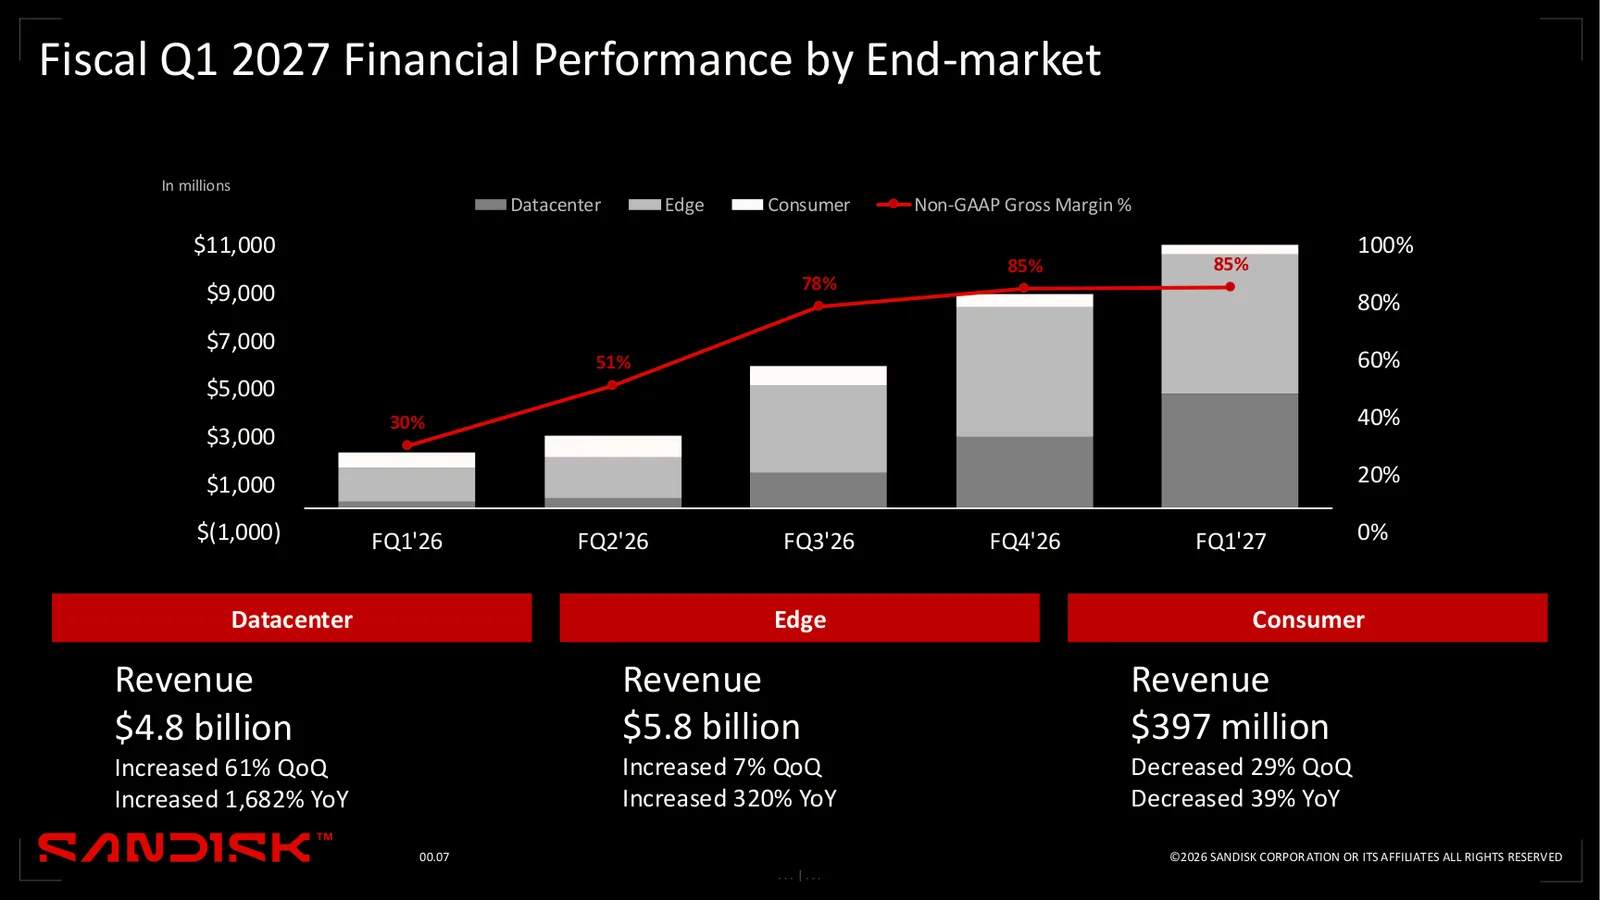
Q1 FY27 deck page 7: revenue by end market and gross margin over five quarters
Page 7 stacks five quarters of revenue by end market. Datacenter revenue was $4.8 billion, +61% sequentially; Edge was $5.8 billion, +7%; Consumer was $397 million, -29%. Page 8 estimates that data centers now take roughly half of industry NAND bits and says Sandisk allocated more supply to that market in Q1, citing relationships with three U.S. hyperscalers.
Checked against the 10-Q, the year-over-year picture is about price. Total products sold rose by almost 10% on an exabyte basis while revenue grew 4.78 times, which puts revenue per gigabyte at roughly 4.34 times a year earlier. Edge sold 20% fewer exabytes but earned more than 450% more per gigabyte, and Consumer sold more than 70% fewer exabytes. Only Datacenter grew both volume (about +330%) and price per gigabyte (about +320%). The deck puts Datacenter’s year-over-year growth at 1,682%, while the 10-Q says 1,685%.
The NBM Contracts and Buybacks in the Deck
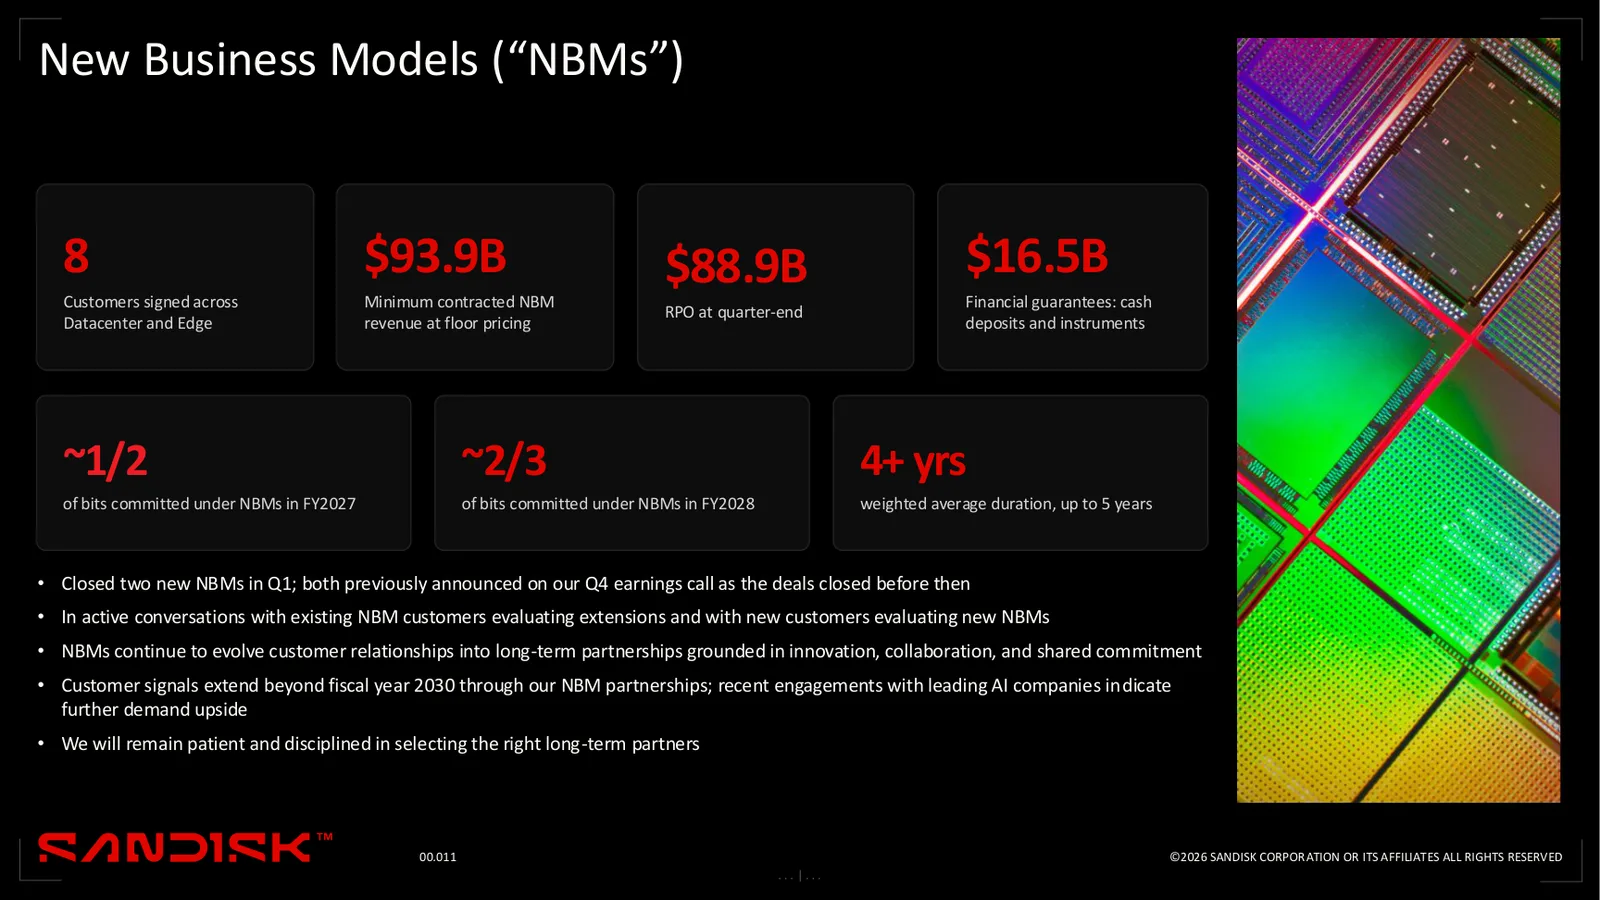
Q1 FY27 deck page 11: NBM customers and minimum contracted revenue and guarantees
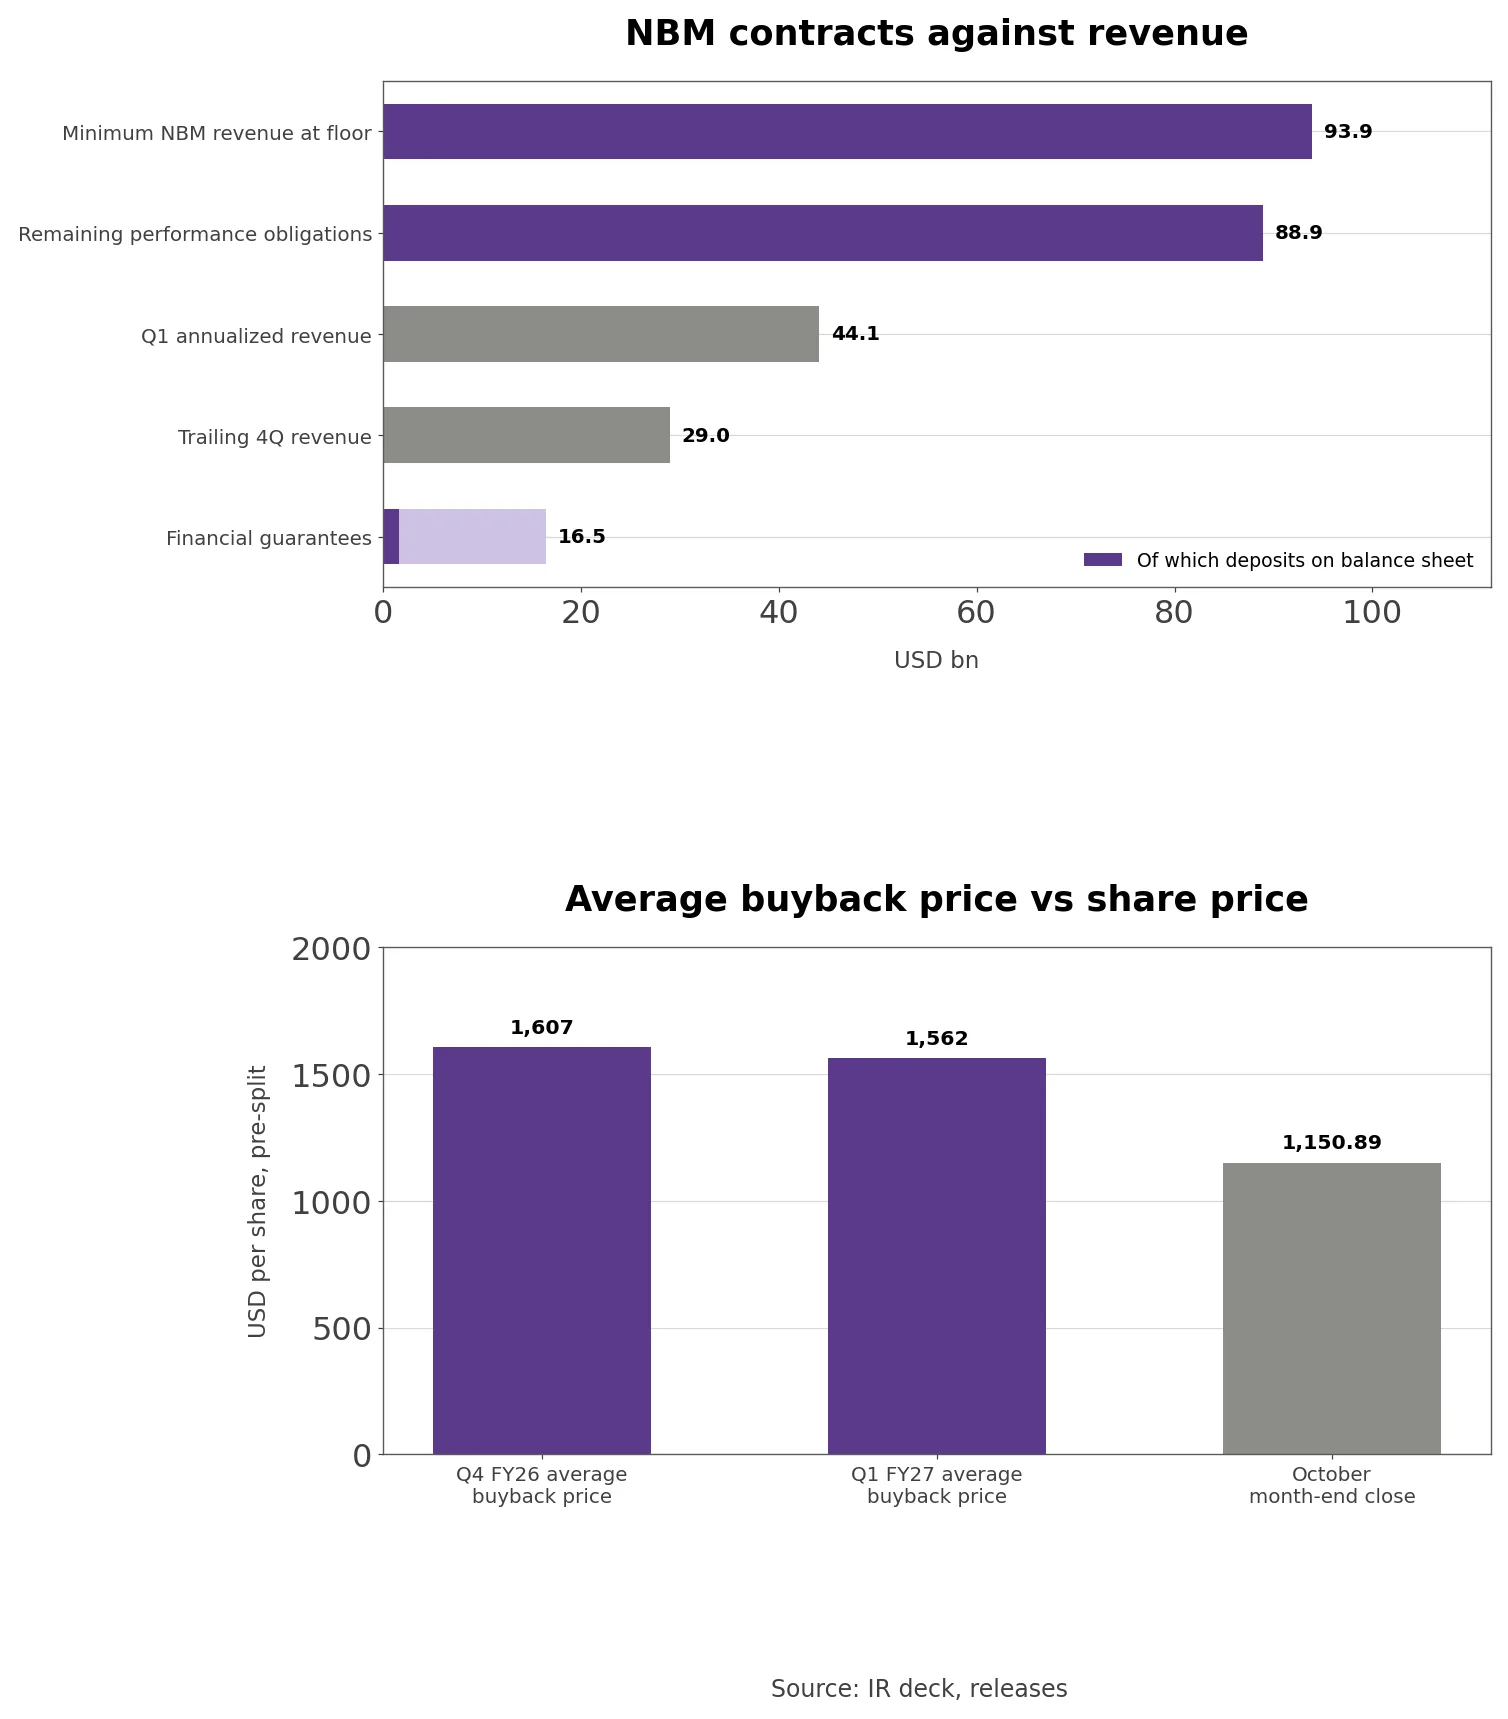
Page 11 quantifies the NBMs: eight customers across Datacenter and Edge, $93.9 billion of minimum contracted revenue at floor pricing, $88.9 billion of remaining performance obligations (RPO) and $16.5 billion of financial guarantees in cash deposits and instruments. About half of FY2027 bits and about two-thirds of FY2028 bits are committed, with a weighted average duration of more than four years and up to five. The page adds: “We will remain patient and disciplined in selecting the right long-term partners”. Page 13 expects data centers to exceed 55% of the NAND market in 2027 and says the “NBM pipeline exceeds our supply through the end of the decade”.
Own calculation (deck page 11 and seven releases): RPO of $88.9 billion is 3.07 times trailing four-quarter revenue of $28.97 billion. Dividing $93.9 billion of floor-price revenue evenly over four years gives about $23.5 billion a year, 53.2% of Q1 revenue annualized at $44.1 billion.
Checked against the 10-Q, most of the $16.5 billion is not on the balance sheet. Security deposits that must be refunded at the end of the contract sit in refund liabilities of $1.597 billion, and prepayments sit in contract liabilities of $1.529 billion. The 10-Q says “NBMs may include terms requiring the customer to establish and maintain collateral with third-party financial institutions”, which Sandisk can draw only on a customer default, so the remaining $14.9 billion appears to be that collateral. The filing also says “As NBMs are expected to become our predominant way of doing business”, the model should make revenue more predictable. The eight customers came from five agreements disclosed in April and five more by August, and the two NBMs page 11 says closed in Q1 were already announced in August.
Q1 FY27 deck page 12: buybacks over two quarters and remaining authorization
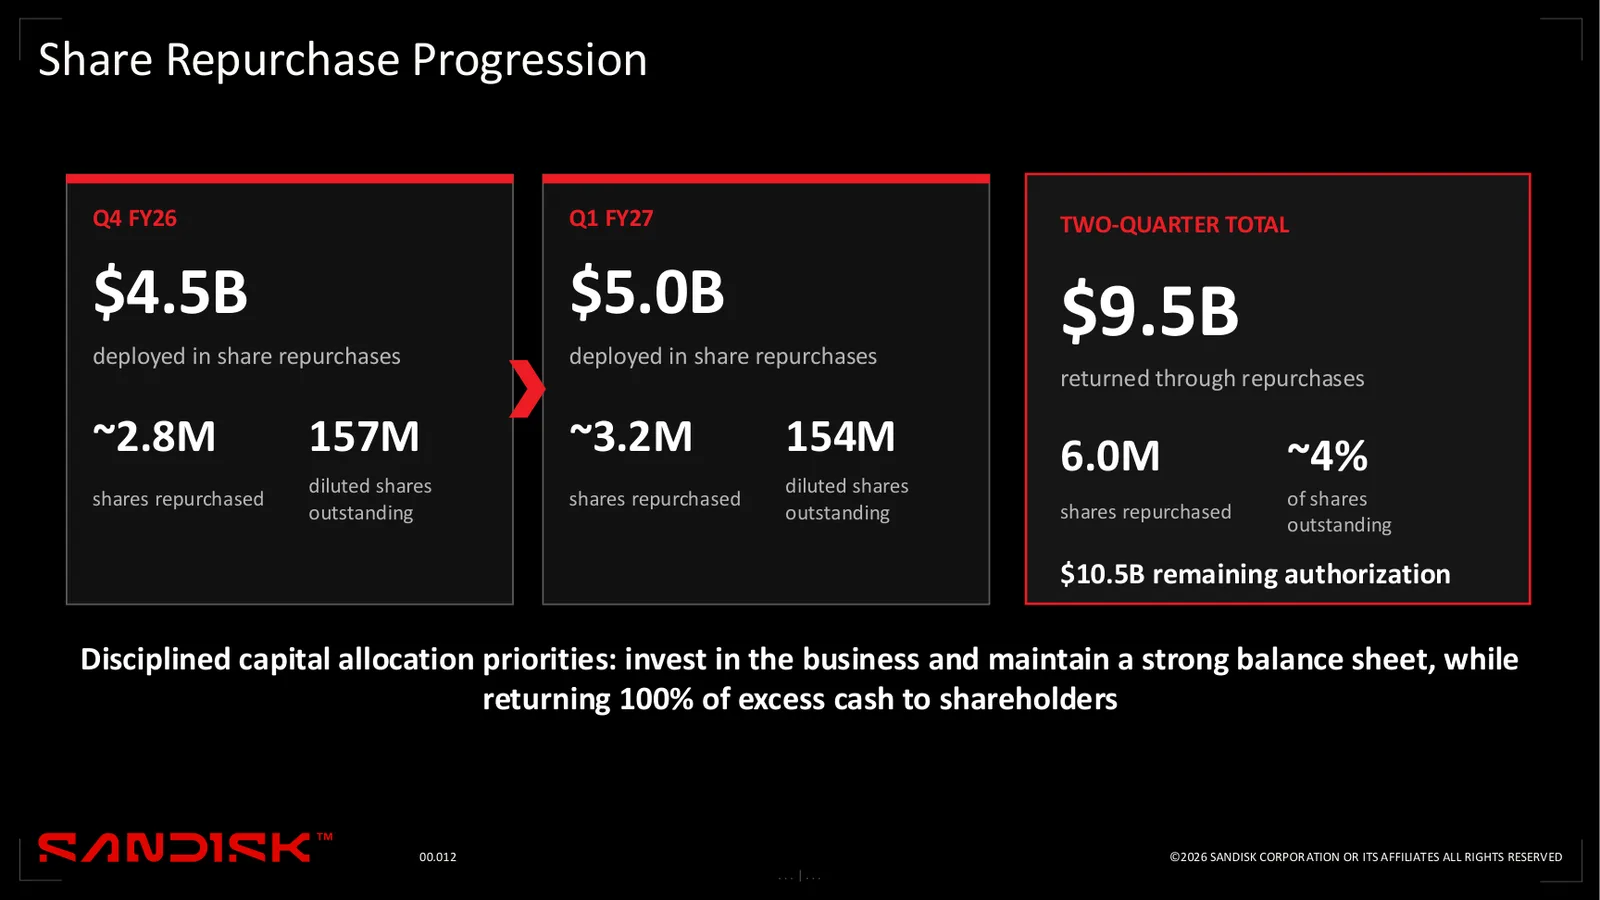
Page 12 covers buybacks: $4.5 billion for about 2.8 million shares in Q4 and $5.0 billion for about 3.2 million in Q1, $9.5 billion and about 4% of shares over two quarters, with $10.5 billion of authorization left after the board added $14 billion in August. The stated policy is to keep investing and a strong balance sheet while “returning 100% of excess cash to shareholders”. The implied average prices are about $1,607 and $1,562 a share, both above the $1,150.89 October month-end close.
The Bull and Bear Case for Sandisk Stock
The bull case is contracts and cash. Floor-price revenue of $93.9 billion and $16.5 billion of guarantees put a base under prices, cash capital spending is 1.8% of revenue, and the forward P/E is 4.73.
The bear case is price dependence. Volume grew by about a tenth in a year while gross margin rose 55 points, buybacks ran above the October close, and price to sales fell from 25.54 to 5.65 in four months.
From Flash Pioneer to Spin-Off
Sandisk month-end share price with four dates
Sandisk was founded in 1988 and built the market for flash memory cards before Western Digital bought it in 2016. On February 21, 2025, Western Digital distributed 80.1% of the shares (116.0 million) to its stockholders and Sandisk became independent again.
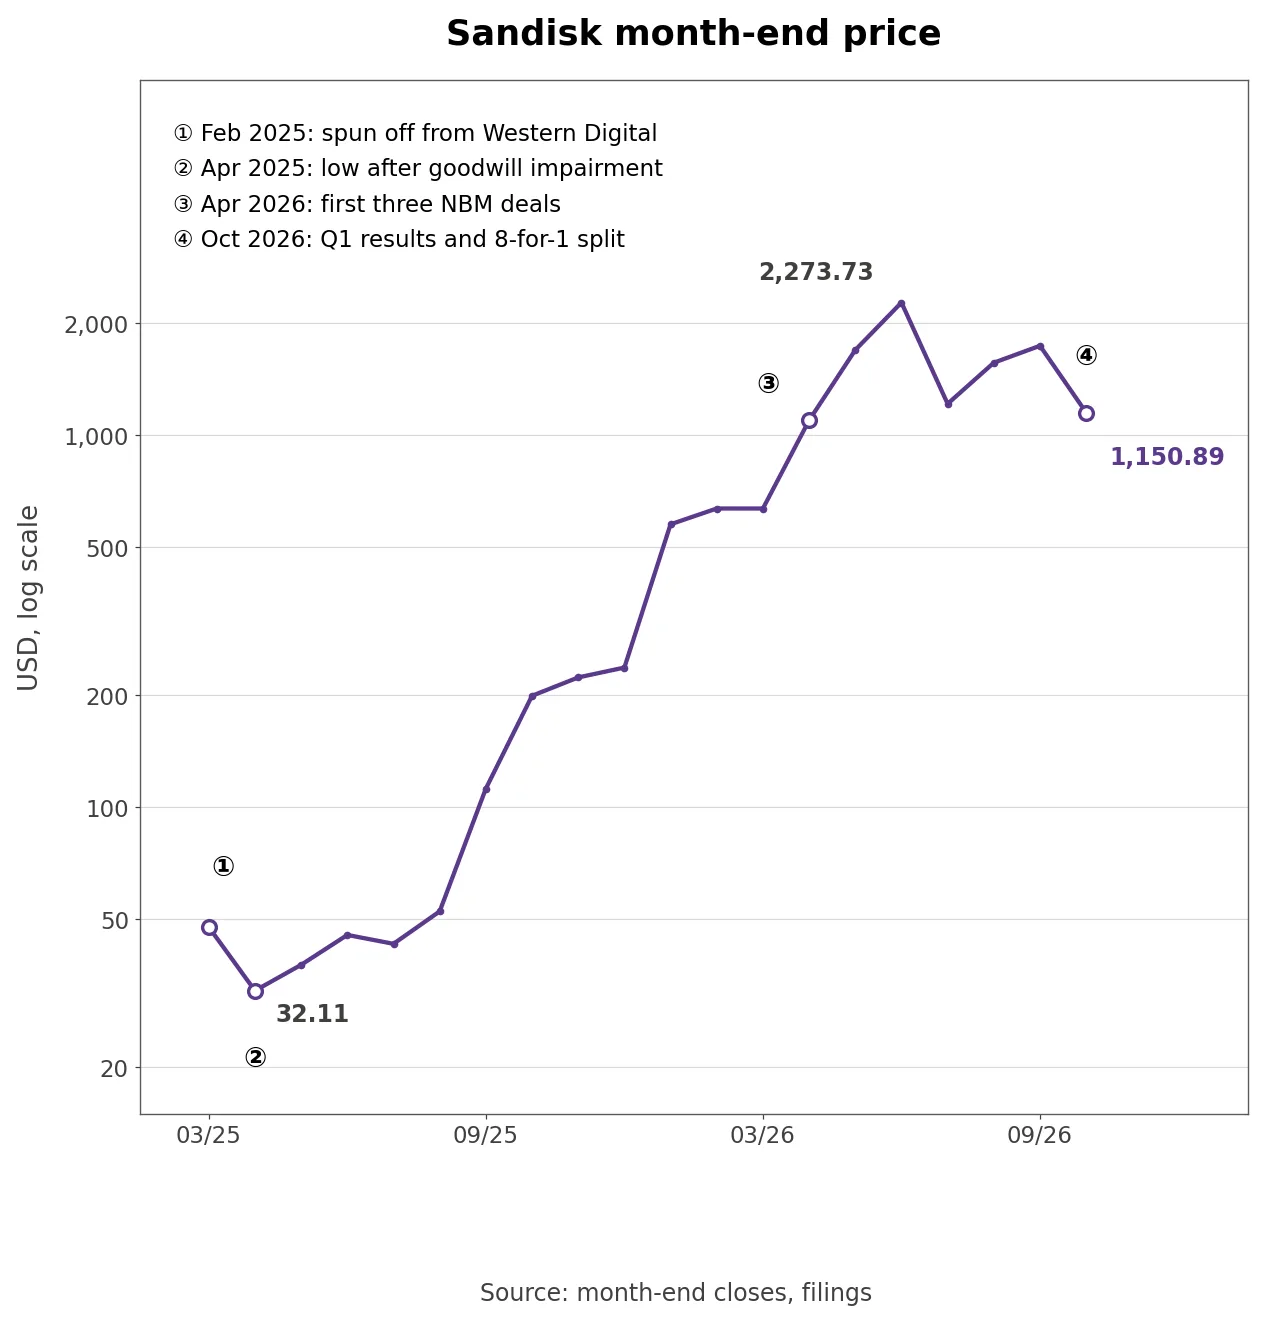
The spin-off landed at the end of a NAND downturn. The March 2025 quarter carried a $1.83 billion goodwill impairment and a $1.93 billion net loss, and the April 2025 month-end close of $32.11 is the low since listing. As gross margin jumped to 50.9% in the quarter to January 2026, the stock closed September 2025 at $112.20 and January 2026 at $576.25. The April 2026 results disclosed the first three NBM agreements, the month closed at $1,096.51, and June’s $2,273.73 was the peak, 70.8 times the low.
July closed at $1,214.83, -46.6%, and after the Q1 report and the split announcement October closed at $1,150.89, -33.9% on September. In May an investment firm made a mini-tender offer for up to 100,000 shares at $1,150.00, which Sandisk told holders not to accept. Five months later the market price sat 89 cents above that offer.
Why Did Revenue Grow 4.8x on Flat Costs?
Sandisk quarterly revenue against cost of revenue and GAAP gross margin
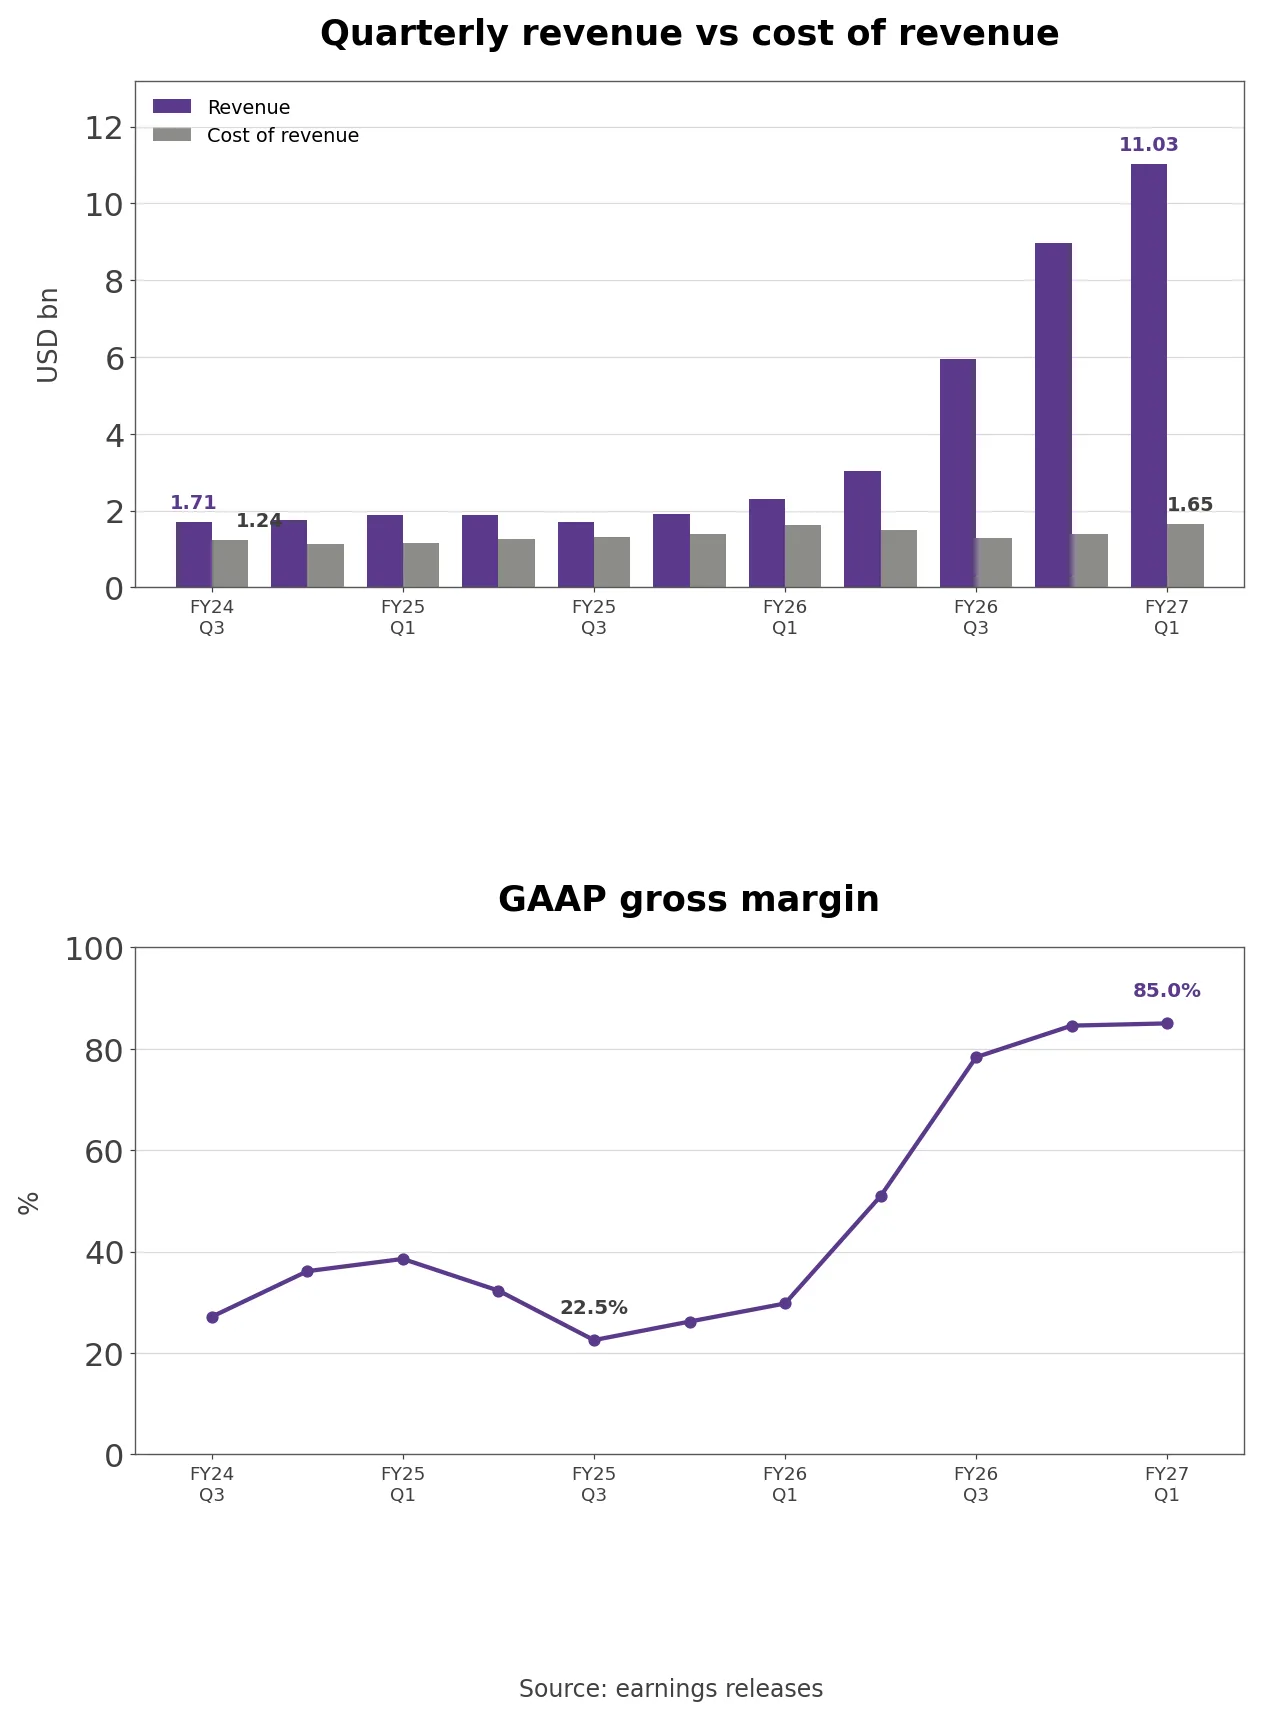
Across 11 quarters from March 2024 to October 2026, quarterly cost of revenue stayed between $1.124 billion and $1.653 billion while revenue rose from $1.705 billion to $11.031 billion, 6.47 times.
Own calculation (seven earnings releases): Of the $8.723 billion increase in revenue over the year, $8.691 billion (99.6%) went straight into gross profit. Gross margin bottomed at 22.5% in the March 2025 quarter and peaked at 85.0% in Q1 FY27.
The climb was steep: 29.8% in the October 2025 quarter, 50.9% the next, 78.4% in April 2026 and 84.6% in July, 54.8 points in three quarters, while cost of revenue swung only $365 million. Operating expenses of $598 million were 5.4% of revenue and the operating margin was 79.6%. Pre-tax income of $9.319 billion included a $513 million gain on the Nanya Technology stake, which Sandisk bought in March 2026 (3.9% for about $1.0 billion) and which is now worth $2.289 billion; non-GAAP earnings exclude that gain.
The Cash Behind the NBMs and Buybacks
Operating cash flow of $6.363 billion was 78.5% of net income, mostly because receivables rose $1.877 billion. Two customers each accounted for 12% of revenue.
Sandisk NBM contract size against revenue and average buyback prices
Sandisk keeps NBM prepayments and deposits out of adjusted free cash flow, which treats customer money it may have to repay or deliver against as something other than earned cash. The cash flow statement shows contract liabilities up $287 million and refund liabilities up $97 million, $384 million in total, or $81 million less than the $465 million the deck excludes. Of $6.3 billion of operating cash, $5.0 billion went to buybacks and $755 million to taxes on vested employee stock. Cash ended at $5.136 billion with no borrowings, and a $1.5 billion revolver was amended in September.
Own calculation (deck page 12 and month-end prices): $9.5 billion over 6.0 million shares is an average of about $1,583, and the October close of $1,150.89 sits 27.3% below it.
Cover-page shares fell from 148.09 million in late April to 142.29 million in late October, 5.8 million fewer, so nearly all of the 6.0 million repurchased shares reduced the count.
Q1 revenue split 43.5% Datacenter, 52.9% Edge and 3.6% Consumer, against 11.7% Datacenter a year earlier, and Asia took 65.4%. Datacenter sells enterprise SSDs from performance drives to high-capacity QLC platforms. Page 4 ties demand to AI inference: “Each generated token must reference the context that precedes it”, so the KV cache grows, and flash holds broad context more cheaply than HBM and DRAM. Sandisk cites about 3 times the token throughput and about 75% less energy for systems using SSDs, and expects KV cache to be about a third of the AI data center flash market by the end of the decade.
Edge covers phones, PCs, tablets and cars; page 9 says premium and mainstream held up while the low end contracted, with strong growth from automotive and IoT customers. Consumer sells cards, USB drives and portable SSDs under the Sandisk brand, and page 10 says its revenue fell “as the market adjusts to higher pricing”.
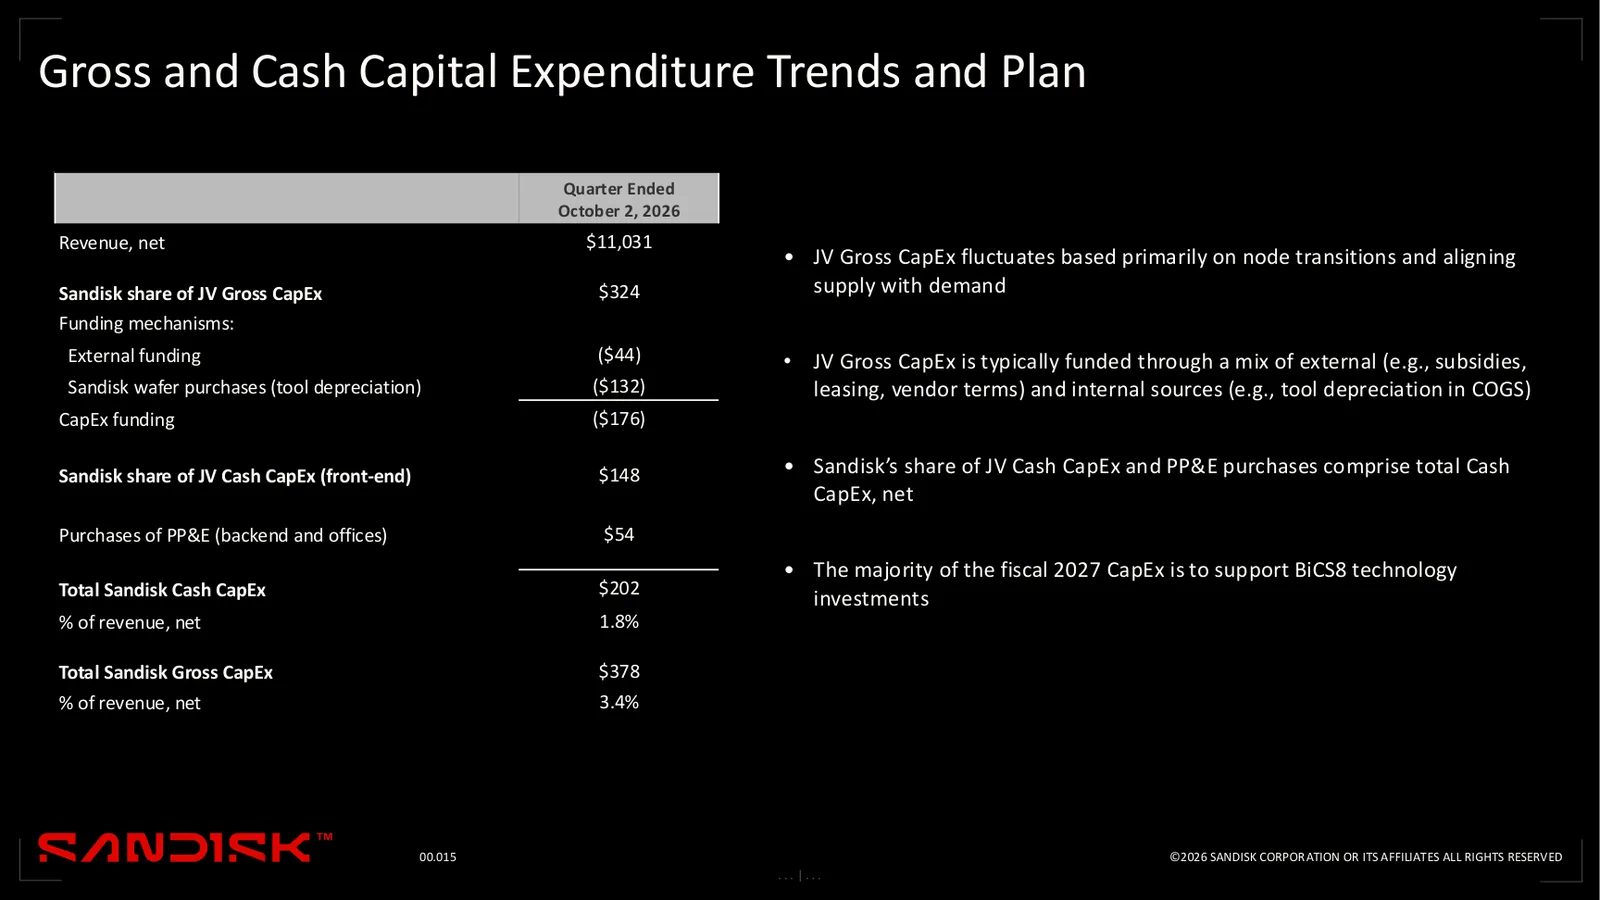
Manufacturing runs through Flash Ventures, the joint venture with Kioxia, which supplies about 50% of its output to Sandisk. Page 18 says Sandisk “Purchases Flash Ventures’ wafers at cost plus a small markup” and pays half of the venture’s costs, including depreciation and leases. Wafer costs are set by the venture’s costs, not by NAND market prices, which is why cost of revenue stayed flat while prices quadrupled, and why those costs will stay when prices fall. Page 15 shows $324 million of gross capex for Sandisk’s share of the venture but only $202 million of cash capex, 1.8% of revenue, of which $148 million was front-end and $54 million back-end assembly, test and offices. The 10-Q puts the maximum loss exposure to the venture at $2.944 billion.
BiCS8 is the core node, BiCS10 will add a 1Tb TLC die and a 2Tb QLC die, and Sandisk taped out its first high-bandwidth flash (HBF) die in Q1, with first product samples planned for next year.
Sandisk vs Micron Western Digital and Seagate
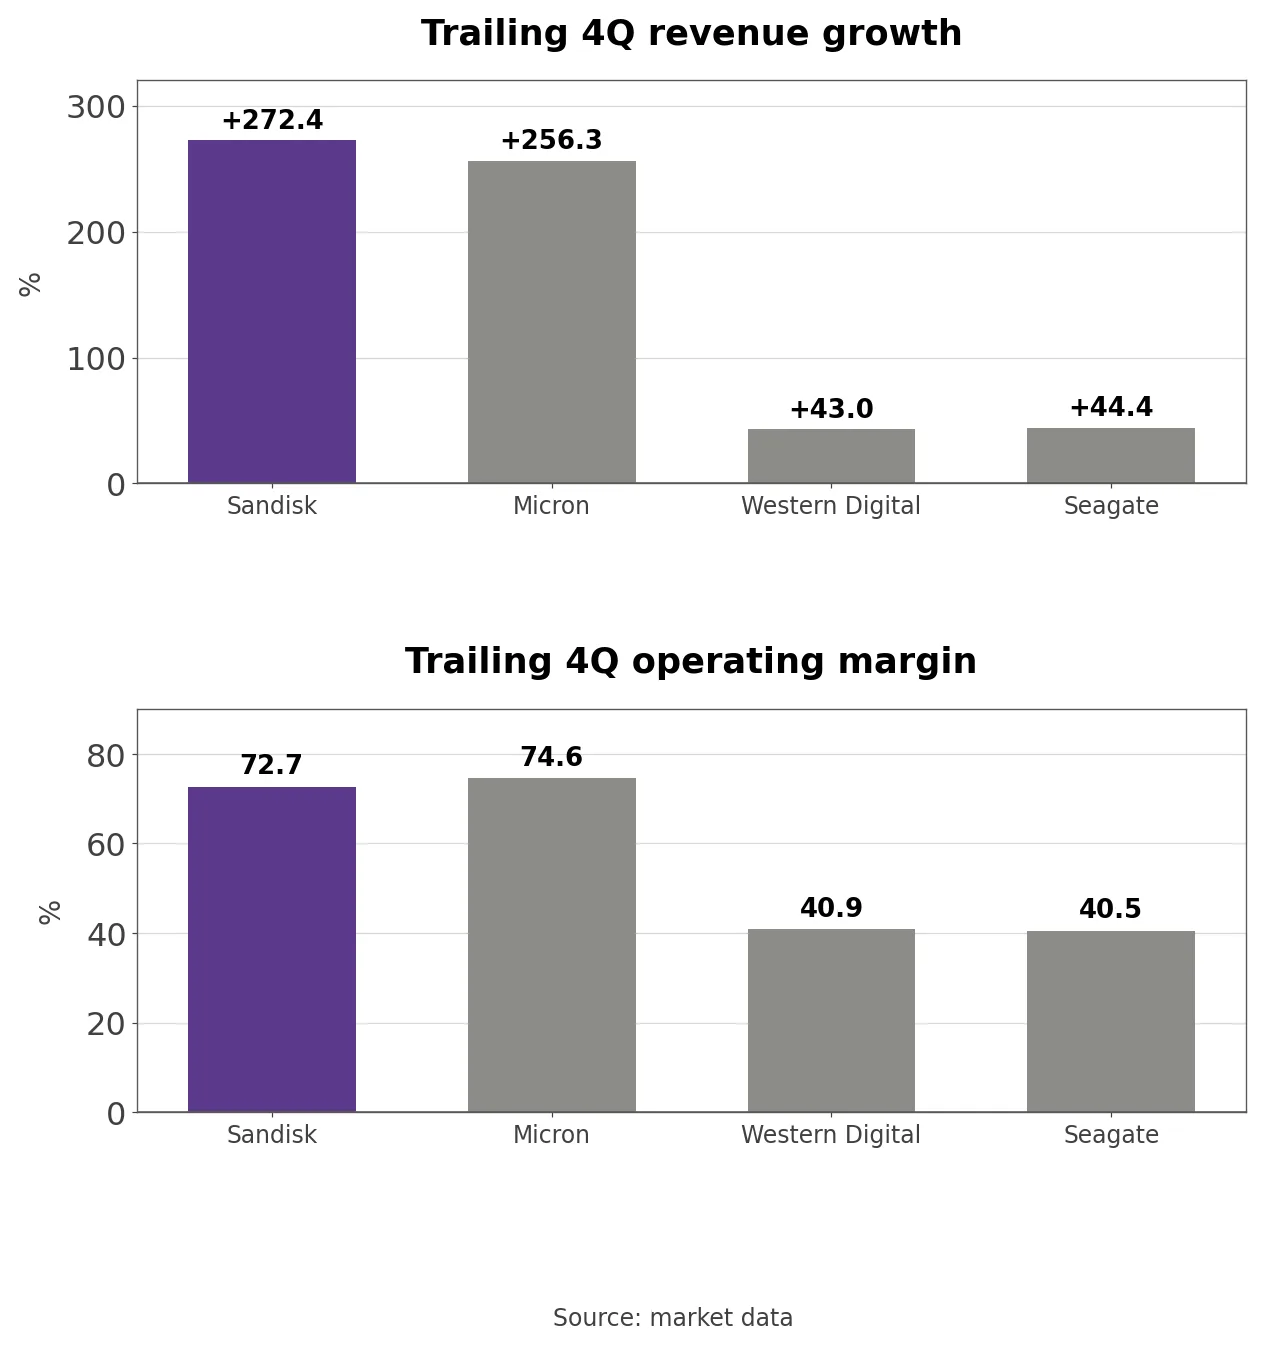
Revenue growth and operating margin at Sandisk Micron Western Digital and Seagate
The peers rely on the same storage and memory demand. Micron makes DRAM, including HBM, as well as NAND; Western Digital and Seagate make data center hard drives, and Western Digital is Sandisk’s former parent. On market data, trailing-twelve-month (TTM) revenue growth was +272.4% at Sandisk, +256.3% at Micron (through the September 3 quarter), +43.0% at Western Digital and +44.4% at Seagate.
Operating margins split the same way: 74.6% at Micron, 72.7% at Sandisk, 40.9% at Western Digital and 40.5% at Seagate. When memory prices rise, memory costs do not follow, so the two memory makers earn close to twice the hard drive makers’ margin.
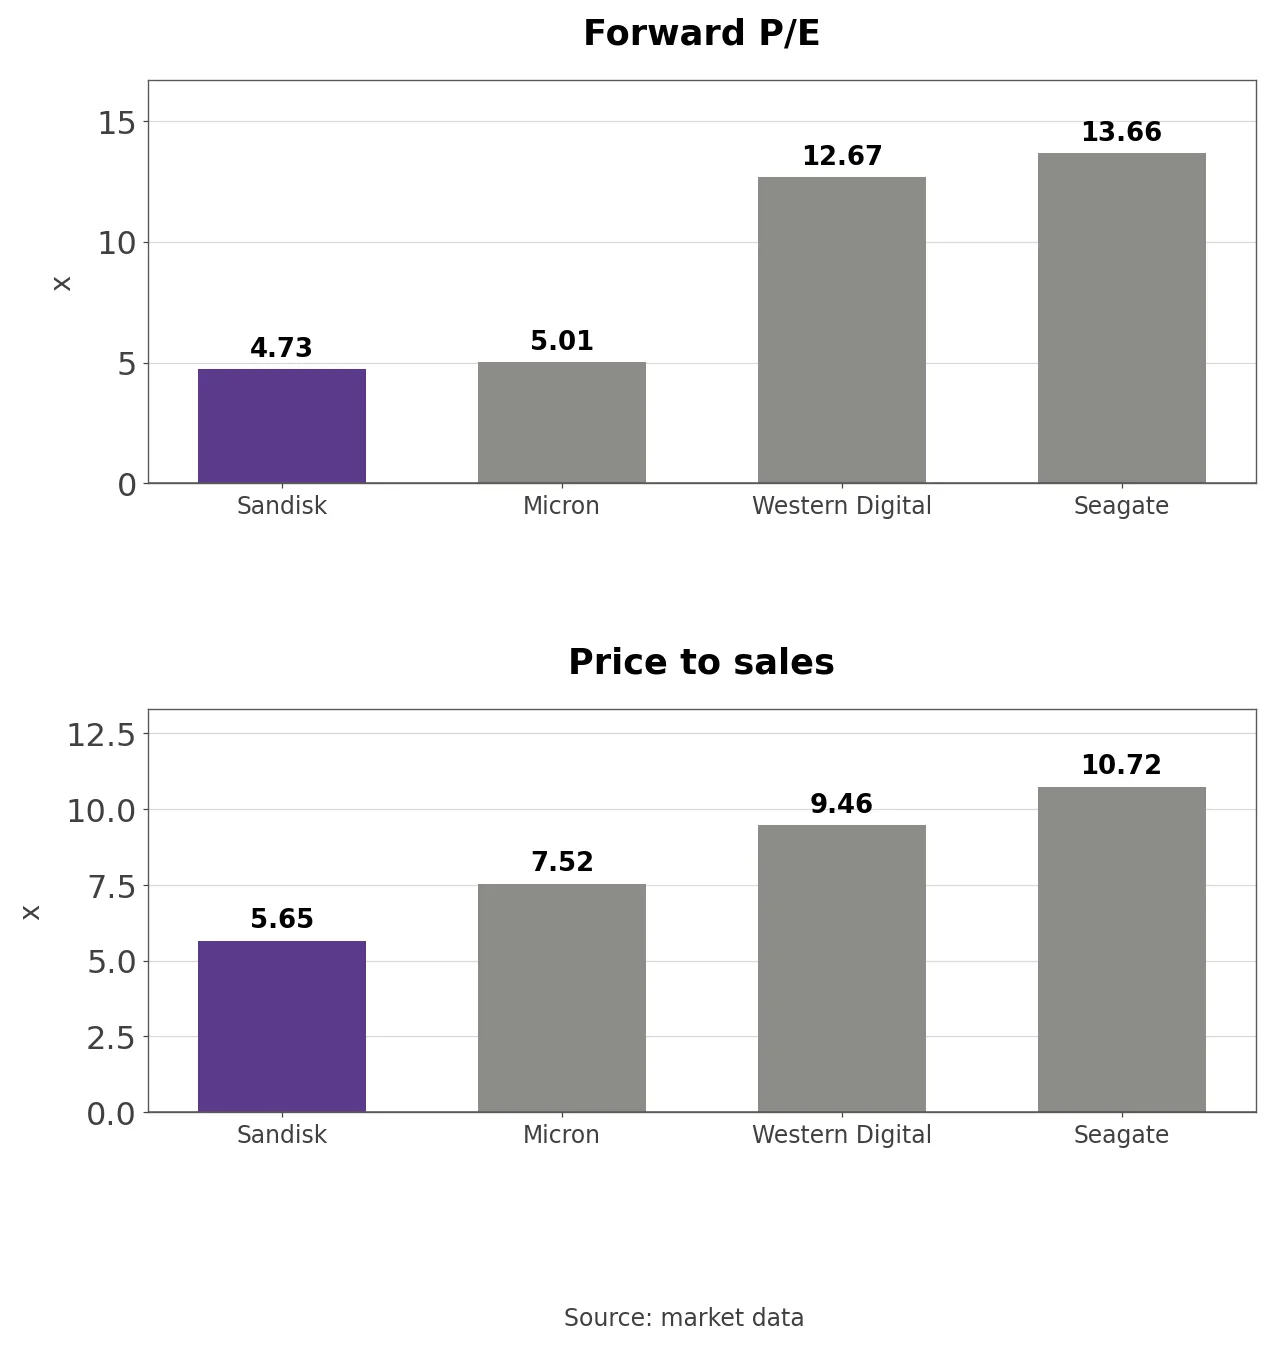
Forward P/E and price to sales at Sandisk Micron Western Digital and Seagate
Multiples run the other way. Forward P/E is 4.73 at Sandisk, 5.01 at Micron, 12.67 at Western Digital and 13.66 at Seagate, and Sandisk’s price to sales of 5.65 is the lowest of the four. The market pays less than half the hard drive multiple for memory earnings, which builds in an assumption that these profits will not last. Micron is worth $1.00 trillion, 6.1 times Sandisk, and Sandisk’s one-year market value change of +446.9% is the largest of the group.
The Price-to-Sales and Price-to-Book Band
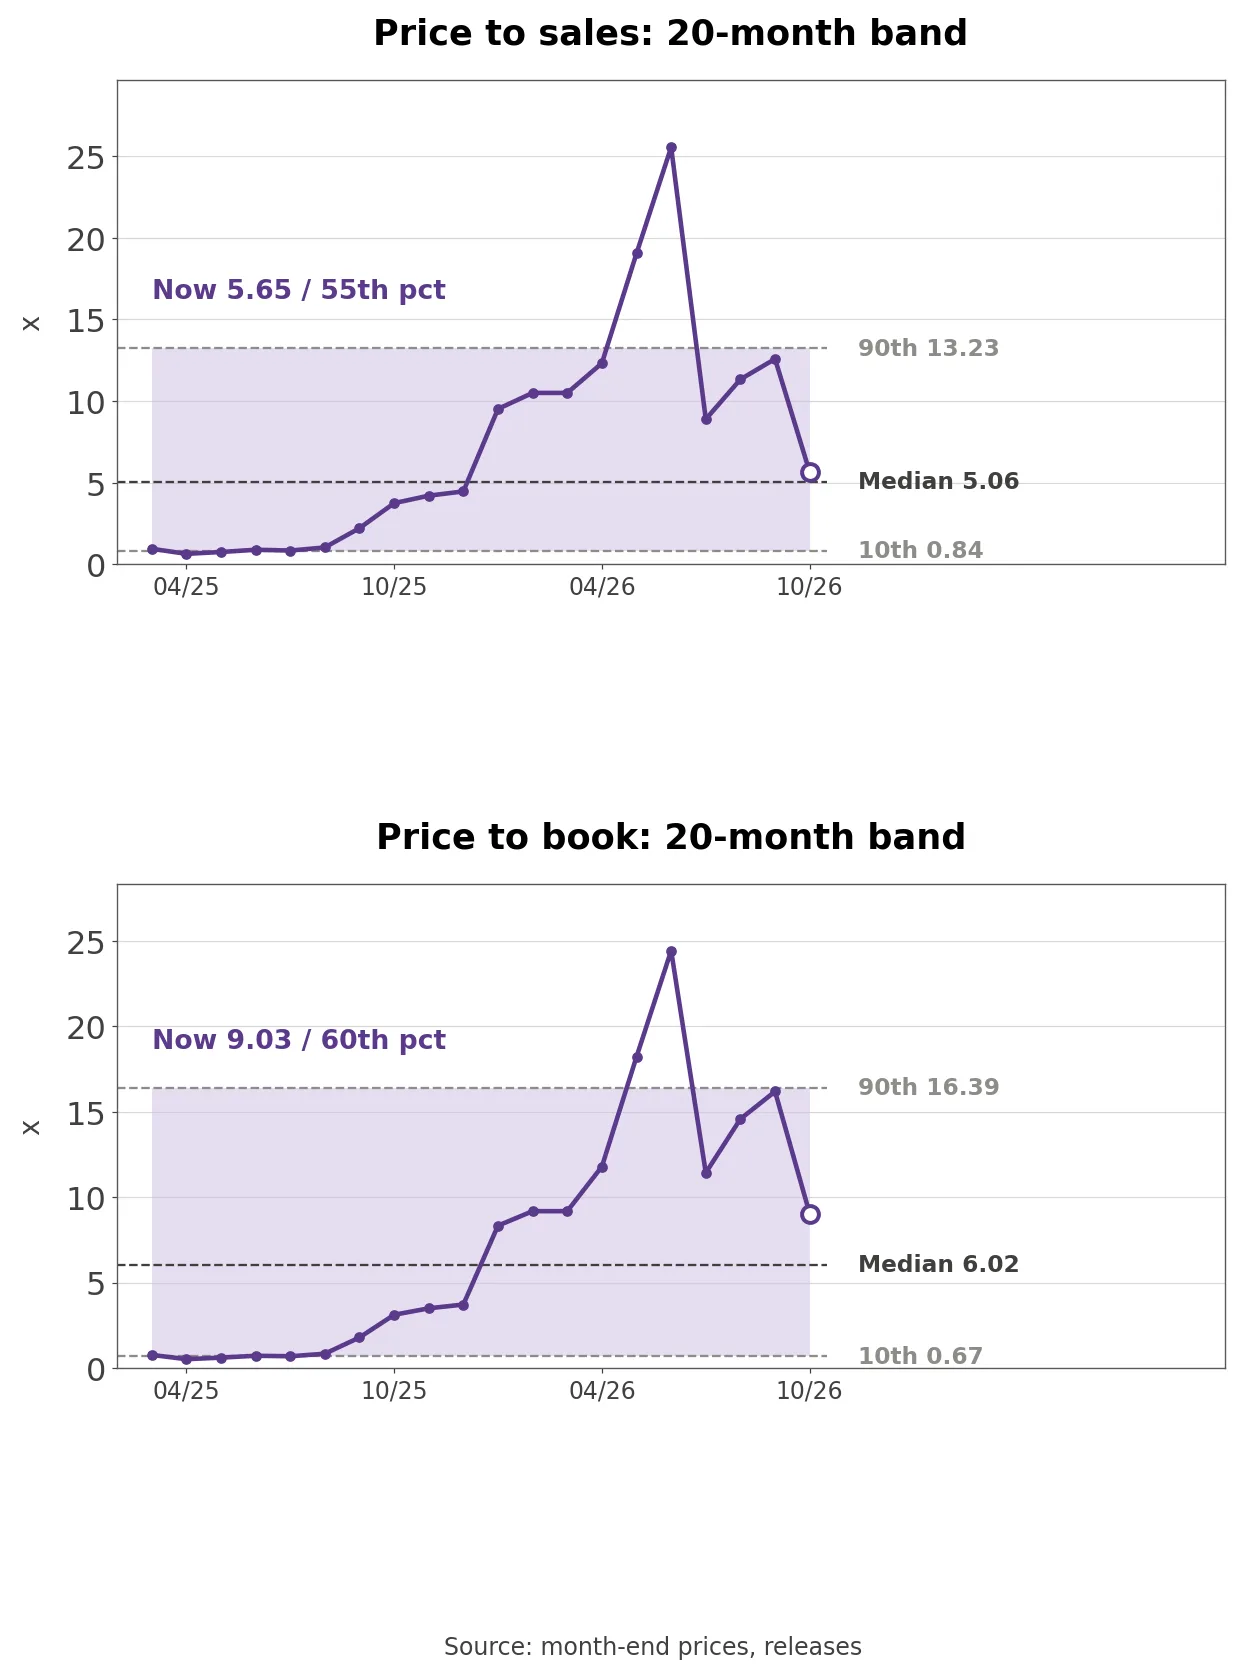
Sandisk price to sales and price to book over 20 months
The band covers the 20 months since the listing, March 2025 to October 2026. Trailing four-quarter net income turned positive only with the April 2026 quarter, which leaves seven months of P/E, so the band uses price to sales and price to book.
Own calculation (month-end prices, releases and the 10-Q): Price to sales of 5.65 sits at the 55.0th percentile of 20 months (median 5.06, high 25.54 in June 2026), and price to book of 9.03 sits at the 60.0th percentile (median 6.02).
The seven months of P/E went from 36.03 in April 2026 to 74.71 in June and 8.43 in October, as trailing net income grew from $4.5 billion to $19.4 billion. On the Q2 guide midpoint of $56 annualized to $224, the P/E is 5.14. In April 2025 price to book was 0.51.
Three Conditions That Move the Stock
Revenue per gigabyte drives most of the profit. Prices holding at the Q2 guide (revenue of $12.2 billion to $12.6 billion and gross margin of 84.5% to 85.5%) with rising data center volume would support the stock; a price break from Chinese capacity or slower demand would hurt it, and the first sign would be gross margin slipping under the 84.5% low end of the guide.
The NBMs are the floor under prices. New agreements or extensions that lift floor revenue and the $16.5 billion of guarantees would support the shares; customers trimming committed volume or renegotiating guarantees would weigh on them.
The share count is the scorecard for buybacks. Using the $10.5 billion left to keep shrinking the count at prices below the average paid so far would support the stock; pausing buybacks in a downturn or renewed dilution from stock compensation would hurt it.
What to Watch in the Q2 Report
The Q2 report, likely in late January, should show whether revenue landed in the $12.2 billion to $12.6 billion range, and the 10-Q will give the exabyte and revenue-per-gigabyte changes. It should also show whether refund and contract liabilities grew with new NBMs and at what prices Sandisk bought back stock. Holders of record on November 9 receive seven extra shares on November 19, so Q2 per-share figures will be one-eighth of the pre-split figures used here.
One question stays open. Spreading floor-price contract revenue evenly over four years gives a little more than half of Q1 revenue annualized. When NAND prices fall again, how much of the 85% gross margin of Q1 will the NBMs actually protect?