ExxonMobil Holdings (NYSE: XOM) reported third-quarter 2026 adjusted earnings of $17.505 billion, up $2.825 billion, or +19.2%, from the second quarter. Nine-month adjusted earnings reached $40.957 billion, $18.5 billion more than a year earlier, and the company’s own bridge on page 6 of the Q3 deck assigns $22.68 billion of that change to prices and margins. Prices and margins explain 122.6% of the gain, while the volume growth and cost savings ExxonMobil built were absorbed by Middle East outages, base volume declines and higher expenses.
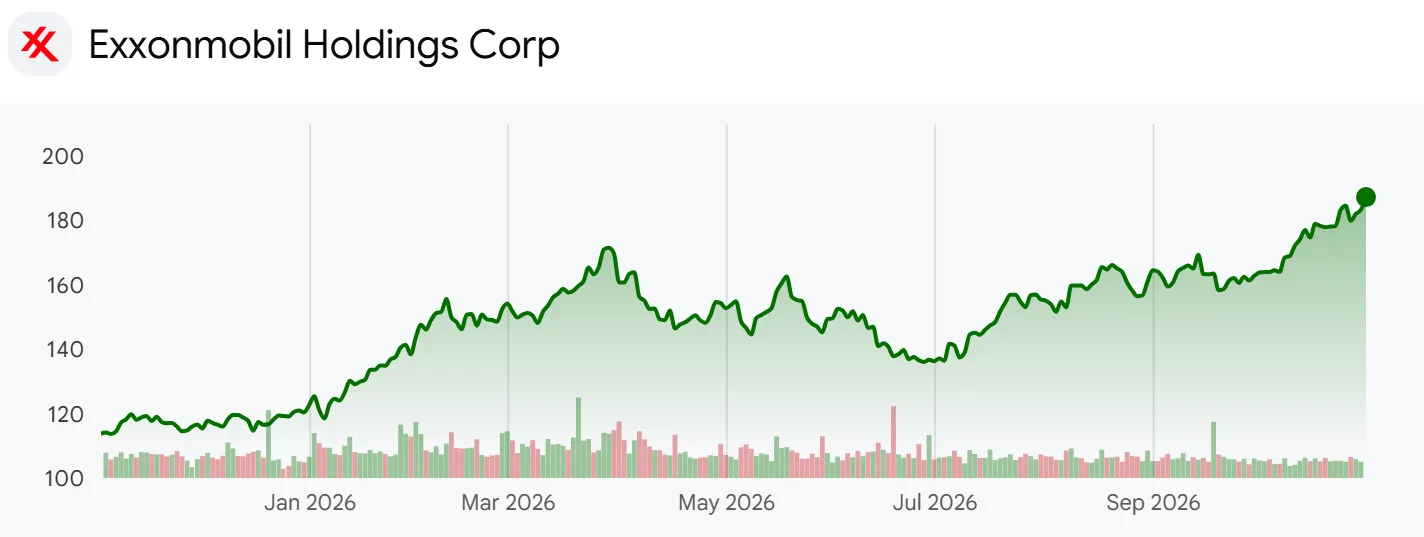
ExxonMobil one-year share price chart
ExxonMobil is the largest US integrated oil company. It produces oil and gas in its Upstream segment and turns crude into fuels, chemicals and lubricants in three segments it calls Energy Products, Chemical Products and Specialty Products. On July 1, 2026 it completed a redomiciliation that made the New Jersey company a subsidiary of ExxonMobil Holdings Corporation, a Texas company, so its filings now come from a new SEC registrant. At the October month-end close of $187.25 the company is worth $763.79 billion on market data, and third-quarter GAAP net income was $15.413 billion.
The question is how much of that earnings power survives once prices and margins are set aside. ExxonMobil makes the test unusually easy: two to four weeks before every earnings release it files an 8-K estimating how market and planned factors will move results against the prior quarter. The analysis lines up the Q3 2026 earnings release, the Q3 2026 market and planned impacts 8-K, the 43-page Q3 deck and prepared remarks, and all 31 of these considerations filings since the first quarter of 2019.
Two caveats apply. The considerations filings give most estimates as ranges, so the sums below use midpoints and carry an error of a few hundred million dollars a quarter. Adjusted earnings have excluded estimated timing effects since 2026, so the long series adds them back to stay comparable with earlier quarters, and the figures run through September 30, 2026, before the Q3 10-Q.
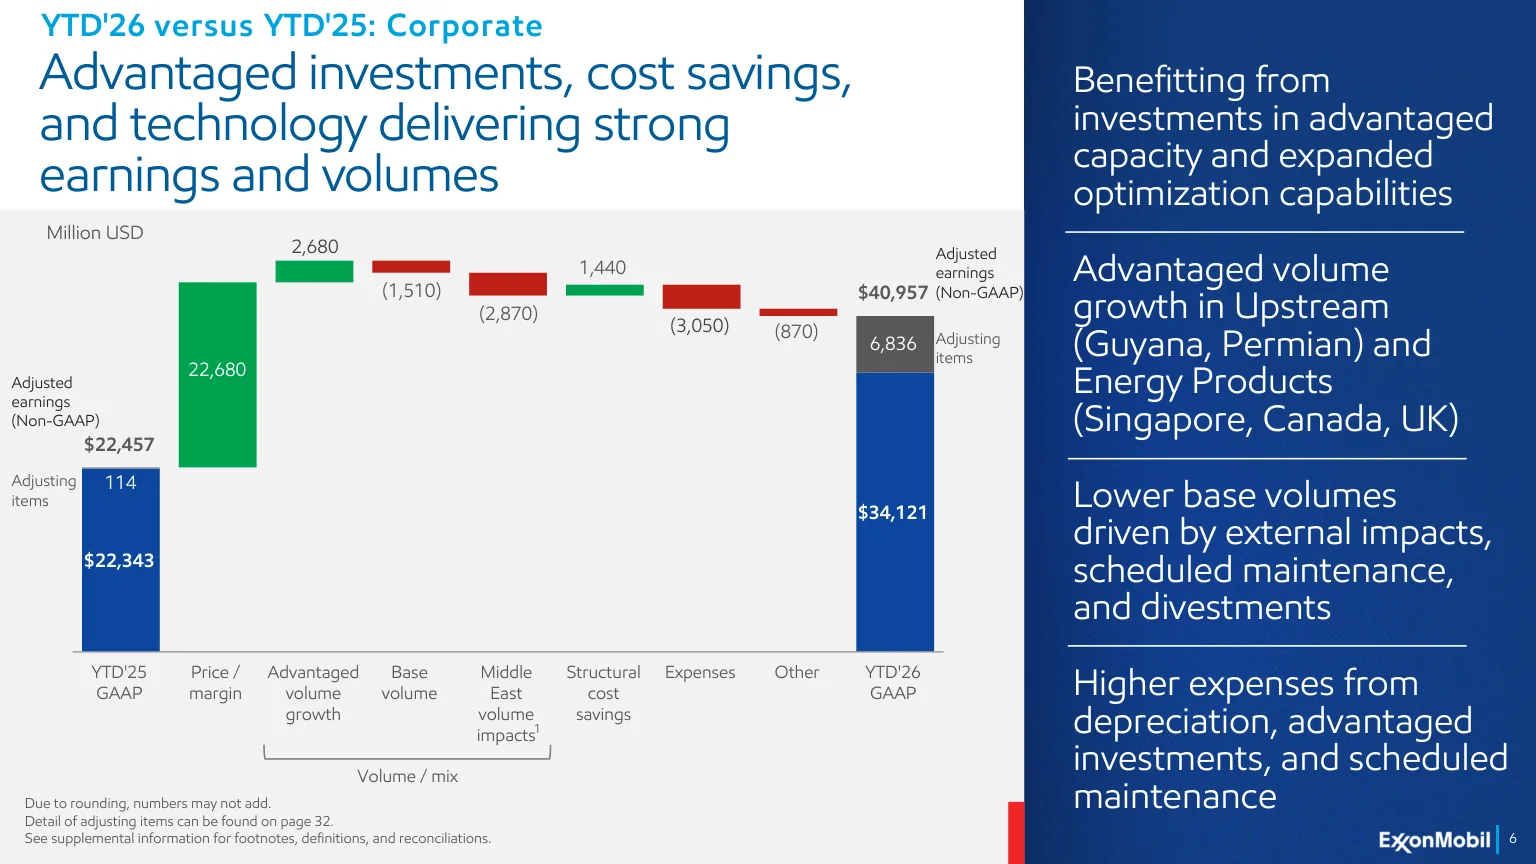
Page 6 walks from $22.457 billion of adjusted earnings in the first nine months of 2025 to $40.957 billion in 2026 in seven bars. Prices and margins add +$22.68 billion. Advantaged volume growth adds $2.68 billion and structural cost savings $1.44 billion, while base volume takes away $1.51 billion, Middle East volume impacts $2.87 billion, expenses $3.05 billion and other items $0.87 billion.
Management put it plainly in the prepared remarks: “Higher prices and margins increased year-to-date earnings by approximately $22.7 billion.” The same remarks argue that cost cuts and growth in higher-value production “improve profitability across market conditions, not just when prices and margins are favorable.”
Own calculation (deck page 6): The price and margin bar is 122.6% of the $18.5 billion gain. The two bars ExxonMobil controls most directly, advantaged volume and structural savings, add $4.12 billion, and the four negative bars subtract $8.30 billion, so everything outside prices and margins nets to minus $4.18 billion.
Pages 12 to 15 split the price and margin effect by segment: $13.10 billion from Energy Products margins (57.8%), $7.96 billion from Upstream prices, $0.87 billion from chemical margins and $0.75 billion from specialty margins. Energy Products adjusted earnings rose $11.988 billion over nine months, from $3.963 billion to $15.951 billion, so the margin bar alone is larger than the segment’s whole gain. Upstream adjusted earnings rose $5.251 billion against a price effect of $7.96 billion.
Page 7 shows where the cash went. ExxonMobil started the year with $10.7 billion of cash, generated $57.9 billion from operations and $1.1 billion from asset sales and other items, then spent $20.0 billion on capital projects, $28.0 billion on shareholder distributions and $9.6 billion on debt and other items, ending September with $12.2 billion. Distributions took 71.7% of nine-month free cash flow of $39.044 billion, and net debt to capital fell to 7.5%.
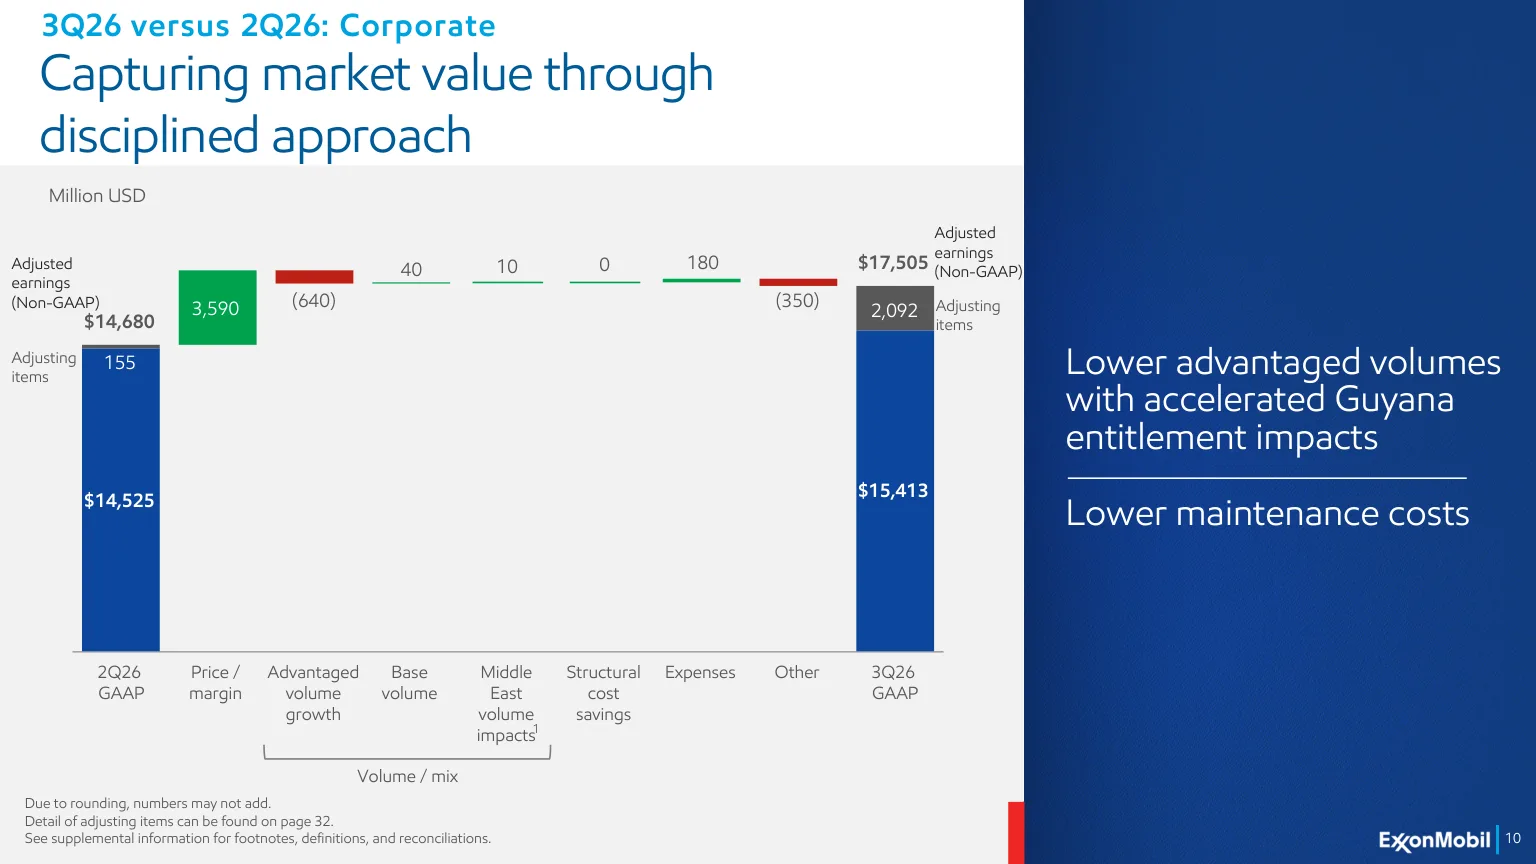
The quarter repeats the pattern. On page 10, adjusted earnings rise from $14.680 billion to $17.505 billion, and price and margin contribute +$3.59 billion, 127% of the $2.825 billion increase. Advantaged volume subtracts $0.64 billion, which the company attributes to accelerated Guyana entitlement effects: under production sharing contracts, higher prices shrink the barrels that belong to the contractor.
Page 17 isolates Energy Products, where the margin bar alone is +$4.73 billion, larger than the corporate price and margin total because crude prices fell from the second quarter. The prepared remarks say “Refining margins increased to record levels” while roughly 10% of global refining capacity stayed offline in Russia and the Middle East.
None of this surprised anyone reading the filings. The 8-K filed two weeks before the release estimated third-quarter market factors at $3.4 billion, and the deck’s price and margin bar came in at $3.59 billion. Its breakdown was minus $1.3 billion from liquids prices, plus $0.3 billion from gas prices and plus $4.4 billion from margins, with $4.5 billion of that margin effect in Energy Products.
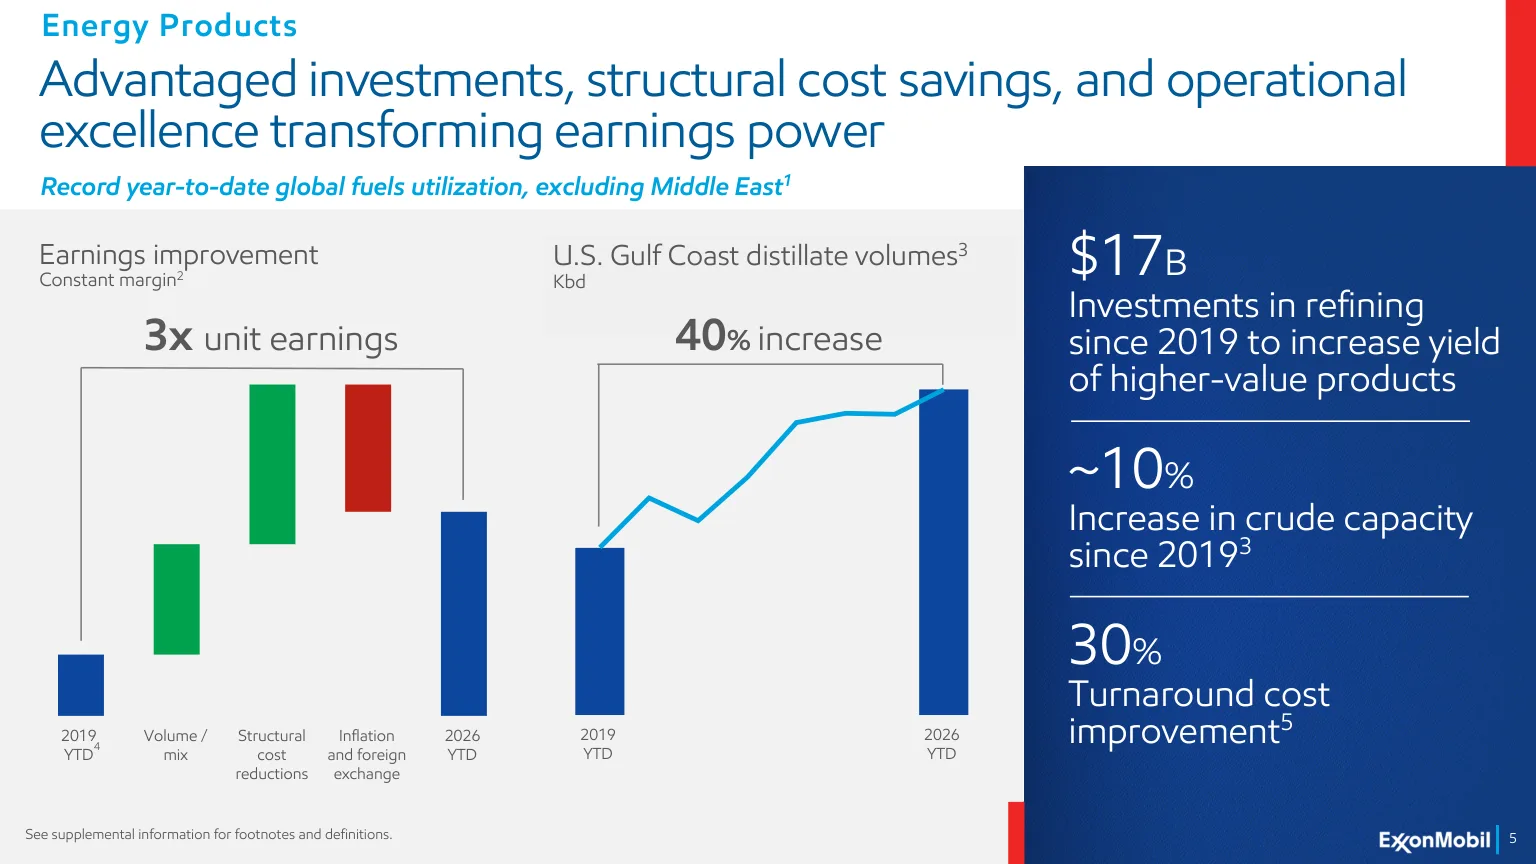
Q3 2026 deck page 5: Energy Products unit earnings and Gulf Coast distillate
Page 5 is the company’s rebuttal. Holding margins at their 2010 to 2019 average, it says Energy Products unit earnings tripled between the first nine months of 2019 and the first nine months of 2026. The prepared remarks spell out the inputs: “Together, our investments, improved volume and mix, and lower structural costs have tripled the underlying unit earnings of the business at constant margin.” ExxonMobil has spent about $17 billion on refining since 2019, raised crude capacity by about 10% and US Gulf Coast distillate output by 40%, and cut turnaround costs by 30%. The bars carry no values, so the dollar size of the tripling cannot be checked.
Trading belongs to the same story. Traded volumes are now about four times the 2019 level, and the considerations 8-K says crude and product trading caused most of the third-quarter timing effects. Of minus $2.541 billion in Q3 timing effects, minus $1.873 billion sat in Energy Products, so a larger trading book also means larger quarterly swings.
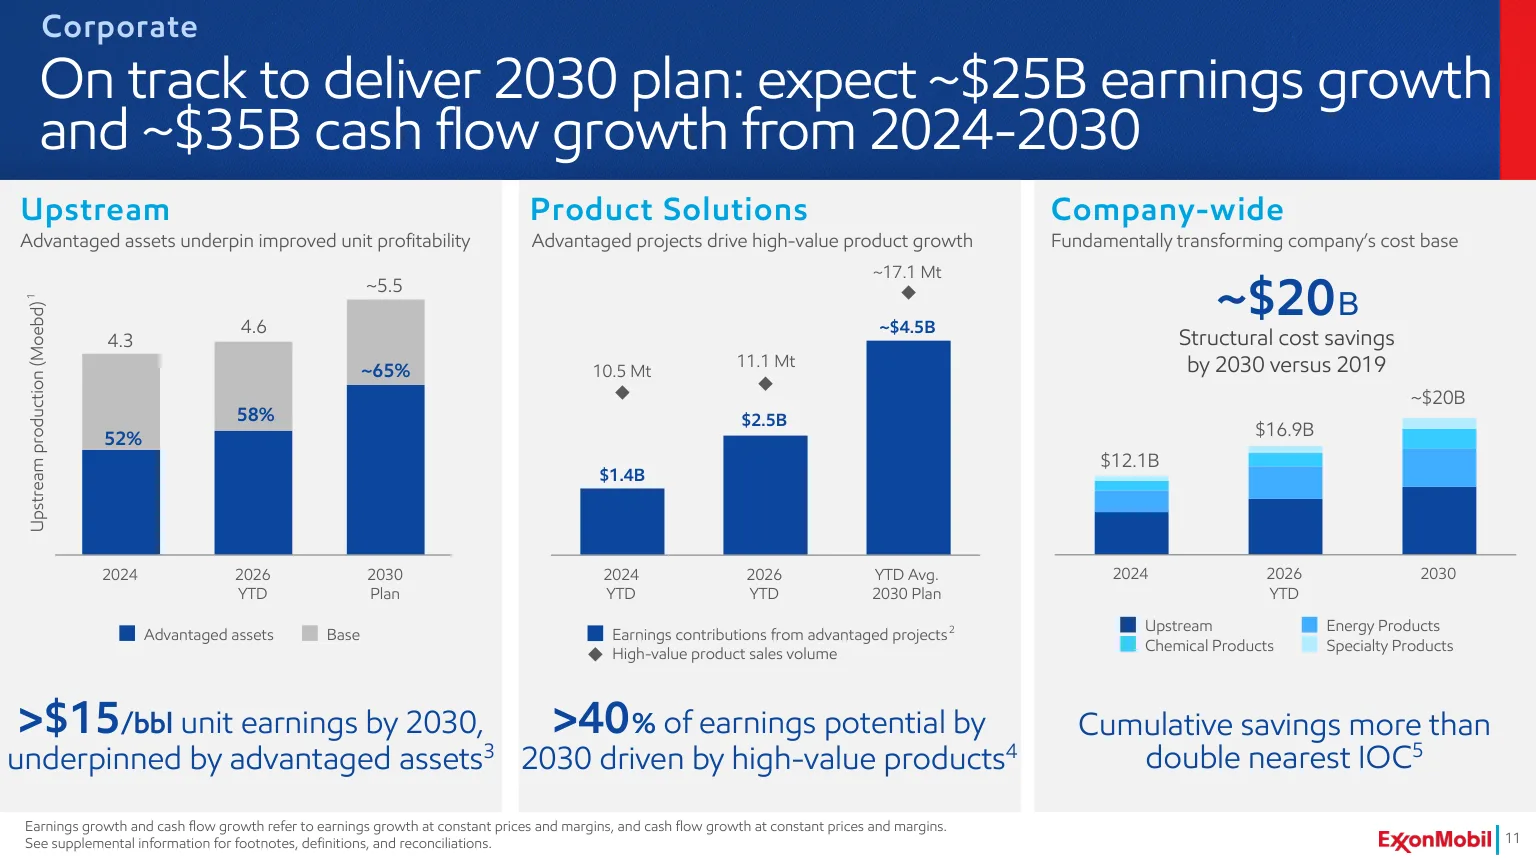
Page 11 restates the 2030 plan: about $25 billion of earnings growth and $35 billion of cash flow growth from 2024 at constant prices and margins. Upstream production, adjusted to $65 Brent, goes from 4.3 million barrels a day in 2024 to 4.6 million in the first nine months of 2026 and about 5.5 million in 2030, and the product segments target high-value sales of about 17.1 million tons and about $4.5 billion of earnings from advantaged projects.
Q3 2026 deck page 11: the 2030 plan and cumulative structural savings
Annualizing the $4.12 billion of nine-month advantaged volume and savings gives about $5.5 billion a year, above the roughly $4.2 billion a year needed to add $25 billion over six years. Over the same nine months, base volume, the Middle East, expenses and other items took $8.30 billion away, and page 11 puts cumulative structural savings on a path from $12.1 billion in 2024 to $16.9 billion now and about $20 billion by 2030.
The Bull and Bear Case for ExxonMobil Stock
The bull case is cash. Third-quarter operating cash flow of $25.650 billion and free cash flow of $19.109 billion covered $4.264 billion of dividends and $5.1 billion of buybacks and still cut net debt to $22.1 billion. ExxonMobil has announced $20 billion of buybacks for 2027, and the distillate capacity it built since 2019 arrived in a market short of diesel.
The bear case is the source of the earnings. Prices and margins explain 122.6% of the nine-month gain, and the company’s own market factor estimates add up to 101% of the rise in quarterly earnings since early 2020. The record refining margin came from outages in Russia and the Middle East, and price to book of 2.92 is the highest in 59 months.
From the 2020 Impairments to a Texas Holding Company
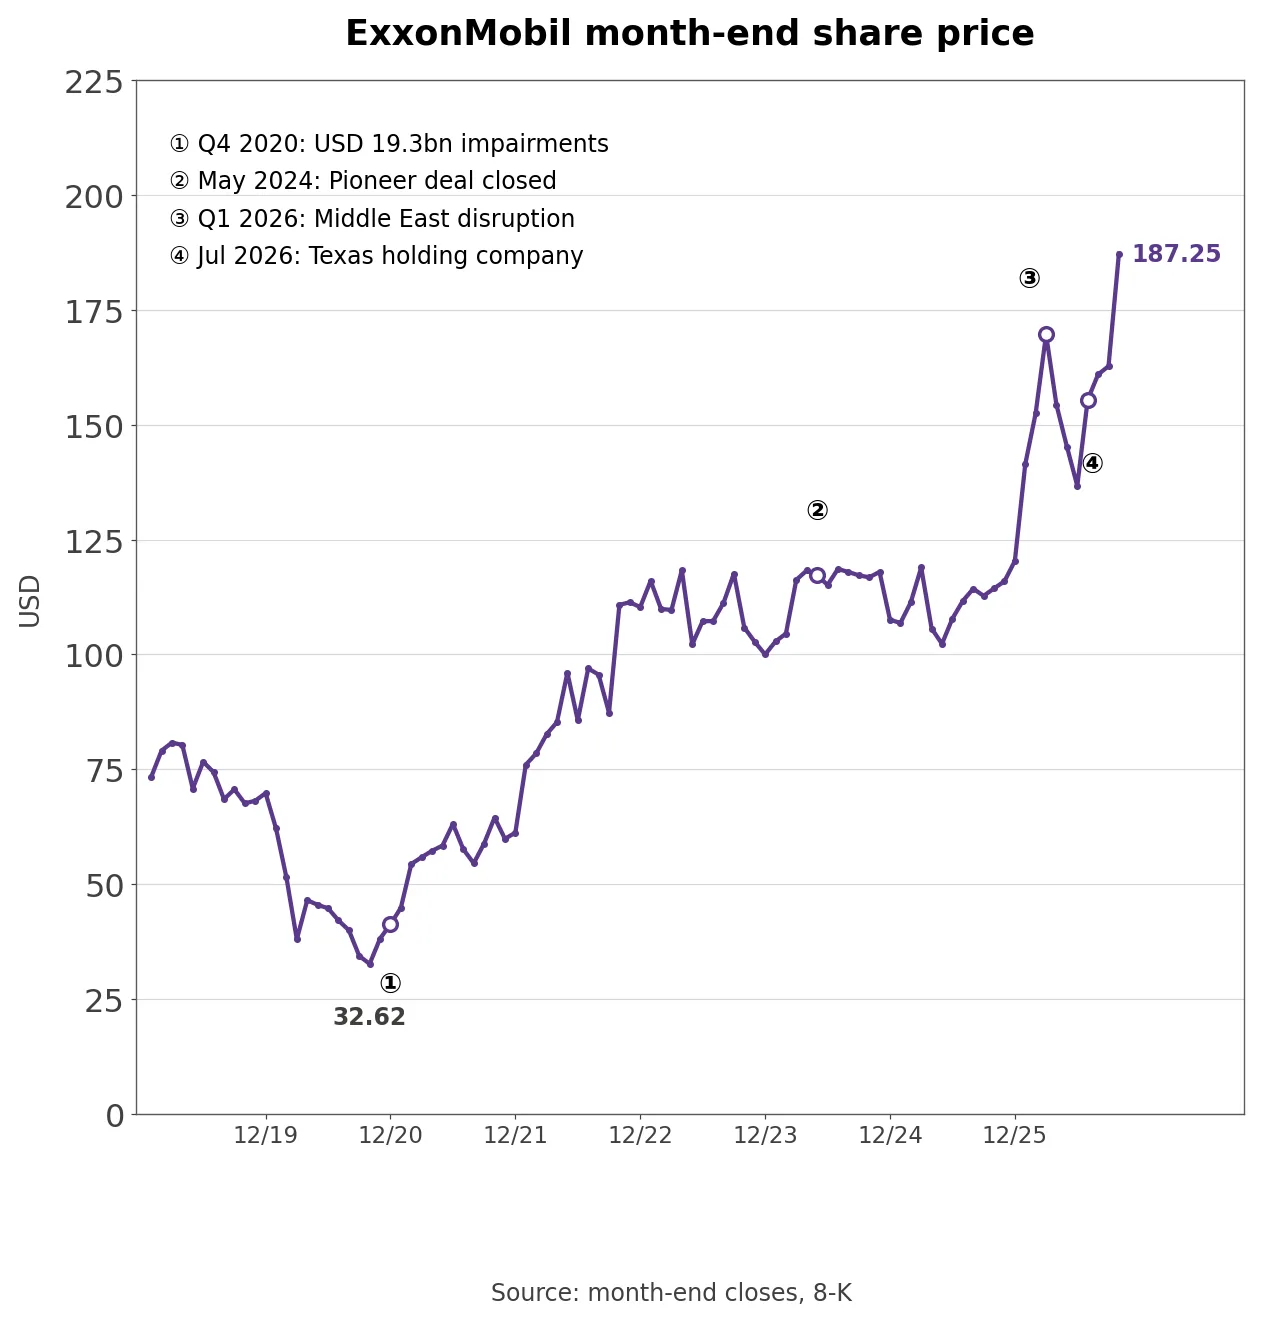
ExxonMobil month-end share price over 94 months with four dates
The month-end share price bottomed at $32.62 in October 2020, the lowest since 2019. In the fourth quarter of that year ExxonMobil booked $19.3 billion of impairments, mostly in Upstream, and lost $20.07 billion. Margins surged after Russia invaded Ukraine, and quarterly earnings excluding identified items peaked at $18.7 billion in the third quarter of 2022. In June 2022 the company split Downstream and Chemical into Energy Products, Chemical Products and Specialty Products and recast prior results, which is why the segment comparison here starts in 2022.
In May 2024 it closed the all-stock acquisition of Pioneer Natural Resources in the Permian, lifting weighted average shares from 3.998 billion in Q1 2024 to 4.462 billion in Q3. Middle East disruption began to cut regional output in the first quarter of 2026. On July 1 shareholders received one share of the Texas holding company for each old share and treasury shares were cancelled, taking shares issued from 8.019 billion at the end of 2025 to 4.112 billion in September. The month-end price climbed from $120.34 at the end of 2025 to $169.66 in March, dipped to $136.72 in June and reached $187.25 in October, +55.6% for the year.
How Much of the Earnings Rise Came From Market Factors?
Since 2019 ExxonMobil has filed an earnings considerations 8-K before every quarterly release. Each one starts from the prior quarter’s earnings and lists the expected effect of market factors (liquids prices, gas prices, refining, chemical and basestock margins) and planned factors (maintenance, day count, Middle East volumes) by segment. The company explains why: “These limited factors are being provided to allow the Company’s subsequent comprehensive earnings release to focus on performance and the impact of management’s strategic decisions.” Adding up the market factors does exactly what the company invites.
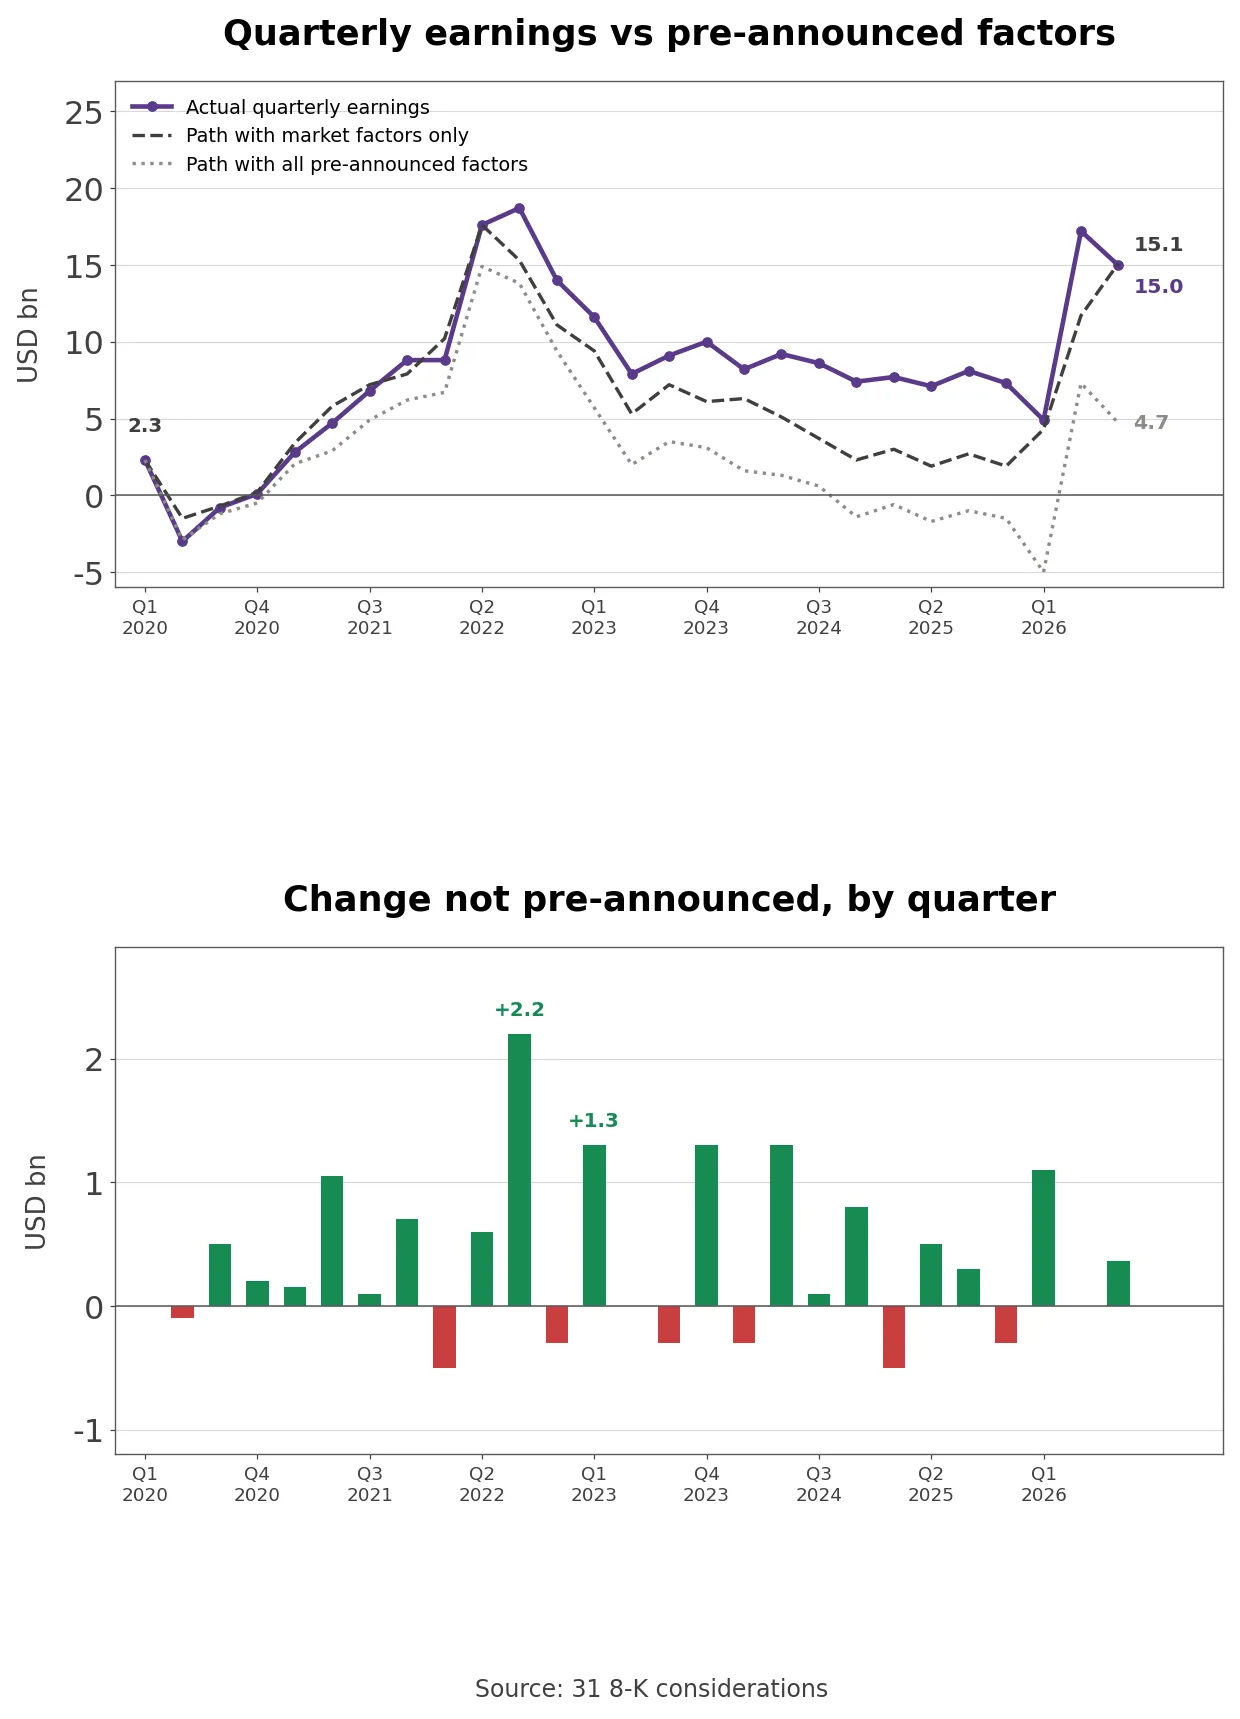
Own calculation (31 earnings considerations 8-Ks): Quarterly earnings excluding identified items, with timing effects left in, were $2.30 billion in Q1 2020 and $14.964 billion in Q3 2026, a rise of $12.66 billion. Over the 26 quarters from Q2 2020, the company’s market factor estimates add up to $12.80 billion, 101% of that rise.
Quarterly earnings against cumulative market factors from the considerations 8-Ks
The market-only path tracked actual earnings closely through 2022. From 2023 to 2025 actual earnings ran $1.9 billion to $5.4 billion a quarter above it, $3.9 billion on average. The same filings flagged planned and timing headwinds worth minus $10.40 billion, and the change ExxonMobil never pre-announced, plus $10.26 billion, filled that gap.
That unexplained piece was positive in 17 of the 26 quarters and added $1.9 billion to $2.3 billion a year from 2021 through 2024, consistent with Guyana and Permian growth and cost cuts. It summed to zero in 2025. By the third quarter the market path ($15.10 billion) and actual earnings ($14.96 billion) met again, with Middle East volume losses and minus $2.541 billion of Q3 timing effects sitting where the earlier gap had been.
Why Refining Out-Earned Upstream at ExxonMobil
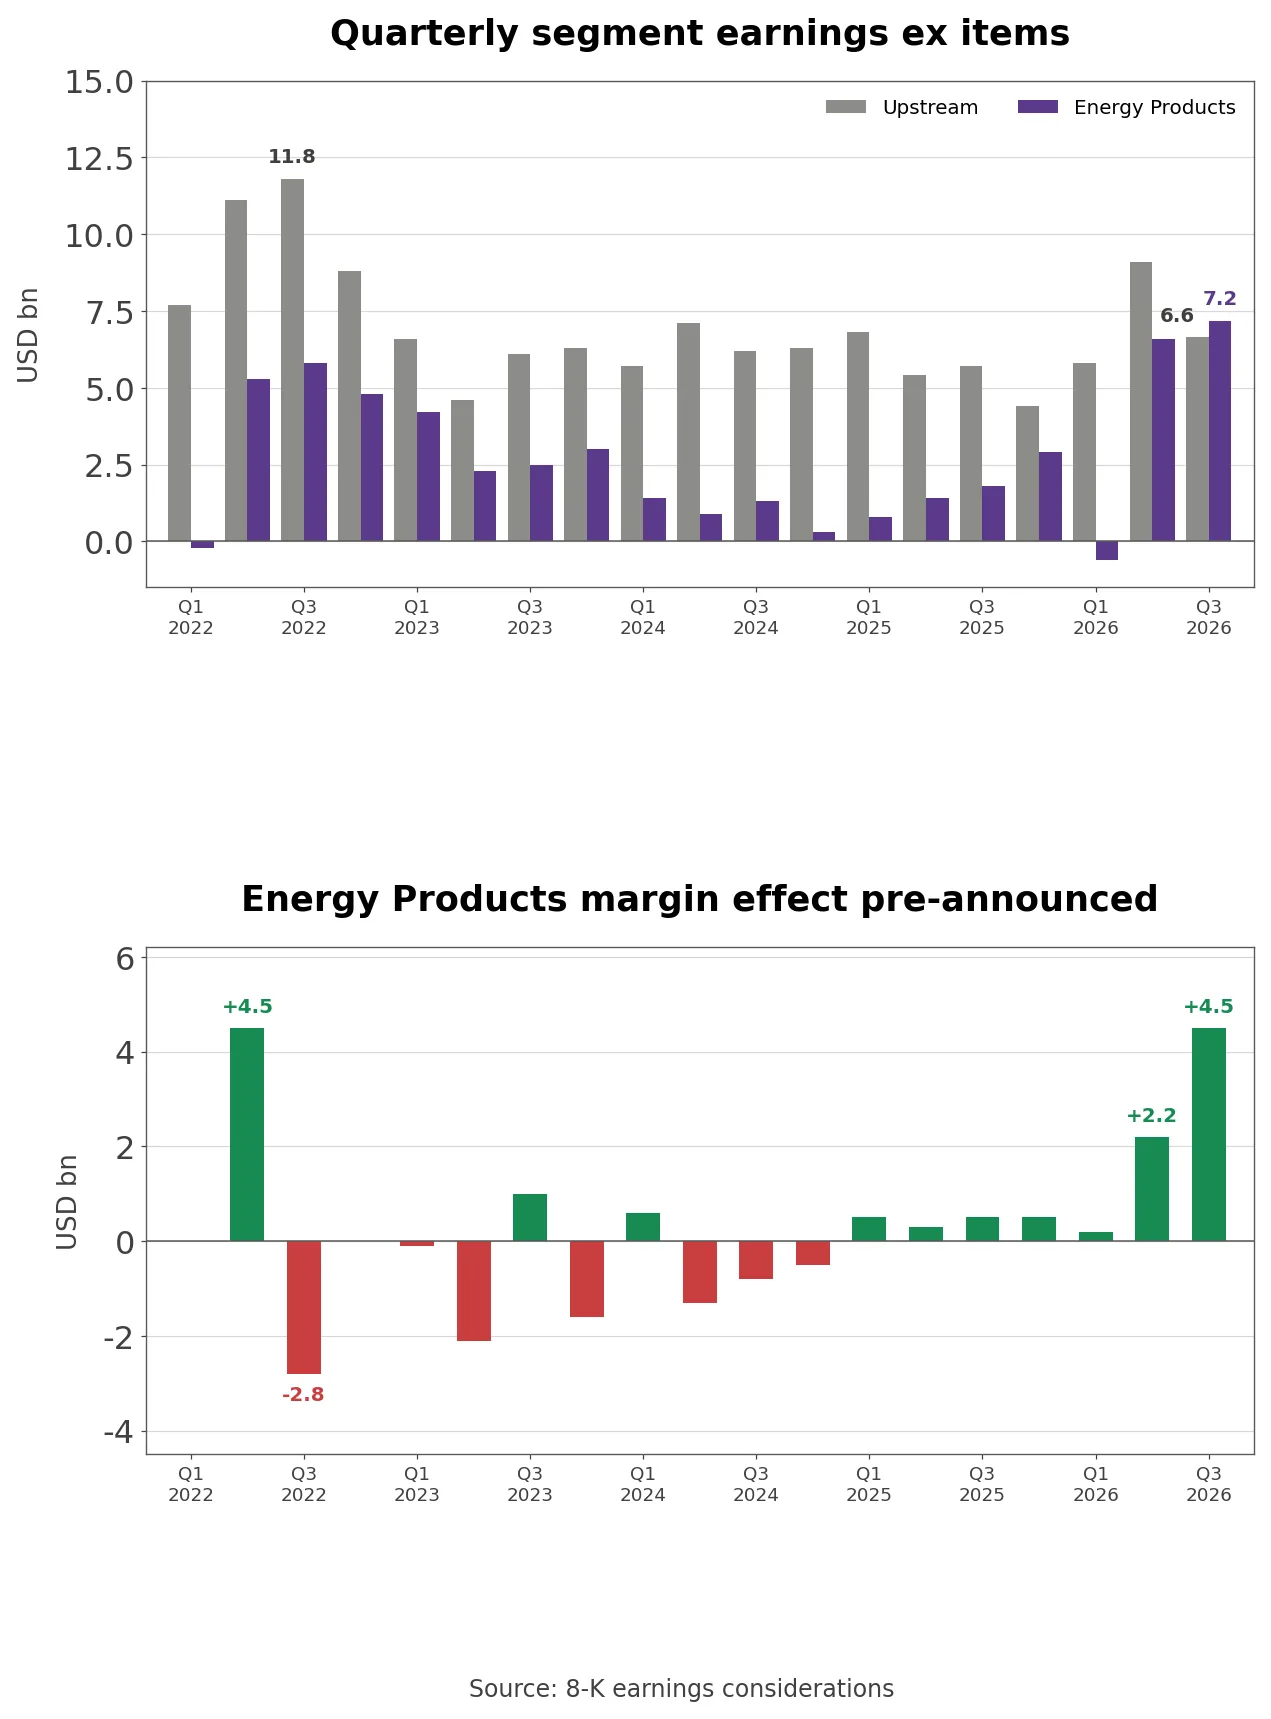
Third-quarter Energy Products adjusted earnings of $9.053 billion exceeded Upstream’s $7.308 billion for the first time in the 19 quarters since the 2022 resegmentation. With timing effects added back the order holds, $7.18 billion against $6.64 billion. Unit earnings point the same way: about $26 per barrel refined against about $18 per barrel produced.
Upstream and Energy Products quarterly earnings with pre-announced margin effects
Own calculation (18 earnings considerations 8-Ks): Energy Products earnings including timing effects rose $6.88 billion, from $0.30 billion in Q4 2024 to $7.18 billion in Q3 2026. The company’s pre-announced Energy Products margin effects over the same seven quarters add up to $8.7 billion, 126% of the rise.
The Q3 margin effect of $4.5 billion matches Q2 2022, the quarter after Russia invaded Ukraine. That time, margin effects summed to minus $7.6 billion from Q3 2022 through Q4 2024, and quarterly Energy Products earnings fell from $5.8 billion to $0.3 billion.
How ExxonMobil Makes Money Across Four Segments
Upstream produced 4.496 million oil-equivalent barrels a day in the third quarter. Growth comes from the Permian (about 1.8 million barrels a day for the year), offshore Guyana and LNG. Guyana and Kearl in Canada each passed one billion cumulative barrels and PNG LNG passed 100 million tons, and the fifth Guyana FPSO, a floating production and storage vessel, is due to start late in the fourth quarter. Nine-month advantaged volume growth came from Guyana, the Permian and Golden Pass LNG in Texas. In Q3 ExxonMobil also took over operatorship of Papua LNG and agreed to raise its stakes in Papua to 34% and in Rovuma, Mozambique, to 50%. Upstream took 85.4% of Q3 capital spending of $7.002 billion.
The other three segments turn crude into products. Energy Products refined 3.7 million barrels a day of gasoline, diesel and jet fuel. Chemical Products sold 4.888 million tons of petrochemicals such as polyethylene, and Specialty Products sold 1.737 million tons of basestocks and lubricants such as Mobil 1. Adjusted unit earnings were about $148 a ton in chemicals and $739 a ton in specialty products, five times as much per ton. Crude and product purchases were $65.724 billion of $110.503 billion of Q3 sales, or 59.5%, which keeps the margin on revenue low.
Refining growth projects aim at diesel. The Beaumont expansion, the Singapore resid upgrade, Strathcona renewable diesel in Canada and Fawley diesel in the UK fed nine-month advantaged volume, and US projects including Baytown should add another 100,000 barrels a day of distillate. Chemicals benefited from North American ethane feed and record reliability, specialty products from basestock margins lifted by supply disruptions, and carbon capture started at a Nucor steel plant in the third quarter.
The February 2026 company overview says Upstream provided more than 70% of 2025 earnings and the three product segments more than 35%, the total exceeding 100% because corporate costs sit outside the segments. Nine-month 2026 adjusted earnings were $22.762 billion in Upstream, $15.951 billion in Energy Products, $2.049 billion in Chemical Products and $2.903 billion in Specialty Products, putting Energy Products at 36.5% of the four segments against 16.0% a year earlier.
The Middle East touches both ends. Third-quarter Middle East production was about 550,000 barrels a day, 250,000 in Qatar and 300,000 in the UAE, and the company assumes about 350,000 barrels a day stay offline in the fourth quarter. The $2.87 billion of nine-month Middle East volume losses hit Upstream, while the refining capacity the same events removed lifted Energy Products margins.
Structural Cost Savings Against Flat Cash Costs
Company disclosure (Q3 2026 earnings release, October 30, 2026): Cumulative structural cost savings since 2019 reached $16.9 billion, including $1.8 billion in the first nine months of 2026. The prepared remarks add that about 75% came from organizational changes, that Energy Products contributed about $3 billion, and that turnarounds now cost about 30% less and finish 50% faster.
Own calculation (earnings release page 8): Cash operating expenses excluding energy and production taxes were $44.0 billion in 2019 and $44.1 billion in 2025. The same table splits the change into plus $4.9 billion of market effects, plus $10.3 billion of activity and other items and minus $15.1 billion of structural savings. The savings offset new operations, acquisitions and higher activity rather than shrinking the cost base.
The company describes this as savings that more than offset inflation and growth, and page 11 says cumulative savings are more than double the nearest IOC (BP, Chevron, Shell or TotalEnergies). Actual production rose from about 4.0 million barrels a day in Q1 2019 to 4.496 million in Q3 2026. Nine-month 2026 cash costs still rose +3.8%, from $31.8 billion to $33.0 billion, split into plus $1.2 billion of market effects, plus $1.8 billion of activity and minus $1.8 billion of savings.
ExxonMobil vs Chevron Shell and TotalEnergies
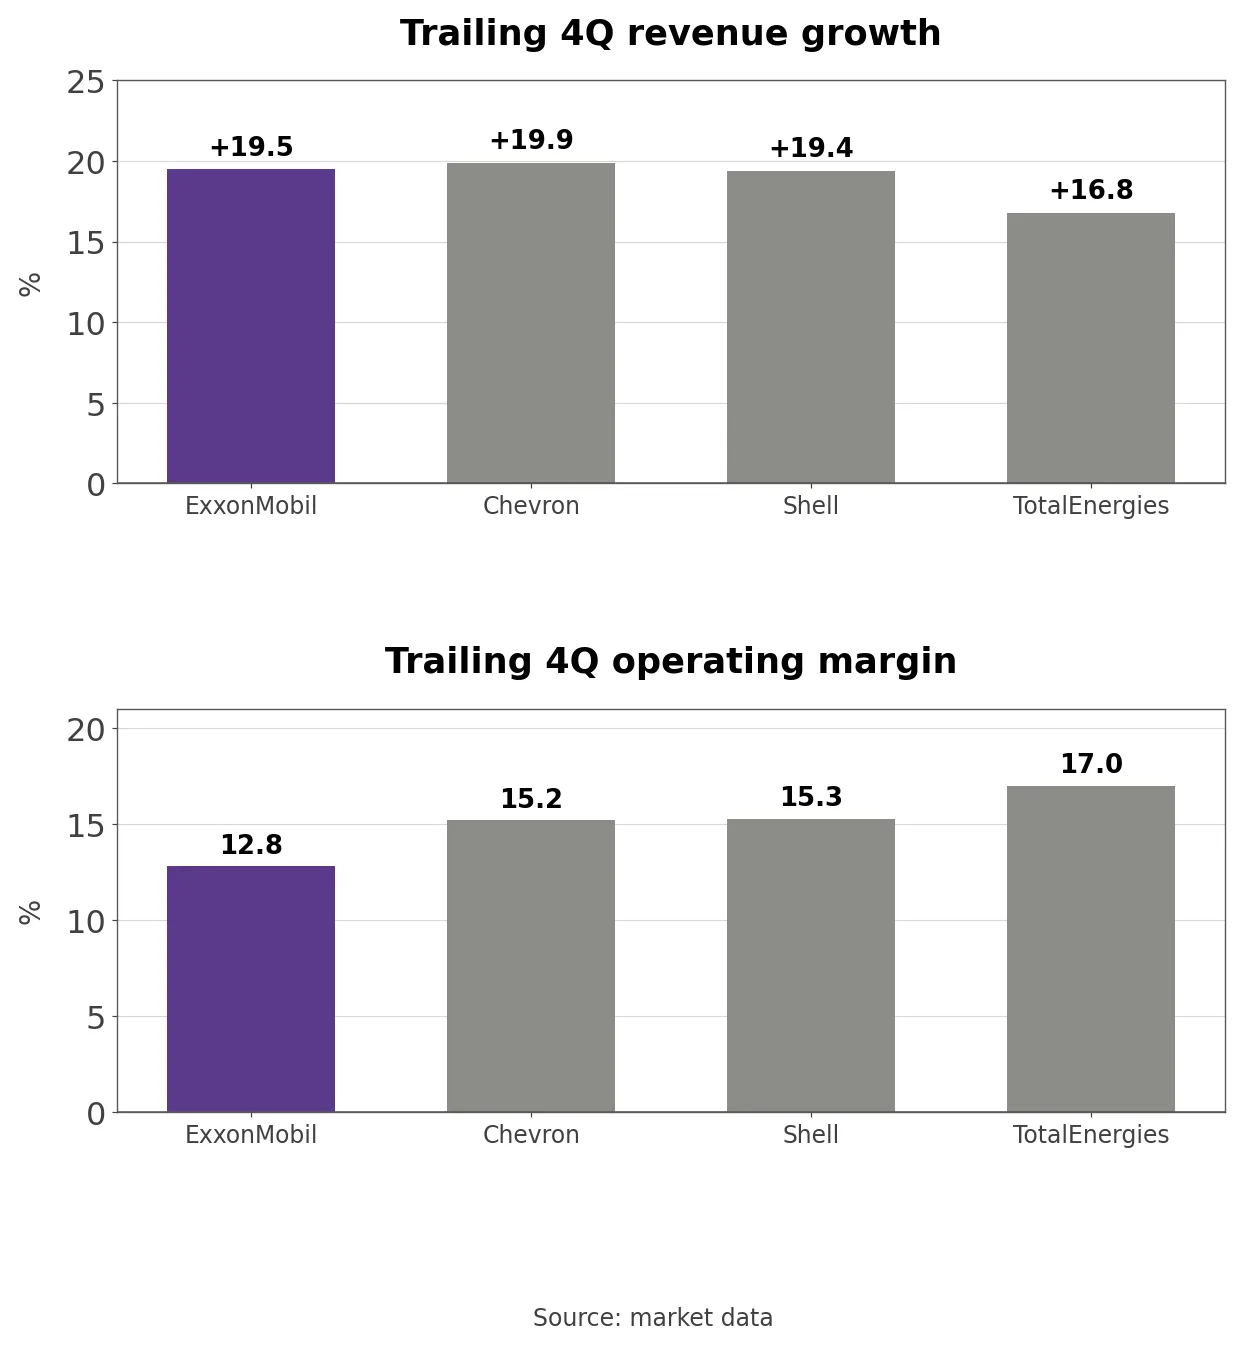
Revenue growth and operating margin at ExxonMobil Chevron Shell and TotalEnergies
Trailing four-quarter revenue growth is nearly identical: ExxonMobil +19.5%, Chevron +19.9%, Shell +19.4% and TotalEnergies +16.8%. Trailing operating margin on market data is lowest at ExxonMobil (12.8%) and highest at TotalEnergies (17.0%). ExxonMobil is the largest of the four, with $388.2 billion of trailing revenue, 1.71 times Chevron’s, and a market value 1.66 times Chevron’s.
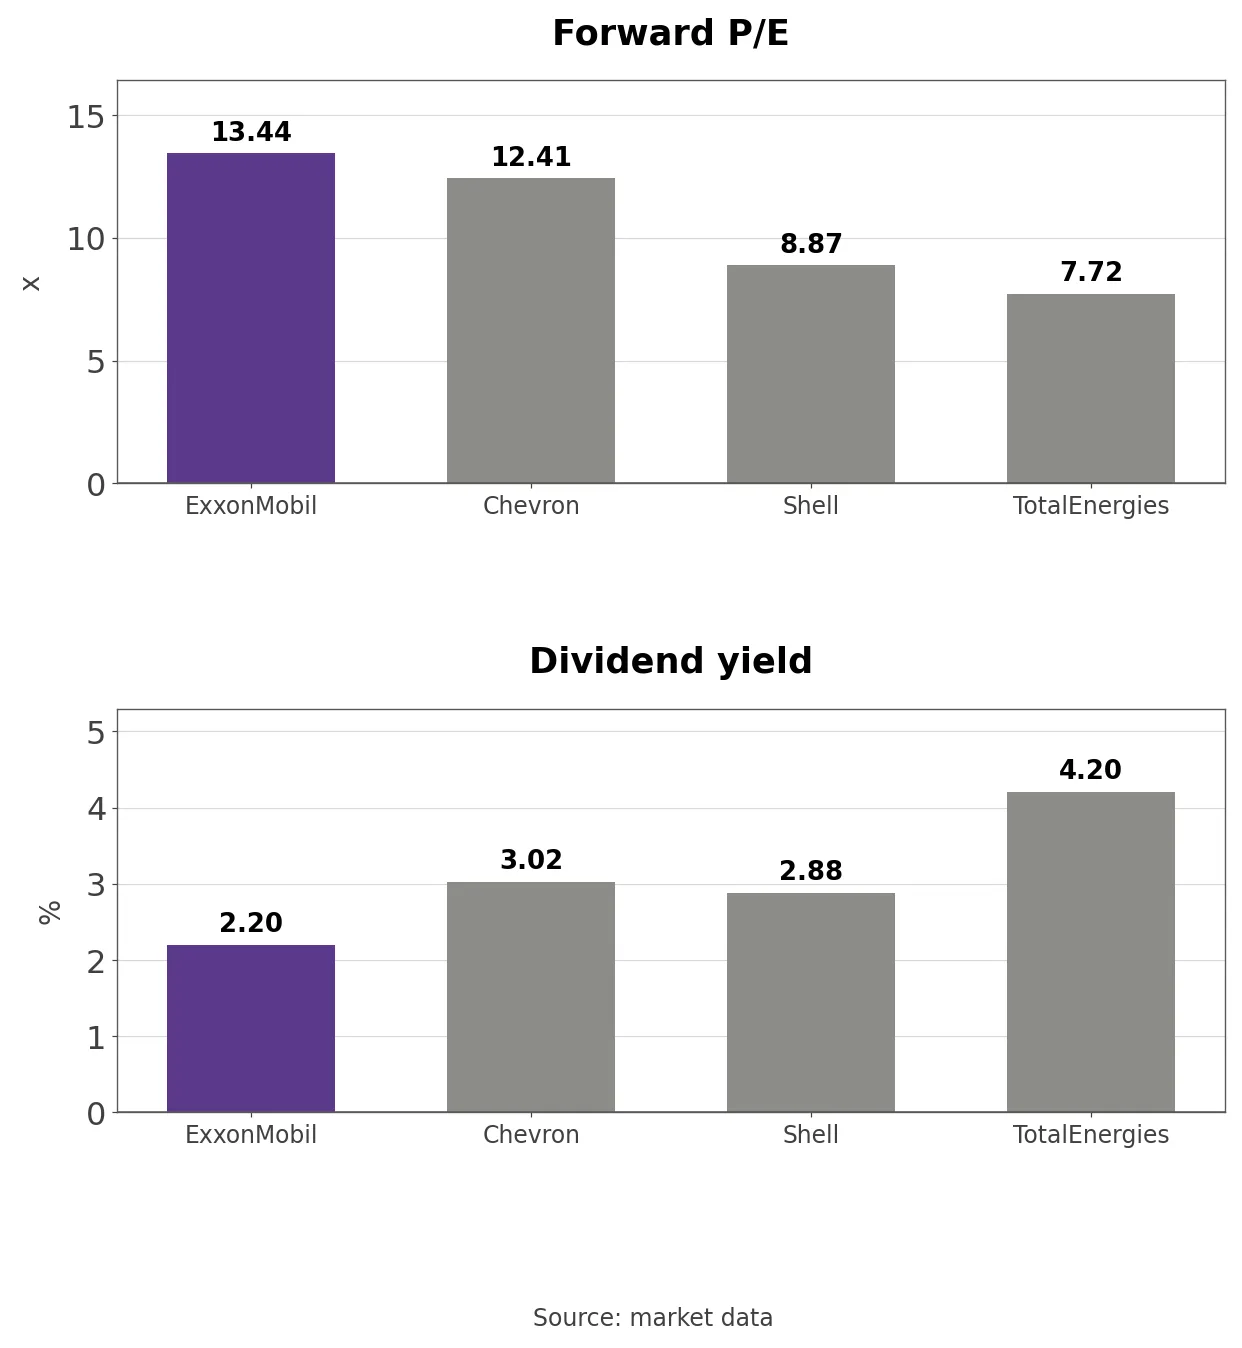
Forward P/E and dividend yield at ExxonMobil Chevron Shell and TotalEnergies
Valuation runs the other way. Forward P/E is 13.44 at ExxonMobil, 12.41 at Chevron, 8.87 at Shell and 7.72 at TotalEnergies, and ExxonMobil’s 2.20% dividend yield is the lowest. On payout, the 2027 buyback of $20 billion equals 2.6% of market value, and the fourth-quarter dividend of $1.07 a share is 4% higher and extends the run of annual increases to 44 years, for a combined yield of about 4.8%. On the multiples, the market has already accepted much of the company’s argument, although over the past year market value rose 71.4% at Chevron, 53.8% at ExxonMobil, 48.3% at TotalEnergies and 34.2% at Shell.
The P/E and Price-to-Book Band
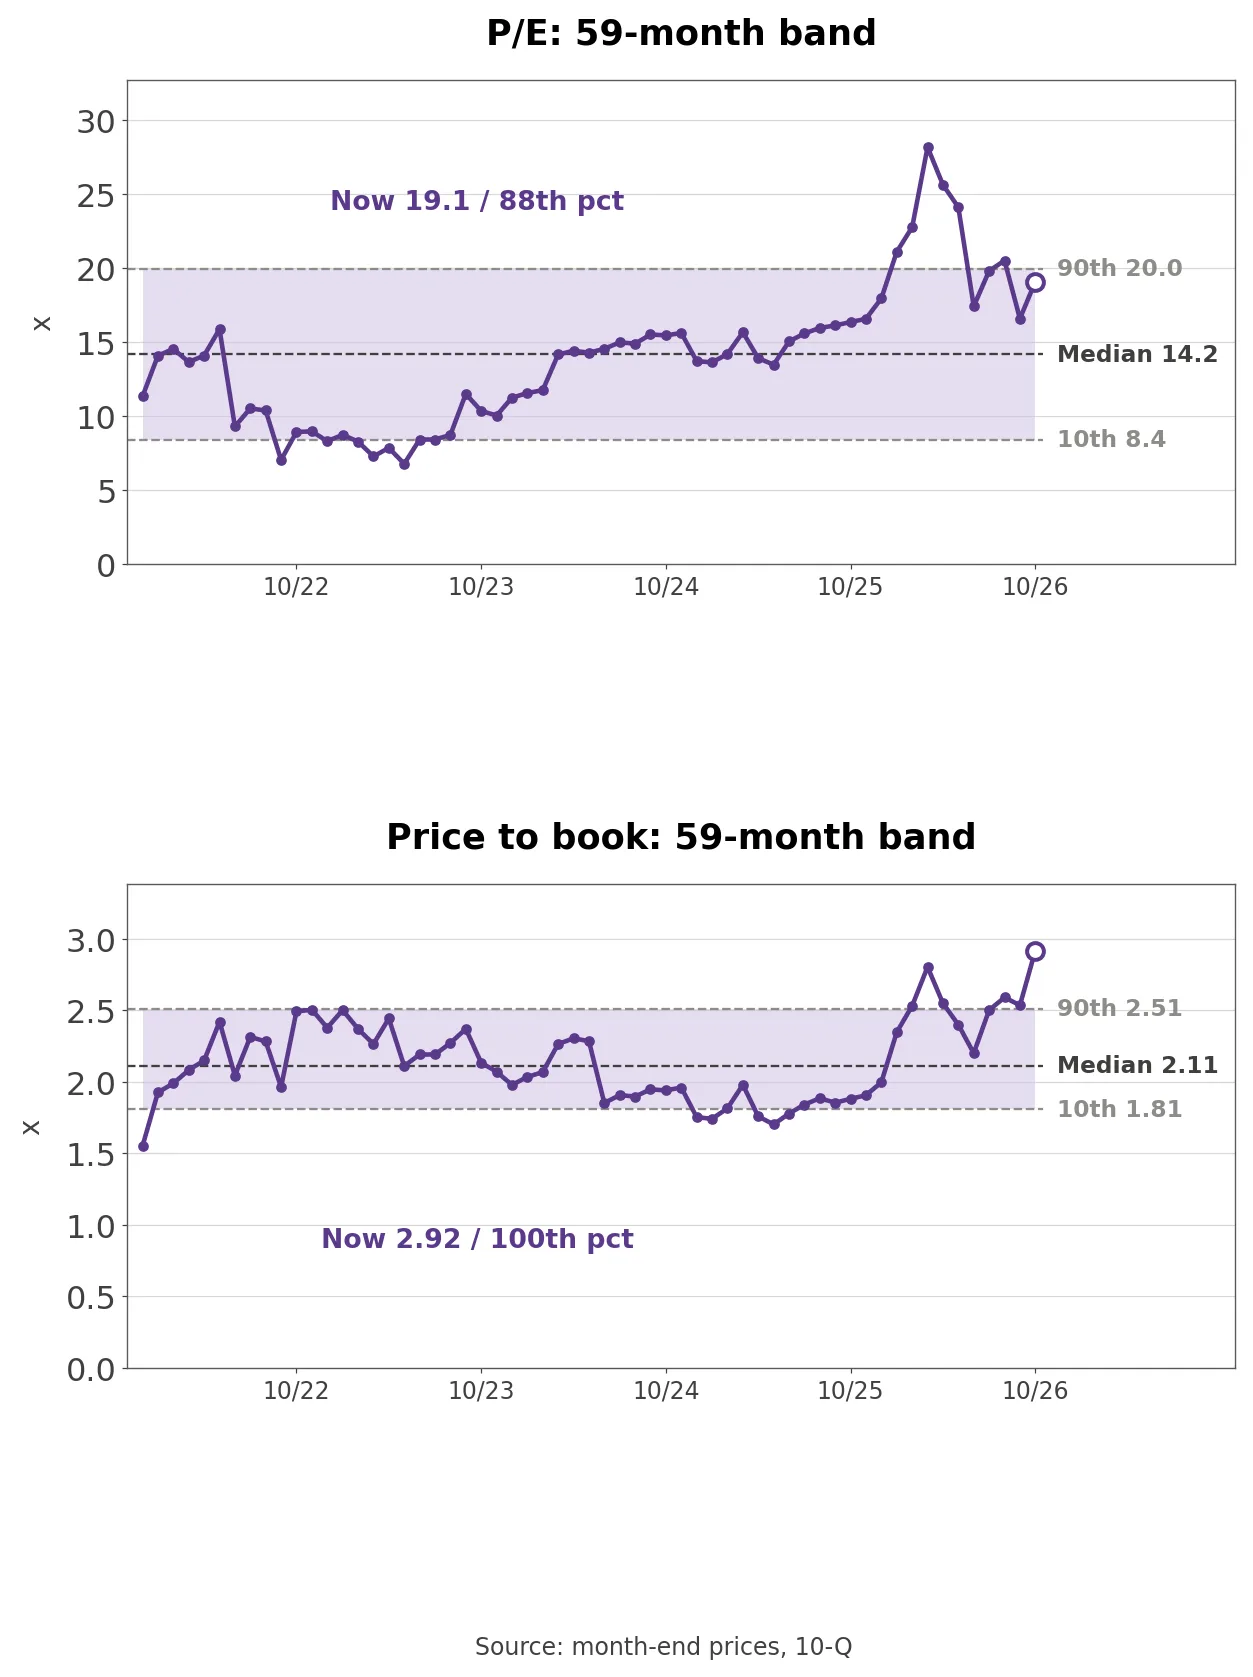
ExxonMobil P/E and price to book over 59 months
Own calculation (month-end prices, 10-Qs and the Q3 release): Month-end price times weighted average shares divided by trailing four-quarter GAAP net income gives a P/E of 19.08, above the 59-month median of 14.17 and just below the 90th percentile of 19.95. The same market value over $265.789 billion of equity attributable to ExxonMobil gives price to book of 2.92, the highest in 59 months, against a median of 2.11 and a 90th percentile of 2.51.
The P/E peak of 28.16 in March 2026 came when first-quarter net income fell to $4.183 billion on Middle East losses and timing effects while the share price rose to $169.66. Earnings recovered and the P/E fell back to about 19, but price to book kept rising. Market data shows a P/E of 19.30 and price to book of 2.87, a gap that reflects share-count conventions. On adjusted earnings, nine-month adjusted EPS of $9.82 annualizes to $13.09 and a multiple of 14.3, close to the band median, but most of those earnings came from prices and margins.
Three Conditions That Move the Stock
Refining margins carry the most weight. ExxonMobil’s sensitivity is $800 million of annual earnings per $1 a barrel of indicative refining margin, so the Q3 Energy Products margin effect of $4.73 billion, annualized, equals about $23.6 a barrel of indicative margin. If Russian and Middle East refineries return and that margin fades, the stock has the most to lose; a prolonged diesel shortage would keep the support in place.
Middle East production cuts both ways. Nine-month volume losses were $2.87 billion, and the company assumes 350,000 barrels a day stay offline in the fourth quarter. A return would lift Upstream volumes but could also lower refining margins, and the net of the two decides the direction.
Buyback delivery sets the floor under the payout. The $20 billion for 2027 assumes reasonable market conditions, and management warned that purchases may not be spread evenly across the quarters. Nine-month free cash flow of $39.044 billion covers it comfortably, but each $1 a barrel of Brent is worth $700 million of annual earnings, so a lower oil price would put the size of the program first in line for review.
What to Watch in the Q4 Report
ExxonMobil expects more Product Solutions maintenance than in Q3, the fifth Guyana FPSO late in the quarter, corporate and financing expenses of $500 million to $700 million and full-year cash capex of $27 billion to $29 billion. The change it never pre-announced summed to zero in 2025 and to plus $1.46 billion in the first three quarters of 2026. Lining up the fourth-quarter considerations 8-K in early January with the results at the end of that month answers one open question: will that change stay positive in a quarter when market factors stop helping?