BP (BP) Stock: Buybacks Paused as Obligations Fall $16.2bn
Contents
- BP (NYSE: BP) earned underlying replacement cost profit of $8.5 billion in the third quarter of 2026, 3.83 times the $2.2 billion of a year earlier, and operating cash flow rose +90.5% to $14.8 billion. Very little of that cash went to shareholders. In February the board suspended share buybacks and retired its guidance to return 30% to 40% of operating cash flow, so the third quarter’s distributions were $1.3 billion of dividends. The cash went instead into cutting financial obligations, BP’s new measure combining net debt, leases, hybrid bonds and the Deepwater Horizon settlement liability, from $60.5 billion in the first quarter to $44.3 billion.
- BP is a London-based integrated oil and gas company with three segments: gas & low carbon energy, oil production & operations, and customers & products, which covers refining, retail fuel, Castrol lubricants and oil trading. Third-quarter upstream production was 2.22 million barrels of oil equivalent per day. Each American depositary share (ADS) on the New York Stock Exchange represents six ordinary shares, and at a $50.39 close BP is worth about $129.9 billion on market data. Meg O’Neill, who called the second quarter her “first full quarter at bp”, leads the company.
- The question here is where the cash from high oil prices and refining margins is going, and what is left for shareholders once prices return to BP’s planning assumptions. The analysis lines up the Q3 2026 6-K, the 47-page Q3 results slides and script on the IR site, the group databook with 19 quarters from Q1 2022, 18 quarterly results filings and Brent prices from FRED.
- Two caveats apply. Underlying replacement cost profit excludes inventory holding gains and adjusting items and is a non-IFRS measure; BP reports under IFRS. Figures run through Q3 2026, and per-share figures are per ADS unless stated otherwise.
What the Q3 Slides Say About Earnings and Prices
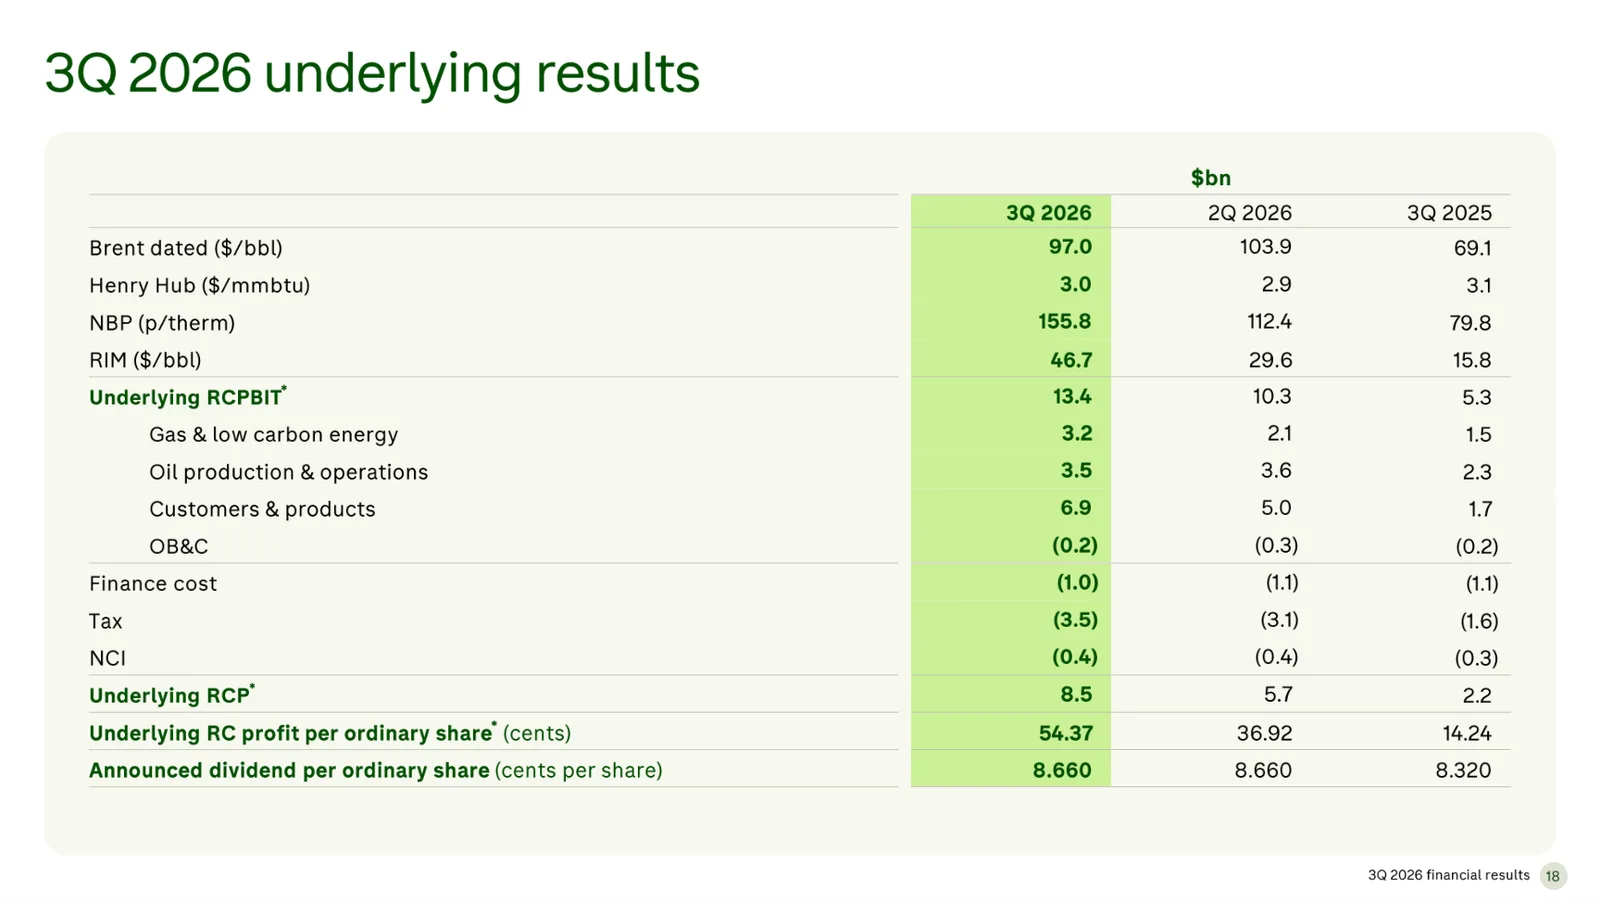
- Page 18 of the deck puts earnings and price markers in one table. Brent averaged $97.0 per barrel in the third quarter against $69.1 a year earlier, and BP’s refining indicator margin (RIM) reached $46.7 per barrel against $15.8. Of $13.4 billion in underlying profit before interest and tax, customers & products contributed $6.9 billion, oil production & operations $3.5 billion and gas & low carbon energy $3.2 billion. Underlying profit per ordinary share was 54.37 cents, against 36.92 cents in Q2 and 14.24 cents a year earlier.
- Company disclosure (Q3 2026 results, October 30, 2026): O’Neill said the quarter produced “a strong set of results, supported by the higher-price, higher-margin environment” and argued that “As a global integrated oil and gas company, our connectivity from the reservoir to the fuel pump is a significant source of strength and resilience”. The 6-K credits the step-up from Q2 to higher realized refining margins and a stronger gas marketing and trading result, with the Gelsenkirchen refinery sale at the end of July as an offset.
- Page 5 adds operating metrics: bp-operated upstream plant reliability recovered to 95.3% from 92.4% in Q2 and refining availability to 96.5% from 94.7%. Page 10 lists the July to September portfolio moves, including a 50% farm-down of Tupinambá in Brazil, the imminent completion of the Castrol sale, partners for Kirkuk in Iraq with BP keeping 43%, and the sale of the Austrian retail business.
- Checked against the 6-K, profit grew where volumes shrank. Customers & products earned 4.05 times its year-earlier underlying result, but upstream production was -6.0% lower at 2.22 million barrels a day and refinery throughput was 1.40 million barrels a day against 1.52 million. Net impairments of $4.1 billion, mostly in transition businesses, left IFRS profit attributable to shareholders at $4.7 billion. The underlying effective tax rate was 28% against 39% a year earlier, which BP puts down to the larger share of profit from refining.
The Balance Sheet Plan in the IR Deck
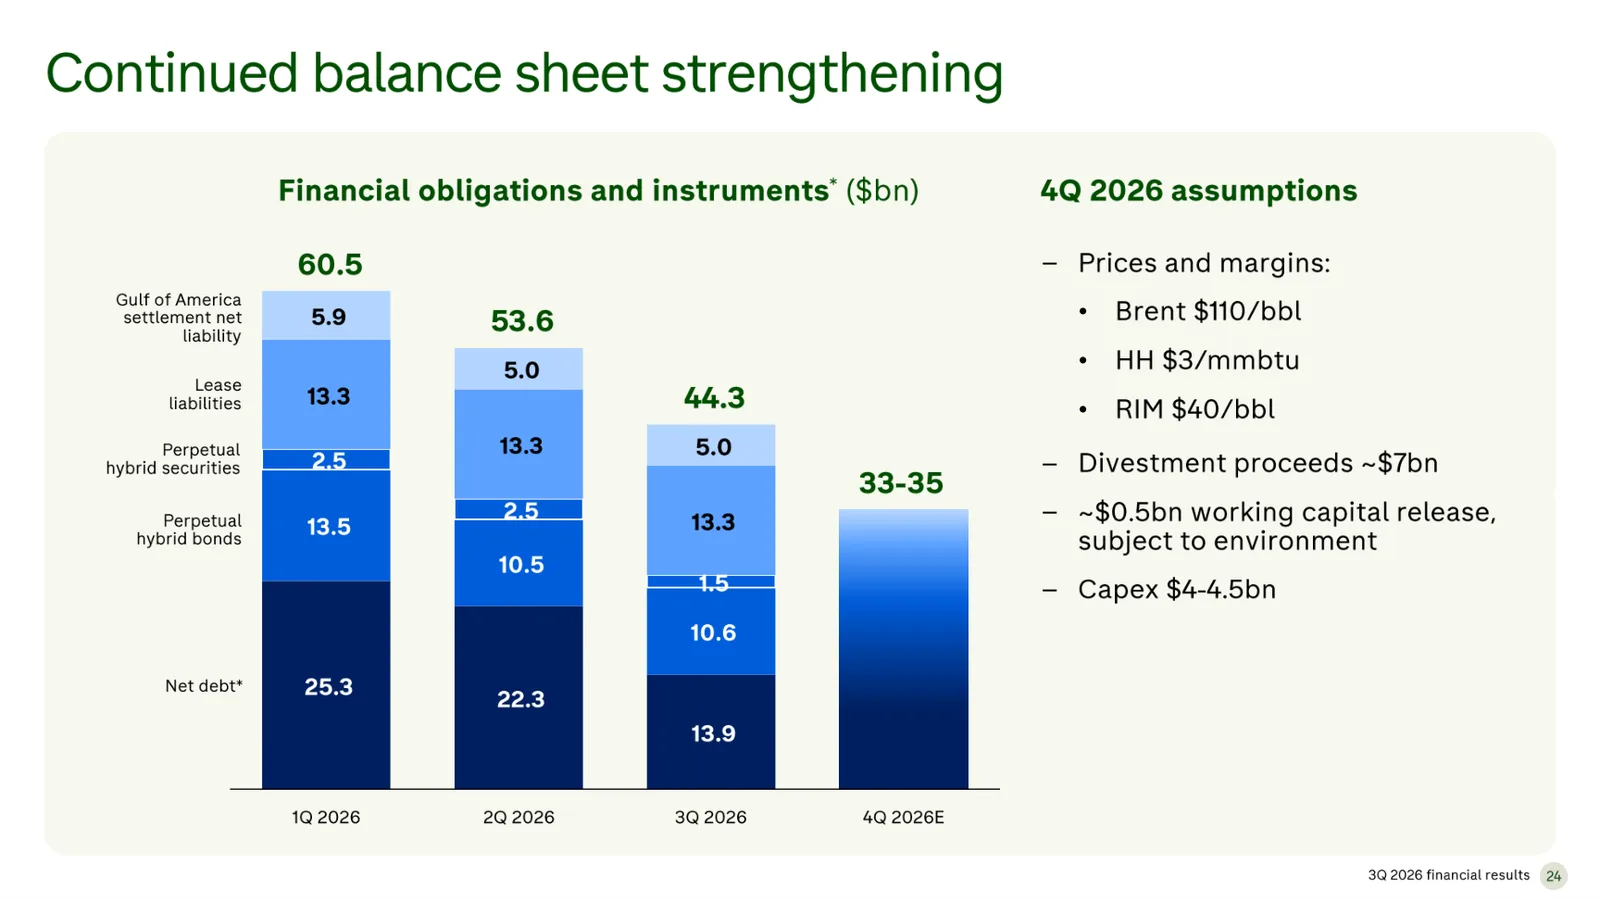
- Page 24 stacks the measure BP now manages to: financial obligations and instruments, defined as net debt plus lease liabilities, perpetual hybrid bonds and securities, and the Gulf of America settlement liability from the 2010 Deepwater Horizon spill. The total was $60.5 billion in Q1, $53.6 billion in Q2 and $44.3 billion in Q3, while net debt went from $25.3 billion to $13.9 billion. Assuming Q4 Brent of $110, RIM of $40 and about $7 billion of divestment proceeds, BP expects the total to reach $33 billion to $35 billion by year-end. The headline on page 7 still reads “Our financial obligations and instruments remain too high”.
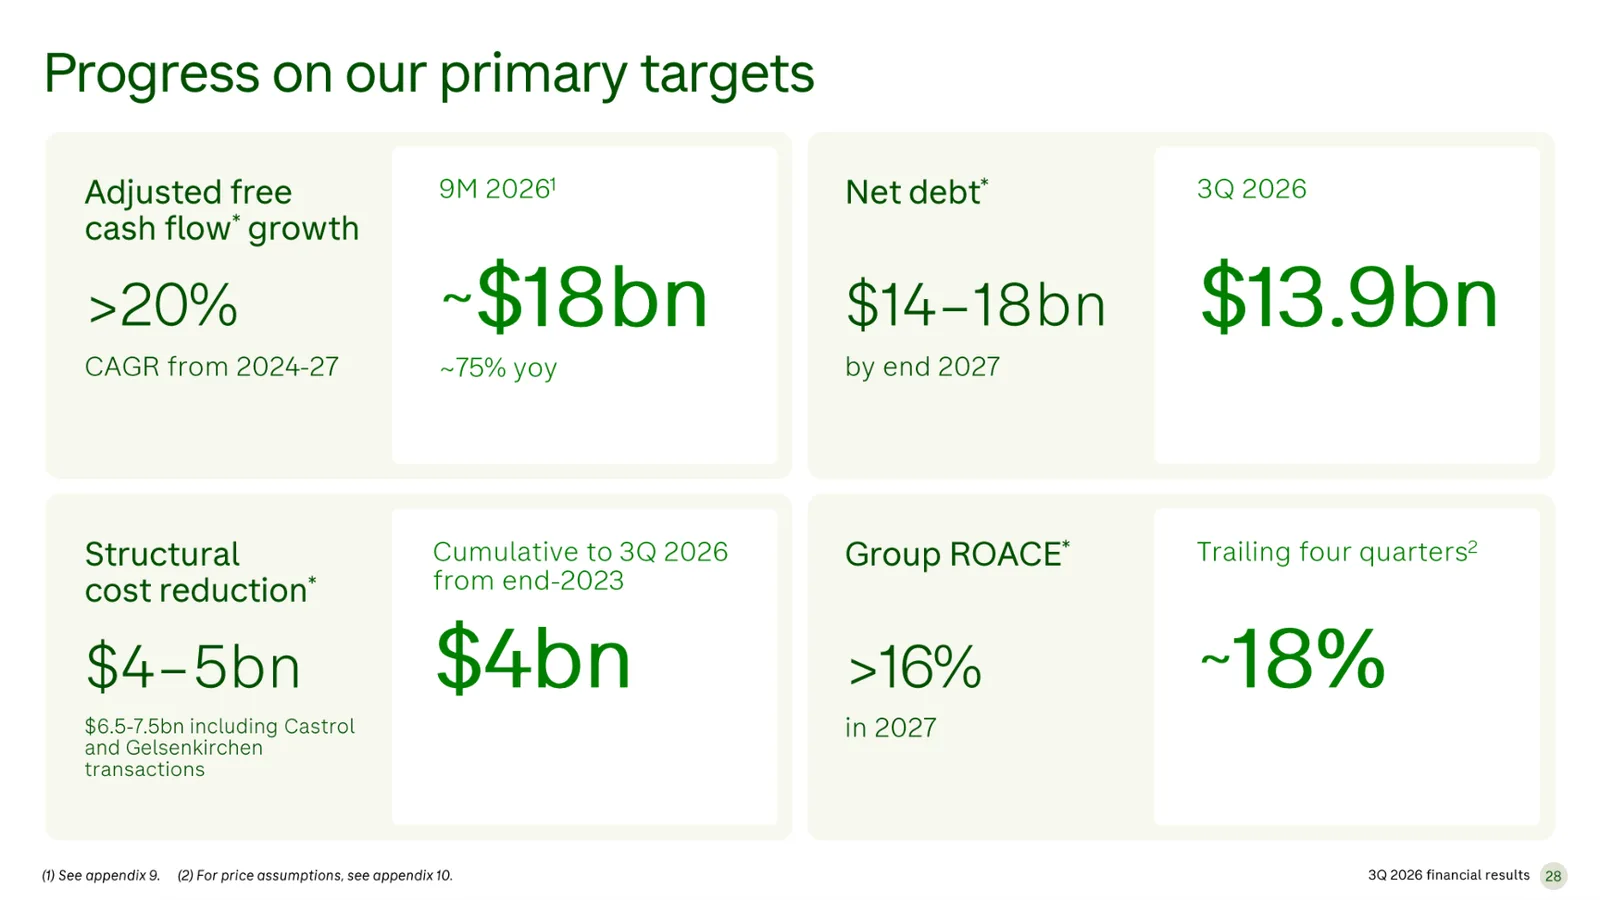
- Page 28 tracks the four primary targets set for 2027. Net debt, targeted at $14 billion to $18 billion by the end of 2027, is already at $13.9 billion, and structural cost reductions have reached $4 billion against a $4 billion to $5 billion goal. The other two are a compound annual growth rate in adjusted free cash flow above 20% from 2024 to 2027 and group ROACE above 16% in 2027, against about 18% over the trailing four quarters. In the results release O’Neill said “We have now delivered our net debt and structural cost reductions targets”.
- Company disclosure (Q3 2026 results script, October 30, 2026): Management said “our intent now is to prioritise the use of excess cash flow to address our remaining Deepwater Horizon liabilities in full”, described buybacks as a tool to use “as and when appropriate” and promised more detail on the capital frame in December. The dividend, it said, is “our first call on cash flow”.
- Page 33 shows where Q3 cash went. From $14.8 billion of operating cash flow, $3.0 billion funded capital expenditure, $1.3 billion paid dividends, $1.2 billion went to hybrid redemptions and payments and $0.8 billion to leases, leaving $8.4 billion to cut net debt. Over nine months working capital absorbed $6.5 billion, split into $3.1 billion of seasonal and price effects, $0.7 billion of payment timing and $2.8 billion the company treats as permanent, with about $0.5 billion expected back in Q4.
- Checked against the filings, the $16.2 billion fall in obligations over two quarters came from net debt ($11.4 billion), hybrids ($3.9 billion) and the settlement liability ($0.9 billion), with leases flat at $13.3 billion. Over nine months shareholders received $3.925 billion of dividends and $562 million of first-quarter buybacks, 15.7% of operating cash flow; the retired 30% to 40% guidance would have meant $8.6 billion to $11.4 billion.
The Bull and Bear Case for BP Shares
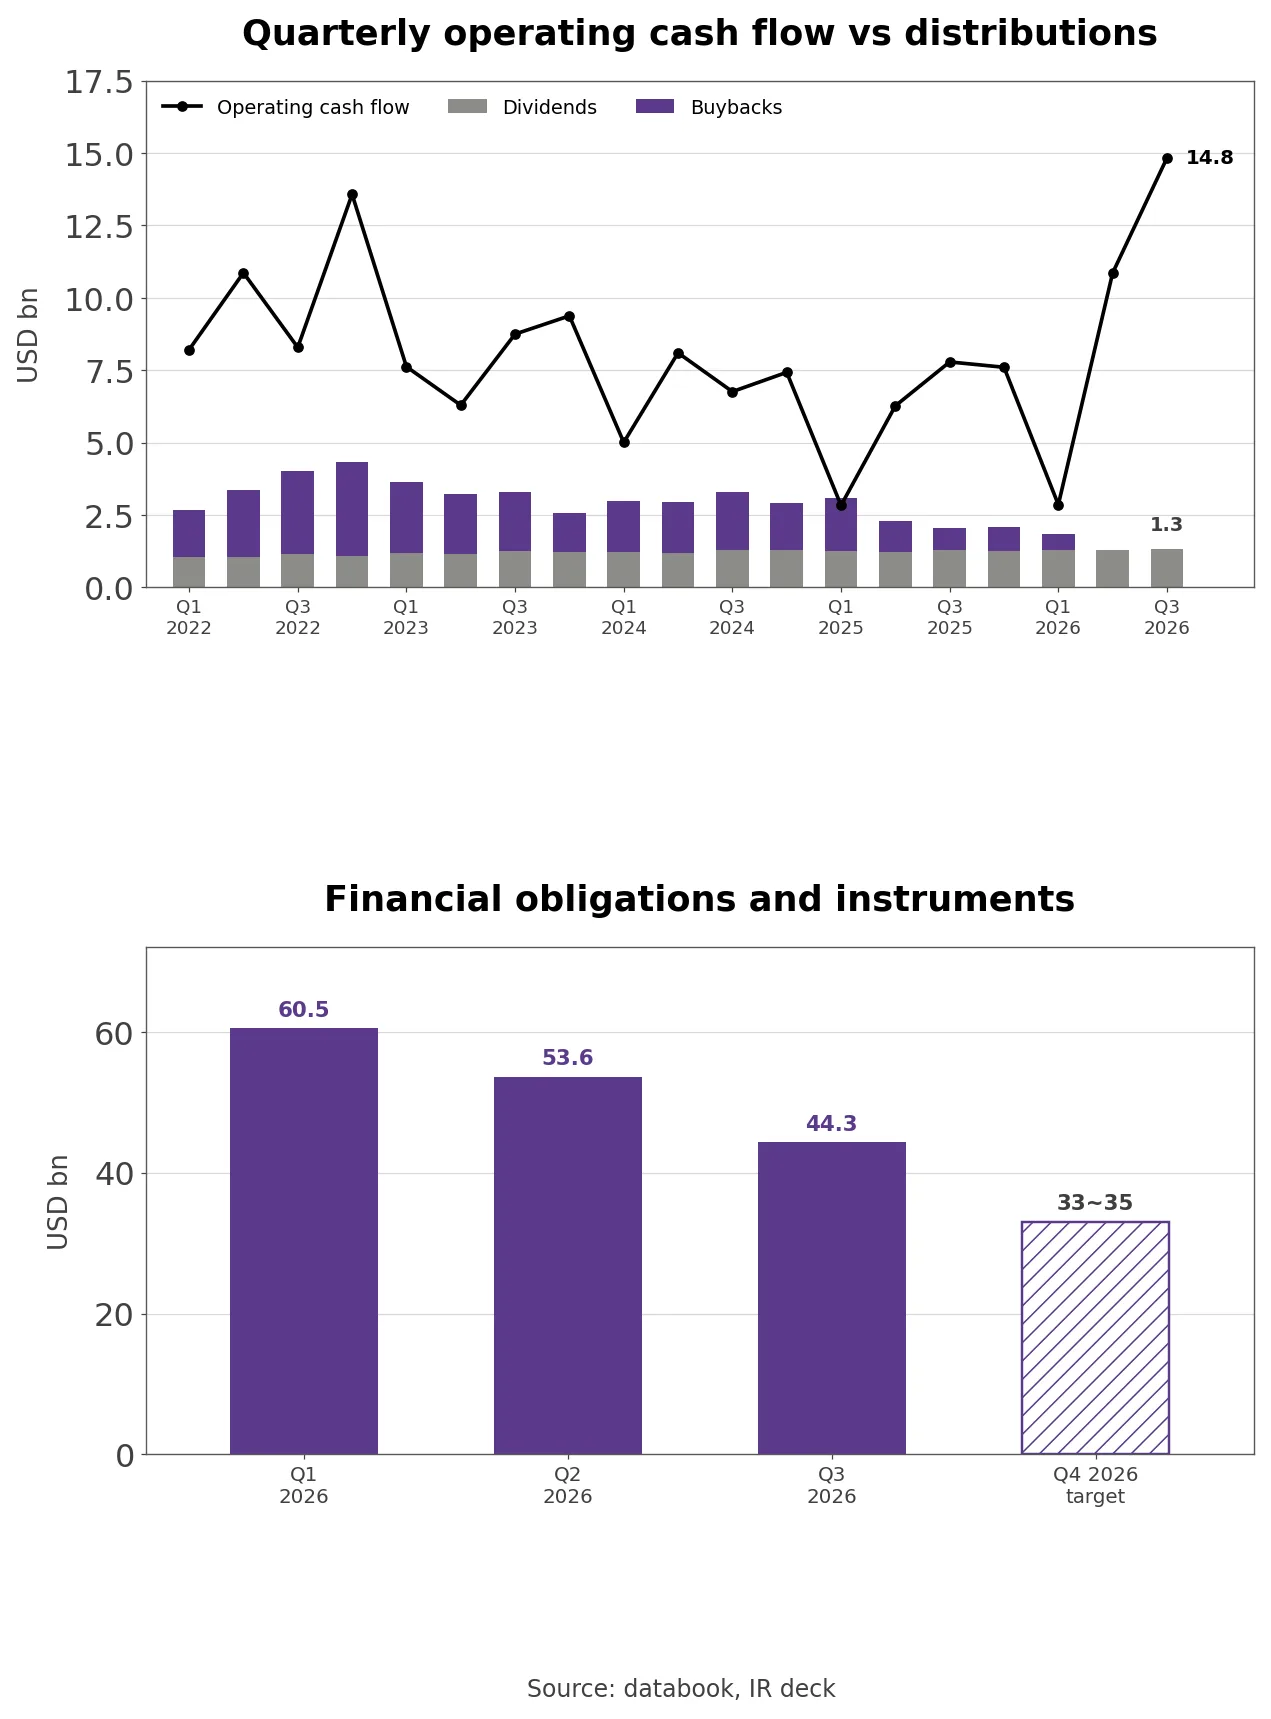
- The bull case is cash and balance sheet repair. Nine-month operating cash flow rose +68.9% to $28.5 billion, net debt is already below the bottom of the 2027 range, and a December capital framework that reopens buybacks would turn that repair into shareholder returns.
- The bear case is price dependence and volume. BP itself attributes about $7.7 billion of $25.7 billion in nine-month adjusted free cash flow to prices above plan, production is -6.0% lower than a year ago, and 2026 guidance of 2.21 million to 2.25 million barrels a day sits below the 2.312 million of 2025. Without buybacks, the ADS-equivalent share count is +1.2% higher than at the end of 2025.
From the Rosneft Exit to the Buyback Pause
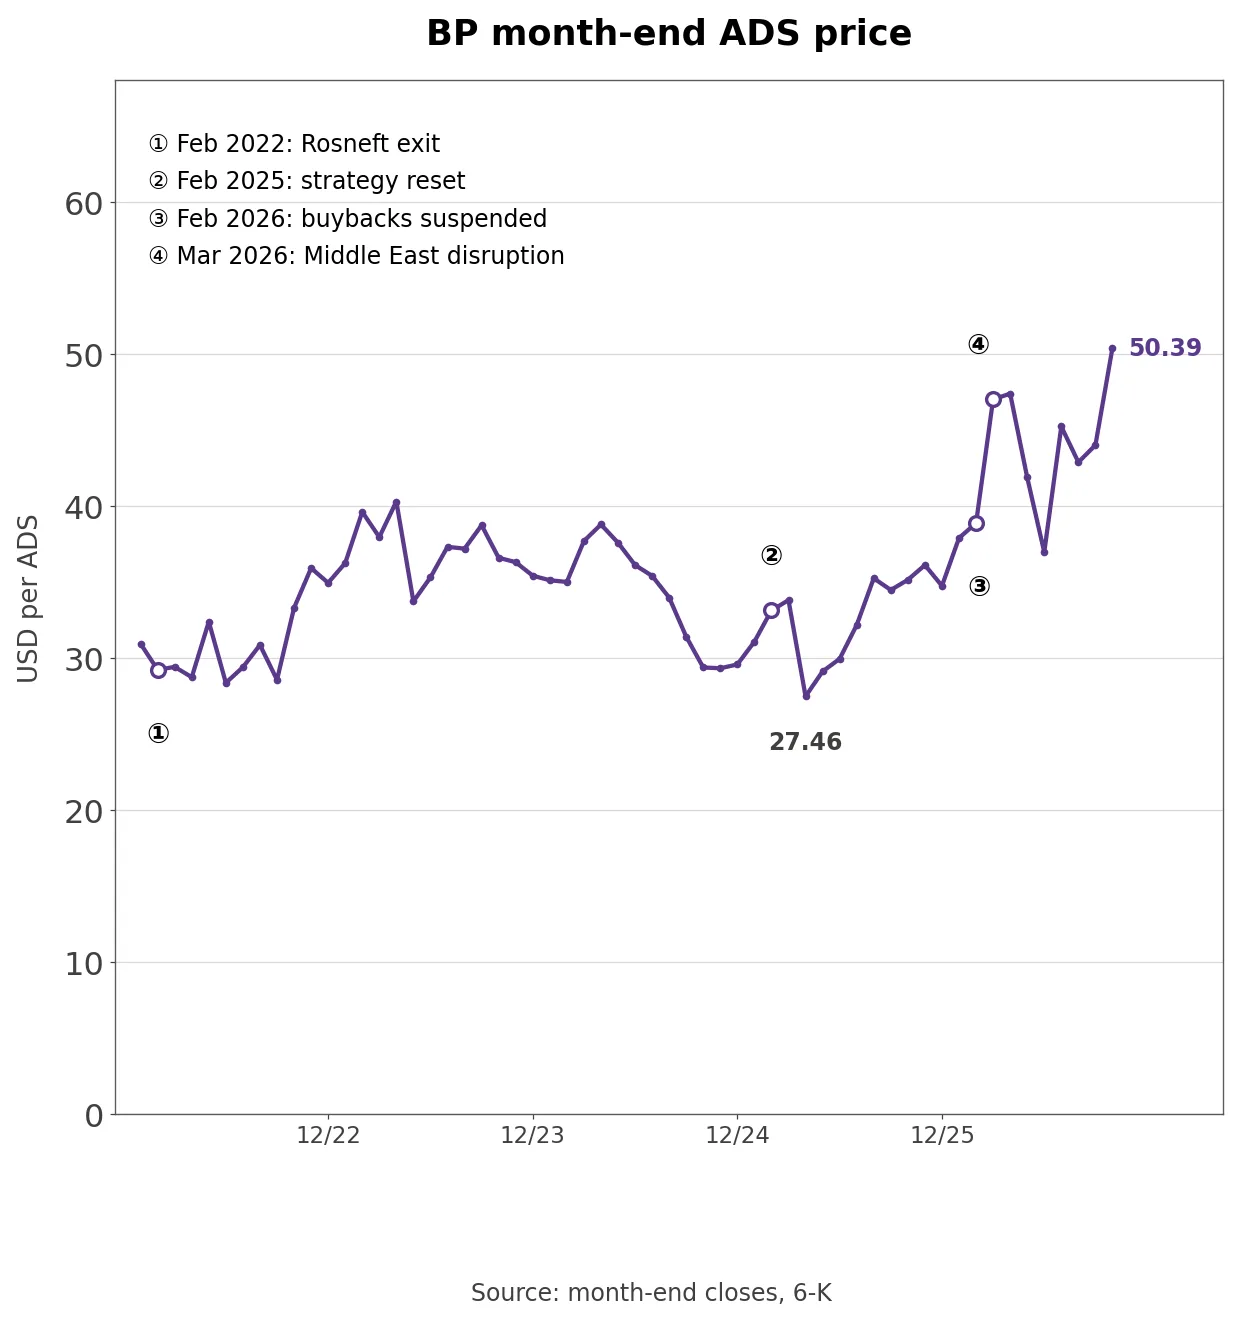
- BP’s last five years start in Russia. On February 27, 2022, then-CEO Bernard Looney stepped down from Rosneft’s board and BP announced its exit, and first-quarter IFRS profit attributable to shareholders was a $20.4 billion loss. High oil prices then lifted 2022 underlying profit to $27.7 billion, and BP bought back about $10 billion of stock that year.
- From 2023 to 2025 lower prices and margins cut underlying profit to $13.8 billion, $8.9 billion and $7.5 billion. BP still raised the quarterly dividend from 6.61 cents to 8.32 cents per ordinary share and spent $7.9 billion, $7.1 billion and $4.5 billion on buybacks, and net debt climbed to $27.0 billion by Q1 2025. A capital markets update on February 26, 2025 reset the strategy around capital expenditure of $13 billion to $15 billion a year for 2026 and 2027 and distributions of 30% to 40% of operating cash flow, and the ADS closed April 2025 at a low of $27.46.
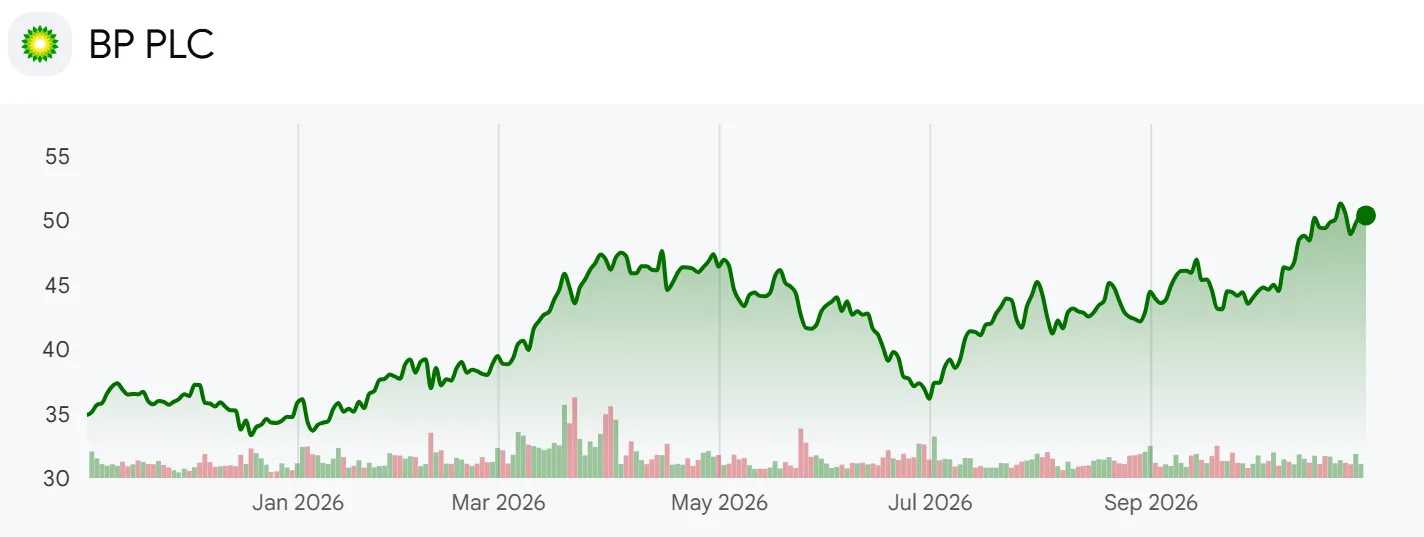
- With the Q4 2025 results in February 2026, the board said it “has decided to suspend share buybacks” and send excess cash to the balance sheet. When Middle East disruption sent Brent higher in March, the month-end close rose +20.9% to $47.00, and the October close of $50.39 is the high of the period and 1.63 times January 2022.
Underlying Profit vs IFRS Profit
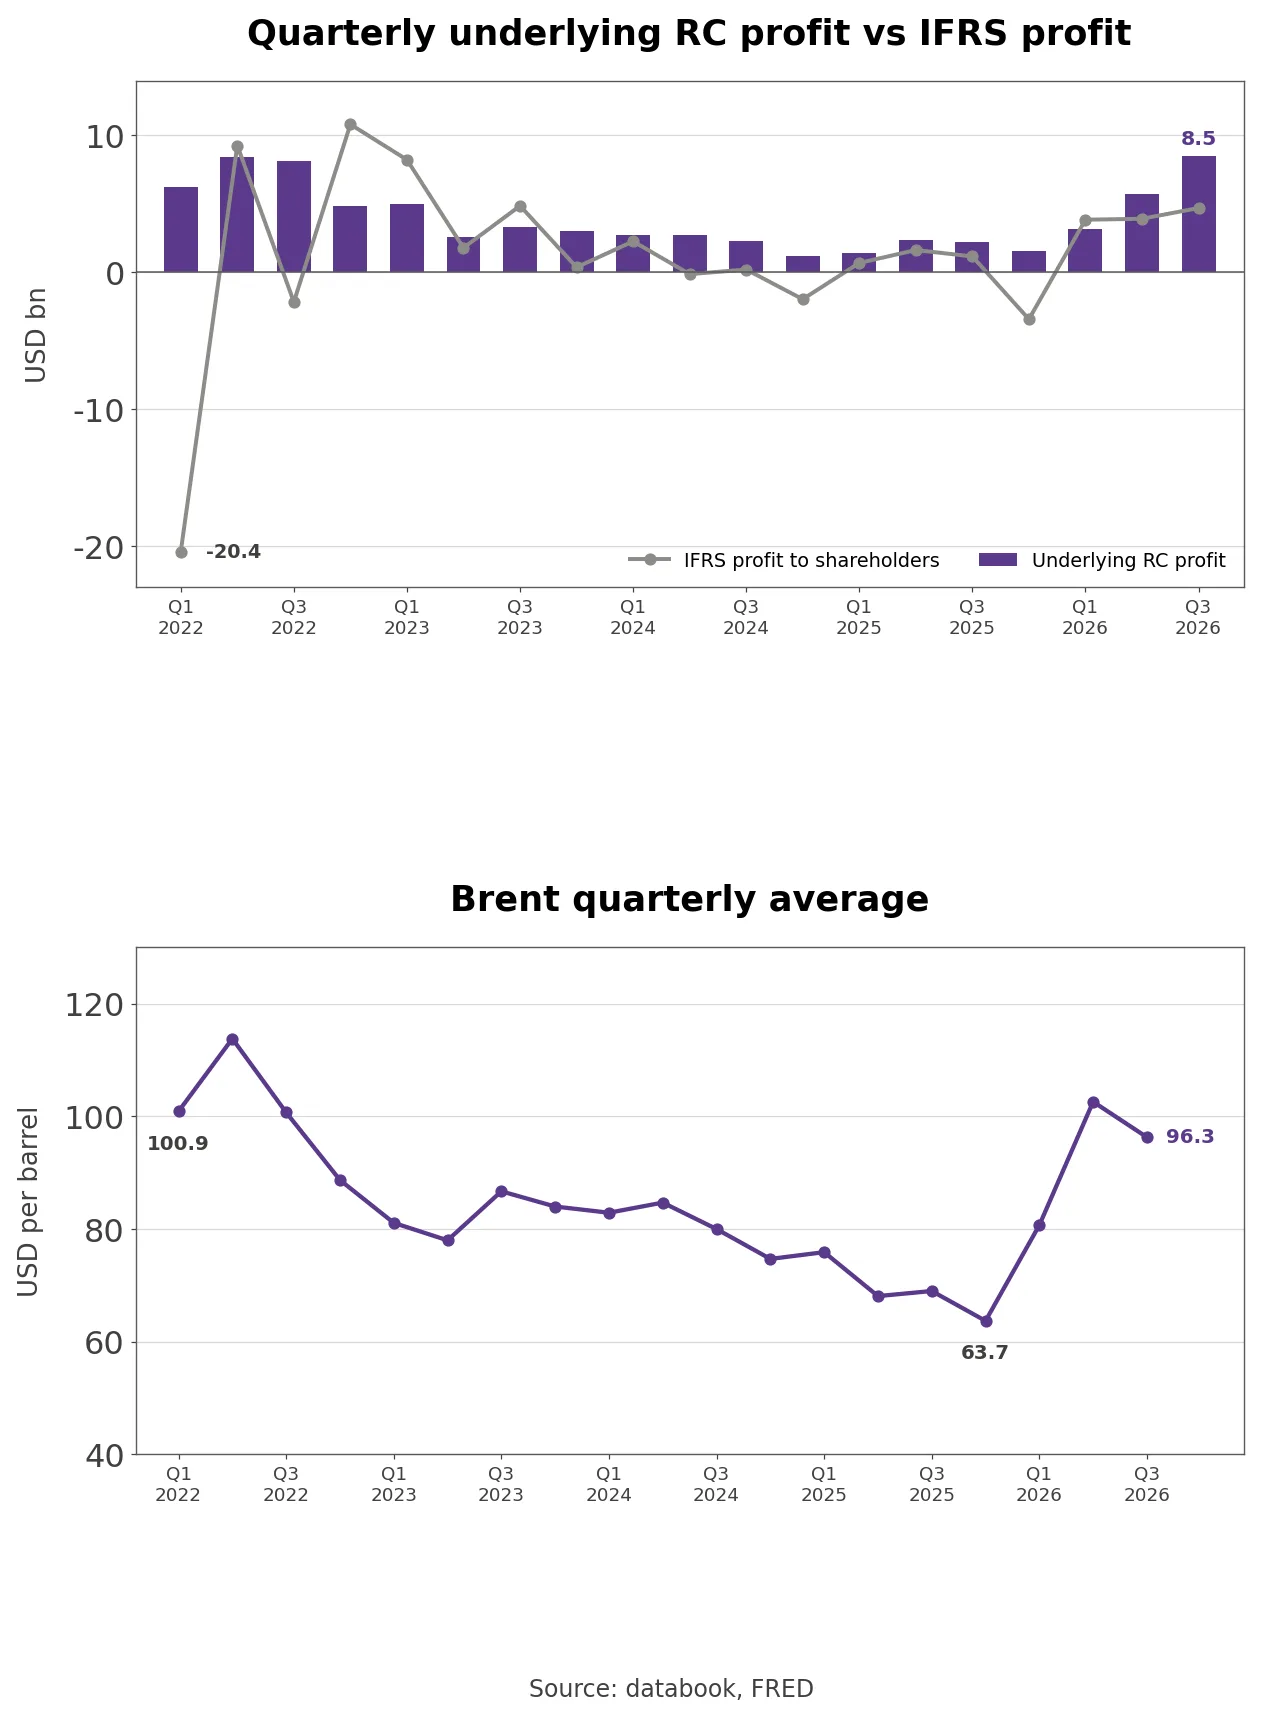
- BP’s earnings need two adjustments. The first is inventory holding gains: when oil prices rise, crude bought earlier becomes worth more on paper and IFRS profit inflates, so BP restates results at current replacement cost. Q3 inventory holding gains were $2.0 billion before tax. The second is adjusting items such as impairments and fair value effects, which took $5.9 billion before tax out of the quarter.
- Own calculation (group databook, 19 quarters): Underlying replacement cost profit was $27.7 billion in 2022, $13.8 billion in 2023, $8.9 billion in 2024 and $7.5 billion in 2025, while IFRS profit attributable to shareholders was a $2.5 billion loss, $15.2 billion, $381 million and $55 million. Nine months of 2026 already produced $17.4 billion of underlying profit, more than all of 2023.
- The Q1 2022 loss came from the Rosneft write-off and the $3.4 billion Q4 2025 loss from $4.3 billion of post-tax adjusting items. Underlying profit per ADS was $2.88 for 2025 and $7.32 for the trailing four quarters, and Q3’s $3.26 is the highest of the 19 quarters, above the 2022 peak of $2.61.
How Much of the Profit Came From Oil and Refining Prices?
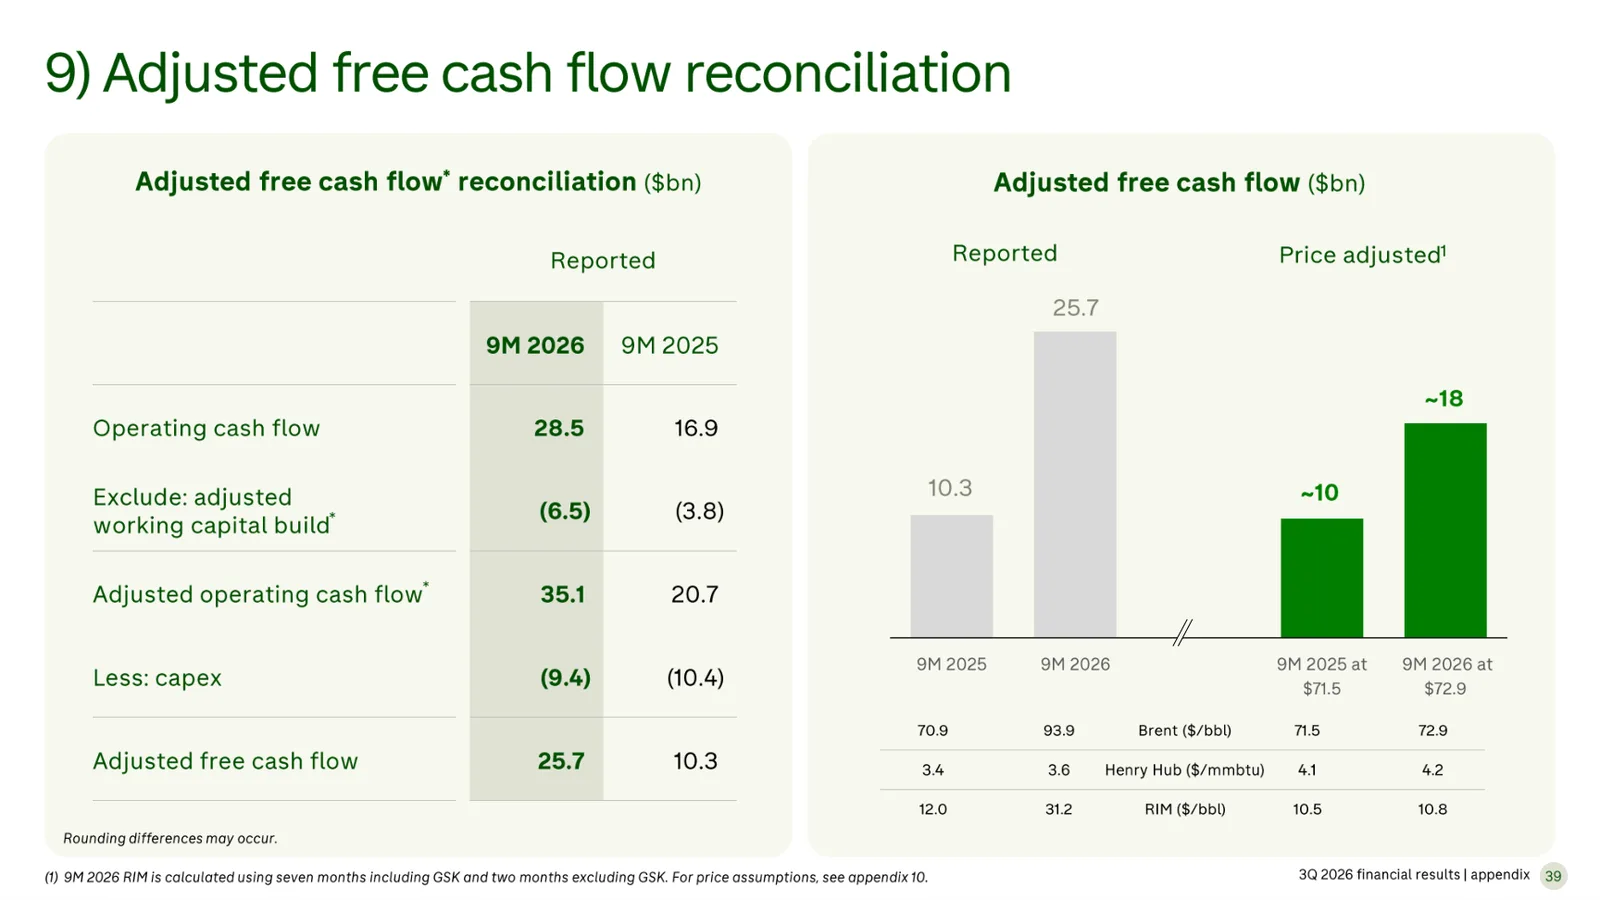
- Page 39 is BP’s own price adjustment. Nine-month adjusted free cash flow was $25.7 billion, 2.50 times the $10.3 billion of a year earlier, but restated at planning prices (Brent $72.9, Henry Hub $4.2 and RIM $10.8 this year) the two periods come to about $18 billion and about $10 billion. BP’s point is that free cash flow grew even without the price tailwind; the gap of about $7.7 billion (30.0%) between reported and price-adjusted is what prices above plan added.
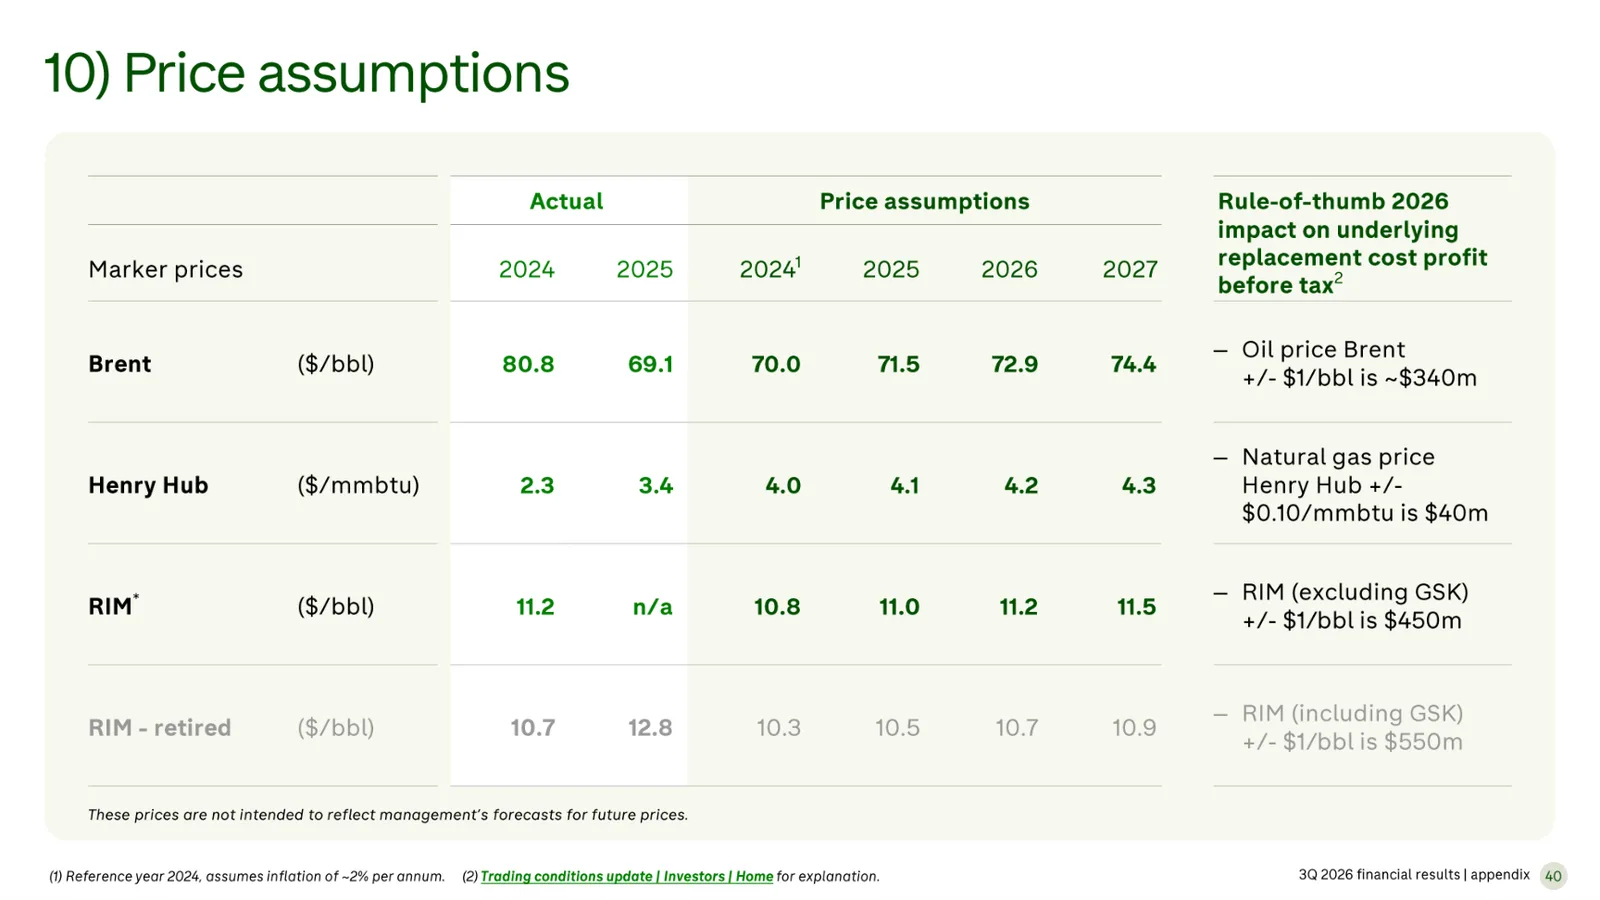
- Page 40 gives the sensitivities. Each $1 per barrel of Brent moves annual underlying profit before tax by about $340 million, and each $1 of RIM by $450 million, or $550 million including Gelsenkirchen. A footnote states “These prices are not intended to reflect management’s forecasts for future prices”. With Gelsenkirchen sold, a dollar of RIM is now worth $450 million instead of $550 million, and Q4 throughput guidance drops to 1.16 million to 1.21 million barrels a day.
- Own calculation (Q3 IR deck pages 37, 39 and 40): Nine-month Brent of $93.9 was $21.0 above plan and RIM of $31.2 was $20.4 above. Applying the sensitivities to three quarters of a year puts the pre-tax profit from prices above plan at $12.2 billion to $13.8 billion. That is 41% to 46% of nine-month underlying profit before interest and tax of $30.0 billion, and set against the $15.0 billion gain from a year earlier it covers 82% to 92%.
- After the 31% nine-month underlying tax rate that is $8.4 billion to $9.5 billion, close to the $7.7 billion price effect on page 39. On the Q4 assumptions of $110 Brent and $40 RIM, the same arithmetic puts about $6.4 billion of pre-tax profit from prices above plan into a single quarter, and FRED daily Brent ran at $123 to $128 a barrel in late October.
How the Three Segments Make Money
- Gas & low carbon energy combines natural gas production, liquefied natural gas, gas and power trading, and low carbon businesses such as offshore wind and hydrogen. Q3 output was 784,000 barrels of oil equivalent a day at $53.92 per barrel, gas realized $8.65 per thousand cubic feet against $6.41 a year earlier, and the LNG portfolio was 27 million tonnes a year in 2025. The segment took $3.4 billion of Q3’s impairments in transition businesses, and its spending tilts to gas: Q3 capital expenditure was $816 million for gas and $100 million for low carbon, and nine-month low carbon spending of $219 million compares with $332 million a year earlier.
- Oil production & operations covers US onshore shale through bpx energy, Gulf of America platforms and fields such as Kirkuk in Iraq. Q3 output was 1.436 million barrels a day against 1.556 million, at $57.59 per barrel; liquids realized $76.42, or 78.8% of Q3 Brent, and upstream unit production cost was $6.54 per barrel against $6.19. The Culzean gas field sale in the UK North Sea and a smaller Latin American stake reduced volumes.
- Customers & products is the downstream: refining and trading (products) plus retail fuel, convenience and Castrol lubricants (customers). Its $6.9 billion of Q3 underlying profit was 50.8% of the three-segment total of $13.7 billion. Products alone earned $5.725 billion, 10.43 times the $549 million of a year earlier and 41.9% of the total, while customers earned $1.223 billion against $1.167 billion, including $285 million from Castrol. Over nine months products made $11.1 billion against $1.0 billion, and customers made $4.0 billion, +38.7% on a year earlier.
- The portfolio is shrinking. Gelsenkirchen was sold at the end of July, 65% of Castrol is being sold to Stonepeak with about $6 billion of 2026 proceeds expected from it, and sale processes are under way for Lightsource bp and the US biogas business. Divestment and other proceeds are guided to about $8 billion for 2026, and from 2027 BP reports under the new segment model announced on June 9. On the other side, BP agreed in August to buy Woodside’s 70% of the Calypso gas project in Trinidad and Tobago and won operatorship of phase 2 of the Loran gas field off Venezuela. Capital expenditure is guided to $13.5 billion to $14.0 billion for 2026, and Gulf of America settlement payments to about $1.6 billion pre-tax.
BP vs Shell TotalEnergies and Exxon Mobil
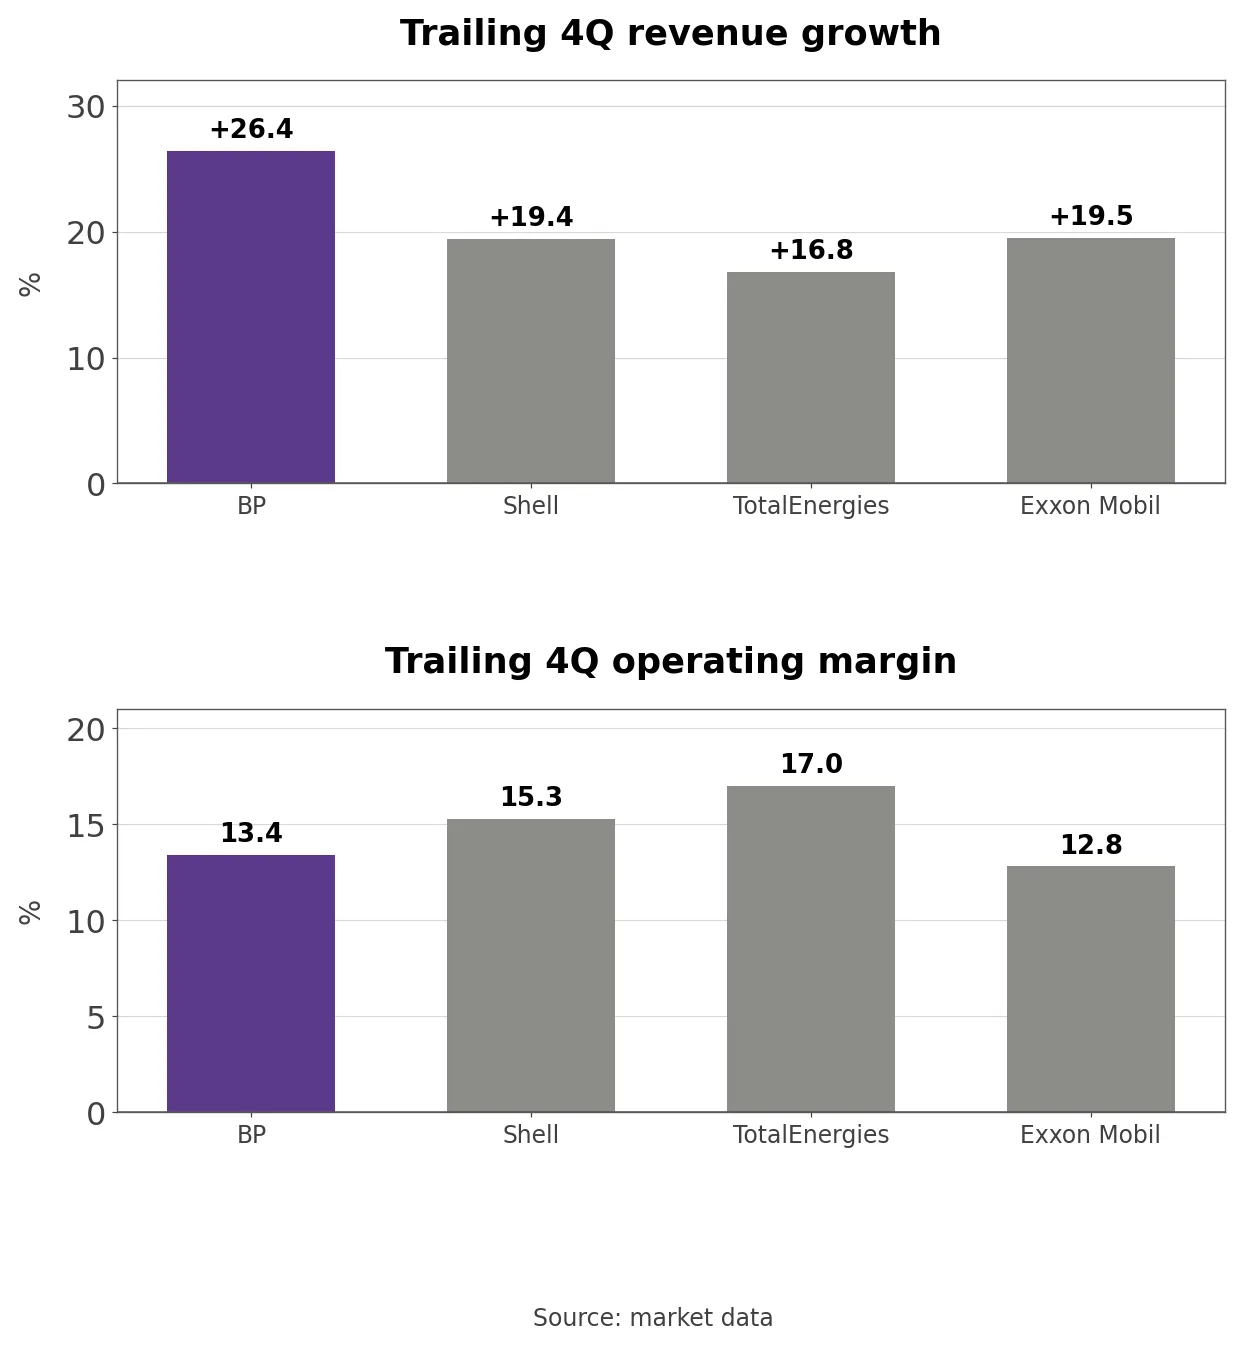
- The comparison uses three integrated oil majors that reported through September: Shell (UK), TotalEnergies (France) and Exxon Mobil (US). Market value is $763.8 billion at Exxon Mobil, $308.4 billion at Shell, $210.5 billion at TotalEnergies and $129.9 billion at BP, so Exxon Mobil is 5.9 times BP’s size. On market data, TTM revenue growth was +26.4% at BP, +19.4% at Shell, +16.8% at TotalEnergies and +19.5% at Exxon Mobil.
- Operating margins were 17.0% at TotalEnergies, 15.3% at Shell, 13.4% at BP and 12.8% at Exxon Mobil, and one-year market value changes were +42.0% at BP, +34.2% at Shell, +48.3% at TotalEnergies and +53.8% at Exxon Mobil. With half of Q3 profit coming from customers & products, BP’s refining weight put more of the margin spike into its revenue growth.
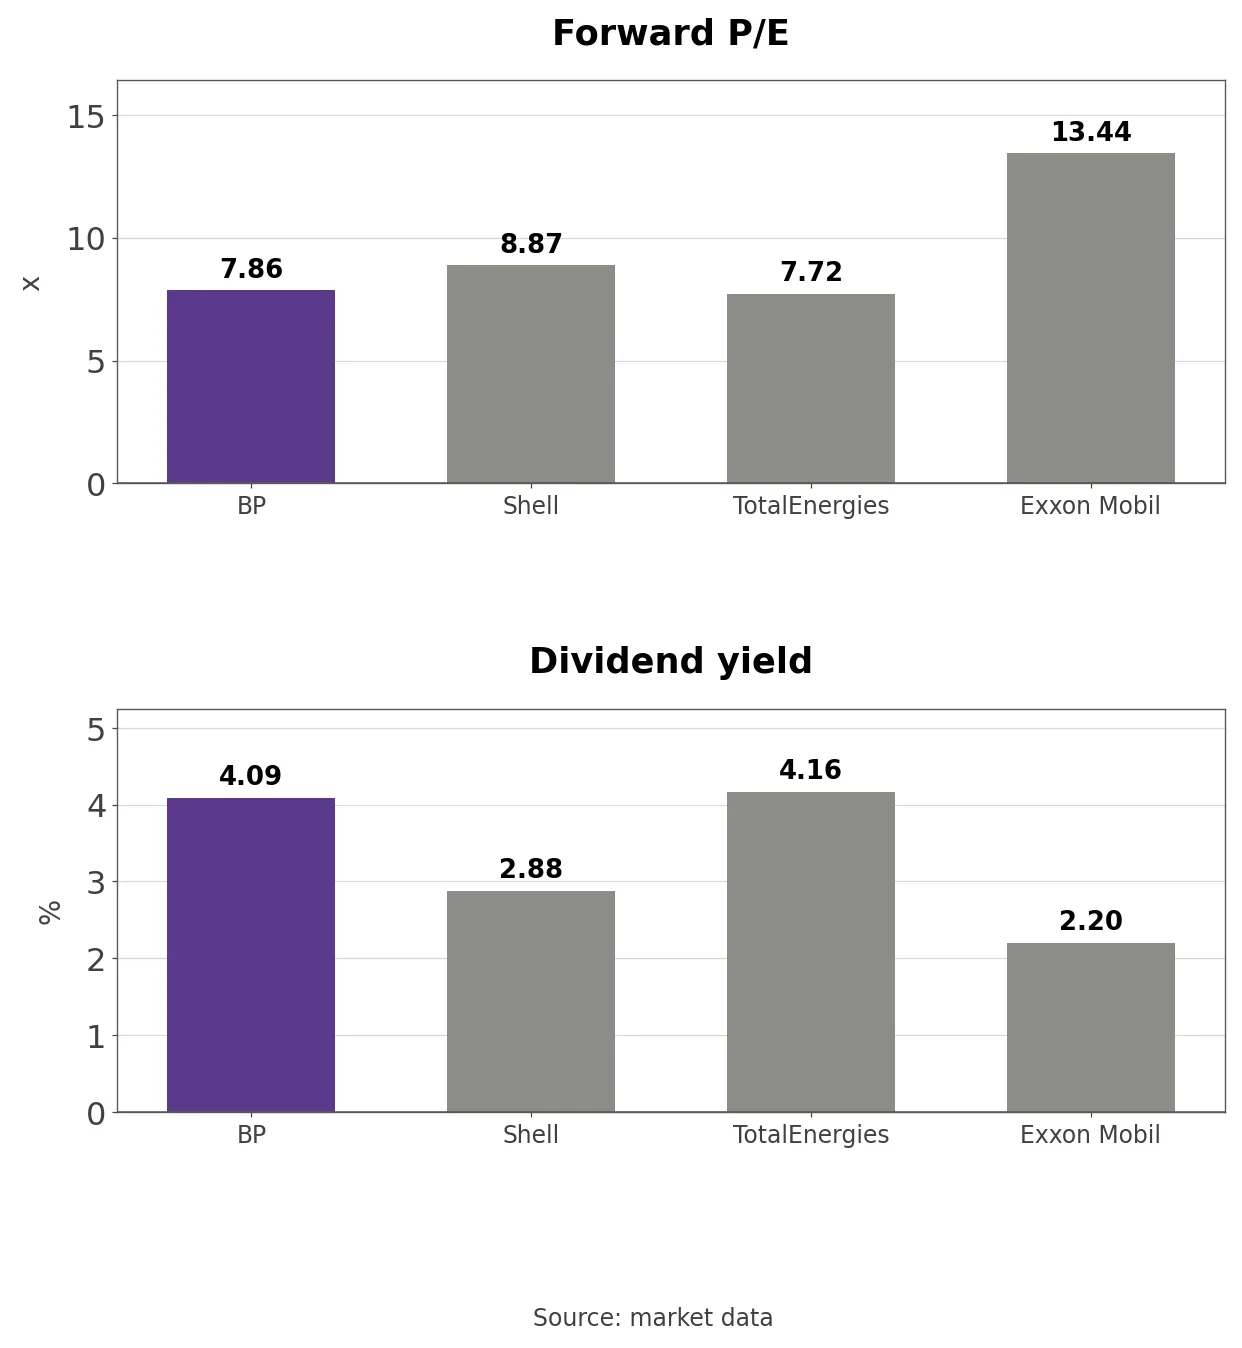
- Forward P/E is 7.86 at BP, 8.87 at Shell, 7.72 at TotalEnergies and 13.44 at Exxon Mobil, and dividend yields are 4.09%, 2.88%, 4.16% and 2.20%. A forward P/E close to Shell’s implies that estimates do not carry today’s margins far forward. Shareholder returns are dividends only for now: the Q3 dividend of 8.66 cents per ordinary share is +4.1% on a year ago, or $2.08 a year per ADS, and BP is not in a net cash position, with $13.9 billion of net debt.
The P/E and Price-to-Book Band
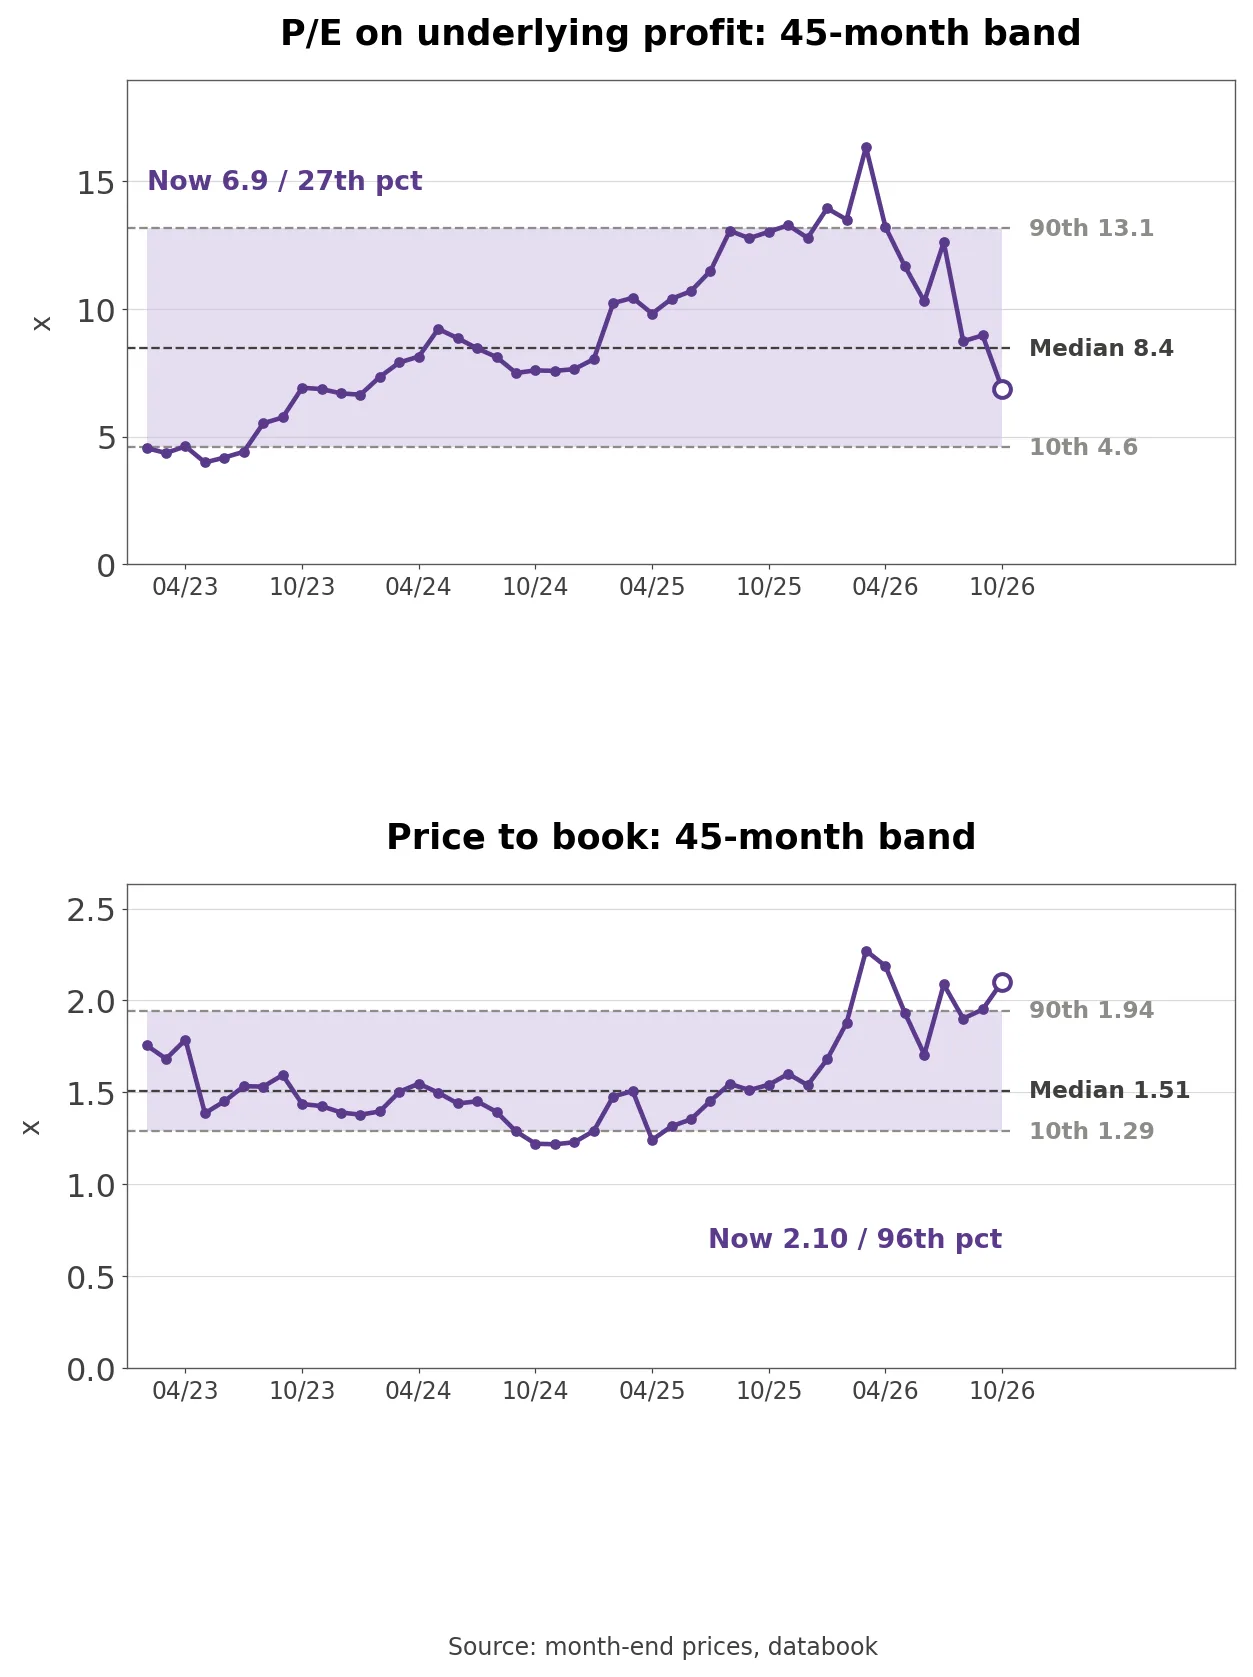
- Quarterly underlying profit in the databook starts in Q1 2022, so the band covers 45 months from February 2023, the first month with four quarters. IFRS P/E is left out because inventory effects and impairments swing it every quarter, and price to book uses bp shareholders’ equity excluding hybrids and non-controlling interests (the 1.63 on market data uses total equity).
- Own calculation (month-end prices and group databook): On trailing underlying profit of $7.32 per ADS, the P/E of 6.88 sits at the 26.7th percentile of 45 months (median 8.45, high 16.32), while price to book of 2.10 sits at the 95.6th percentile (median 1.51).
- The two multiples point in opposite directions. Rising earnings make the P/E look low, but on book value the shares are in the top 5% of the range. bp shareholders’ equity rose +17.2% from $53.1 billion at the end of 2025 to $62.2 billion, while the month-end ADS price rose +45.1% from $34.73 to $50.39. The same $50.39 is 17.5 times 2025 underlying profit per ADS of $2.88 and 3.9 times Q3 annualized.
Three Conditions That Move the Stock
- The refining indicator margin produced half of Q3’s profit. RIM holding near the $40 Q4 assumption, or evidence that margins above the $10.8 plan will last, would support the stock; a return to the $10s as Middle East disruption eases would remove the price effect behind 41% to 46% of nine-month underlying profit.
- Financial obligations are the gate to renewed buybacks. Obligations landing inside the $33 billion to $35 billion target at year-end and a December framework that puts numbers on buybacks would support the shares; more cash tied up in settling Deepwater Horizon liabilities, or a delayed target, would weigh on them.
- Production and reliability decide how much of the price effect BP captures. Holding 2026 production guidance of 2.21 million to 2.25 million barrels a day and getting plant reliability back above the company’s target would support the stock, while production drifting toward the 2.09 million low end of Q4 guidance would hurt it.
What to Watch in the December Capital Framework
- December brings the capital framework BP has promised: the conditions for restarting buybacks, the approach to the remaining Deepwater Horizon liabilities and capital expenditure beyond 2026. The Q4 report, likely in early February, should then show whether obligations reached $33 billion to $35 billion, whether the Castrol proceeds arrived and how much of the Q3 refining profit held up. It will also be the last quarter reported under the current three segments.
- One question stays open. BP is using cash that prices handed it to shrink its obligations first. When this price cycle ends, will shareholders be left with a stronger balance sheet, or with a larger share count and lower earnings?
Related Analysis
- Sector RS Rank Oct 13: Refiners Lead, Banks Slip: the October 13 US session, when refiners led the market as BP published its third-quarter trading statement, useful for comparing how refining margins showed up in share prices.
- Sector RS Rank Oct 1: Oil Jumps, Biotech Slips: a session when oil prices jumped and US refiner Marathon Petroleum moved with them, a reference point for the price environment behind BP’s third quarter.