Apple (NASDAQ: AAPL) closed fiscal 2026 with record revenue of $478.8 billion, +15.1%, and told investors to expect the biggest quarter in its history for the three months to December, with sales up 7% to 10%. The same guidance puts gross margin at 45% to 46%, below the 46.9% Apple earned in the September quarter once tariff refunds are taken out. Plug those ranges in and December-quarter operating income lands anywhere from 4.8% below to 2.9% above a year earlier. Management blames memory prices, and the balance sheet shows that cost arriving before the income statement does: inventory of $14.5 billion is 2.5 times last year’s level, and manufacturing purchase obligations have climbed to about $90 billion.
Apple sells iPhone, Mac, iPad, Apple Watch and AirPods, and runs services such as the App Store, iCloud, Apple Music, advertising and Apple Pay on an installed base of more than 2.5 billion active devices. At $338.32 a share the company is worth $4.94 trillion on market data, and fiscal 2026 diluted GAAP earnings per share were $8.98. John Ternus, who ran hardware engineering, succeeded Tim Cook as chief executive on September 1, and the fourth-quarter call on November 2 was his first.
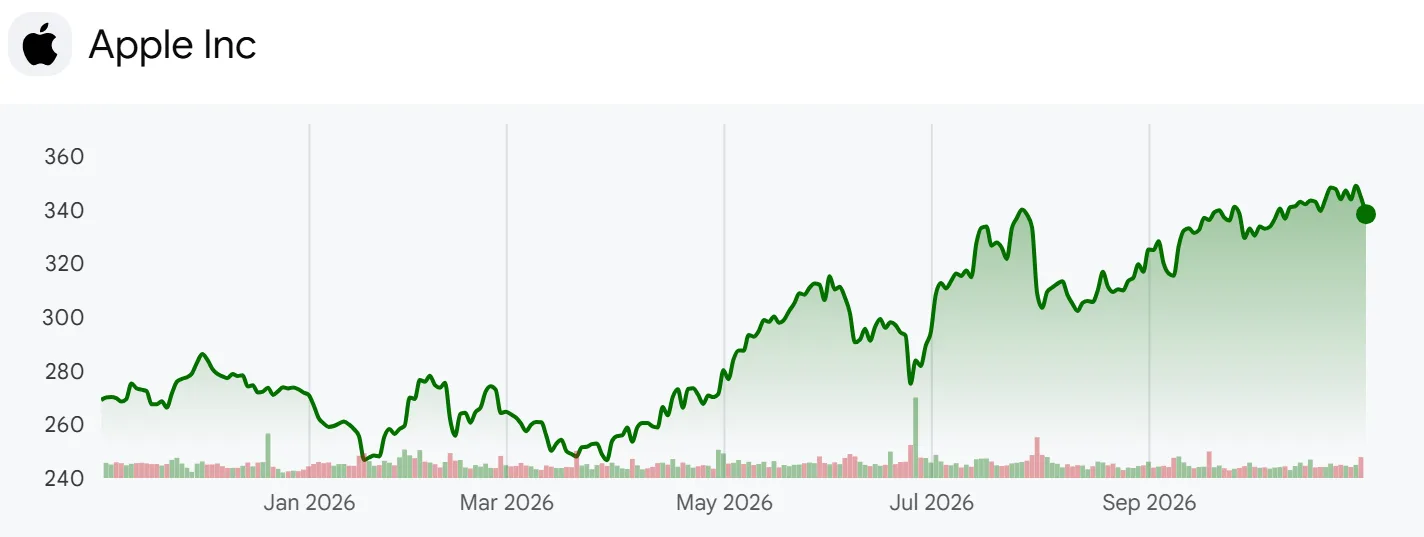
Apple one-year share price chart
I lined up the Q4 FY2026 earnings release, the November 2 earnings call, all 32 quarterly earnings releases since fiscal 2019, and the manufacturing purchase obligation disclosures in 20 quarters of 10-Q and 10-K filings. The analysis does not use the fiscal 2026 10-K, so the September purchase obligation figure comes from the increase management gave on the call, and the tariff refund effect is only available as the company’s rounded “approximately 1 percentage point.”
The Bull and Bear Case for Apple Stock
The bull case is demand. Fourth-quarter iPhone revenue was $57.6 billion, +17.5%, and Mac revenue rose +23.7%, both while supply was short. Greater China grew 28.0% in fiscal 2026 after two years of decline. Services were 27.6% of fourth-quarter revenue but produced 43.7% of gross profit, and Apple returned 70.4% of its $145.1 billion of operating cash flow to shareholders over the year. The December-quarter revenue guide sits on top of a quarter that grew 15.7% a year ago.
The bear case is cost. Ternus told analysts that “What we’re seeing with memory pricing right now is unprecedented,” and the offsets Apple is using, price increases and cheaper inventory bought earlier, are shrinking. Services growth is guided to 8% to 9%, below the 9.8% just reported, and Siri AI adds server costs. All of this arrives while price to sales sits at the top of its 87-month range, so investors are paying the most they have paid for each dollar of revenue in a year when each dollar keeps less gross profit.
From the 2020 Split to a New CEO
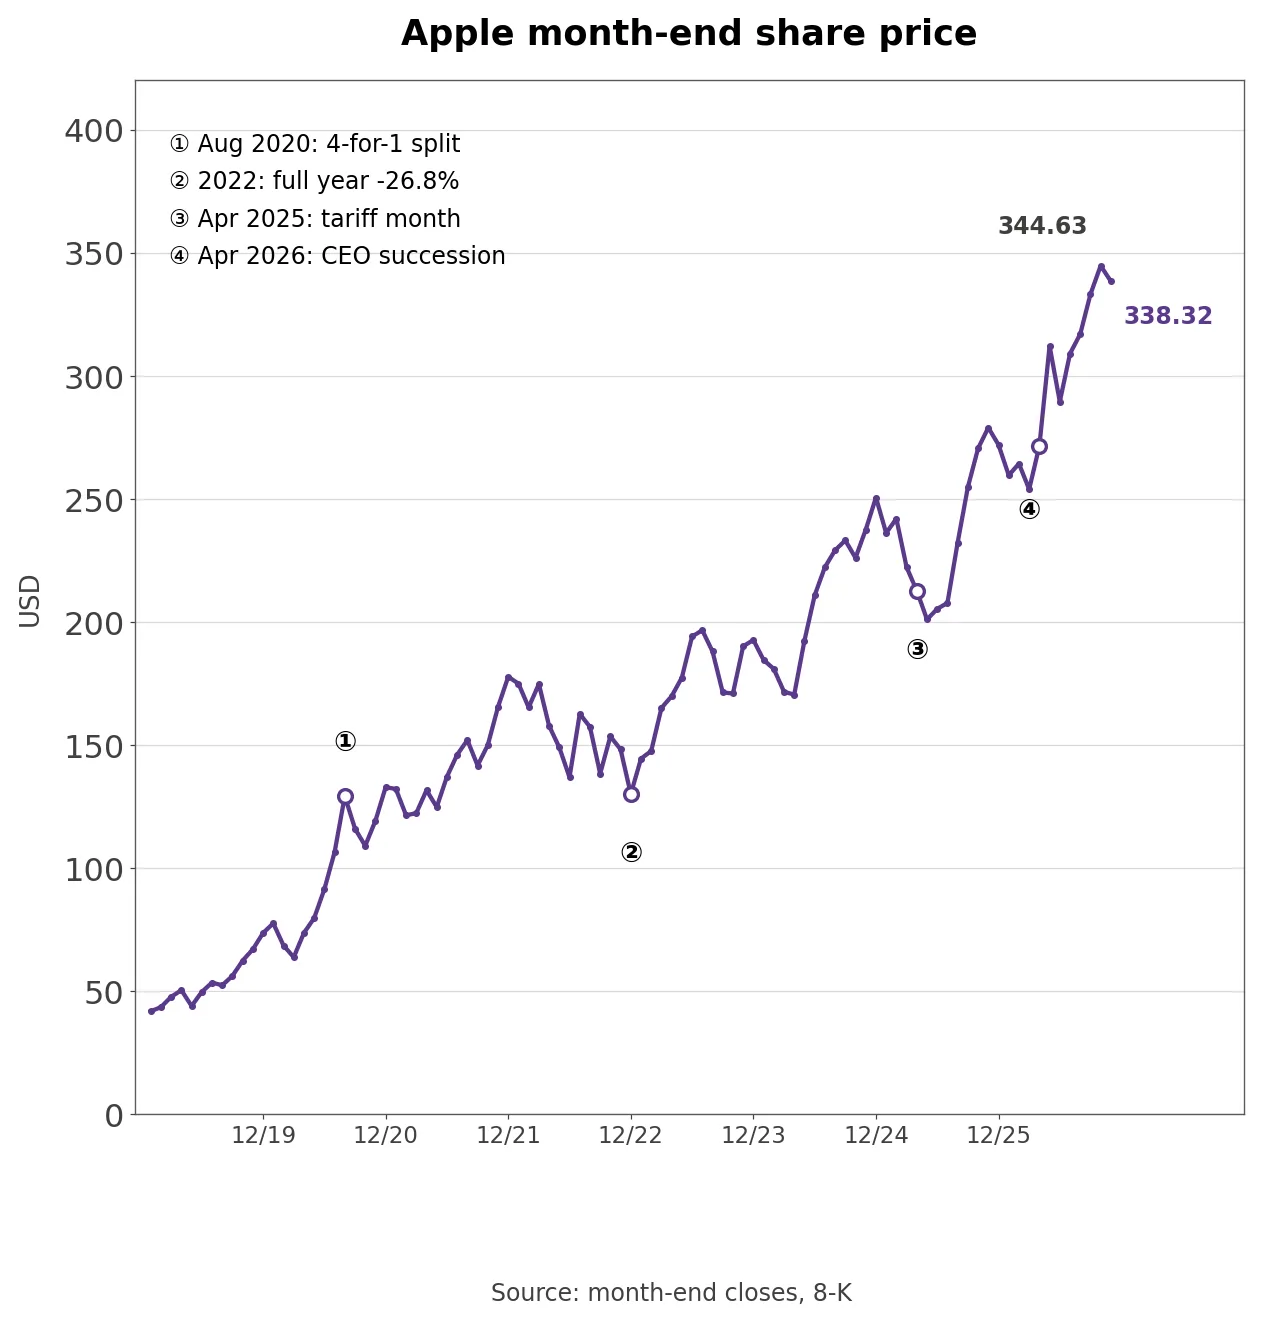
Apple month-end share price over 95 months with four dates
Apple’s month-end close went from $41.61 in January 2019 to $344.63 in October 2026, 8.3 times higher. Around the four-for-one split in August 2020 the shares rose 86.2% in 2019 and 80.7% in 2020, then fell -26.8% in 2022. They gained 48.2% in 2023 and 30.1% in 2024, managed only 8.6% in 2025 as the April tariff announcements hit, and are up 24.4% so far in 2026.
The business underneath changed. In fiscal 2019 services were 17.8% of $260.2 billion of revenue and gross margin was 37.8%. In fiscal 2026 services were 25.8% and gross margin was 48.8%, while iPhone’s share barely moved, from 54.7% to 53.1%. Buybacks cut the diluted share count by 19.1% over the same period, and price to sales rose from 3.89 in September 2019 to above 10.
Two events in 2026 matter for this quarter. On February 20 the Supreme Court struck down tariffs imposed under the International Emergency Economic Powers Act, and Apple said in its third-quarter 10-Q that it had applied for refunds; those refunds lifted gross margin by about 2 points in the June quarter and about 1 point in September. On April 20 Apple announced that Cook would become executive chair and Ternus chief executive from September 1. The stock rose 6.9% that month and another 27.0% by the end of October.
What the December Guidance Implies for Profit
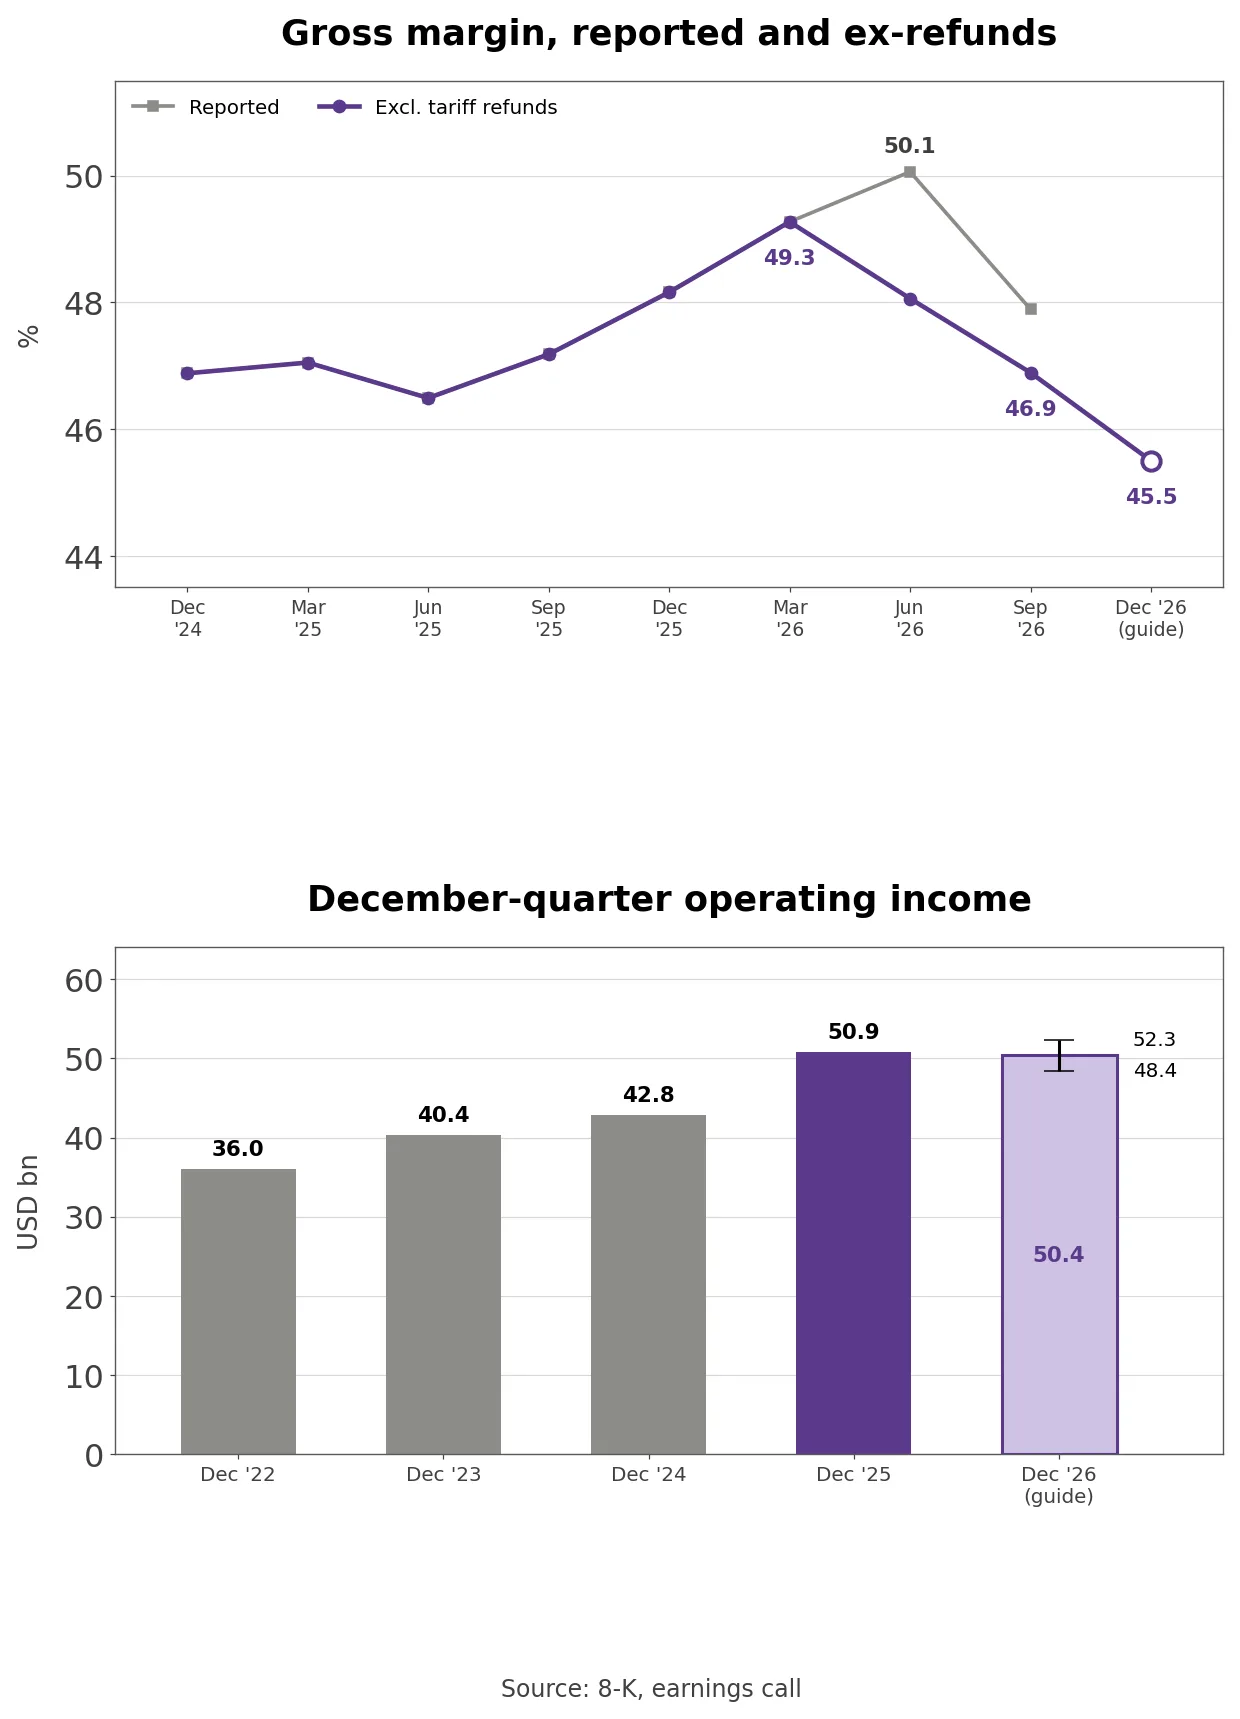
Apple gross margin reported and excluding tariff refunds with the December-quarter operating income guide range
Company disclosure (Q4 FY2026 earnings call, November 2): CFO Kevan Parekh guided December-quarter revenue growth of 7% to 10%, services growth of 8% to 9%, gross margin of 45% to 46% and operating expenses of $20.4 billion to $20.8 billion. He said the margin range “includes primarily the impact of higher memory costs, as well as some costs related to the ramp of Siri AI.”
Own calculation (earnings releases and the Q4 call): December-quarter revenue of $143.756 billion a year earlier, grown 7% to 10%, gives $153.8 billion to $158.1 billion. At 45% to 46% that is $69.2 billion to $72.7 billion of gross profit, flat to up 5.1% on last year’s $69.2 billion. Subtracting operating expenses leaves operating income of $48.4 billion to $52.3 billion against $50.852 billion a year earlier, a range of -4.8% to +2.9%, and the midpoints give $50.4 billion, down 0.9%.
The operating expense range is 11.0% to 13.2% above last year’s $18.38 billion, which matches the 11% to 13% growth Parekh gave on the call. Research and development rose 32.5% to $45.8 billion in fiscal 2026, and management said AI spending keeps rising even as the growth rate comes down.
Per share the picture is similar. Adding the guided $300 million of other income, taxing at the guided 17% and holding the diluted count at the fourth quarter’s 14.63 billion shares gives midpoint EPS of about $2.87, up 1.2% from $2.84. Buybacks would lift that slightly, but it is less than a sixth of fiscal 2026’s 20.4% EPS growth.
The fourth quarter already showed the squeeze starting. Operating income rose 9.9% to $35.6 billion and diluted EPS 13.5% to $2.10, which included $0.05 of tariff refunds, while revenue grew 11.7%.
How Much of Apple’s Margin Decline Is Memory?
Fourth-quarter gross margin was 47.9% and products gross margin 37.2%, and the release says both include roughly 1 point from tariff refunds. The June quarter’s 50.1% included about 2 points. Excluding the refunds, gross margin went from 49.27% in March to 48.06% in June and 46.89% in September, and the December guide midpoint is 45.5%, a drop of 3.77 points in three quarters.
Parekh told analysts that excluding tariffs from both quarters, company and products margin each fell about a point from June to September, “driven entirely by memory impacts,” and that the gross memory hit was larger before offsets from carry-in inventory, cheaper non-memory components and pricing. He also said “we have received the vast majority of the refunds related to tariffs paid,” so the December quarter has no refund cushion.
The carry-in benefit comes from how Apple buys. Components purchased earlier at lower prices flow into cost of sales first, so a rising memory market reaches the income statement with a lag. The third-quarter 10-Q said products margin rose on mix and tariff refunds, “partially offset by higher costs, including memory.” Services margin rose 0.4 points to 76.0% in the September quarter, so the pressure is on the hardware side.
How much of the December step-down is memory? At the $156.0 billion revenue midpoint, one point of gross margin is about $1.56 billion. The fall from 47.89% reported to 45.5% is 2.39 points, about 1 point of which is the refund rolling off; the other 1.39 points is mostly memory by management’s account. Against last December the gap is wider, because the holiday quarter is when high-margin new iPhones sell most: gross margin was 48.16% and products margin 40.68% a year ago, so the guide sits 2.16 to 3.16 points lower.
Component Inventory and Purchase Obligations
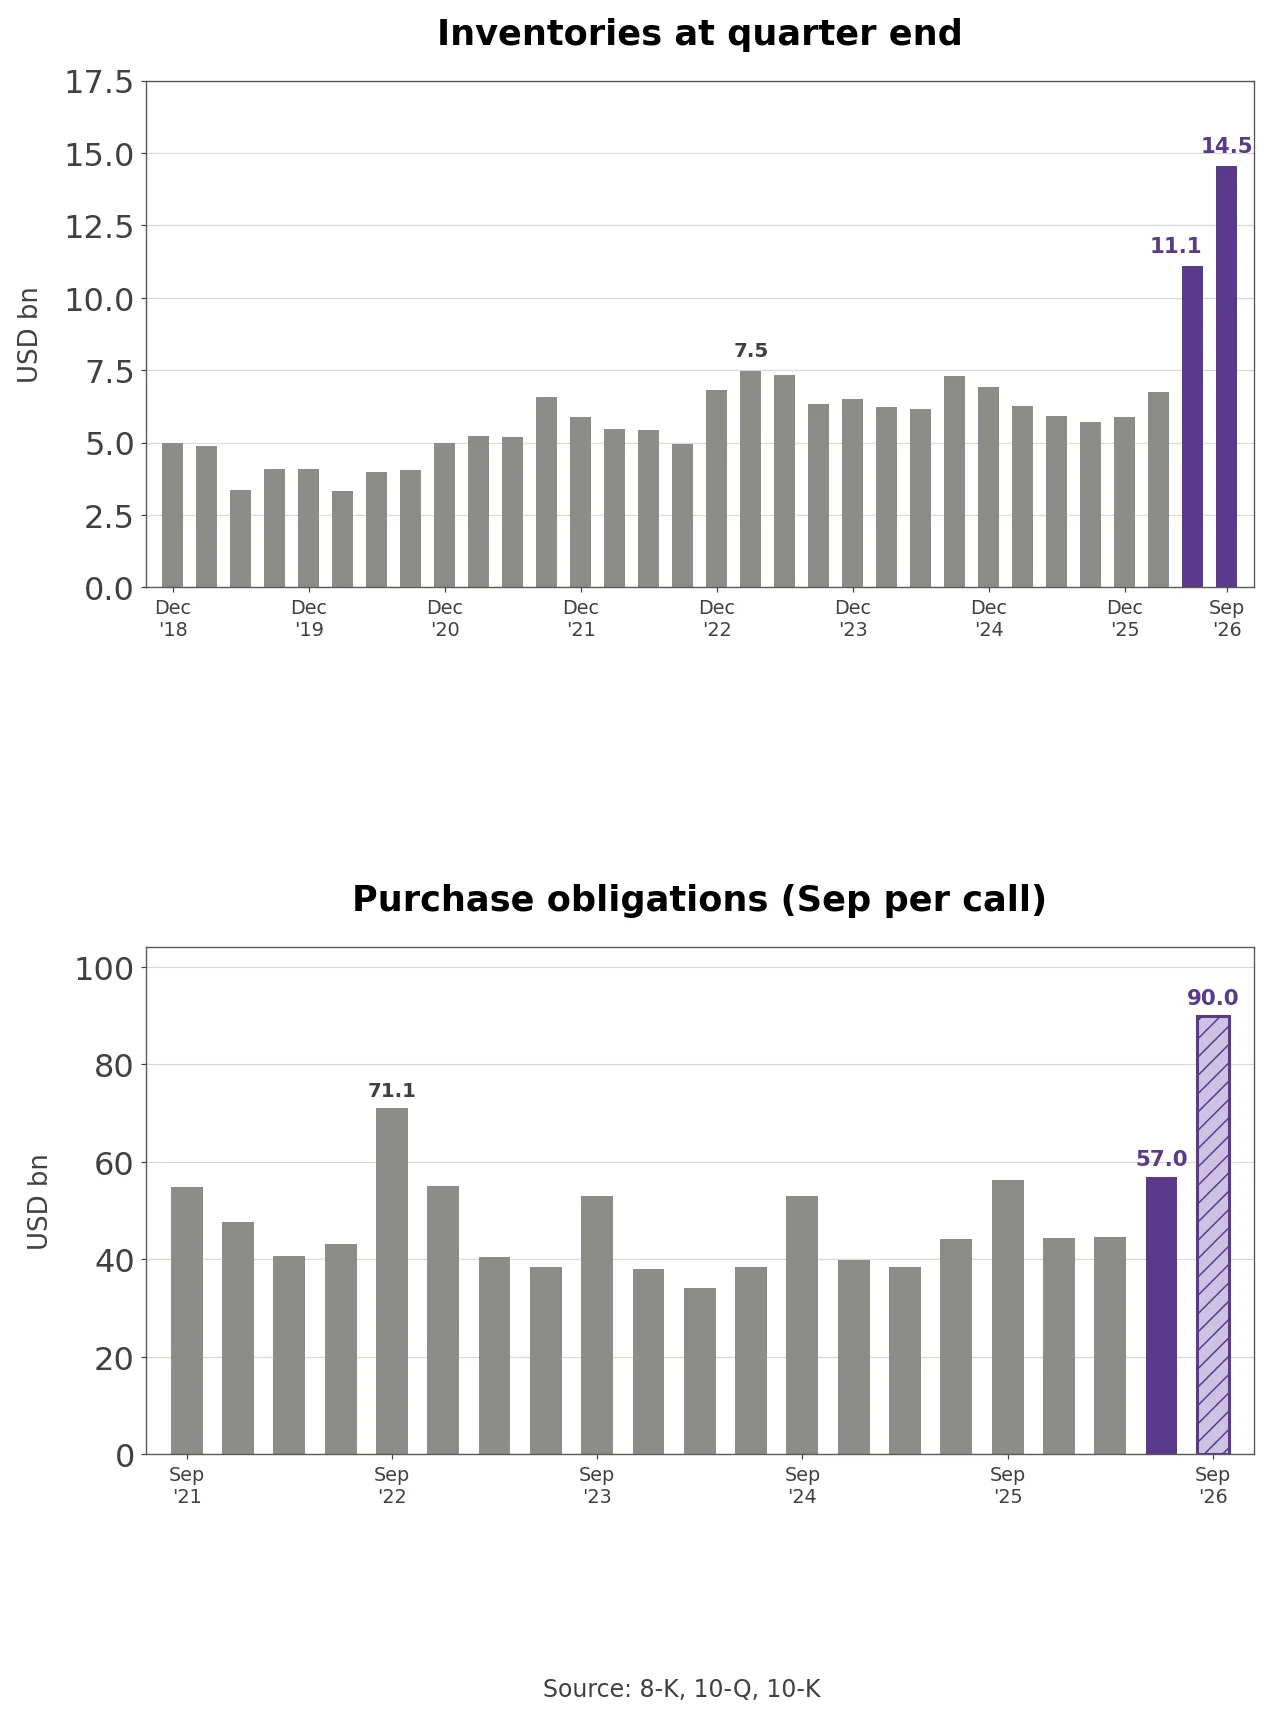
Apple inventory over 32 quarters and manufacturing purchase obligations over 21 quarters
Inventory reached $14.541 billion, 2.5 times the $5.718 billion of a year earlier. Across 32 quarterly releases since December 2018 it stayed between $3.3 billion and $7.5 billion until March 2026, and the new level is 1.94 times the previous peak of $7.482 billion in March 2023. Divided by quarterly cost of sales, that is 22.2 days of inventory against 9.6 days a year ago and a previous high of 14.7. The cash flow statement shows $8.9 billion absorbed by inventory in fiscal 2026.
The Q3 FY2026 10-Q shows what built up. In the third-quarter 10-Q inventory note, components were $7.645 billion against $2.124 billion at the end of September 2025, 3.6 times higher, while finished goods fell. Apple only published this split in nine quarters since 2018, and components were 36.8% to 51.5% of inventory in 2023 to 2025 before jumping to 68.9%. The same filing describes “increasing costs for components driven by factors such as industry supply-demand imbalances for components, including advanced semiconductors, storage (NAND) and memory (DRAM),” and adds: “The Company expects these trends to intensify, which may materially negatively impact” revenue, costs and gross margin.
Own calculation (20 quarters of 10-Q and 10-K filings and the Q4 call): Manufacturing purchase obligations were $57.0 billion in June; adding the $33 billion increase management disclosed gives about $90 billion in September, above the $71.1 billion peak of September 2022 and 60.1% higher than the $56.2 billion of a year earlier.
September obligations are always the year’s largest because they cover holiday production, so the fair comparison is next-quarter cost of sales. September 2025 obligations were 0.75 times December-quarter cost of sales. This year they are 1.06 times the $85.0 billion of cost implied by the guidance midpoint. In 21 quarters the ratio topped 1.0 only in September and December 2022, during the supply chain crunch, and now.
Management tied the jump in obligations to its effort “to improve supply,” and said memory purchase prices keep rising beyond December. The carry-in benefit comes from memory bought cheaply; components stacked up from June and obligations signed by September were bought after prices had already risen. Ternus said on the call that “we do believe we will see a decreasing benefit from the carry-in inventory on memory over time,” and the June and September balance sheets had already recorded the higher-cost buying before the margin reflected it.
Vendor non-trade receivables, the money contract manufacturers owe Apple for components it buys and passes on, reached $39.9 billion, and accounts payable $82.3 billion. Inventory, non-trade receivables and payables all set 32-quarter highs in the same quarter.
What Apple Sells and Where the Margin Comes From
Of fourth-quarter revenue of $114.5 billion, iPhone supplied $57.6 billion, or 50.3%, and services $31.6 billion, or 27.6%. Mac contributed $10.8 billion (+23.7%), iPad $6.2 billion (-10.4%) and Wearables, Home and Accessories $8.3 billion (-7.9%). Apple attributed the iPad decline to supply constraints and a tough comparison with last year’s launch, and the wearables decline to last year’s Apple Watch SE 3 and AirPods Pro 3 launches.
For the full year iPhone was $254.1 billion (+21.2%) and 53.1% of revenue, services $123.3 billion (+13.0%) and 25.8%, and Mac $37.9 billion (+12.5%) and 7.9%; iPad and wearables were each 0.3% lower. In September Apple launched the foldable iPhone Duo and the iPhone 18 Pro and Pro Max, and left iPhone 17, iPhone Air and iPhone 17e to cover the holidays instead of a standard iPhone 18. MacBook Neo and MacBook Pro led the Mac line, and Apple cited a Philippine education department order for 170,000 MacBook Neos.
Supply was the binding constraint in the September quarter. COO Sabih Khan said availability of the advanced nodes used for Apple’s chips drove it, and that moving more of the lineup to 2nm is easing those limits. He added that iPhone Duo remains constrained and that it is hard to predict when supply and demand will balance, and that December constraints on Mac and iPad are “primarily driven by memory” because demand has run ahead of plan.
The two halves of the business earn very different margins. Fourth-quarter products margin was 37.2%, including the refund, close to 36.2% a year earlier, while services margin was 76.0%. Memory costs land on products. Services earn recurring revenue on the installed base, with more than 1.5 billion paid subscriptions. In the September quarter video, cloud, payment services and advertising set records, App Store revenue was similar to a year earlier, and mobile gaming weakness is expected to continue. Apple has changed App Store terms in some countries and operates in the US under a court ruling on link-out purchases; the Supreme Court agreed on June 30 to review the contempt standard in that case.
Siri AI adds costs to services as well. Parekh said the cloud costs “will be recognized through services cost of sales,” and that Apple defers part of each device’s revenue for bundled Siri AI and recognizes it over the device’s life, the same treatment it uses for Maps, Siri and iCloud. That pushes some device revenue later while server costs come through immediately.
Price increases are now inside product growth. Products revenue rose 12.5% in the fourth quarter, but Apple does not report units, so price and volume cannot be separated. Parekh said Apple “did reluctantly make the decision to change pricing” on iPad and Mac in June and iPhone in September, and that it is too early to read elasticity.
Greater China revenue was $82.4 billion in fiscal 2026, up 28.0% after declines of 7.7% in fiscal 2024 and 3.8% in fiscal 2025, and rose 21.0% in the fourth quarter. The Americas (+10.2%) and Europe (+11.5%) supplied 70.5% of fourth-quarter revenue, and only Japan fell, by 1.4%.
Apple vs HP Dell Microsoft and Alphabet
Revenue growth and gross margin change at Apple HP Dell Microsoft and Alphabet
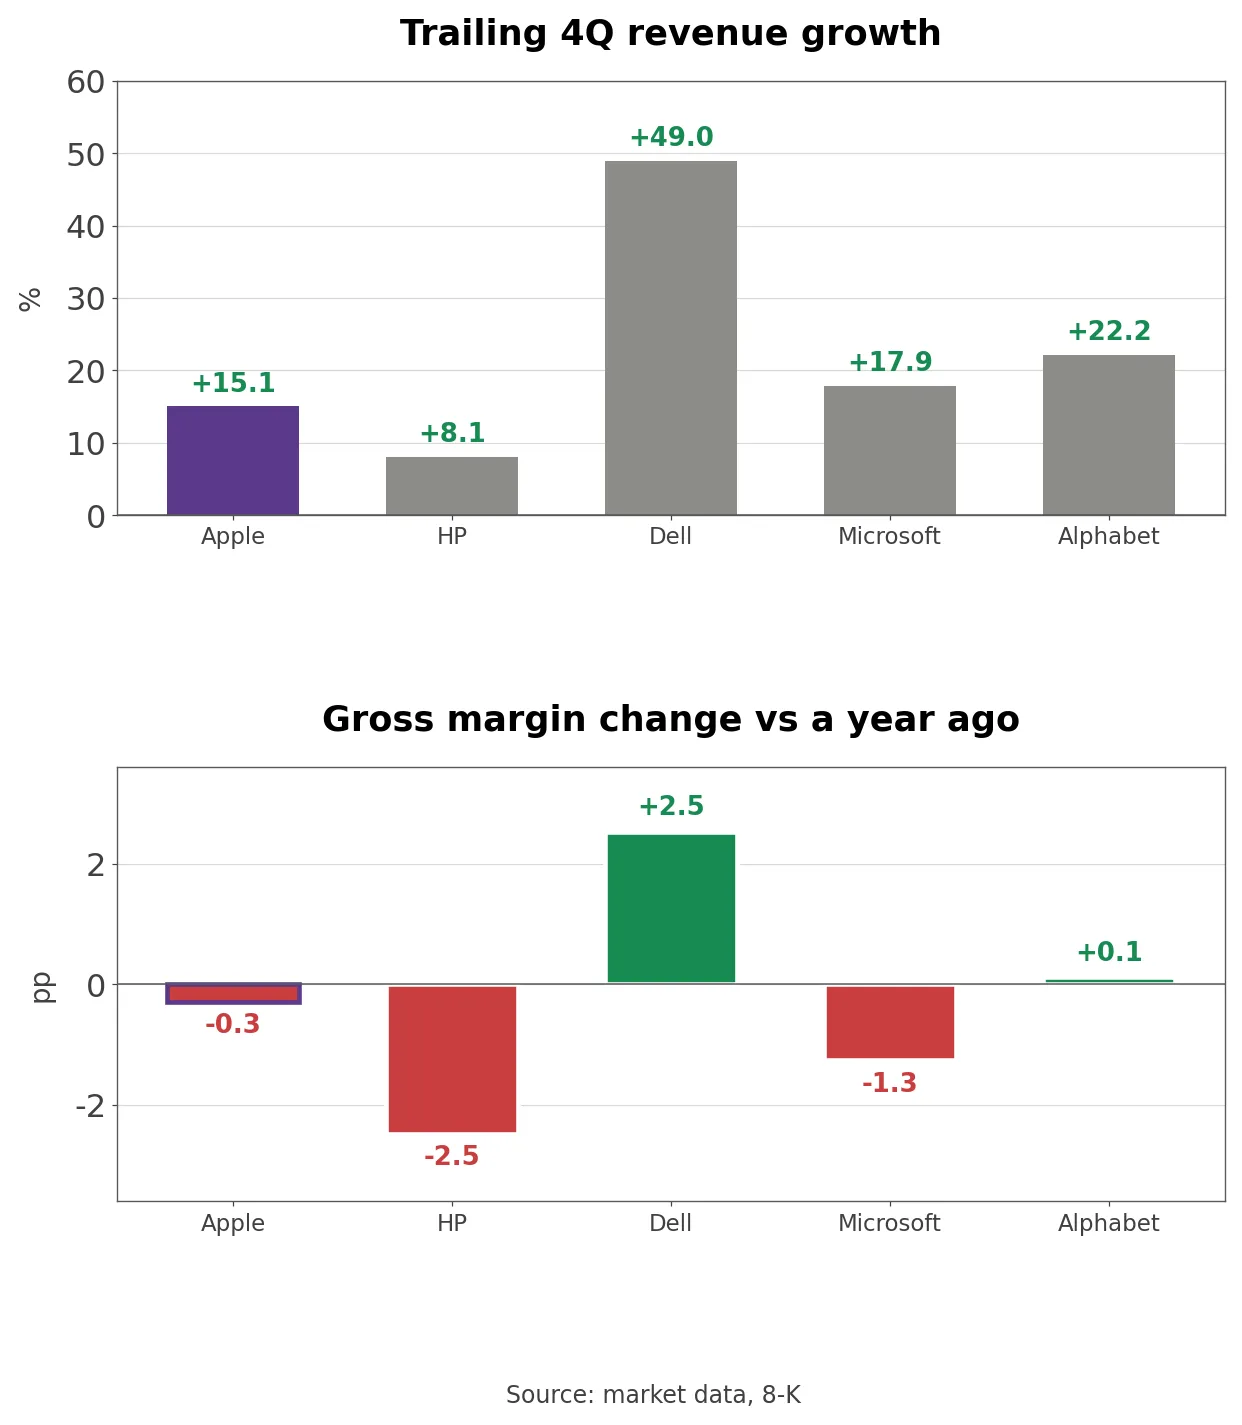
Against PC makers buying the same memory, Apple’s margin has held up better. Year over year, HP’s July-quarter gross margin fell 2.48 points to 17.98%, while Apple’s September-quarter margin excluding refunds was about 0.29 points lower. HP’s margin dropped from 20.93% in the April quarter to 17.98% in one quarter, which is what memory inflation looks like when nearly all revenue is PCs. Dell’s margin rose 2.53 points, but its trailing revenue grew 49.0% on AI servers, a different product mix. The peer figures run through the July quarter for HP and Dell and the September quarter for Microsoft and Alphabet.
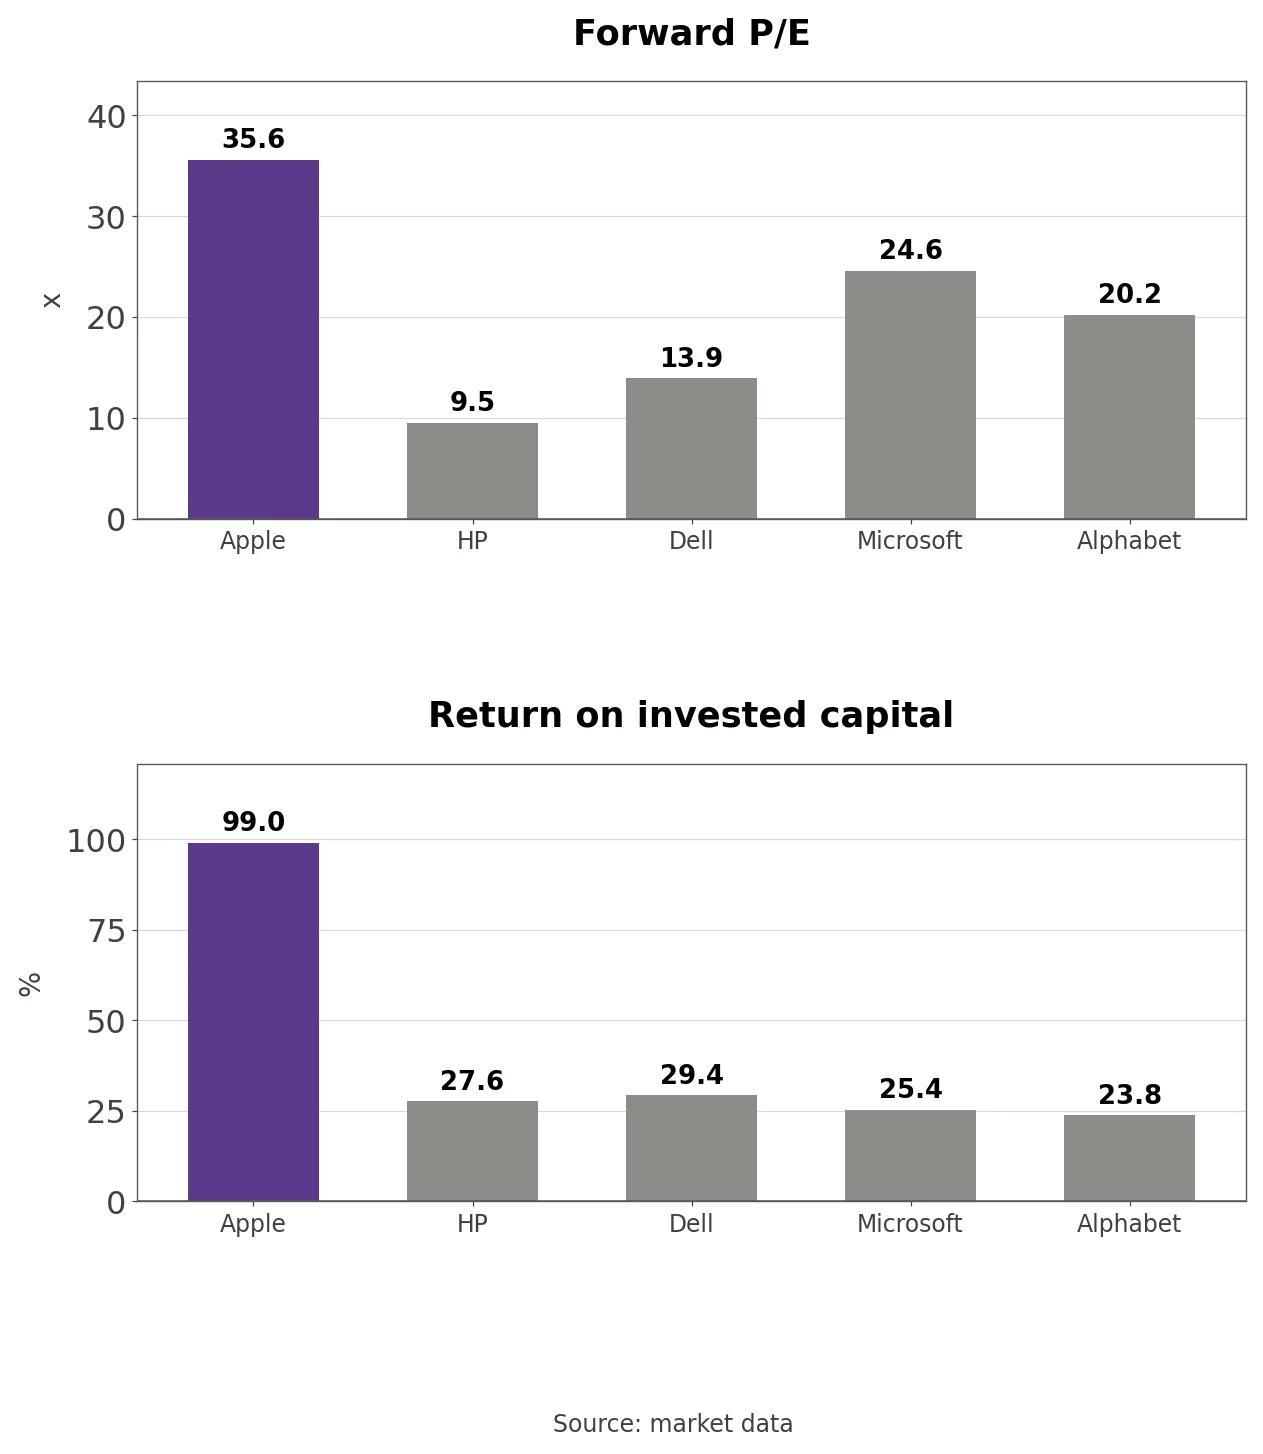
Against platform companies the comparison is valuation. Apple trades at 35.6 times forward earnings, above Microsoft at 24.6, Alphabet at 20.2, Dell at 13.9 and HP at 9.5, while its trailing revenue growth of 15.1% trails Microsoft’s 17.9% and Alphabet’s 22.2%. Alphabet’s trailing P/E of 14.6 includes large investment gains, so forward P/E is the cleaner comparison.
Own calculation (market data, trailing four-quarter gross profit): Market value divided by trailing gross profit is 21.1 times at Apple, 16.1 at Microsoft, 12.0 at Alphabet, 8.3 at Dell and 2.2 at HP. Apple and Microsoft trade at almost the same price to sales, 10.3 and 10.9, yet Apple’s trailing gross margin is 48.8% against Microsoft’s 67.7%, so investors pay more for each dollar of Apple’s gross profit.
Forward P/E and return on invested capital at Apple HP Dell Microsoft and Alphabet
Capital efficiency is the case for that premium. Return on invested capital (ROIC) is 99.0% at Apple on market data, more than three times Dell’s 29.4%, HP’s 27.6%, Microsoft’s 25.4% and Alphabet’s 23.8%. Apple returned $102.1 billion in fiscal 2026, $86.4 billion in buybacks and $15.7 billion in dividends, for a shareholder yield of 2.2%, below HP’s 7.1% and Dell’s 6.4% and above Microsoft’s 1.0%. A market value 193 times HP’s rests on that efficiency and on services, and how far memory pushes product margins toward PC-maker territory is the test.
The P/E and Price-to-Sales Band
Apple P/E and price to sales over 87 months
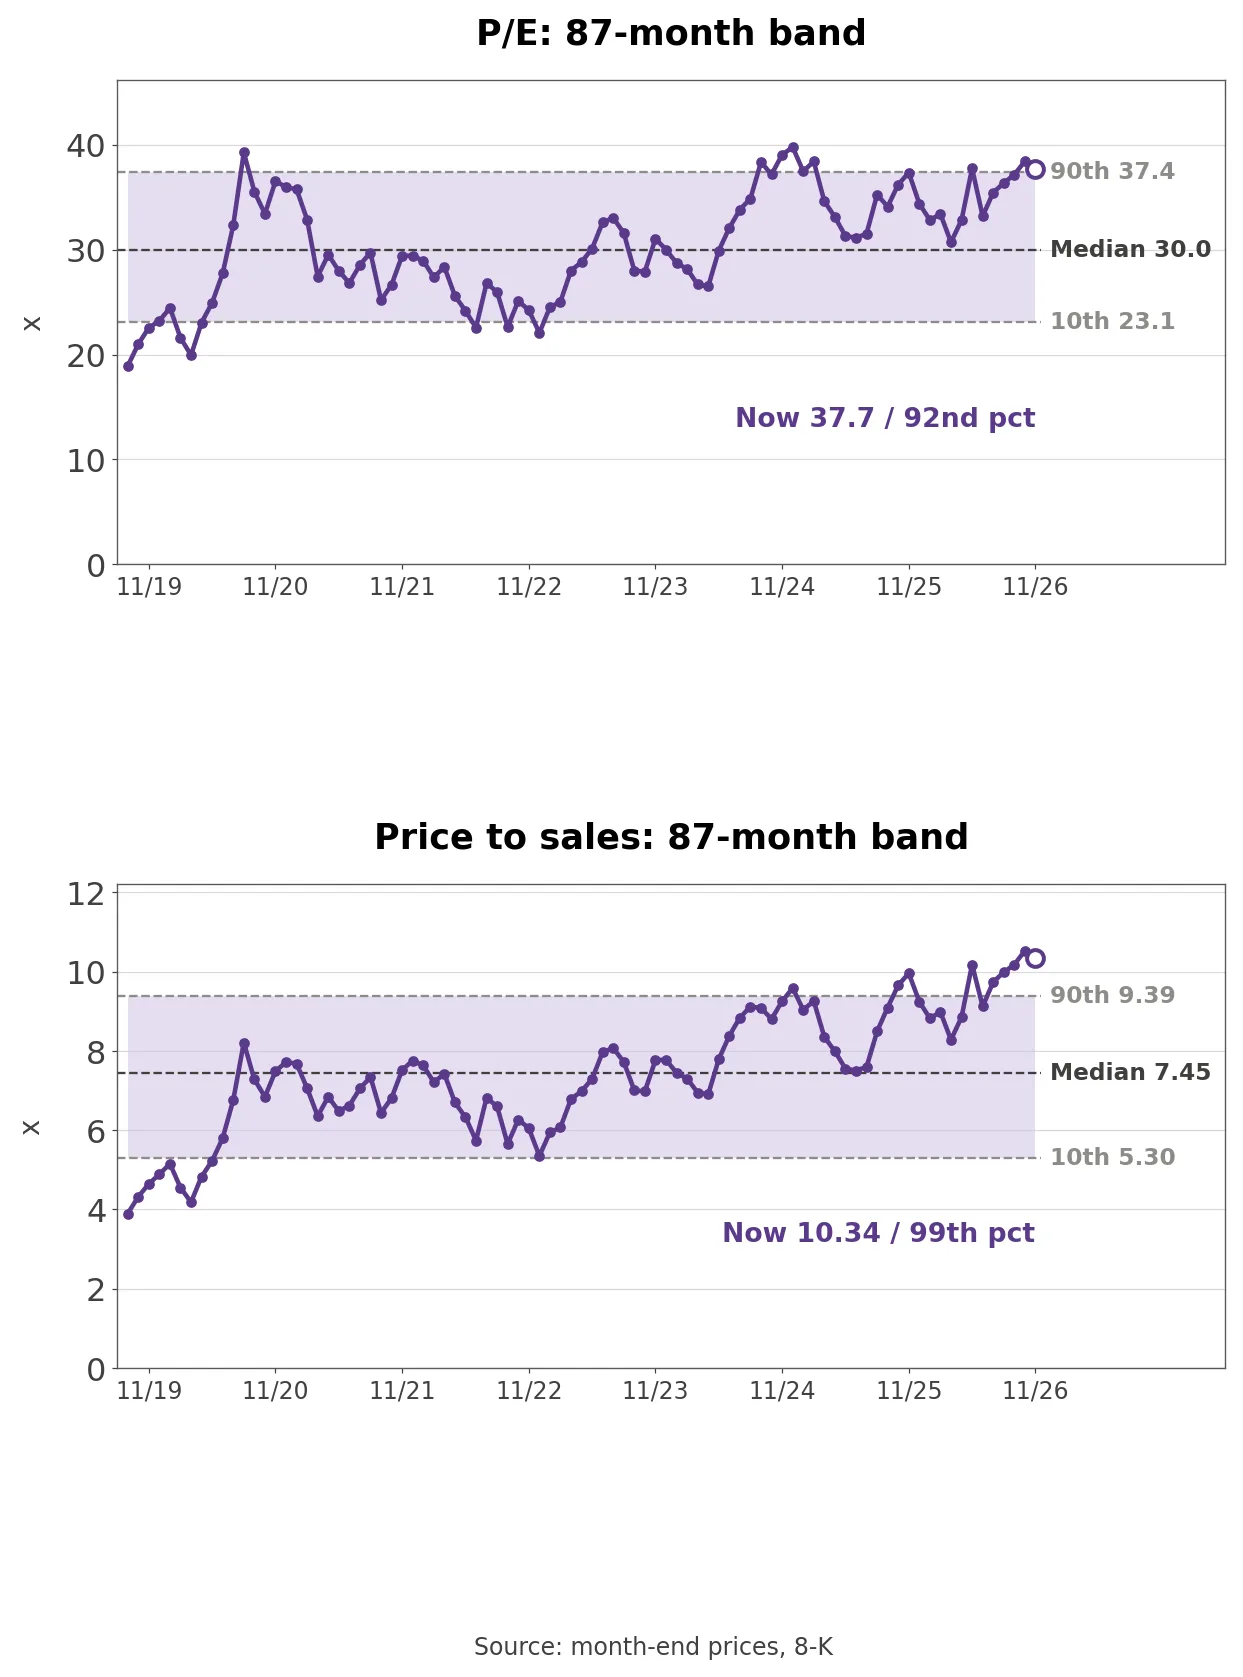
Own calculation (month-end prices and earnings releases): A price of $338.32 over trailing diluted EPS of $8.97 gives a P/E of 37.7, above the 87-month median of 30.0, with 92.0% of months lower. Price to sales of 10.34 is above its 7.45 median, with 98.9% of months lower, and the only higher reading was 10.53 in October 2026.
The P/E peaked at 39.75 in December 2024, when a one-time $10.2 billion tax charge tied to the European Commission’s State Aid decision depressed earnings. Price to sales has no such distortion and rose steadily from 3.89 in September 2019 to 10.53. The band puts the highest revenue multiple in seven years on a year when gross margin is heading to 45%. Holding the 35.6 forward P/E requires revenue growth to cover what the margin gives up.
Three Conditions That Move the Stock
Gross margin is the first. The December guide is 45% to 46%. A result below 45%, or a lower March-quarter guide, would mean memory is outrunning price increases and the carry-in benefit, which would weigh on the shares; a result above 46% would show those offsets lasting longer than expected and support them.
Inventory and purchase obligations come next, in the December-quarter 10-Q. If inventory falls after the holidays and obligations drop back toward the usual 0.8 times next-quarter cost of sales, the expensive components are being used up normally, which would support the stock. Inventory staying above $14.5 billion would push the cost into later quarters.
Services growth is the third. If services grow faster than 9% while services margin holds near 76% in the first quarter carrying Siri AI deferrals and server costs, services would be offsetting the hardware margin; growth below 8% or an adverse outcome in the App Store link-out case would weigh on the stock.
What to Watch in the Fiscal Q1 Report
Apple’s fiscal first-quarter results are due in late January. Three numbers will matter: gross margin in the first quarter without tariff refunds, quarter-end inventory and component inventory, and services growth. Before that, the fiscal 2026 10-K should give the exact September purchase obligation figure. It may also explain two other jumps: other purchase obligations, which cover licensed intellectual property, content and distribution rights, rose from $14.8 billion in September 2025 to $35.1 billion in December, and gross intangible assets grew from $24.95 billion to $38.22 billion over nine months. Apple has not broken either down.
The open question is how much price increases and services can absorb as components stocked from June and about $90 billion of obligations flow through cost of sales in the first half of 2027: can Apple hold gross margin in the 45% range?