- Amazon (NASDAQ: AMZN) posted its highest operating margin ever in the third quarter of 2026, 13.9%, and AWS revenue grew +39.3%. In the same quarter gross capital expenditures of $77.26 billion were nearly double operating cash flow of $42.42 billion, and free cash flow for the trailing twelve months fell to -$42.36 billion.
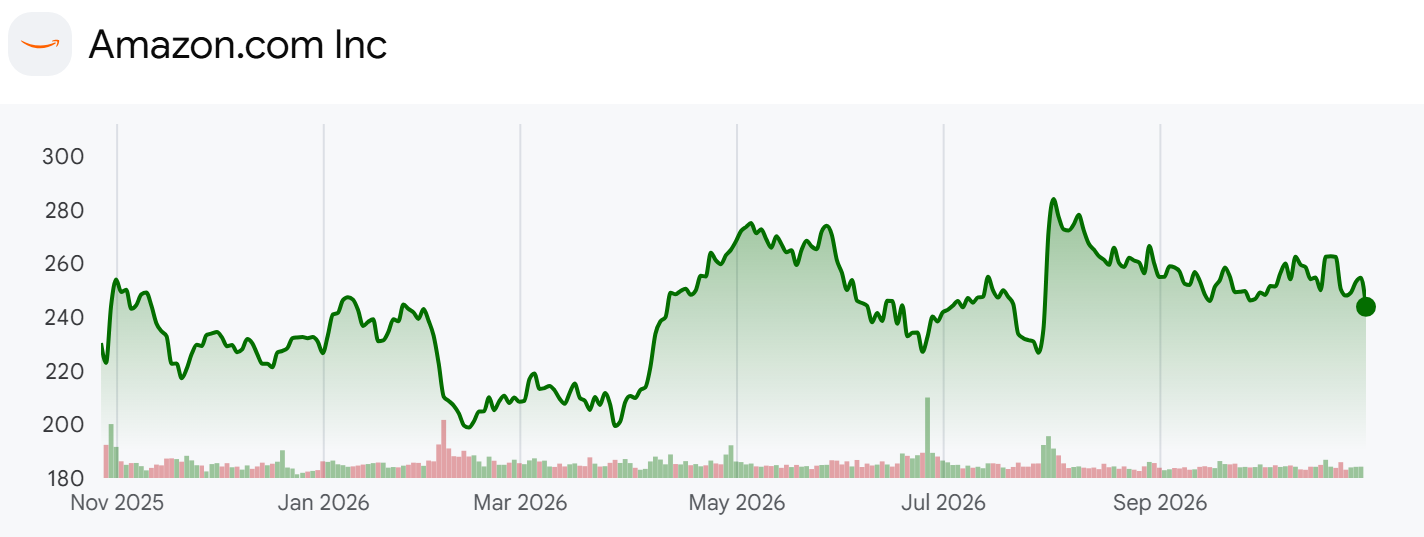
- Amazon runs an online store, a marketplace for third-party sellers, an ad business, Prime subscriptions and the AWS cloud. It closed at $243.79 when it reported results, for a market value of about $2.64 trillion on 10.81 billion shares, and traded as low as $231.48 after hours, -5.05%.
- The question is whose commitments filled the AWS backlog. Remaining performance obligations, mostly AWS, reached about $496 billion at June 30, up $252 billion in six months, and in those same two quarters OpenAI and Anthropic, two AI labs Amazon has invested in, each added $100 billion or more in commitments. The analysis lines up the Q3 earnings release, the Q2 10-Q, the OpenAI partnership 8-K, the Q2 earnings slides, 32 quarterly releases back to the December 2018 quarter and 31 backlog disclosures in 10-Ks and 10-Qs.
- Three caveats apply. The Q3 10-Q was not yet filed, so backlog and investment balances are as of June 30. Net income includes revaluation gains on the Anthropic stake, with non-operating income of $69.80 billion over the last four quarters, so the valuation work uses operating income instead of earnings. The Q3 call transcript was not available in English, so management commentary comes from the July call and is paraphrased.
What the Q2 Slides Promised About Free Cash Flow
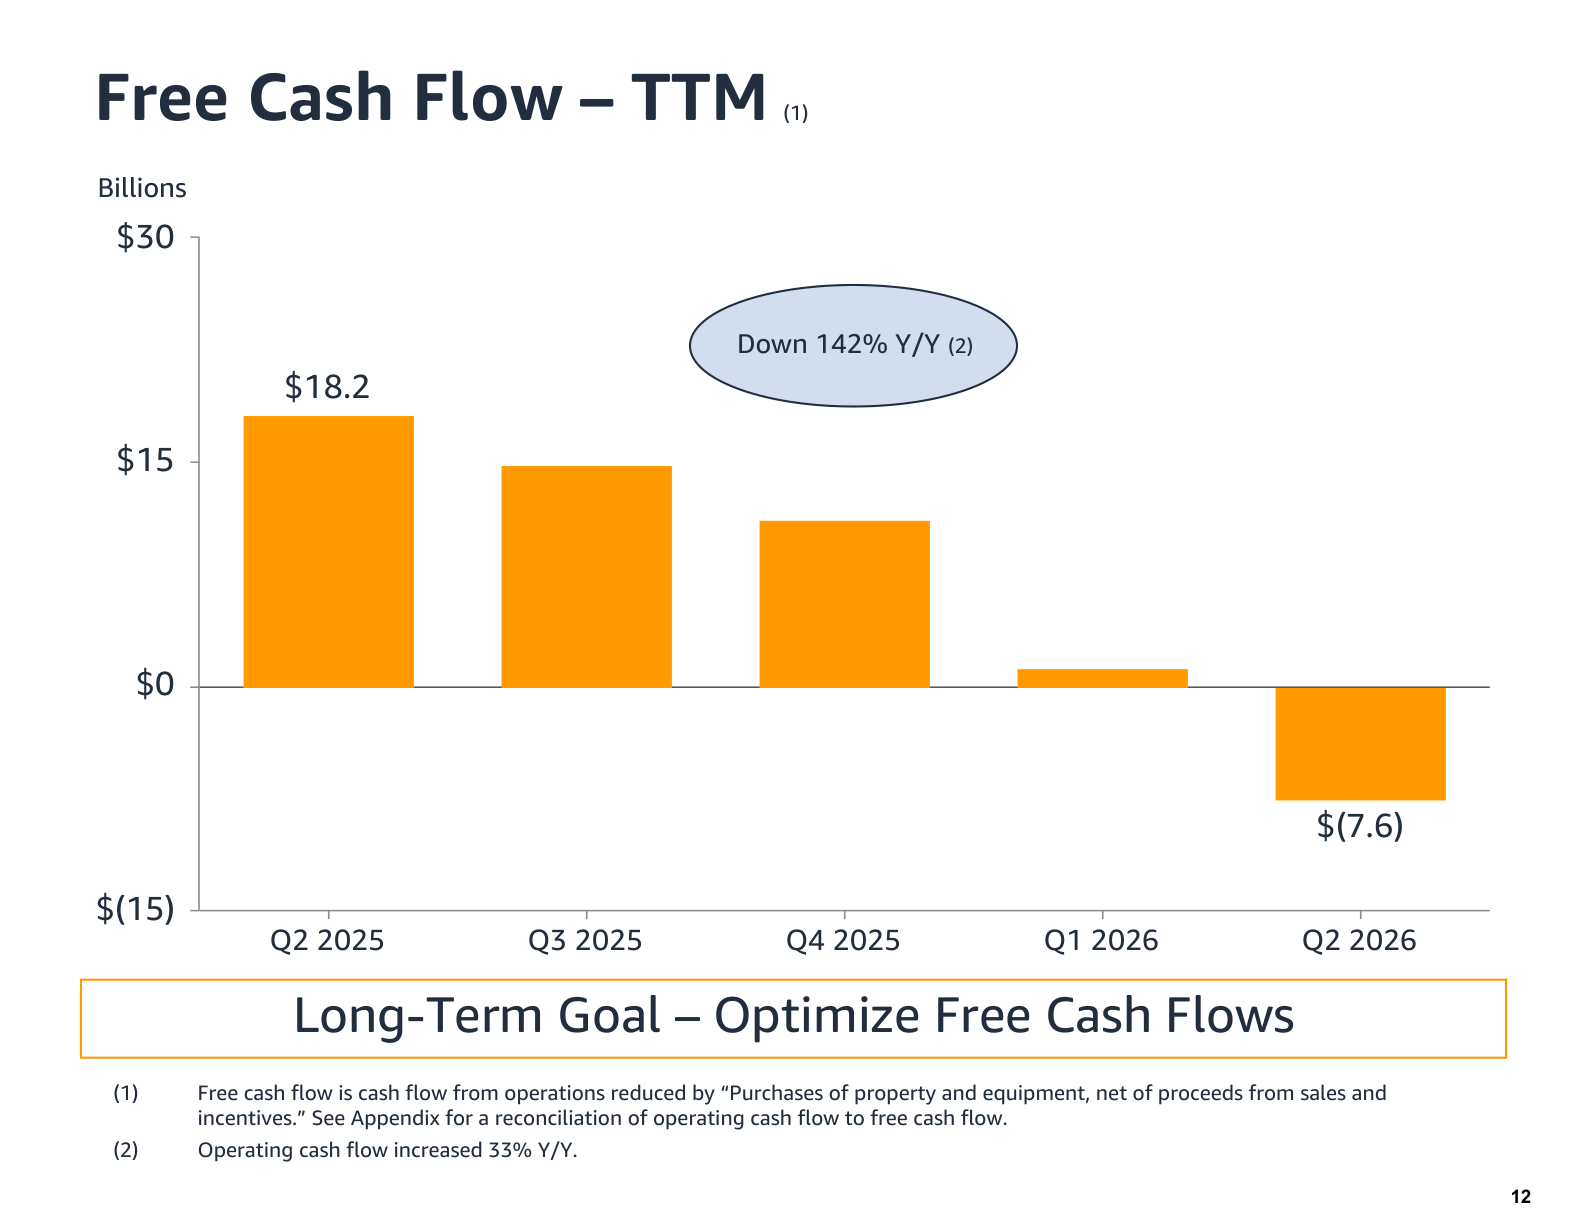
- Slide 12 of the Q2 earnings deck carries a banner at the bottom: the long-term goal is to optimize free cash flows. Above it, trailing twelve-month free cash flow falls from $18.2 billion in Q2 2025 to -$7.6 billion in Q2 2026, and a footnote says operating cash flow rose 33% over the same year. Amazon defines free cash flow as operating cash flow less purchases of property and equipment net of proceeds from sales and incentives.
- Q3 pushed the bar further down. Trailing free cash flow reached -$42.36 billion against +$14.79 billion a year earlier, and the release explains that net purchases of property and equipment rose $94.8 billion year over year. "This increase primarily reflects investments in artificial intelligence." Net capex of $210.66 billion over twelve months now exceeds operating cash flow of $168.30 billion, taking net capex from 88.7% to 125.2% of operating cash flow.
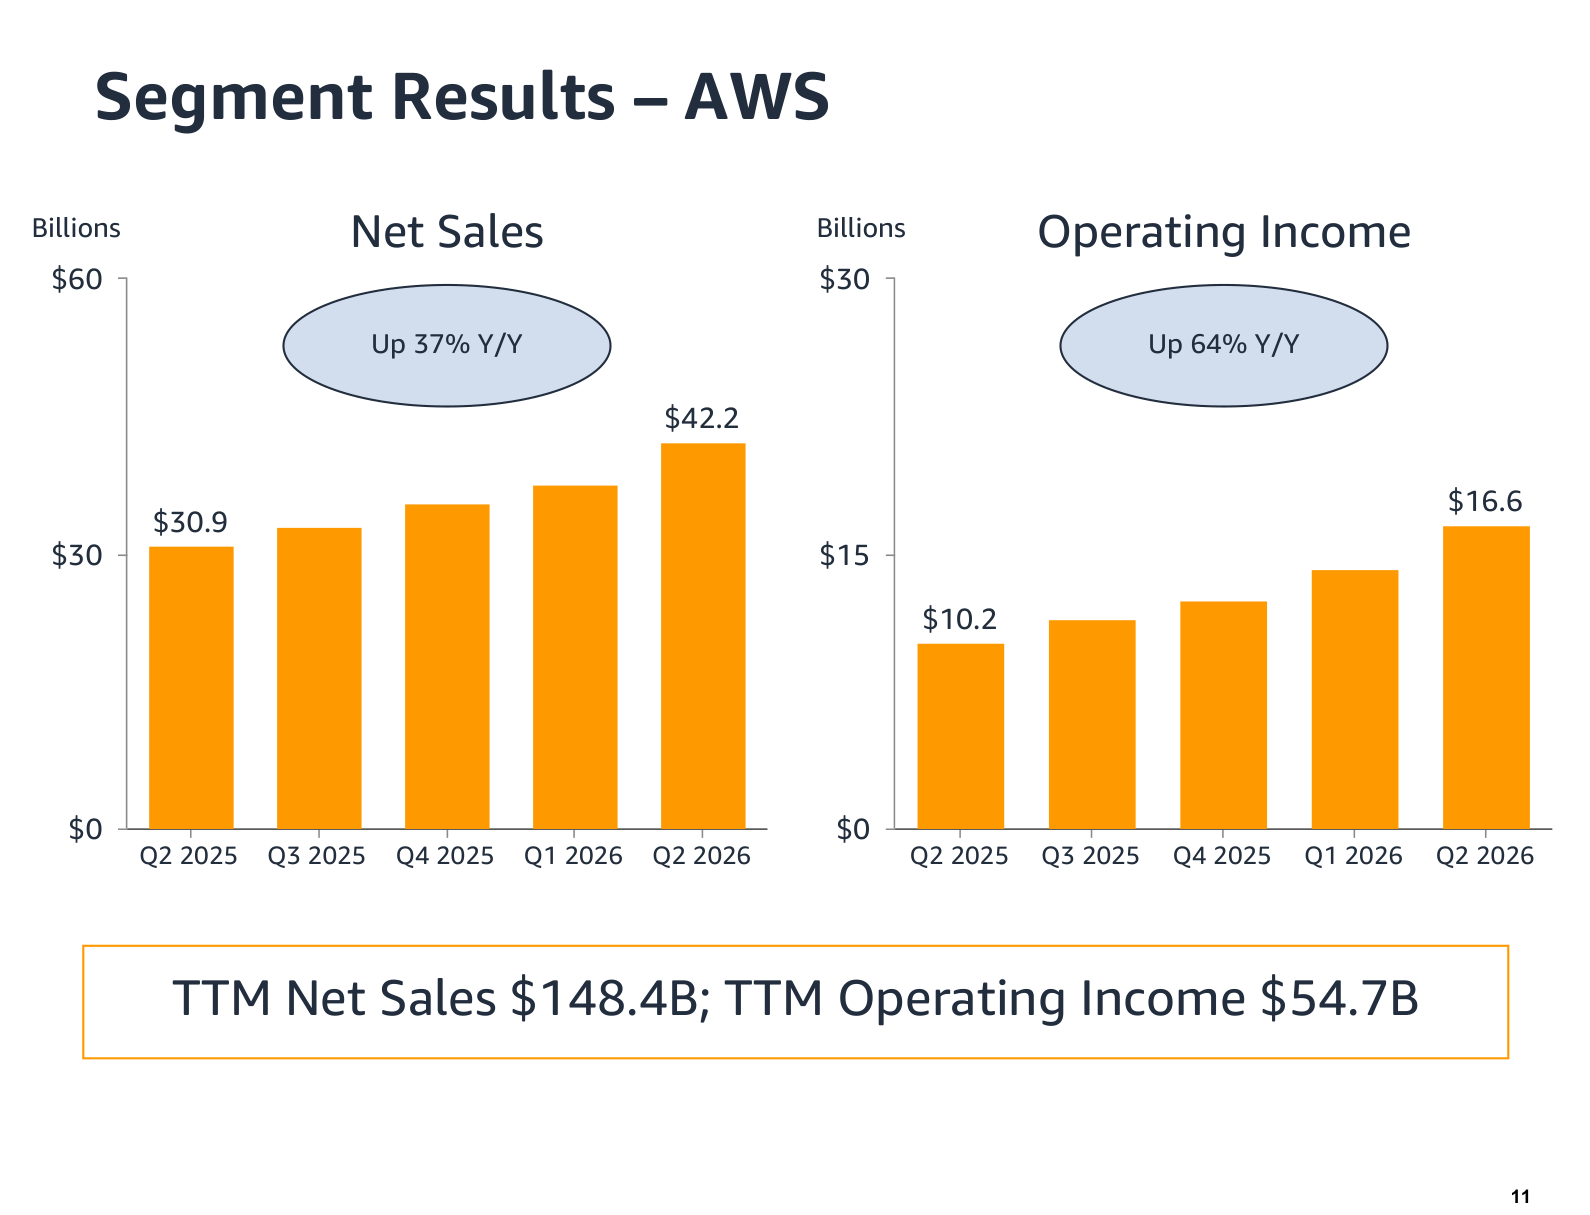
- Slide 11 covers AWS. Q2 revenue of $42.2 billion was up 37% and operating income of $16.6 billion up 64%, with trailing revenue of $148.4 billion and operating income of $54.7 billion. In Q3 AWS revenue reached $45.98 billion, +39.3%, and operating income $17.77 billion, lifting the margin from 34.6% a year earlier to 38.7%.
- Slide 7 charts net income of $62.6 billion for Q2, with a footnote that it includes $53.4 billion of pre-tax non-operating income, primarily from the Anthropic investment. Q3 net income of $20.69 billion came in below last year's $21.19 billion for the same reason in reverse: the release says Q3 2025 included $9.5 billion of pre-tax gains from Anthropic.
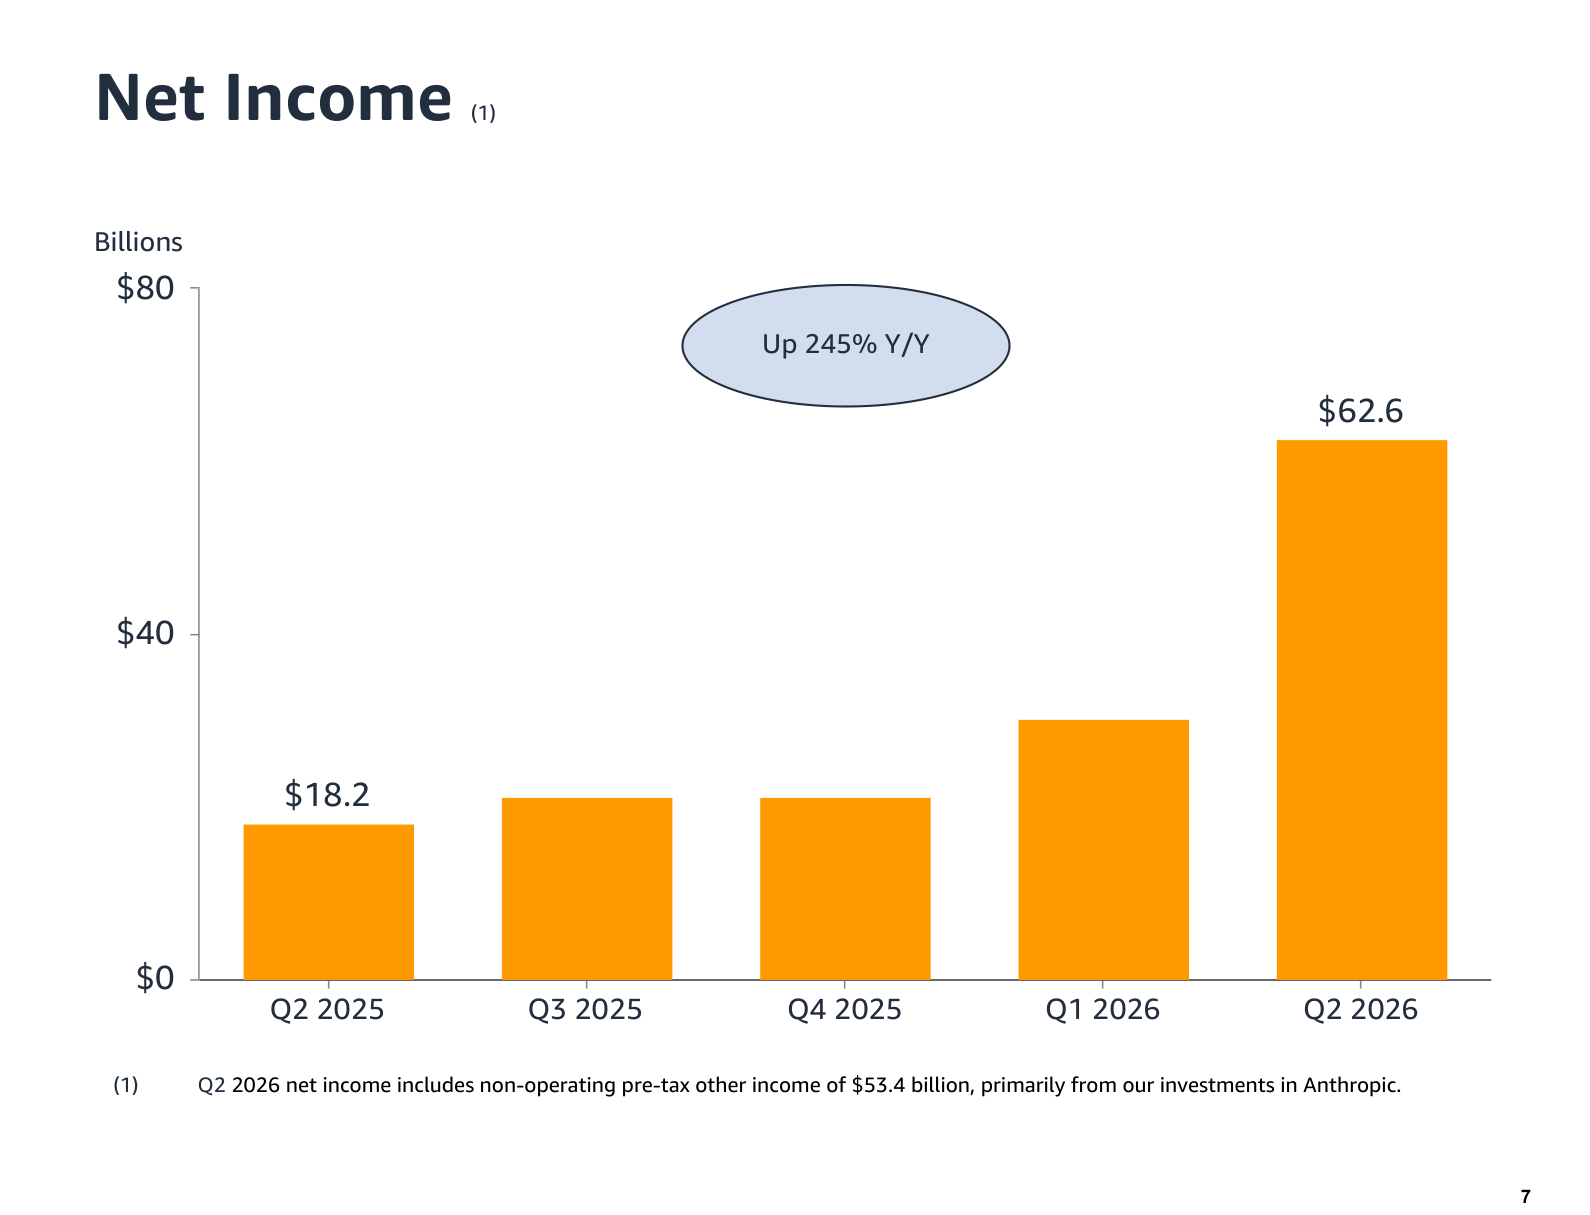
- Slide 3 split Q2 revenue of $200.6 billion into North America at 58%, International at 21% and AWS at 21%; in Q3 the AWS share rose to 22.8%. Slides 4 to 6 showed trailing revenue of $775.7 billion, up 16%, and trailing operating income of $93.7 billion, up 23%. With Q3 added, trailing operating income is $104.37 billion, up 37.0% from $76.20 billion a year earlier. Slide 13 pairs the share count with a second long-term goal, managing dilution efficiently, and shares outstanding rose only 0.7% this year to 10.811 billion, with no buybacks and no stock sales.
What the Q3 Release Says About AWS Growth
- The release headline called the 13.9% operating margin Amazon's highest ever and the 39.3% AWS growth its fastest in nearly five years, on a $184 billion annualized run rate.
- Company disclosure (Q3 earnings release): Andy Jassy wrote that AWS growth has "projected revenue growth rates of over 40% both in 2027 and in 2028" and added: "There has never been a trillion dollar revenue business, and we may have two of them in the next 5-10 years."
- The highlights open with new AWS agreements with Meta, NVIDIA, OpenAI, Salesforce and Oracle. Fortune 500 spending on Bedrock, the AWS inference service, rose nearly 7 times and total Bedrock token volume nearly 17 times from a year earlier. Tens of thousands of customers use AgentCore, the agent service, and deployed twice as many agents in Q3 as in the prior three quarters combined, and Lambda passed a $1 billion annualized run rate.
- Fourth-quarter guidance calls for revenue of $240.0 billion to $247.0 billion, up 12% to 16%, and operating income of $28.5 billion to $33.5 billion against $25.0 billion a year earlier. The midpoint of $243.5 billion sits close to the pre-report market data consensus of $244.31 billion. Advertising grew 12% excluding currency in Q3 because of Prime Day timing, and Amazon expects high-teens growth in Q4. It still expects about $220 billion of cash capex for 2026.
- Own calculation (Q3 release and July call): Gross capex for nine months was $175.67 billion and net capex $172.19 billion. If the full year lands near $220 billion, fourth-quarter net capex would be about $47.8 billion, well below Q3's $75.88 billion. On the July call management said it had planned about $200 billion at the start of the year, so the annual figure has already been raised once.
- The July call also laid out the investment cycle. Data center capital goes out about two years before servers in it earn revenue, while servers and network gear pay back in under three years on average and last at least five to six years. Most AI capacity is signed on contracts of at least five years, most 2027 capacity is already reserved, and Amazon expects to double its 2025 power capacity by the end of 2027.
The Bull and Bear Case for Amazon Shares
- The bull case rests on profit quality. AWS growth has risen for six straight quarters from 16.9% in Q1 2025 to 39.3%, operating income grew +61.2%, and market value divided by trailing operating income, at 25.25 times, is the lowest in the 59 months since December 2021.
- The bear case rests on cash and customers. Trailing free cash flow is -$42.36 billion, long-term debt rose from $65.65 billion at the end of 2025 to $173.13 billion, and this year's commitment expansions from the two AI labs alone make up more than 40% of the June backlog. The same two companies drive the revaluation gains inside net income.
From an Anthropic Stake to the OpenAI Investment
- Amazon invested $8.0 billion in Anthropic convertible notes between Q3 2023 and Q4 2025, and portions converted to nonvoting preferred stock in Q1 2025 and Q1 2026. Each new Anthropic funding round reprices that stake, and the 10-Q reports upward adjustments of $50.5 billion in Q2 2026 and $62.8 billion for the first half, primarily from the Anthropic preferred stock.
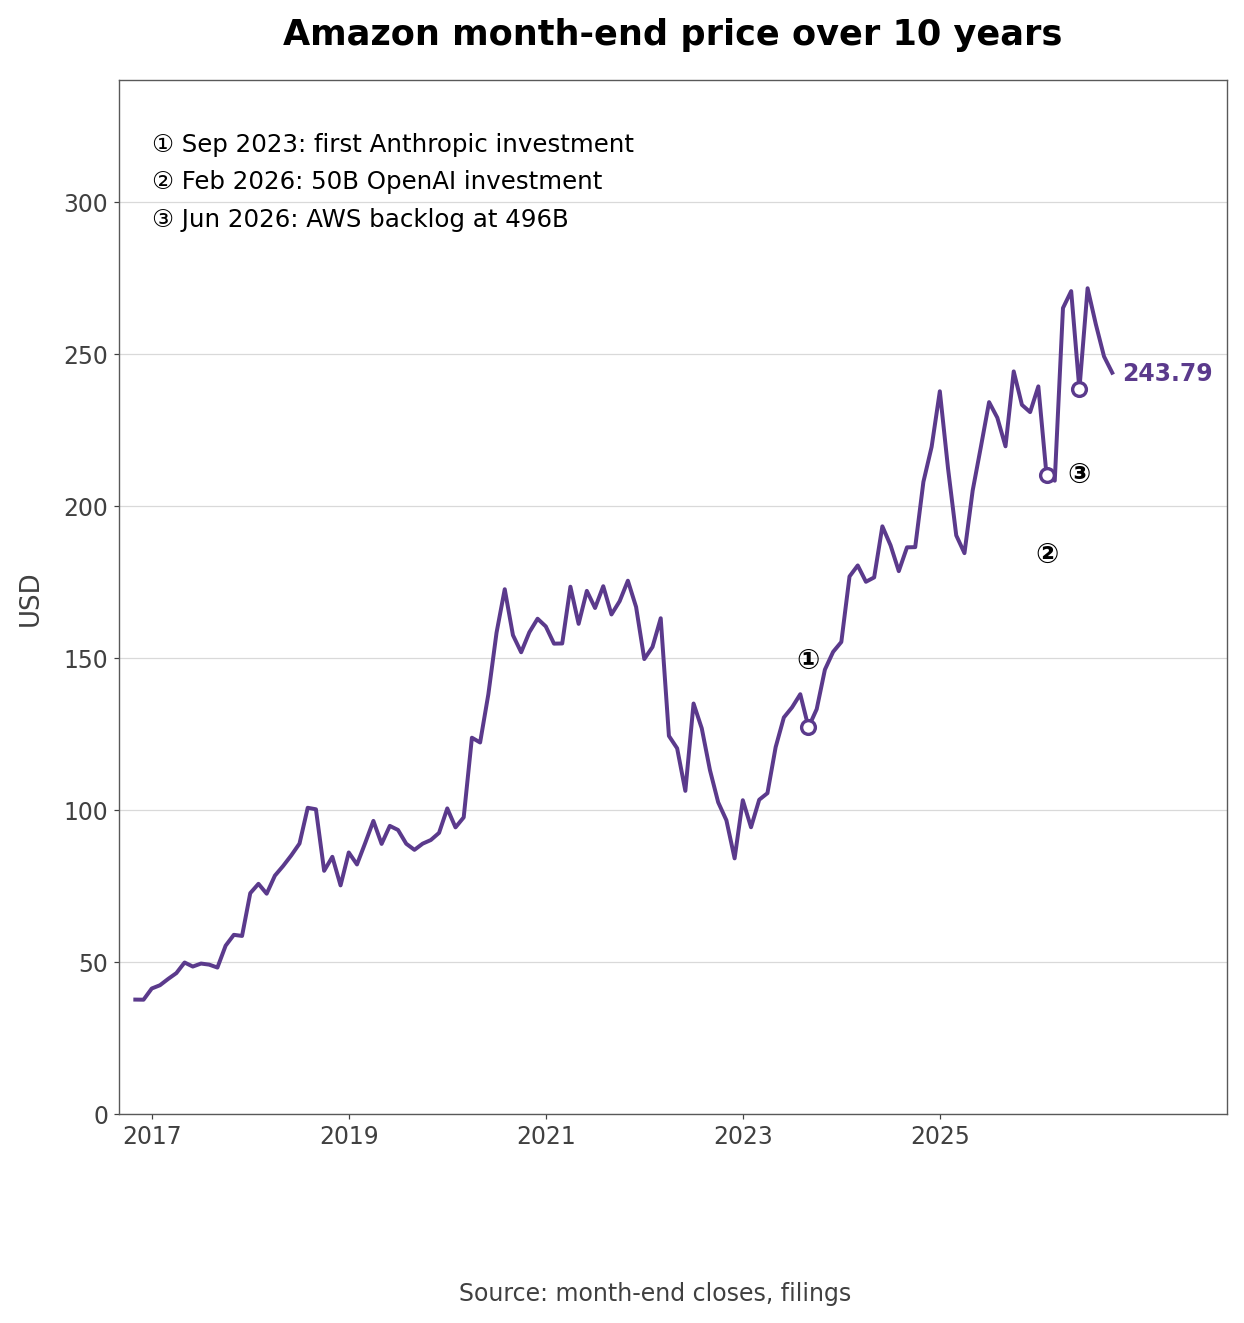
- On February 27, 2026 Amazon and OpenAI announced a multi-year partnership. The release lists "OpenAI to consume 2 gigawatts of Trainium capacity through AWS infrastructure" alongside AWS becoming the exclusive third-party cloud distribution provider for OpenAI Frontier, and Amazon agreed to invest $50 billion. The 10-Q shows $15.0 billion in Series C preferred stock at signing, $13.7 billion in Q2 and the remaining $21.3 billion after June 30.
- The balance sheet carries both roles. Private equity investments outside the equity method, mostly the Anthropic and OpenAI preferred stock, rose from $16.2 billion at the end of 2025 to $122.3 billion at June 30, and other assets reached $358.78 billion at September 30, 2.9 times the year-end figure. Q3 cash flow shows $23.99 billion spent on acquisitions and non-marketable investments.
How Much of the AWS Backlog Comes From Two AI Labs?
- Filing note (Q2 10-Q): Commitments not yet recognized in contracts longer than one year were about $496 billion at June 30, primarily AWS, and "The weighted-average remaining life of our long-term contracts is 6.4 years." The same note says AWS expanded its existing $38.0 billion commitment with OpenAI by $100.0 billion over 8 years in Q1 and expanded its Anthropic commitment by more than $100.0 billion over 10 years in Q2, both including obligations tied to the performance of AWS chips.
- Own calculation (31 backlog disclosures): The backlog went from $200 billion in Q3 2025 and $244 billion in Q4 2025 to $364 billion in Q1 2026 and $496 billion in Q2. The OpenAI expansion of $100 billion accounts for most of the Q1 increase of $120 billion, and the Anthropic expansion of more than $100 billion for most of the Q2 increase of $132 billion. Together the two expansions make up at least 79% of the six-month increase and at least 40% of the June backlog.
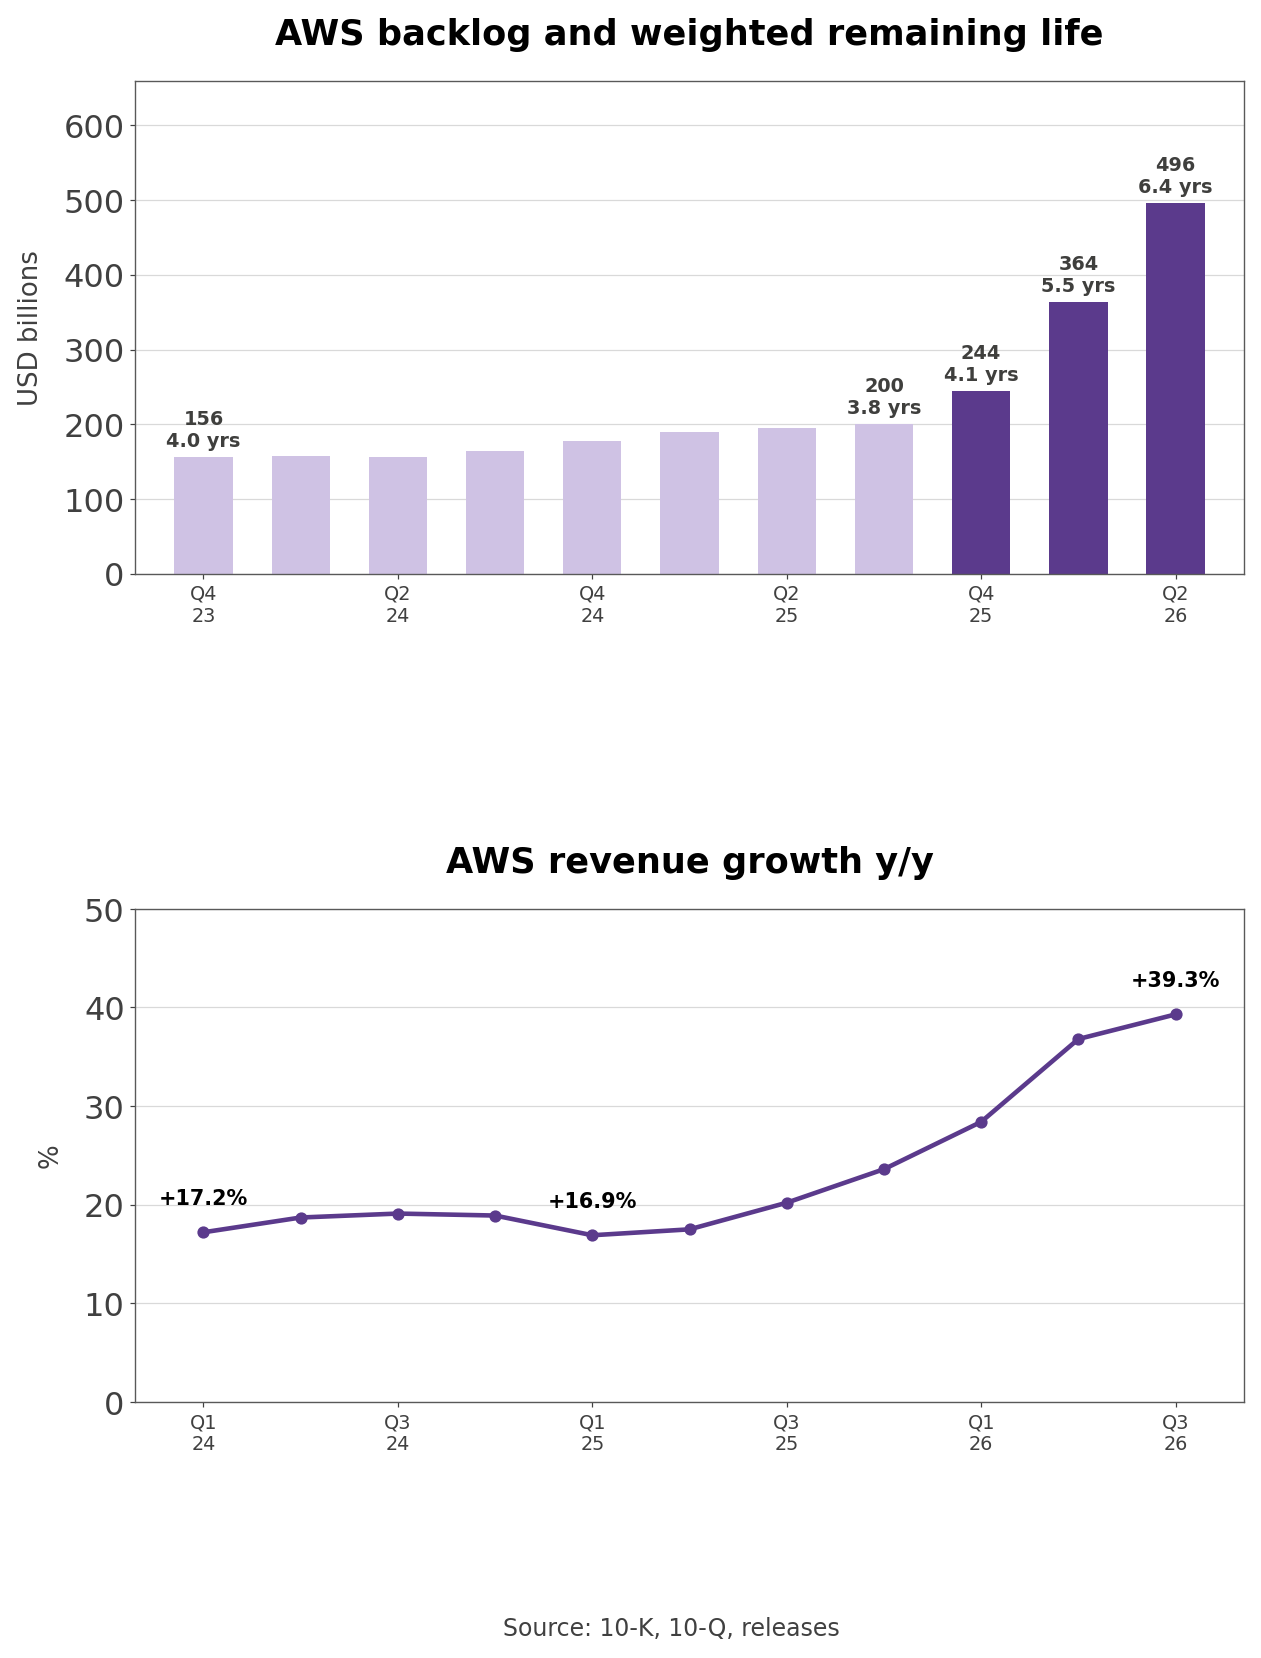
- Contract terms lengthened at the same time. The weighted remaining life went from 3.8 years in Q3 2025 to 4.1, 5.5 and 6.4 years. The backlog is up +154.4% from $195 billion a year earlier, but the pace at which it turns into revenue is slower than the headline growth suggests; the June balance is 3.1 times AWS's trailing revenue of $161.38 billion.
- The backlog also has limits. It counts only contracts with original terms longer than one year, so pay-as-you-go usage is excluded, and the 10-Q notes that "The amount and timing of revenue recognition will be driven by customer usage and our performance in accordance with contractual obligations". Because both lab contracts include chip performance obligations, slower chip supply would also slow revenue recognition.
- On the July call Jassy described AI demand as a barbell, with AI labs consuming enormous compute at one end and ordinary enterprises only beginning to run inference in production at the other. The backlog's weight sits at the lab end of that barbell.
Capex Outran Cash Flow for Three Quarters
- Q3 operating cash flow rose +19.4% to $42.42 billion while gross capex rose +120.1% to $77.26 billion. After $75.88 billion of net capex, quarterly free cash flow was -$33.46 billion against +$1.30 billion a year earlier, following -$17.20 billion in Q1 and -$7.69 billion in Q2. For nine months, operating cash flow of $113.84 billion was up 33.8%, but free cash flow was -$58.35 billion.
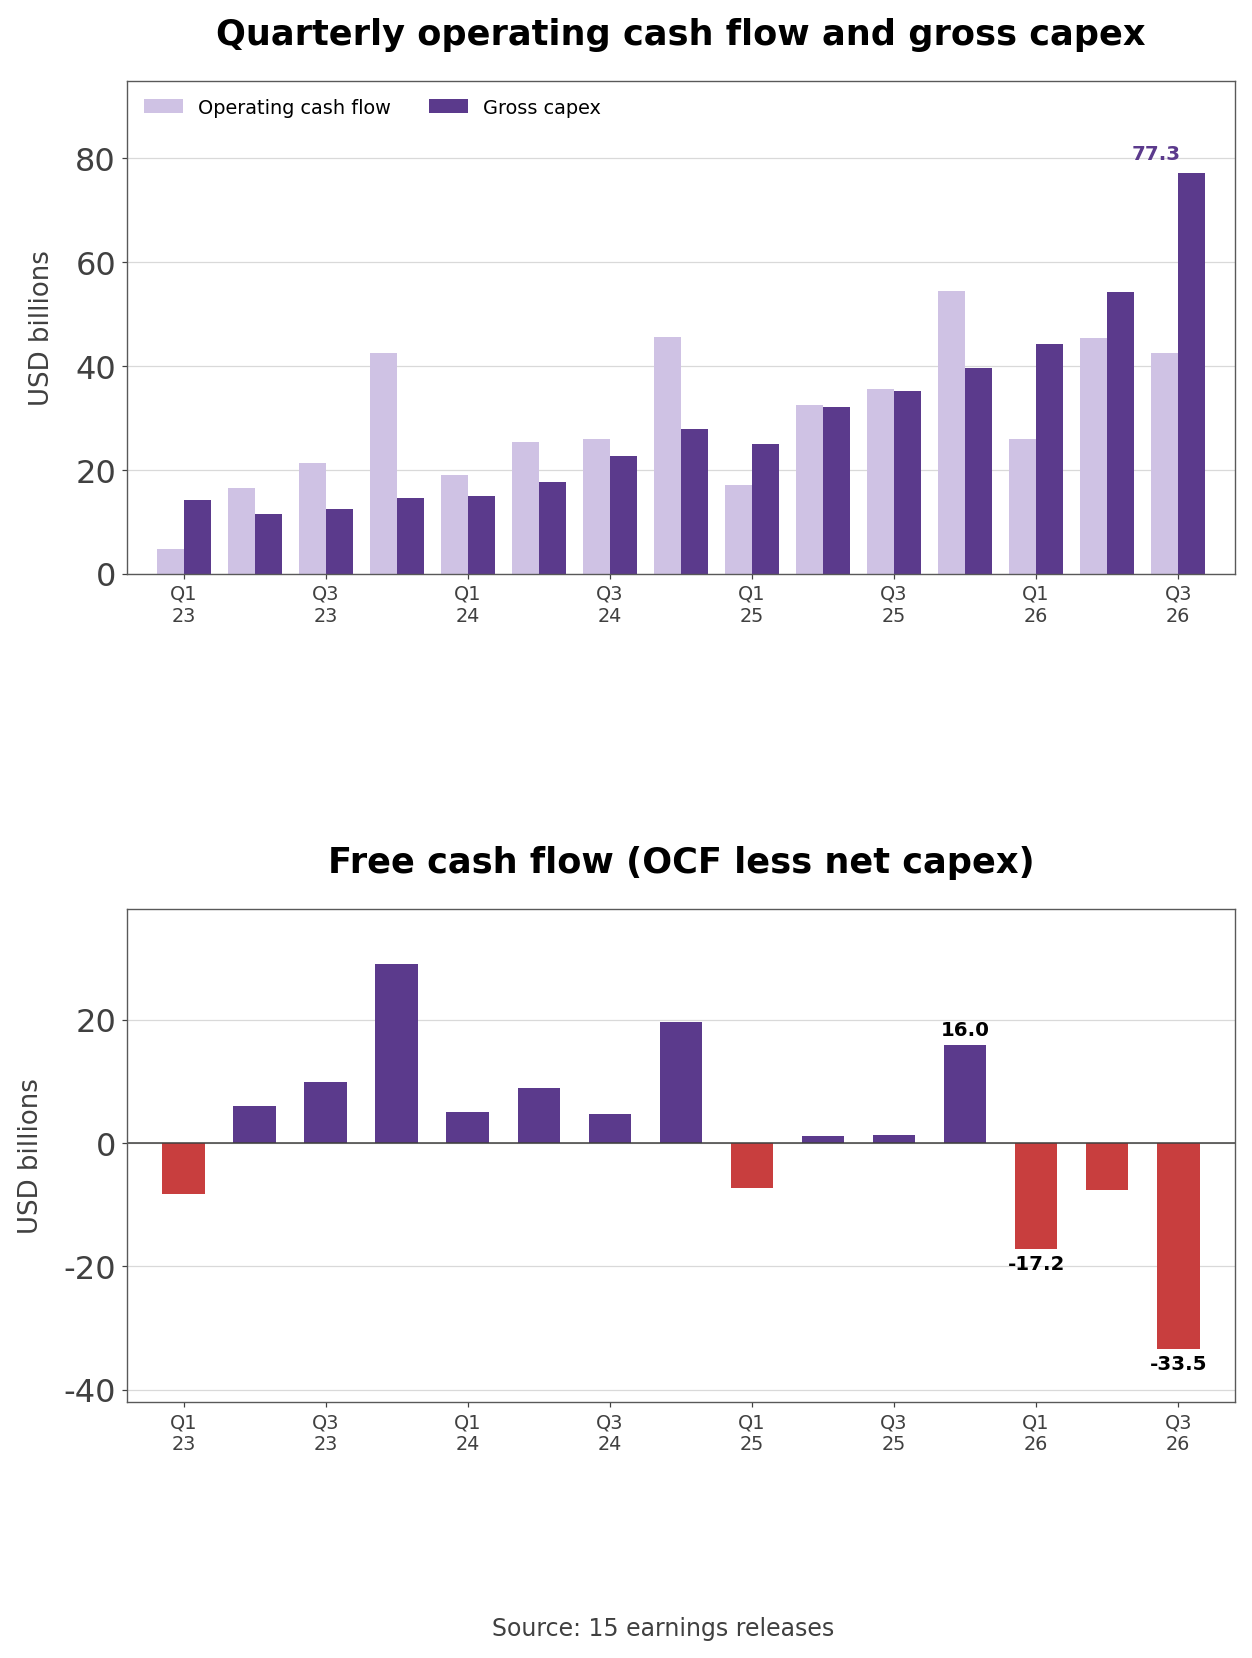
- Quarterly gross capex is 5.4 times its level of $14.21 billion in Q1 2023. The cost is arriving: depreciation and amortization rose +24.7% to $20.95 billion in Q3. Net property and equipment grew from $357.03 billion to $508.86 billion in nine months, and total assets passed $1.24 trillion.
- Debt filled the gap. Amazon raised $115.10 billion of long-term debt in nine months, $48.10 billion of it in Q3, and in June signed a $17.5 billion delayed-draw term loan with lenders led by Citibank. Cash and equivalents fell from $86.81 billion to $55.78 billion over the same period.
How Amazon Makes Money From Retail and AWS
- Of Q3 revenue of $201.94 billion, online stores brought $68.47 billion (33.9%), third-party seller services $46.49 billion (23.0%) and AWS $45.98 billion (22.8%). Advertising added $19.64 billion (9.7%), subscriptions such as Prime $14.01 billion (6.9%) and physical stores $5.71 billion (2.8%).
- The 10-K defines each line. Seller services are commissions and fulfillment and shipping fees from sellers who sell in Amazon's stores, where Amazon is not the seller of record. Advertising covers sponsored ads, display and video ads sold to sellers, vendors and publishers and billed by clicks or impressions. Subscriptions are Prime fees and digital video, audiobook, music and e-book access, and AWS bills compute, storage, database and other services as they are used.
- Prime Day timing distorts the quarter. The release says Prime Day fell in Q2 in most large countries this year, cutting Q3 growth by about 4 percentage points. Excluding currency, online store growth went from 15% in Q2 to 2% in Q3, seller services from 16% to 10% and advertising from 26% to 12%, while subscriptions held at 12%. Combining the two quarters cancels the shift: online stores +7.8%, seller services +12.6% and advertising +18.1% versus the same two quarters of 2025.
- By segment, North America earned $8.72 billion on $112.85 billion of revenue (7.7% margin, up from 4.5%) and International $1.58 billion on $43.11 billion (3.7%, up from 2.9%). AWS operating income of $17.77 billion was 63.3% of the company total from 22.8% of revenue, and over four quarters AWS earned $61.02 billion on $161.38 billion, a 37.8% margin. AWS supplied $12.98 billion, or 59.6%, of the $21.78 billion revenue increase.
- Retail profitability is improving too. North America and International together grew revenue +6.0% to $155.96 billion while operating income rose +72.1% to $10.30 billion, lifting the retail margin from 4.1% to 6.6%. Jassy says broader selection and faster delivery are winning share with better margins, and on the July call Amazon said it would more than double its robotic arms in 2026.
- AWS also designs its own chips, Trainium for AI and Graviton for general computing. On the July call management said the chip business runs at more than $25 billion a year and that both Anthropic and OpenAI have made multi-year, multi-gigawatt Trainium commitments. Newer bets include grocery, pharmacy, the Amazon Leo satellite network and Zoox, and in April Amazon agreed to buy Globalstar while signing Apple to use Amazon Leo for iPhone and Apple Watch satellite services.
How Amazon Compares With Three Big Peers
- The peers are Microsoft and Alphabet, AWS's cloud rivals, and Walmart, the benchmark for physical retail, since Amazon combines both businesses. Market values are $3.94 trillion for Microsoft, $3.49 trillion for Alphabet, $2.63 trillion for Amazon and $961.97 billion for Walmart on market data.
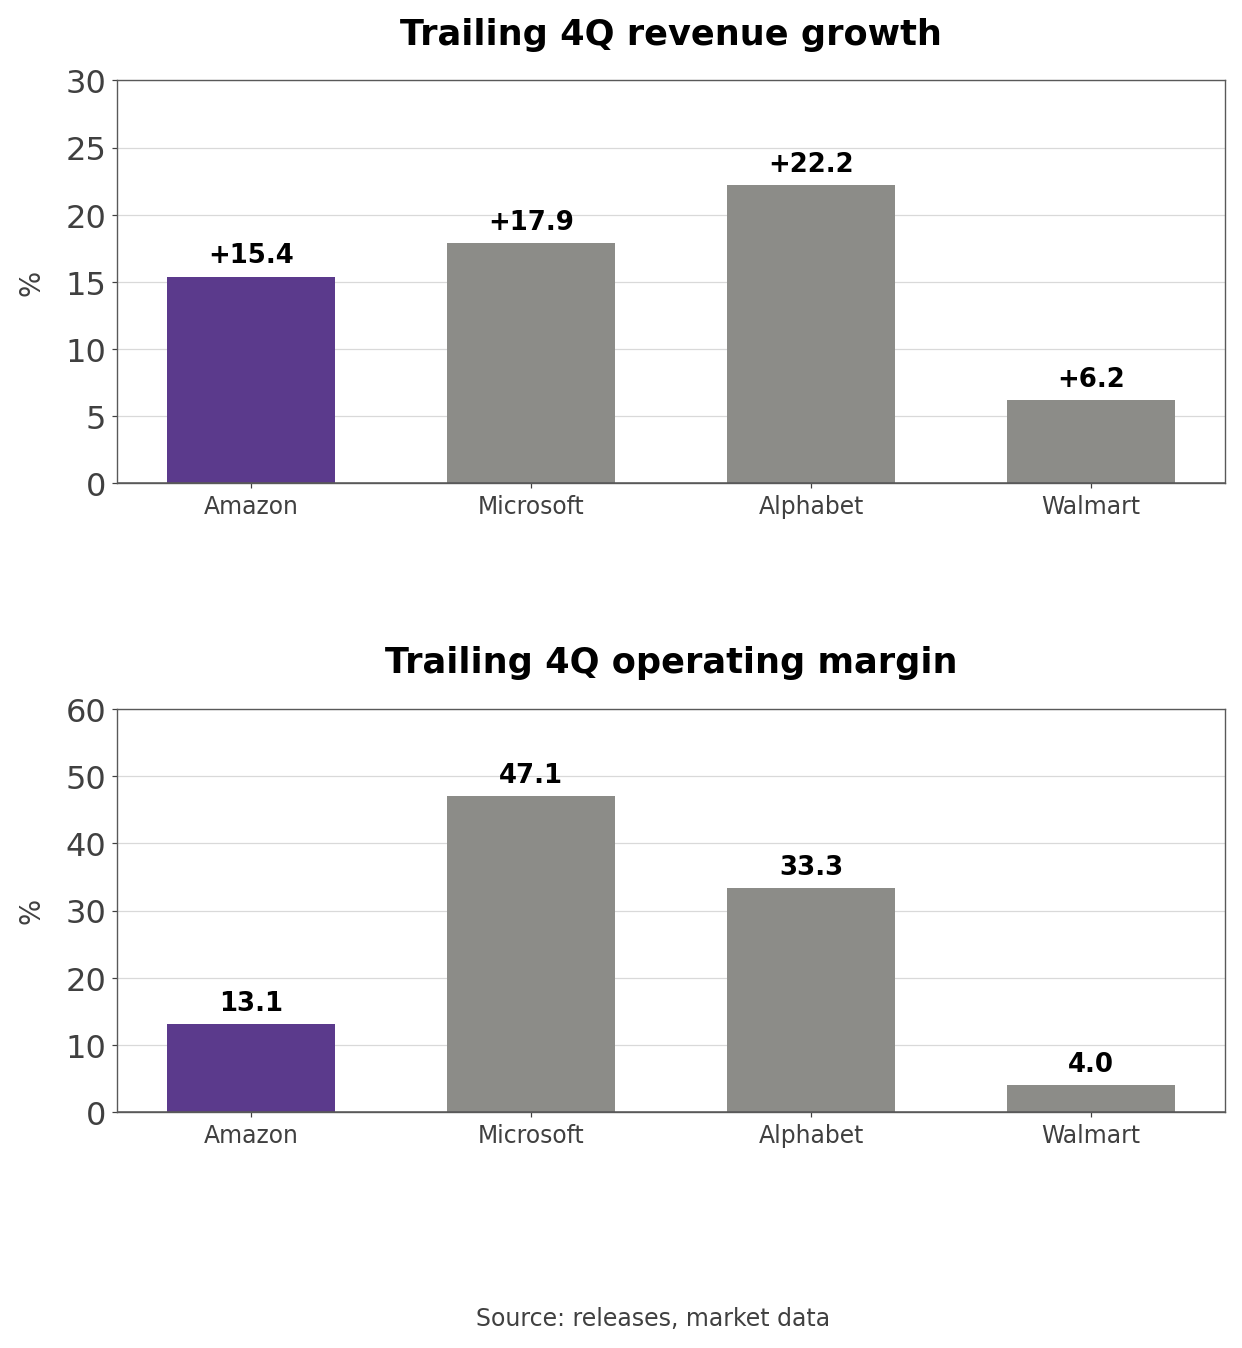
- Trailing four-quarter revenue growth was +22.2% at Alphabet, +17.9% at Microsoft, +15.4% at Amazon and +6.2% at Walmart, with Walmart through July. Over the same trailing four quarters, operating margins were 47.1% at Microsoft, 33.3% at Alphabet, 13.1% at Amazon and 4.0% at Walmart. Amazon's revenue of $797.46 billion is close to Walmart's $735.84 billion, but its operating income of $104.37 billion is 3.6 times Walmart's $29.38 billion.
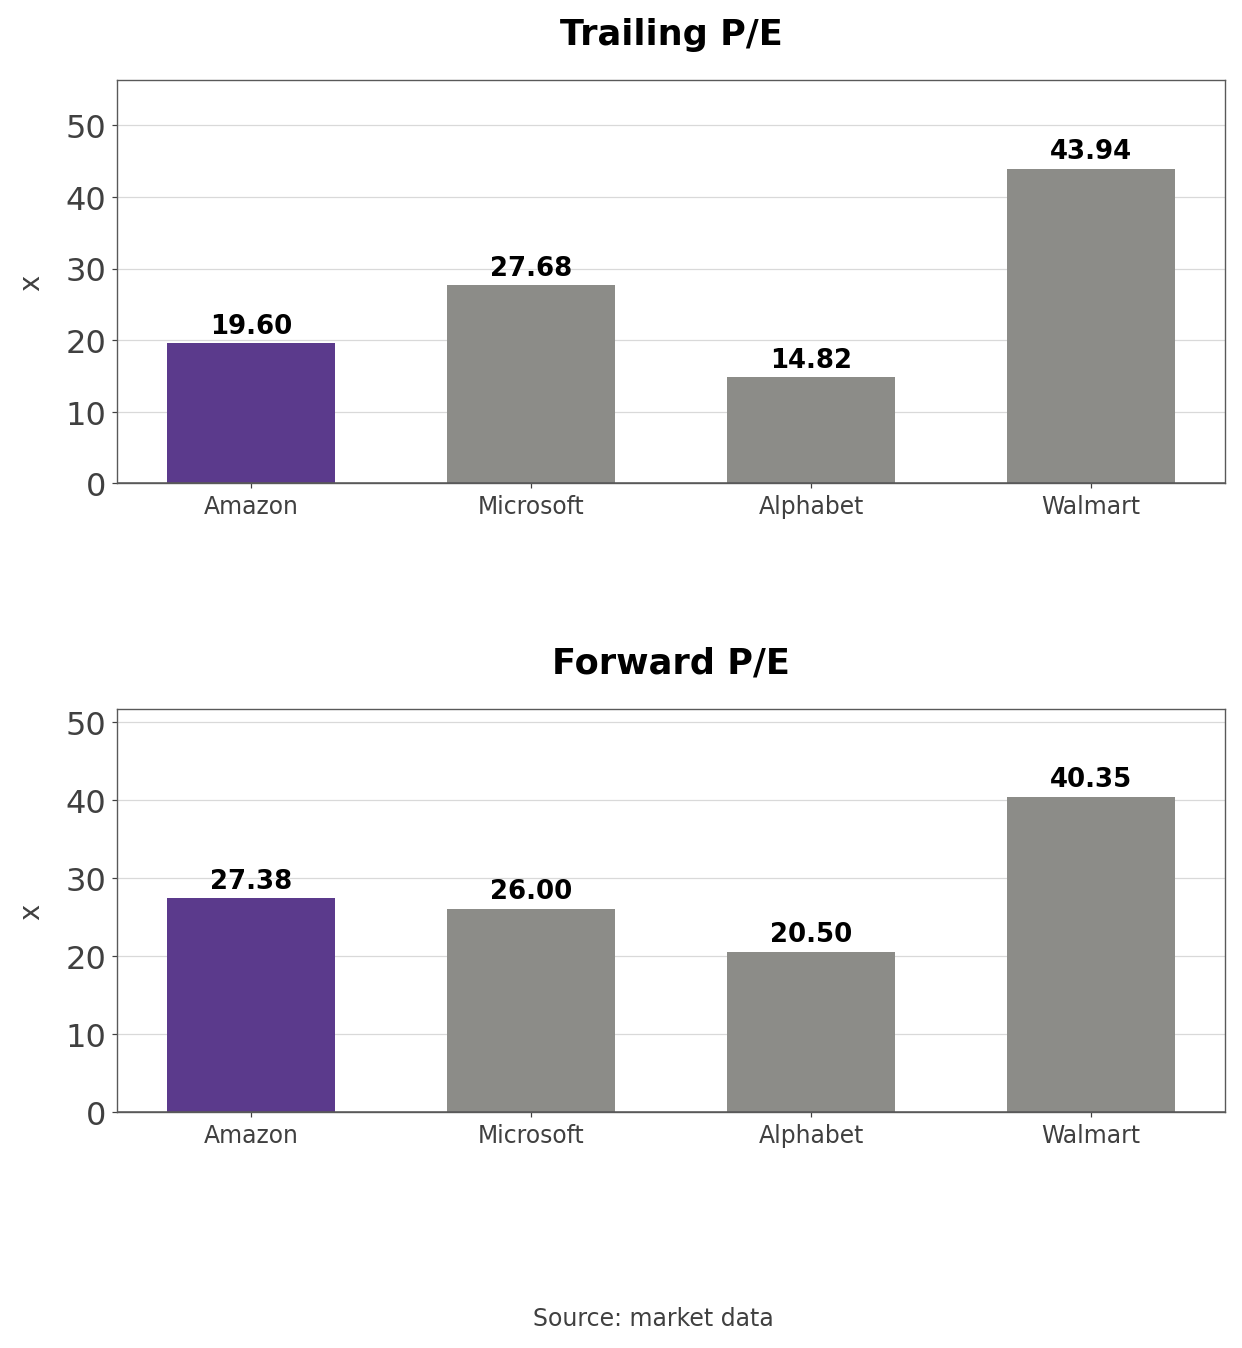
- Trailing P/E on market data is 14.82 for Alphabet, 19.60 for Amazon, 27.68 for Microsoft and 43.94 for Walmart; both Alphabet and Amazon look cheaper than they are because equity gains inflate net income. Forward P/E is 40.35 for Walmart, 27.38 for Amazon, 26.00 for Microsoft and 20.50 for Alphabet, and one-year market value changes were +15.5% at Walmart, +11.0% at Alphabet, +8.6% at Amazon and -0.4% at Microsoft.
Amazon's Operating Income Multiple and Price-to-Sales Band
- Market value divided by trailing operating income of $104.37 billion is 25.25 times, the lowest of the 59 months since December 2021 and well below the median of 39.41. When operating income was depressed in May 2023 the multiple reached 93.44. Market value rose 8.6% over the past year while trailing operating income grew +37.0%.
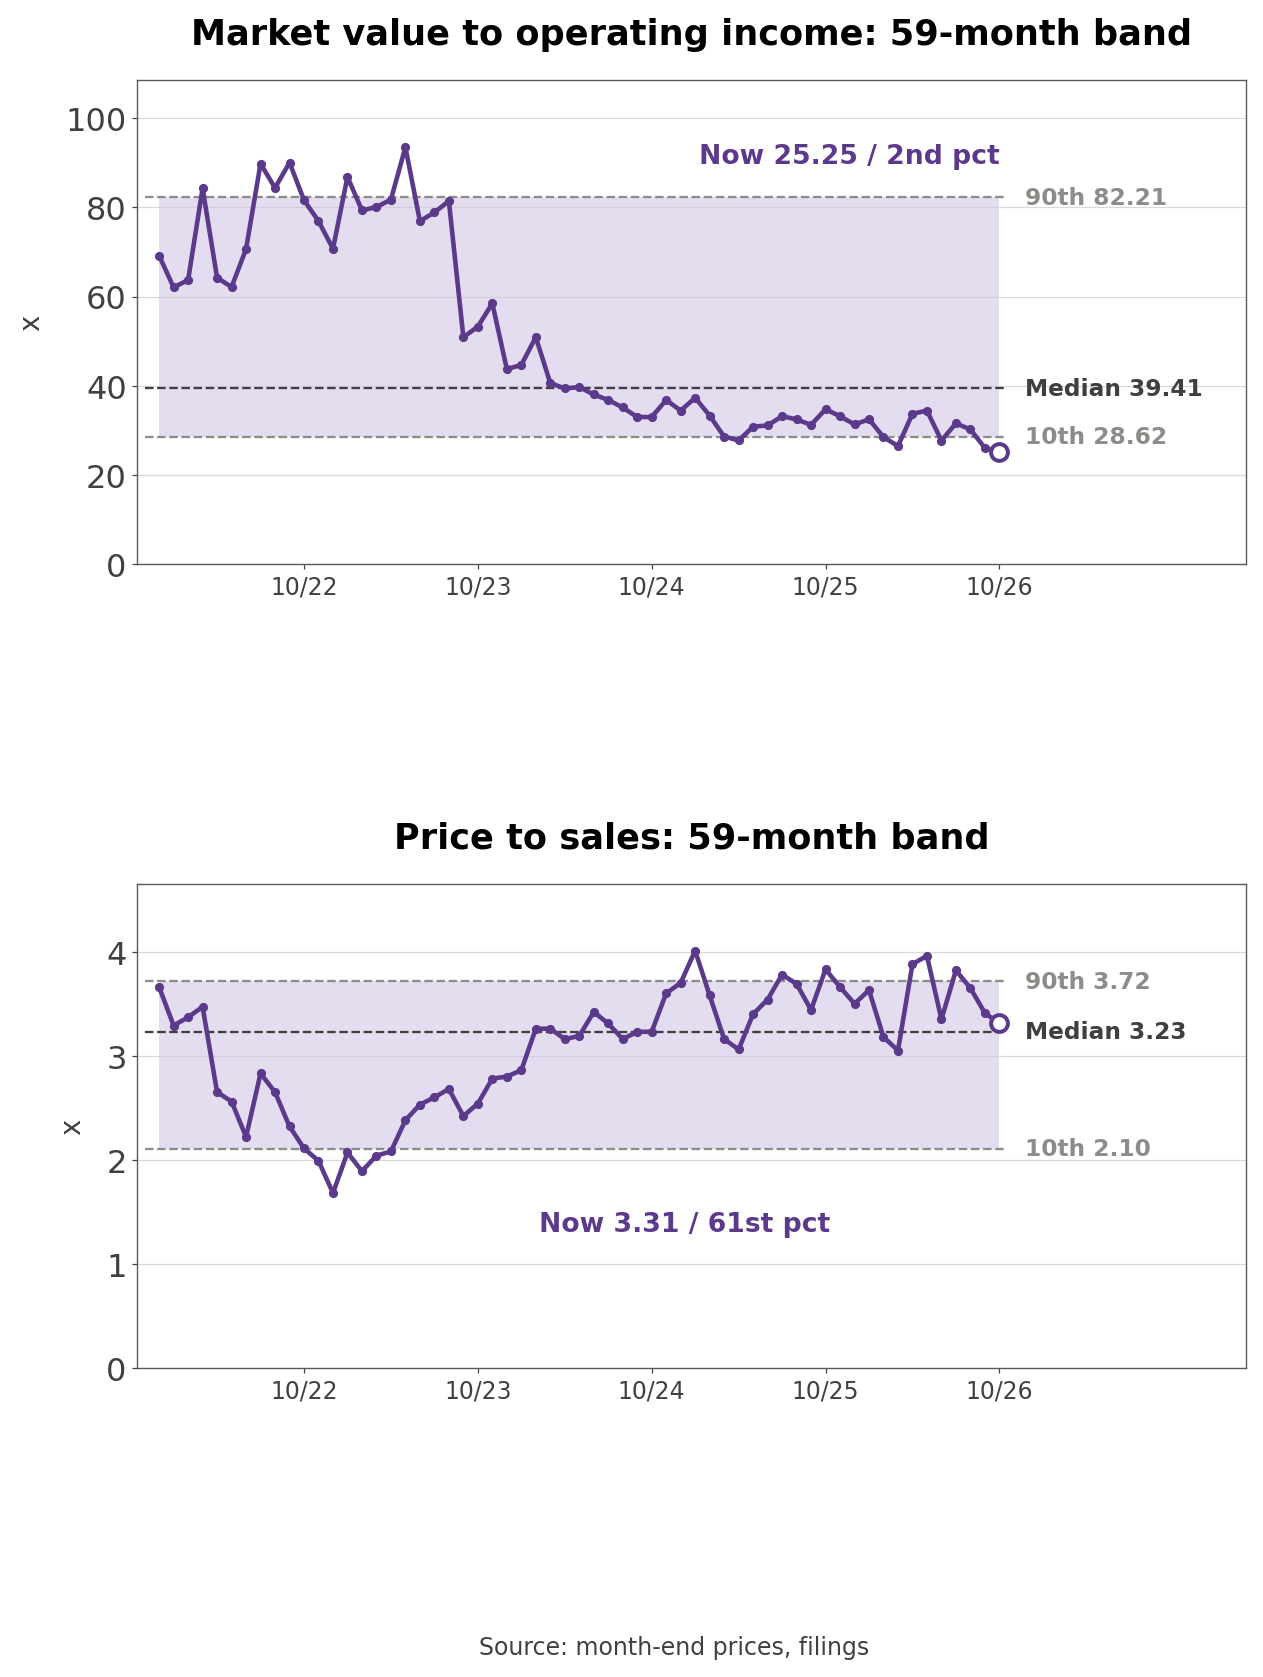
- Price to sales of 3.31 sits at the 61st percentile, almost exactly on the median of 3.23, within a range of 1.68 in December 2022 to 4.01 in January 2025. At the after-hours price of $231.48, the operating income multiple drops to 23.98.
- Outside view (market data, after the Q3 report): Of 60 analysts, 42 rate the stock a strong buy, 16 a buy and 2 a hold, with an average price target of $332.41. Average revenue estimates are $828.64 billion for 2026 and $949.99 billion for 2027, and another data source puts the P/E at 34.04 against a five-year median of 55.81.
Three Conditions That Move the Stock
- AWS growth was 39.3% in Q3. If quarterly numbers track Jassy's call for more than 40% in 2027 and 2028 and the backlog grows from enterprise contracts beyond the two labs, the concentration question fades; growth slipping toward the low 30s would point to a backlog that converts slowly over long contracts.
- Trailing free cash flow is -$42.36 billion. Fourth-quarter net capex of about $47.8 billion under guidance would improve that figure, while a 2027 capex plan above 2026 would mean more borrowing on top of the $115.10 billion raised this year.
- The OpenAI and Anthropic stakes carried $122.3 billion at June 30. New funding rounds or listings would reprice them and swing net income; a slowdown in either lab's compute demand or funding would hit the backlog and the stakes at the same time.
What to Watch in the Q3 10-Q and Q4 Report
- The Q3 10-Q, due shortly, will show the September backlog, its weighted life and the carrying values of the two lab stakes. Fourth-quarter results in early February should bring the 2027 capex plan and show whether Q4 net capex actually fell toward $47.8 billion.
- One question stays open. Excluding the two AI labs Amazon has invested in, how much has the AWS backlog from ordinary enterprise customers grown from $195 billion a year ago?
Related Analysis
- NVIDIA (NVDA) Stock Analysis: Guarantees and Cash Flow: a supplier that backs OpenAI through lease guarantees, useful for comparing it with Amazon's mix of equity stakes and cloud contracts with the same customer.
- Oracle (ORCL) Stock Analysis: Cash Flow and Capex Gap: another cloud provider whose capex outran operating cash flow, a reference for Amazon's 125.2% net capex ratio.
#Amazon #AMZNStock #AWS #CloudStocks #AIInfrastructure #OpenAI #USStocks #StockAnalysis #EquityResearch #GlobalStockBrief
'US Stock Analysis' 카테고리의 다른 글
| Verizon (VZ) Stock: Record Adds and Flat Revenue Ex Frontier (0) | 2026.11.02 |
|---|---|
| ServiceNow (NOW) Stock: Armis Inside an 18.5% cRPO Guide (0) | 2026.11.02 |
| Alphabet (GOOGL) Stock: Equity Raise and Cloud Up 103% (0) | 2026.11.01 |
| Microsoft (MSFT) Stock: OpenAI Is 10.8% of Revenue (0) | 2026.11.01 |
| Coca-Cola (KO) Stock: The IRS Appeal and 1.3x Leverage (0) | 2026.10.30 |


