
- Verizon (NYSE: VZ) added 406,000 postpaid phone customers in the third quarter of 2026, its best third quarter in five years, and its new mobility and broadband service revenue line grew +2.9% to $23.49 billion. The 10-Q tells a different story underneath: fiber revenue added through the Frontier acquisition rose $765 million, more than the entire $651 million increase in service revenue. Strip out fiber and service revenue was -0.5% year over year.
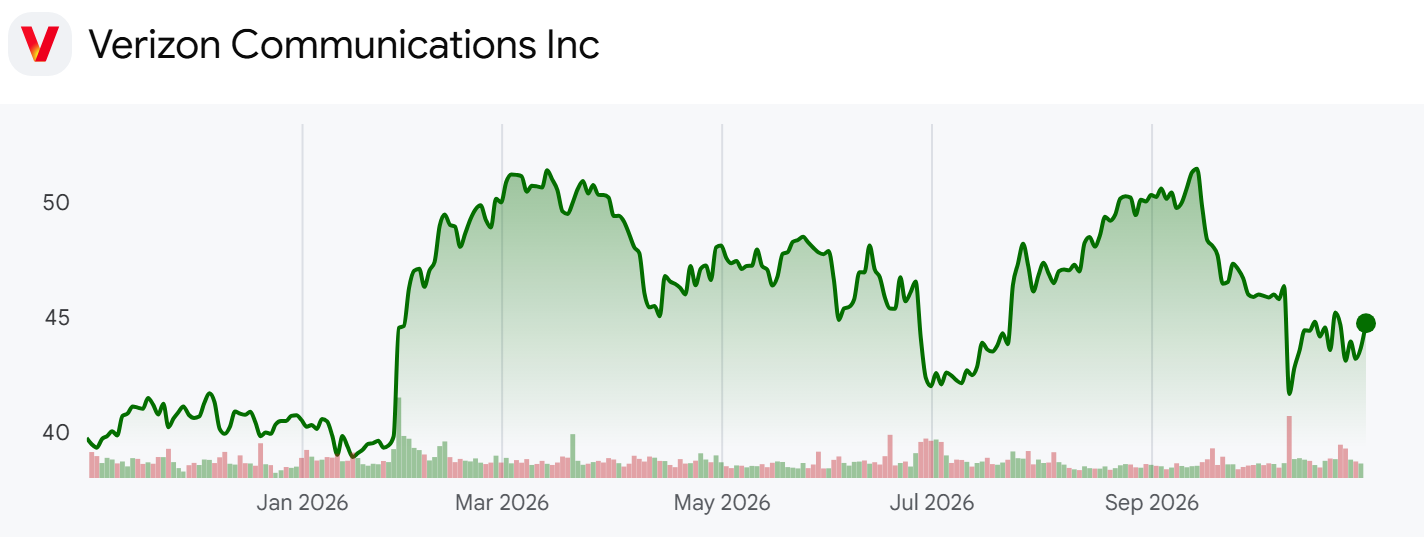
- Verizon sells wireless phone and data plans, fiber internet and fixed wireless access (FWA) home internet to consumers and businesses, and collects most of its revenue as monthly service fees. At $44.73 and 4.145 billion shares outstanding, its market value is about $185.4 billion, and Q3 revenue was $34.31 billion.
- The question is whether record subscriber growth is turning into revenue. Frontier, the fiber company Verizon bought on January 20, 2026, now sits inside revenue, EBITDA and guidance, and the numbers the company highlights point one way while the legacy wireless numbers point another. The analysis lines up the Q3 earnings release, the Q3 10-Q, Frontier's Q3 2025 earnings release, the Q3 investor presentation, the financial and operating information file, the Q3 call transcript and 32 quarterly releases back to the December 2018 quarter.
- Two caveats apply. The 10-Q says fiber revenue rose primarily because of Frontier but does not size Frontier separately, so the ex-fiber figures here also remove growth in Verizon's own Fios fiber business. The Frontier comparison numbers come from Frontier's last quarter as a standalone company, Q3 2025.
What the Q3 Investor Deck Says About Net Adds and Guidance
- Slide 4 of the Q3 deck puts three numbers in large type on the left: 137,000 postpaid account net adds (up 313,000 from a year earlier), postpaid phone churn of 0.94% against 0.98% a year earlier, and 3.3 million postpaid upgrades, down 20.3%. On the right, postpaid phone net adds go from 44,000 in Q3 2025 to 616,000 in Q4 2025, then 55,000, 184,000 and 406,000 in the first three quarters of 2026.
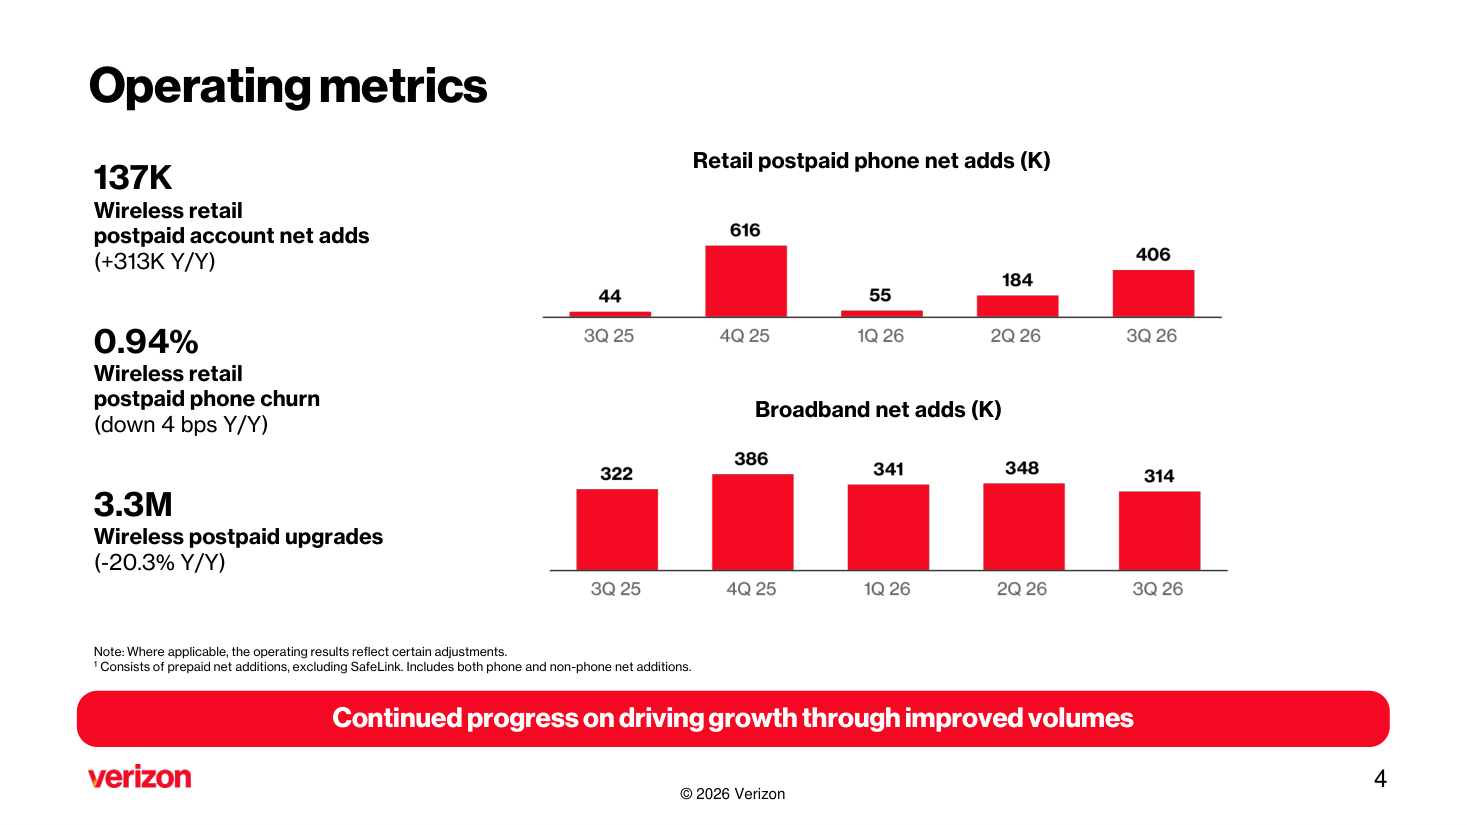
- The banner under the slide says growth is coming from improved volumes. The release adds that promotional cost of acquisition fell 41% and retention cost fell 30%. With fewer customers upgrading phones, equipment revenue was -9.0%, which the company attributed to customers keeping devices longer and to its decision to cut device subsidies.
- The account comparison needs its base year. The 313,000 improvement works because Verizon lost 176,000 postpaid accounts in Q3 2025, so this year's 137,000 gain mostly wins back what was lost a year ago. The same slide shows broadband net adds slipping from 322,000 to 314,000, so the volume recovery is concentrated in phones.
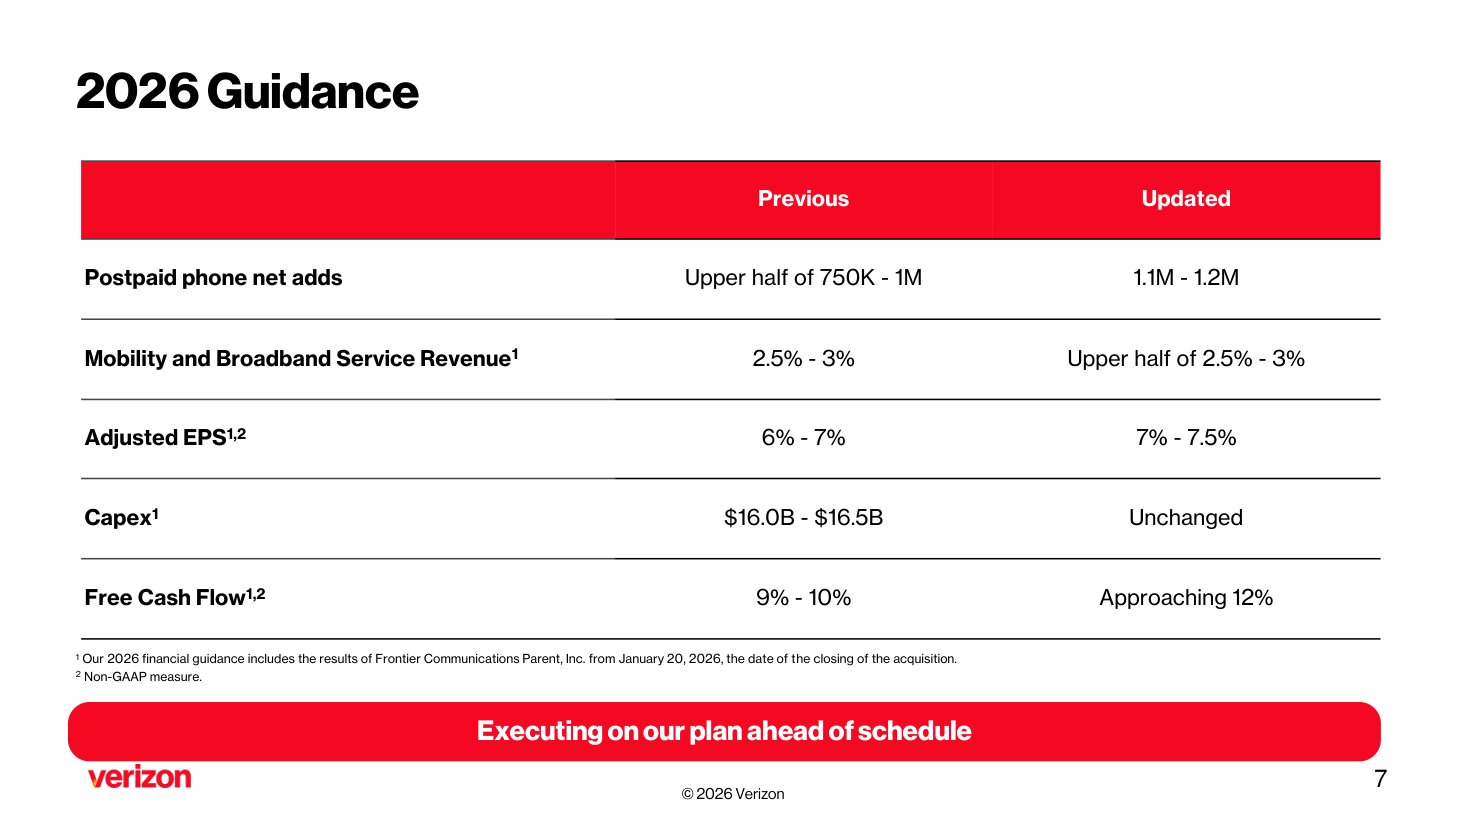
- Slide 7 raised guidance for the third straight quarter. Postpaid phone net adds moved from the upper half of 750,000 to 1 million up to 1.1 million to 1.2 million. Adjusted EPS growth moved from 6%-7% to 7%-7.5%, free cash flow growth from 9%-10% to approaching 12%, and capex stayed at $16.0 billion to $16.5 billion. Mobility and broadband service revenue growth moved to the upper half of 2.5%-3%.
- Own calculation (deck slide 7 and operating file): Nine-month postpaid phone net adds were 645,000, so hitting the new range takes another 455,000 to 555,000 in Q4 alone. That is less than the 616,000 of Q4 2025, Dan Schulman's first quarter as CEO, but more than this year's Q3.
- The first footnote on the slide is the key to reading it: 2026 guidance includes Frontier's results from January 20, 2026. A company that was not in last year's numbers is in this year's, so every growth rate in the guidance table carries some acquisition effect.
The New Service Revenue Line and Frontier
- Slide 5 lines up mobility and broadband service revenue at +2.9%, adjusted EBITDA at +8.0% and adjusted EPS at +8.3%. The service revenue line is new for 2026: it groups wireless service, FWA, Fios internet and other fiber services, and Verizon recast 2025 on the same basis. Growth has gone from 1.6% in Q1 to 2.8% in Q2 and 2.9% in Q3.
- Reading the recast series quarter by quarter shows something else. Consumer service revenue moved from $19.02 billion in Q4 2025 to $19.18 billion in Q1 2026, an increase of only $156 million in the quarter that Frontier joined on January 20. Page 5 of the operating file shows headcount falling from 100,200 a year earlier to 89,900 at the end of 2025, rising to 99,600 with Frontier and settling at 93,300 in September.
- Filing footnote (Q3 10-Q, quarter ended September 30, 2026): The first driver of the Consumer increase was "an increase of $700 million in fiber broadband revenue primarily due to the inclusion of Frontier results", while postpaid revenue fell $299 million because of "the amortization of wireless equipment sales promotions and acquisition related discounts". Business added $65 million of fiber and lost $96 million of postpaid revenue, which the filing blamed on new customers choosing lower-tier plans.
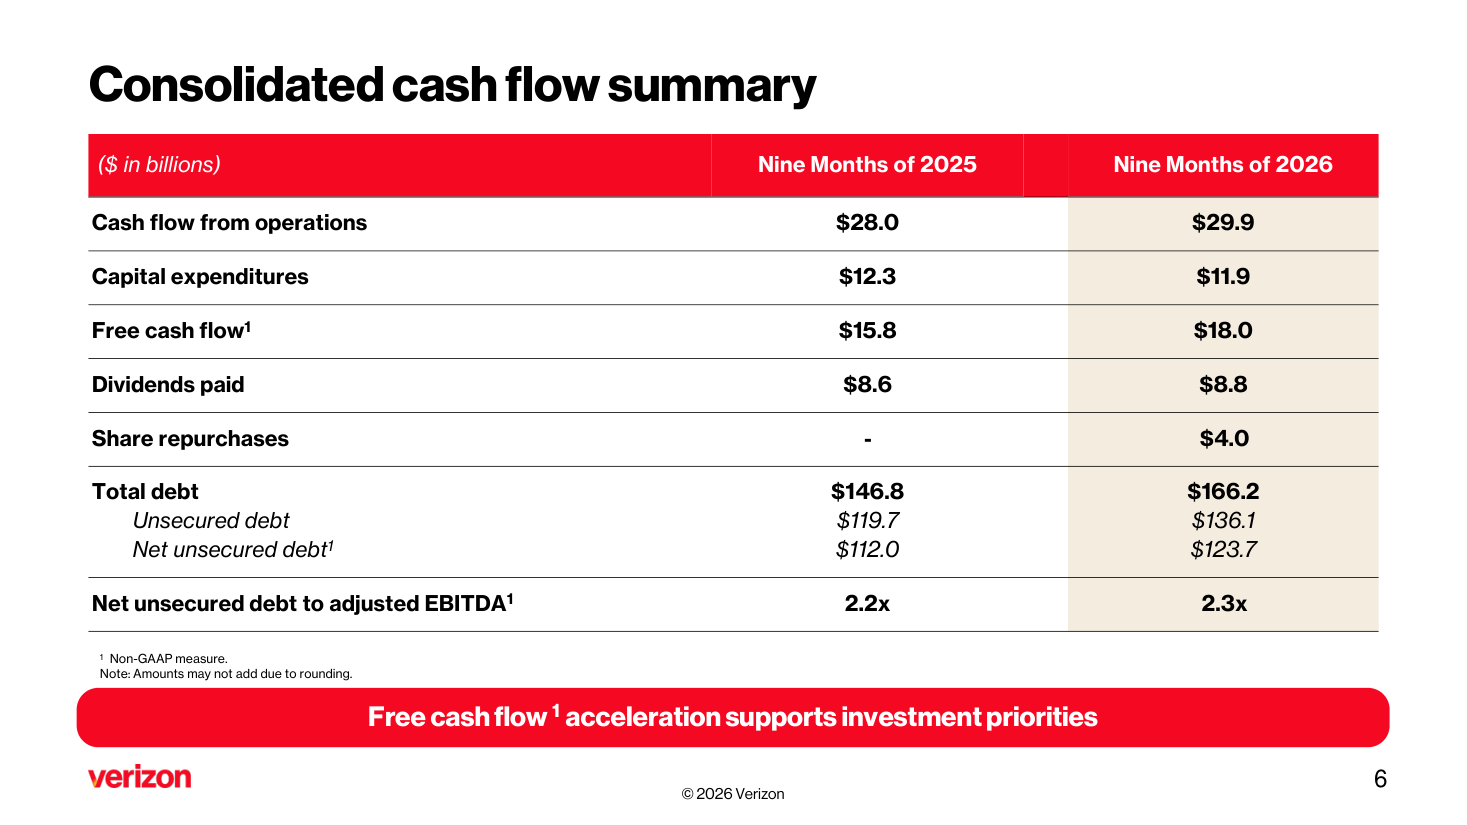
- Slide 6 covers cash. Nine-month operating cash flow was $29.9 billion, capex $11.9 billion and free cash flow $18.0 billion, against $8.8 billion of dividends and $4.0 billion of buybacks. Total debt rose from $146.8 billion to $166.2 billion and net unsecured debt to adjusted EBITDA from 2.2x to 2.3x. The 10-Q says Verizon paid about $9.8 billion in cash for Frontier and assumed about $12.9 billion of its debt.
- The 2.3x looks better quarter by quarter. Page 5 of the operating file shows the ratio at 2.2x in September and December 2025, jumping to 2.6x in March 2026 right after the deal, then 2.5x in June and 2.3x in September, as Frontier EBITDA built up in the denominator and cash flow paid down debt.
- Own calculation (operating file and 10-Q): The $651 million increase in Q3 service revenue across Consumer and Business splits into +$765 million of fiber, -$395 million of postpaid and +$281 million of everything else. Without fiber the change is -$114 million, or -0.5%, and Q2 worked out to -0.6% on the same basis.
The Bull and Bear Case for Verizon Shares
- The bull case rests on profit and cash. Adjusted EBITDA margin hit a record 40.2%, nine-month free cash flow grew +14.3% and covered $12.8 billion of dividends and buybacks, and Verizon added subscribers while cutting promotion spending.
- The bear case rests on where revenue comes from. Service revenue growth came from Frontier's fiber, postpaid accounts sit at 34.47 million, the same as a year ago, and revenue per account (ARPA) fell 1.9% to $168.08. Net unsecured debt rose to $123.7 billion and the leverage target is now a 2027 event.
From the C-Band Auction to the Schulman Era
- In February 2021 Verizon won 3,511 licenses in the FCC's C-band auction, with the stock at a $55.30 month-end close. Shares then fell to $32.41 by September 2023, when the adjusted P/E hit its 59-month low of 6.72 and annual free cash flow had dropped from $23.58 billion in 2020 to $14.05 billion in 2022.
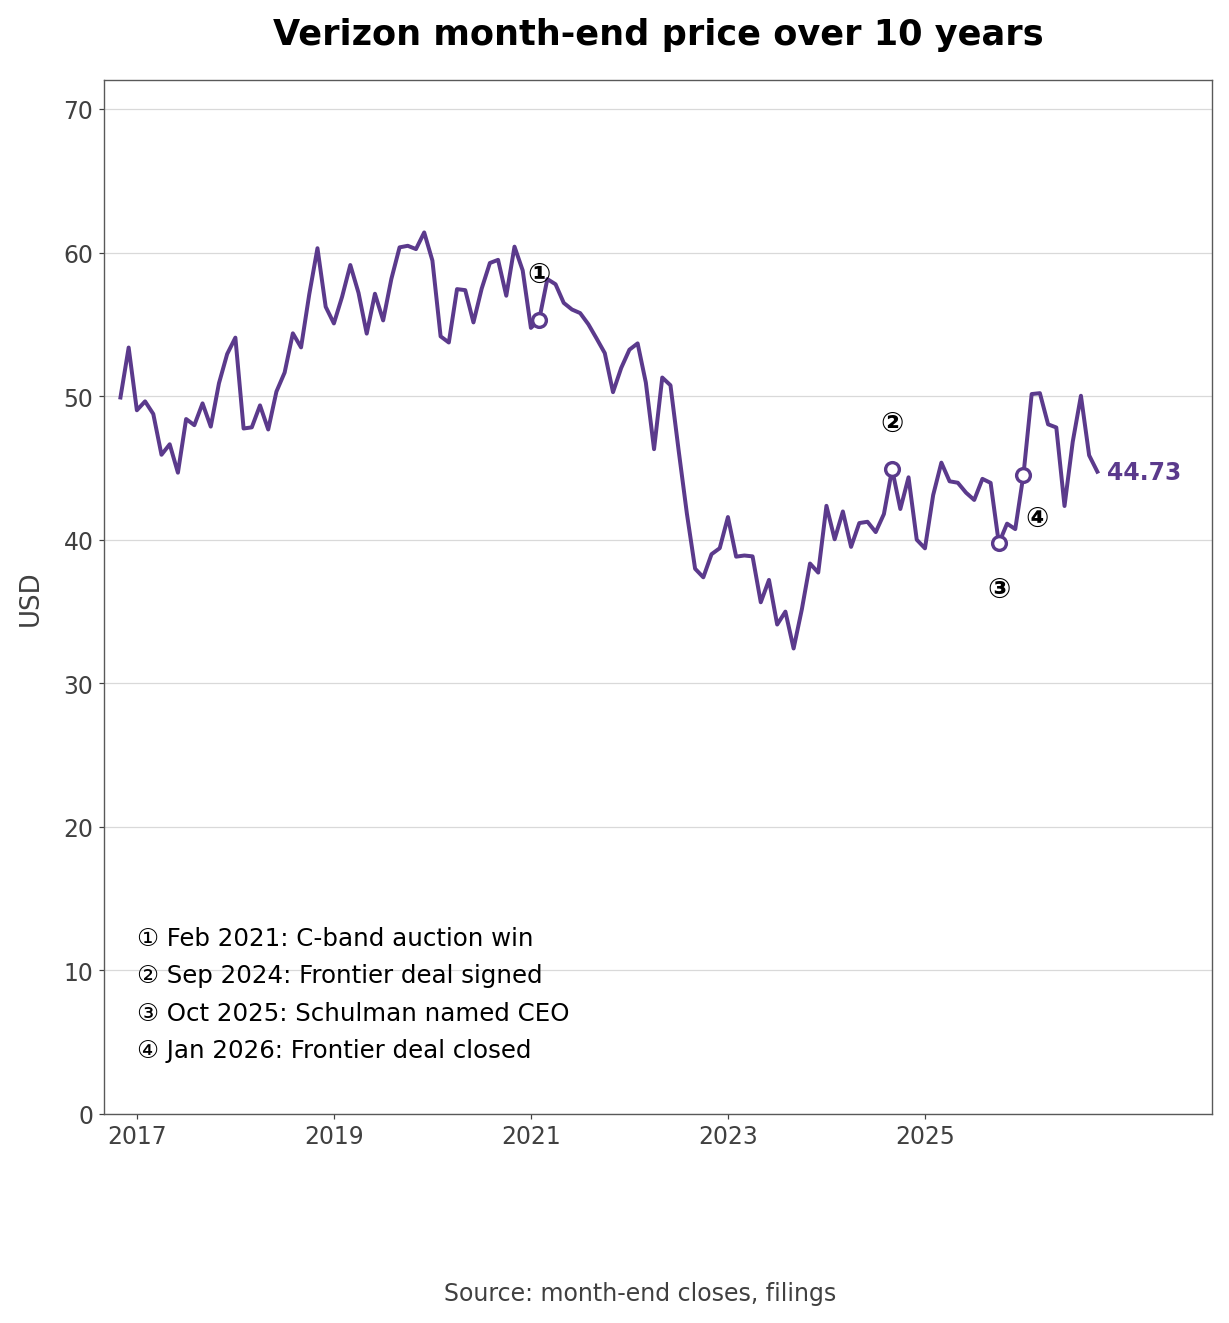
- In September 2024 Verizon agreed to buy Frontier, and in October 2025 the board named Dan Schulman, a director since 2018 and former PayPal CEO, as chief executive. His first quarter, Q4 2025, produced 616,000 postpaid phone net adds but the lowest adjusted EBITDA of the last seven quarters at $11.86 billion, and $1.72 billion of severance plus $583 million of asset rationalization charges cut operating income to $5.00 billion.
- The Frontier deal closed on January 20, 2026, at $38.50 per Frontier share in cash, and on January 30 Verizon also closed Starry, a fixed wireless provider serving apartment buildings in five markets. The stock went from $40.73 at the end of 2025 to $50.02 at the end of August before falling back to $44.73, a 2026 gain of +9.8%.
How Much of Service Revenue Growth Came From Fiber?
- Company disclosure (Q3 call transcript): The CFO said "Wireless service revenue once again improved sequentially, and we expect to see year-over-year growth in Q4." Wireless service revenue in Q3 was still below the prior year.
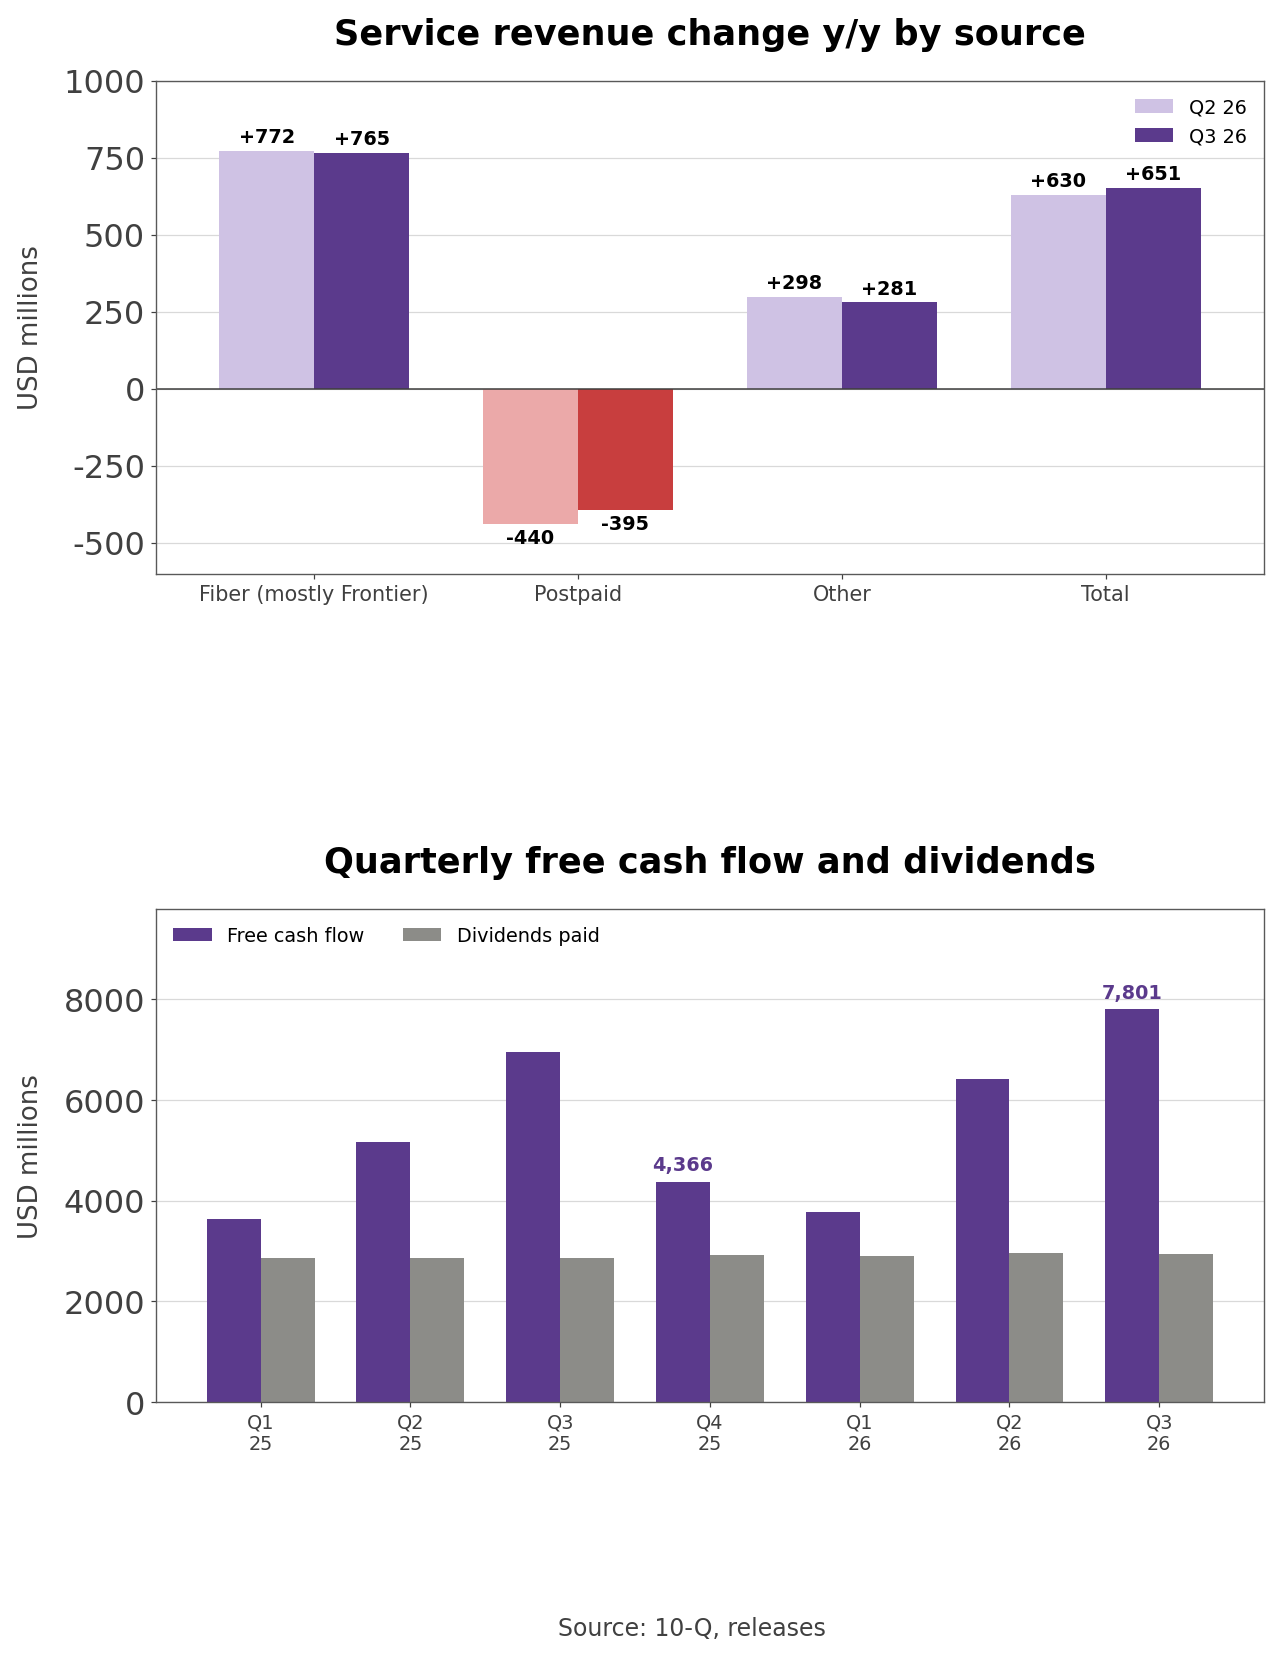
- The nine-month picture is the same. Fiber revenue rose about $2.07 billion across the two segments (about $1.9 billion in Consumer and $170 million in Business), while postpaid revenue fell about $1.35 billion (about $1.1 billion and $251 million). Take fiber out of the $1.63 billion nine-month increase in service revenue and the result is about -$439 million.
- Frontier's own numbers fit the gap. In its last standalone quarter, Q3 2025, Frontier reported revenue of $1.55 billion and adjusted EBITDA of $637 million, with consumer fiber broadband revenue of $521 million, up 25.8%. The 10-Q says the acquired companies' revenue was less than 5% of total revenue and skips pro forma figures because the impact "would not have been material to our consolidated statements of income."
- Own calculation (releases and Frontier release): Subtract Frontier's year-ago adjusted EBITDA of $637 million from Verizon's $1.03 billion Q3 EBITDA increase and roughly $390 million remains, about 3.1% growth rather than 8.0%. Doing the same with Frontier's $1.55 billion of revenue turns Verizon's $492 million revenue increase into a decline of about $1.06 billion.
- Frontier shows up in costs too. The 10-Q names $292 million of higher personnel costs from added Frontier headcount as the first reason Consumer cost of services rose, and amortization of acquired intangibles went from $189 million to $289 million.
Promotion Amortization and Revenue per Account
- Postpaid phone lines grew from 93.25 million to 94.52 million, +1.4%, but postpaid accounts, the unit that pays the bill, are 34.47 million, within 1,000 of a year ago. Because Verizon lost so many accounts in Q3 2025, this year's best quarter in over a decade only brought the count back to where it was.
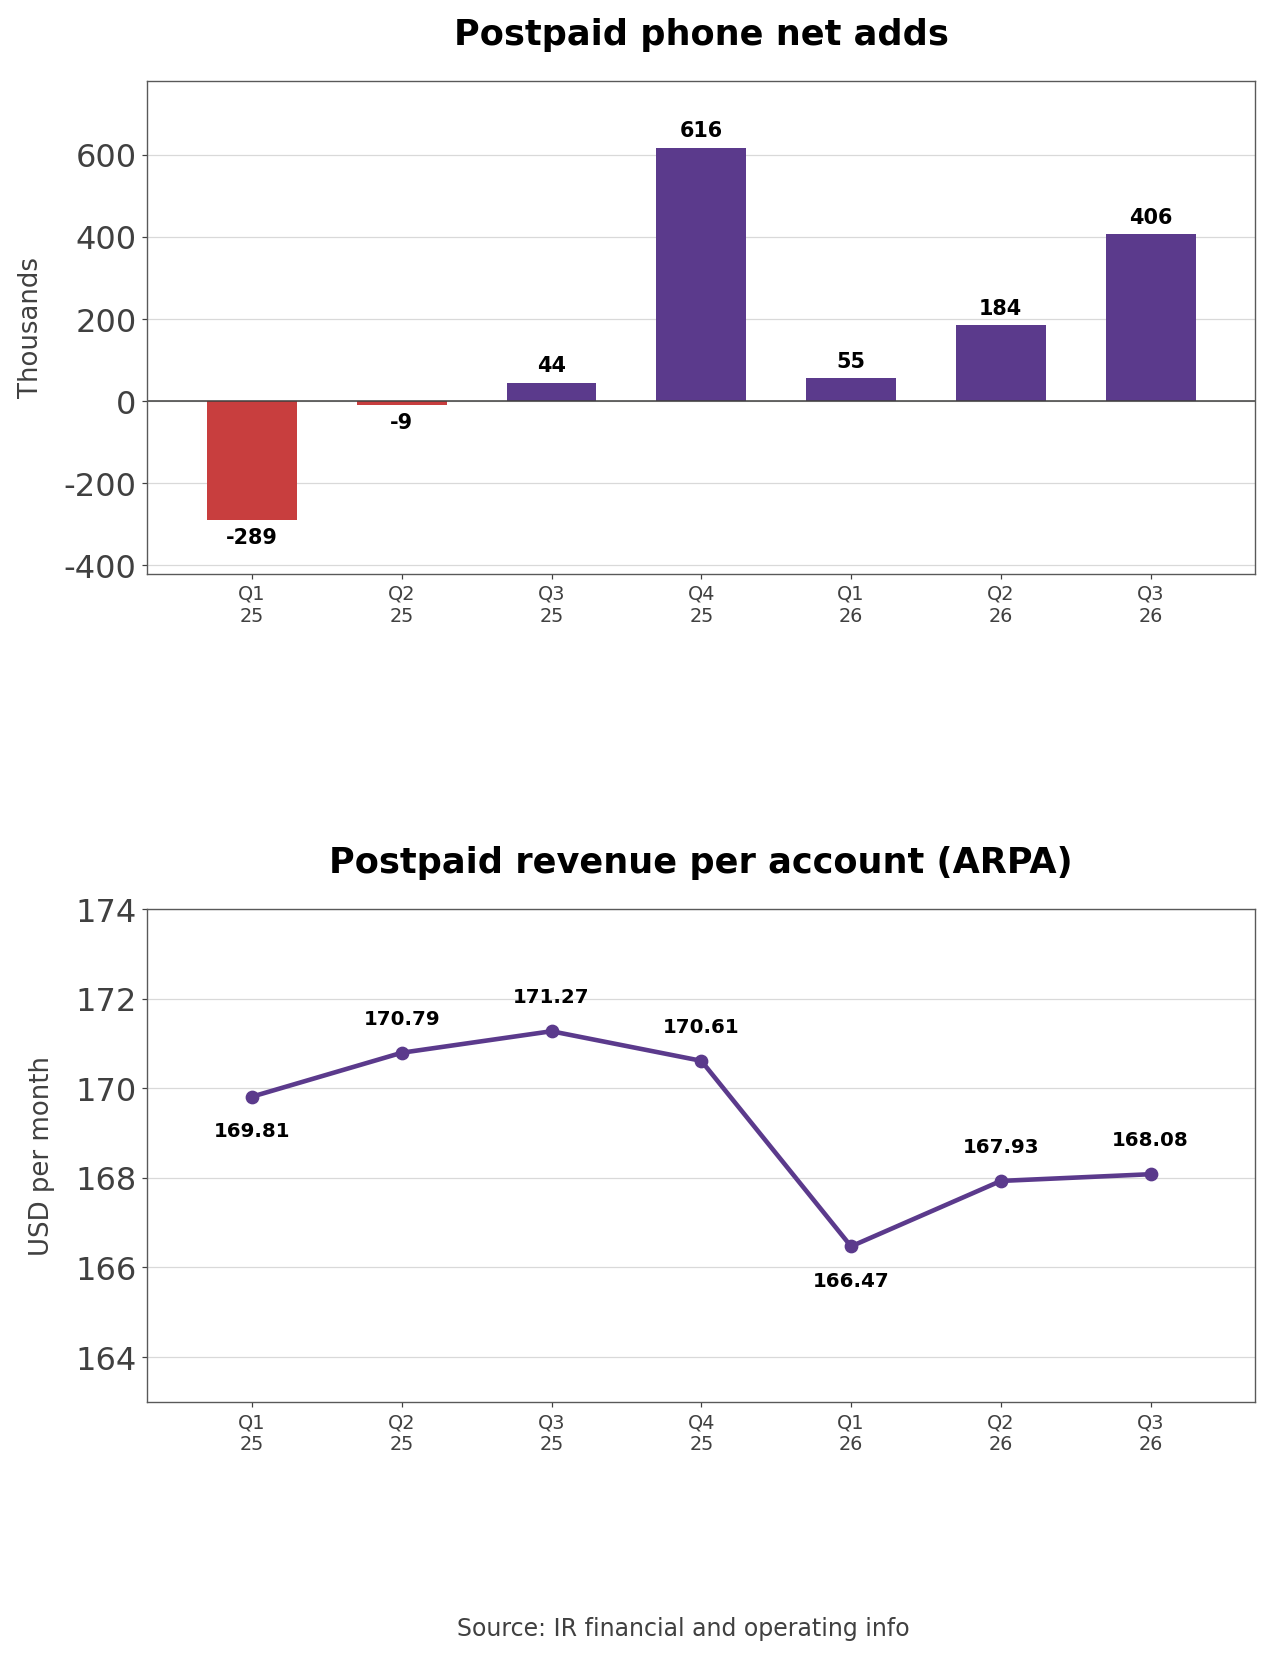
- ARPA fell from $171.27 in Q3 2025 to $166.47 in Q1 2026 and recovered to $168.08 in Q3, for year-over-year changes of -2.0%, -1.7% and -1.9%. Accounts times ARPA, a rough proxy for monthly postpaid revenue, is also down 1.9%.
- The 10-Q explains why. Device discounts are spread over the contract as a reduction of service revenue, so promotions granted in one quarter keep cutting revenue in later quarters. Consumer equipment revenue in Q4 2025 was $7.11 billion, more than $1.7 billion above any other quarter in the series, the same quarter Verizon added 616,000 postpaid phones.
- Management pairs that drag with lower promotion spending. If acquisition promotion cost really fell 41% in Q3, the amortization left behind by today's new customers is smaller, and the Q4 return to wireless service revenue growth is the first number that will test that reading.
How Verizon Makes Money From Wireless and Broadband
- Mobility and broadband service fees are 68.5% of revenue; the rest is device sales and other revenue such as legacy copper products. Devices carry thin margins and mainly hold customers in place, so cutting subsidies also shrinks this low-margin revenue on purpose.
- Consumer revenue was $26.43 billion in Q3, 77% of the total, made up of $19.78 billion of service, $4.28 billion of equipment and $2.38 billion of other revenue such as copper-based wireline products and regulatory fee recovery. Business revenue was $7.02 billion, with $3.71 billion of service and $2.47 billion of other wireline services.
- Consumer sells phone plans, Fios and Frontier fiber internet and FWA to households, while Business sells wireless lines, wireline networks and managed security services to large companies, government agencies and small businesses. More than a third of Business revenue comes from copper and dedicated circuits, which makes that segment more about defense than growth.
- Profit comes from Consumer. Its segment EBITDA margin rose to 45.3% from 43.0% a year earlier against 27.6% in Business, and Consumer operating income of $8.09 billion makes up most of the company's $8.65 billion.
- Wireless revenue comes from plans and add-ons. The release credits Simplicity, a plan structure that leans on simpler pricing and an expanded loyalty program rather than subsidies. Schulman put it this way: "By prioritizing customer-first offerings like Simplicity and our expanded loyalty program over heavy subsidies, we are winning loyal, high-value customers while expanding margins, reducing churn, and generating strong sustained cash flow." The 10-Q lists perks and premium plan adoption as partial offsets to the postpaid decline, and interest on device installment plans sold by agents lands in other revenue.
- Wireless lines totaled 147.10 million at the end of September, including 126.83 million postpaid and 94.52 million postpaid phones. Prepaid had 19.34 million lines and lost 12,000 in Q3, with prepaid revenue per line up 2.5% to $33.51.
- Broadband comes in two forms. Fiber connections jumped from 7.67 million a year ago to 11.07 million with Frontier, and FWA, which delivers home internet over wireless spectrum, grew from 5.39 million to 6.37 million. Of 314,000 broadband net adds in Q3, 155,000 were fiber and 159,000 FWA, and FWA adds were down 39.1% from 261,000 as the company shifts weight toward fiber.
- Fiber is about bundling. Management said on the call that customers with both phone and broadband churn less than single-product customers and that over 55% of new fiber customers choose 1-gig-plus speeds. Verizon expects more than 32 million fiber passings by year-end and 40 million to 50 million over the medium term, and targets more than $1 billion of run-rate cost synergies from Frontier by 2028. Frontier extended the fiber footprint to 31 states and Washington, D.C., and had 8.8 million fiber passings before the deal.
- FWA fills the gaps fiber does not reach. Management plans to scale a faster FWA service using its 1,700 MHz of millimeter-wave spectrum starting in Q4 and to cover another 10 million to 15 million homes with FWA beyond the fiber build. In Q2 the Business segment moved its international wireline connectivity and managed network services business to held for sale.
- There is also a new revenue line. The release announced a $2 billion-plus AI infrastructure agreement with Amazon Web Services under AI Connect, which leases fiber capacity and existing network real estate to AI computing customers. Management said on the call that it has not yet recognized significant AI Connect revenue and expects the impact to begin in 2027.
How Verizon Compares With Three Telecom Peers
- The comparison set is AT&T and T-Mobile in U.S. wireless and Comcast, whose cable network competes with Verizon in broadband. AT&T sells wireless and fiber like Verizon, T-Mobile has been the fastest-growing wireless competitor, and Comcast is the customer pool that FWA and fiber draw from. On market data, trailing four-quarter revenue growth is +9.3% at T-Mobile, +3.5% at AT&T, +1.4% at Verizon and -0.2% at Comcast, and Verizon's figure already includes Frontier.
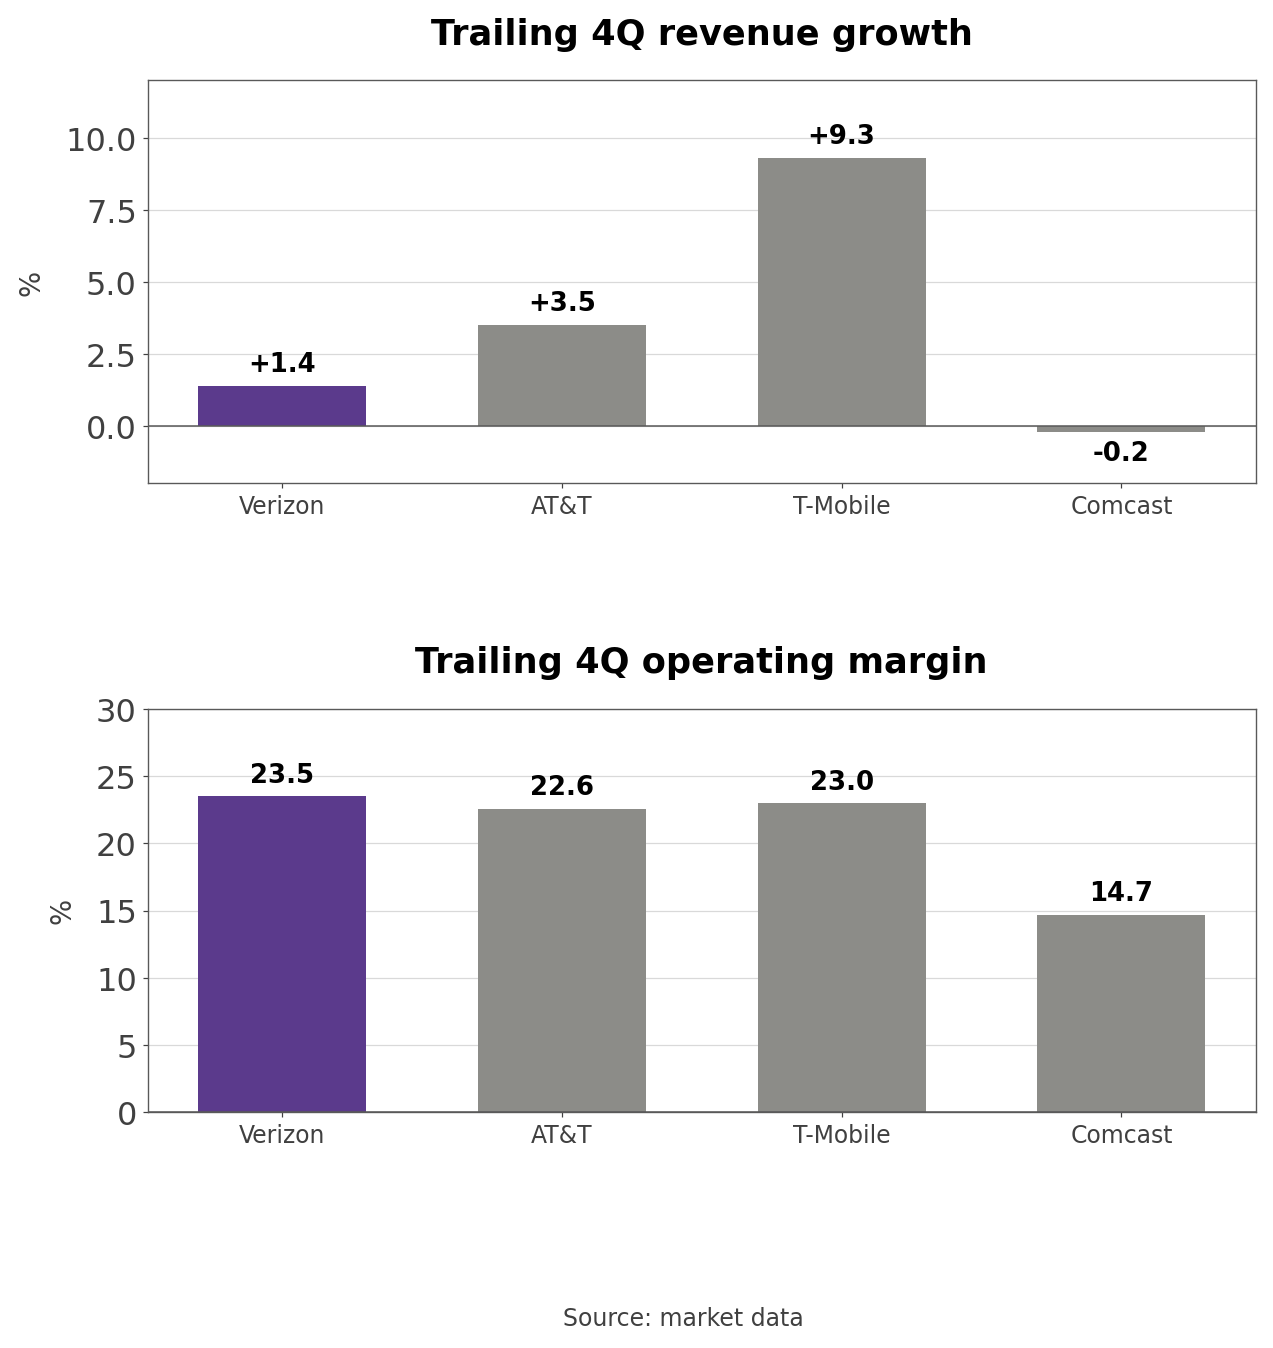
- Trailing operating margin on market data is 23.5% at Verizon, 23.0% at T-Mobile, 22.6% at AT&T and 14.7% at Comcast. Verizon's GAAP margin is lower at 20.9% because market data counts Q4 2025 operating income at $7.64 billion rather than the $5.00 billion in the release, apparently excluding the severance charges.
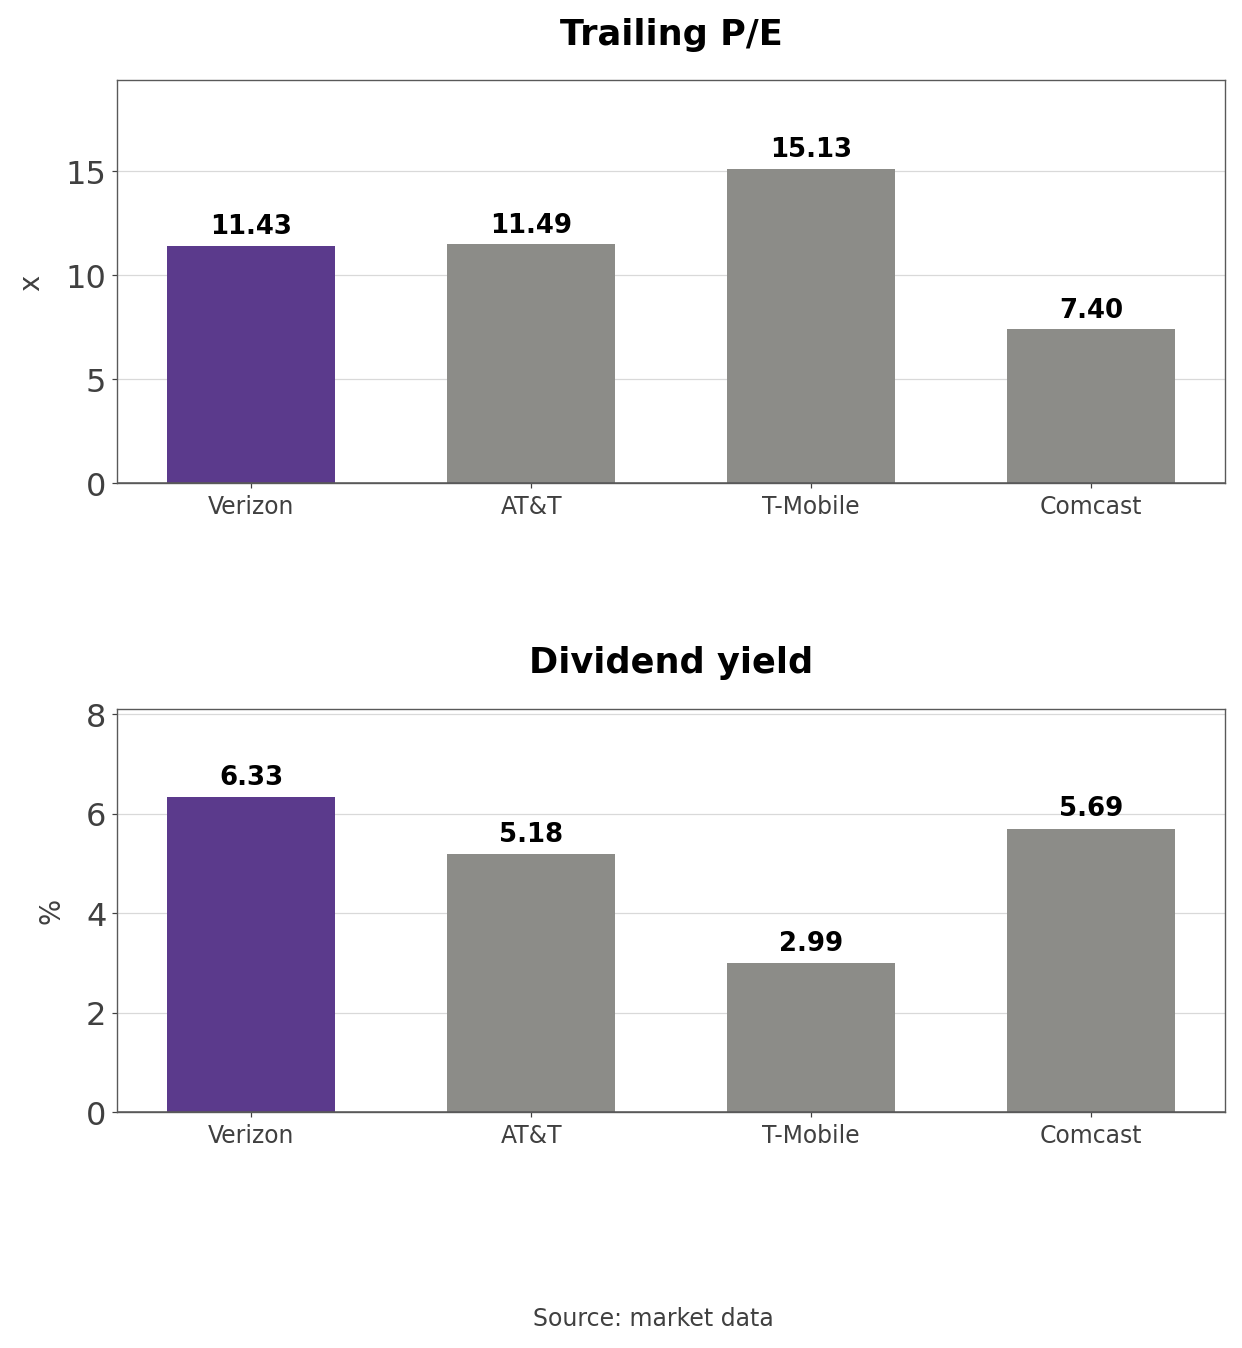
- Trailing P/E is 7.40 at Comcast, 11.43 at Verizon, 11.49 at AT&T and 15.13 at T-Mobile. Dividend yield is highest at Verizon at 6.33%, then Comcast at 5.69%, AT&T at 5.18% and T-Mobile at 2.99%. Over the past year market value rose 9.3% at Verizon and fell 19.8% at AT&T, 21.7% at Comcast and 31.1% at T-Mobile, leaving Verizon as the only gainer of the four.
Verizon's Adjusted P/E and Dividend Yield Band
- Price divided by trailing twelve-month adjusted EPS of $4.98 gives 8.98 times, almost exactly the 8.97 median of the 59 months since December 2021. The high was 10.65 times in February 2026, right after the Frontier close, and the multiple has since returned to the median as adjusted EPS rose while the stock fell. Dividend yield is 6.29%, against a median of 6.31%, and peaked at 8.09% in September 2023.
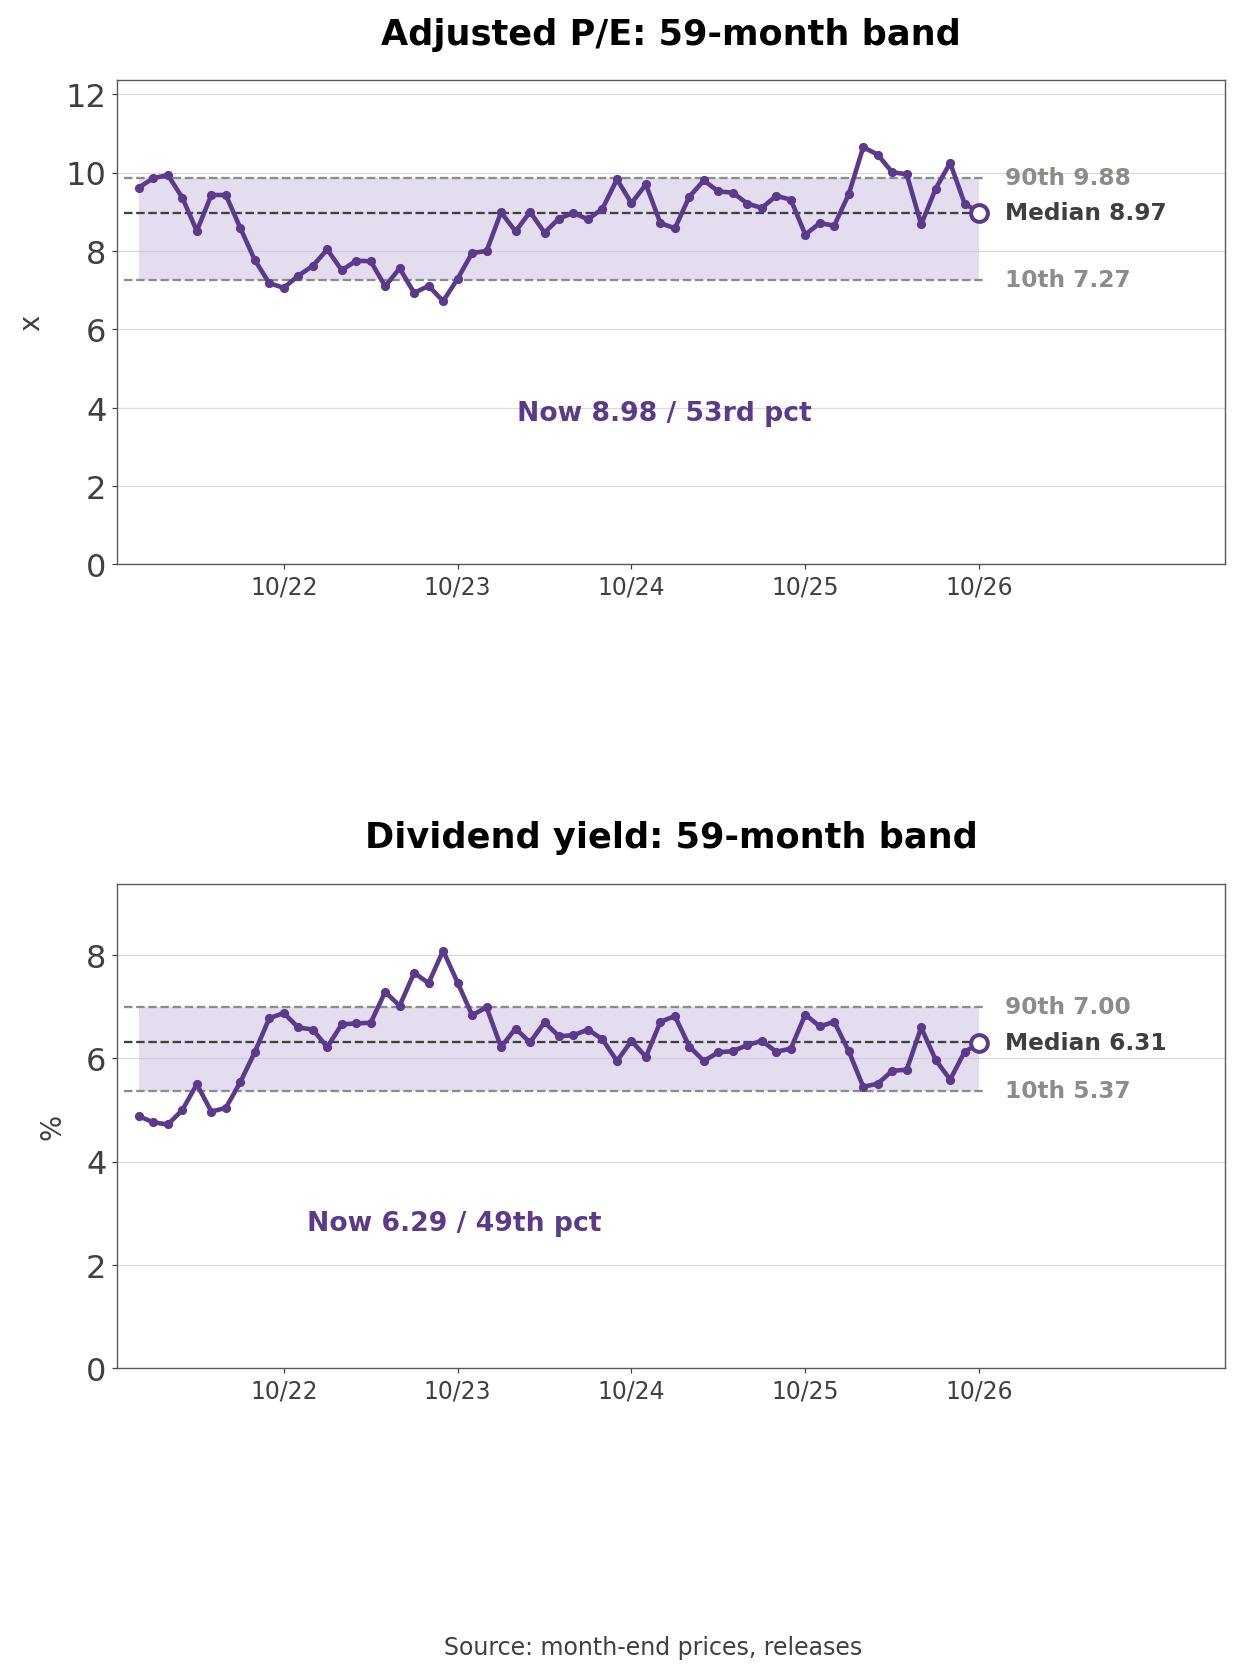
- GAAP P/E is higher at 11.41 because the Q4 2025 severance and Frontier intangible amortization ($289 million in Q3) depress GAAP earnings. The quarterly dividend rose from $0.69 in the second half of 2025 to $0.7075 in Q1 2026, and the $11.48 billion of dividends paid in 2025 used 57.0% of that year's $20.13 billion of free cash flow.
- Outside view (market data consensus, right after Q3 results): Of 24 analysts, 9 rate the stock strong buy, 3 buy and 12 hold, with an average price target of $50.65. Average adjusted EPS estimates are $5.06 for 2026 and $5.31 for 2027.
Three Conditions That Move the Stock
- Wireless service revenue was still below last year through Q3. If it turns positive in Q4 as management expects and ARPA returns to last year's level, subscriber growth is turning into revenue; if promotion amortization drags on and ARPA keeps falling, service revenue growth stays dependent on Frontier.
- Service revenue excluding fiber ran near -0.5% in Q2 and Q3. From Q1 2027 Frontier is in the year-ago base as well, so the distinction disappears and service revenue growth becomes a clean read on Verizon without the acquisition.
- Net unsecured debt was $123.7 billion at the end of September, up from $112.0 billion a year earlier, after $9.48 billion of Frontier cash and $4.38 billion of spectrum purchases over nine months. Verizon spent 71.1% of nine-month free cash flow on dividends and buybacks; if the leverage target slips past 2027, debt reduction moves ahead of buybacks.
What to Watch in the Q4 Report
- Fourth-quarter results in late January should show whether wireless service revenue actually grew year over year and which way ARPA moved. Management promised its 2027 outlook on that call, and because Frontier enters the year-ago base in 2027, the service revenue guide may land below this year's 2.5%-3%.
- One question stays open. Once the amortization from the heavy Q4 2025 device promotions runs off, will postpaid revenue per account get back to the $171 range?
Related Analysis
- Ciena (CIEN) Stock Analysis: Can Growth Catch the Price?: an optical networking supplier tied to the same fiber build-out, useful as a read on the demand behind Verizon's AI Connect and fiber plans.
- Oracle (ORCL) Stock Analysis: Cash Flow and Capex Gap: an AI infrastructure buyer whose capex outran cash flow, a contrast with Verizon's capex of $11.9 billion against $18.0 billion of nine-month free cash flow.
#Verizon #VZStock #TelecomStocks #DividendStocks #Fiber #5G #USStocks #StockAnalysis #EquityResearch #GlobalStockBrief
'US Stock Analysis' 카테고리의 다른 글
| AstraZeneca (AZN) Stock: Oncology Fills the Farxiga Gap (0) | 2026.11.03 |
|---|---|
| Intel (INTC) Stock: A 6.1% Q4 Cut as Servers Pass PCs (0) | 2026.11.02 |
| ServiceNow (NOW) Stock: Armis Inside an 18.5% cRPO Guide (0) | 2026.11.02 |
| Amazon (AMZN) Stock: AWS Up 39% and Free Cash Flow Negative (0) | 2026.11.01 |
| Alphabet (GOOGL) Stock: Equity Raise and Cloud Up 103% (0) | 2026.11.01 |


