- Intel (NASDAQ: INTC) beat its own guidance in the third quarter of 2026, with revenue of $16.51 billion (+20.9%) and non-GAAP EPS of $0.52 against a $0.38 guide, and then guided fourth-quarter revenue to $15.0 billion to $16.0 billion with a non-GAAP gross margin of 38.0%. The $15.5 billion midpoint is 6.1% below Q3, and the stock closed the day after the report at $65.76, -28.58%. Split the guide by segment and data center revenue (DCAI) passes client PC revenue (CCPG) for the first time in at least eight years, but most of that crossover comes from a PC decline of more than 20%, not from server growth.
- Intel designs x86 processors for PCs and servers, builds most of them in its own fabs, and is turning those fabs into a foundry business that also makes chips for outside customers. At $65.76 and 5.315 billion shares outstanding, its market value is about $349.5 billion, and Q3 revenue was $16.51 billion.

- The question here is whether server growth can carry the fixed factory costs that a PC slowdown leaves behind. The analysis lines up the Q3 earnings release, the Q3 10-Q, the August offering prospectus supplement, the Q3 investor presentation, the CEO and CFO prepared remarks and 32 quarterly releases going back to the December 2018 quarter.
- Two caveats apply. Intel gave its Q4 segment outlook only as ranges, a mid-teens increase for DCAI and a decline of more than 20% for CCPG, so the Q4 segment figures below are backed out of those ranges. The Fab 28 impact of about $300 million in revenue and 2 percentage points of gross margin is also what management called an early assessment.
What the Q3 Investor Deck Shows by Segment
- Slide 5 of the Q3 deck says revenue came in $0.2 billion above the July outlook midpoint, non-GAAP gross margin 2.1 points above and non-GAAP EPS $0.14 above. The footnote adds, in small type, that GAAP EPS was $0.60, down $0.30 from a year earlier. The release reconciliation explains the gap: Q3 2025 GAAP EPS included a $1.20 per share gain from divestiture, the quarter in which Intel closed the sale of 51% of Altera.
- Nine quarterly releases show that Intel has beaten the midpoint of its revenue guide in each of the last eight quarters, but the size of the beat shrank from +11.3% in Q1 2026 and +12.8% in Q2 to +1.3% in Q3, the smallest of the eight. Margin and EPS beat by a wide margin in the same quarter that revenue barely cleared the bar.
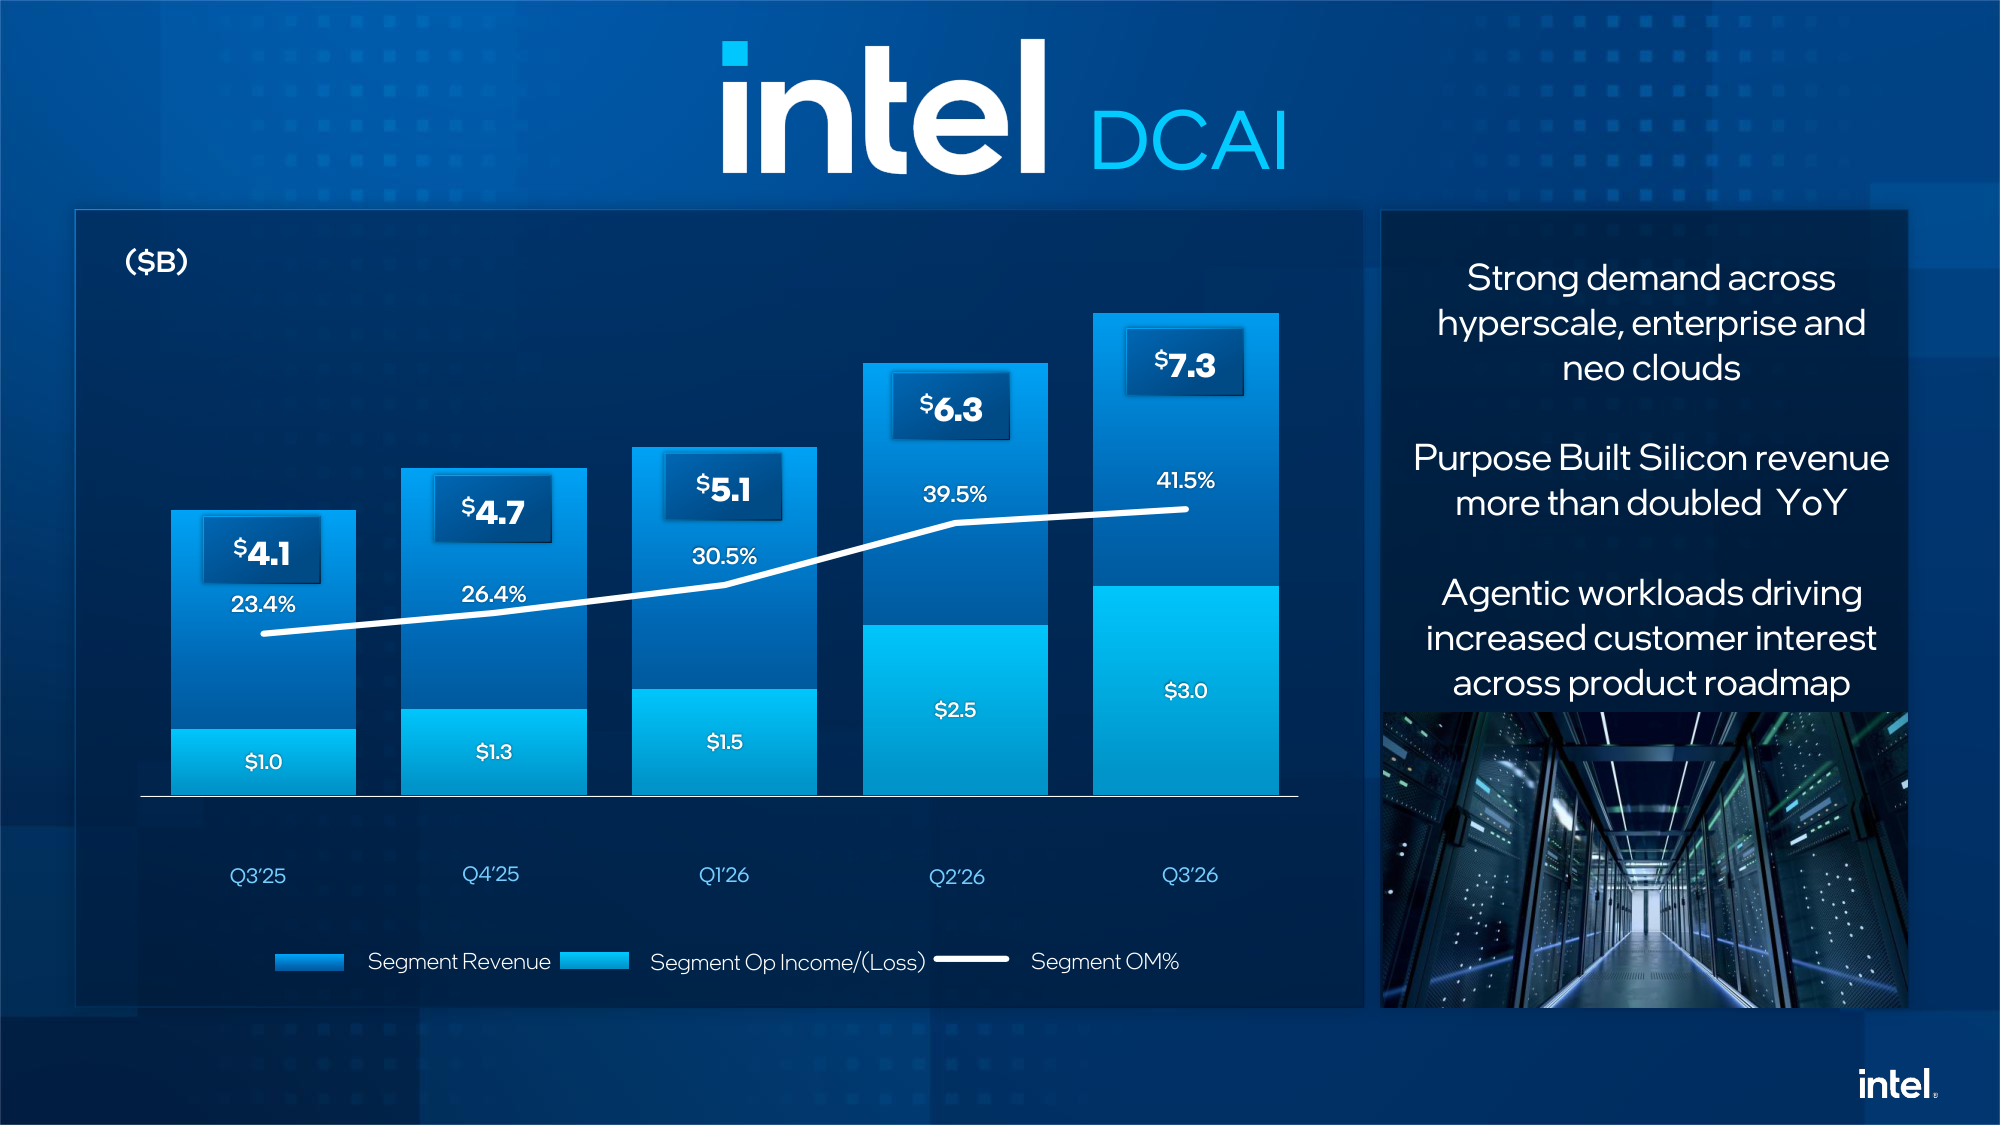
- Slide 7 shows DCAI revenue climbing from $4.1 billion in Q3 2025 to $4.7 billion, $5.1 billion, $6.3 billion and then $7.3 billion. Segment operating income tripled from $1.0 billion to $3.0 billion over those five quarters and operating margin went from 23.4% to 41.5%. The text on the right cites demand across hyperscale, enterprise and neo-cloud customers, purpose-built silicon (PBS) revenue that more than doubled year over year and rising interest driven by agentic AI workloads.
- The CFO told investors that DCAI revenue is on track to finish 2026 nearly $10 billion above what the company expected entering the year, and that "demand for DCAI products continues to meaningfully exceed available supply." Granite Rapids on Intel 3 is now the largest server product family. DCAI operating profit rose about $600 million from Q2 on higher revenue and lower operating expenses, and PBS revenue grew more than 50% sequentially.
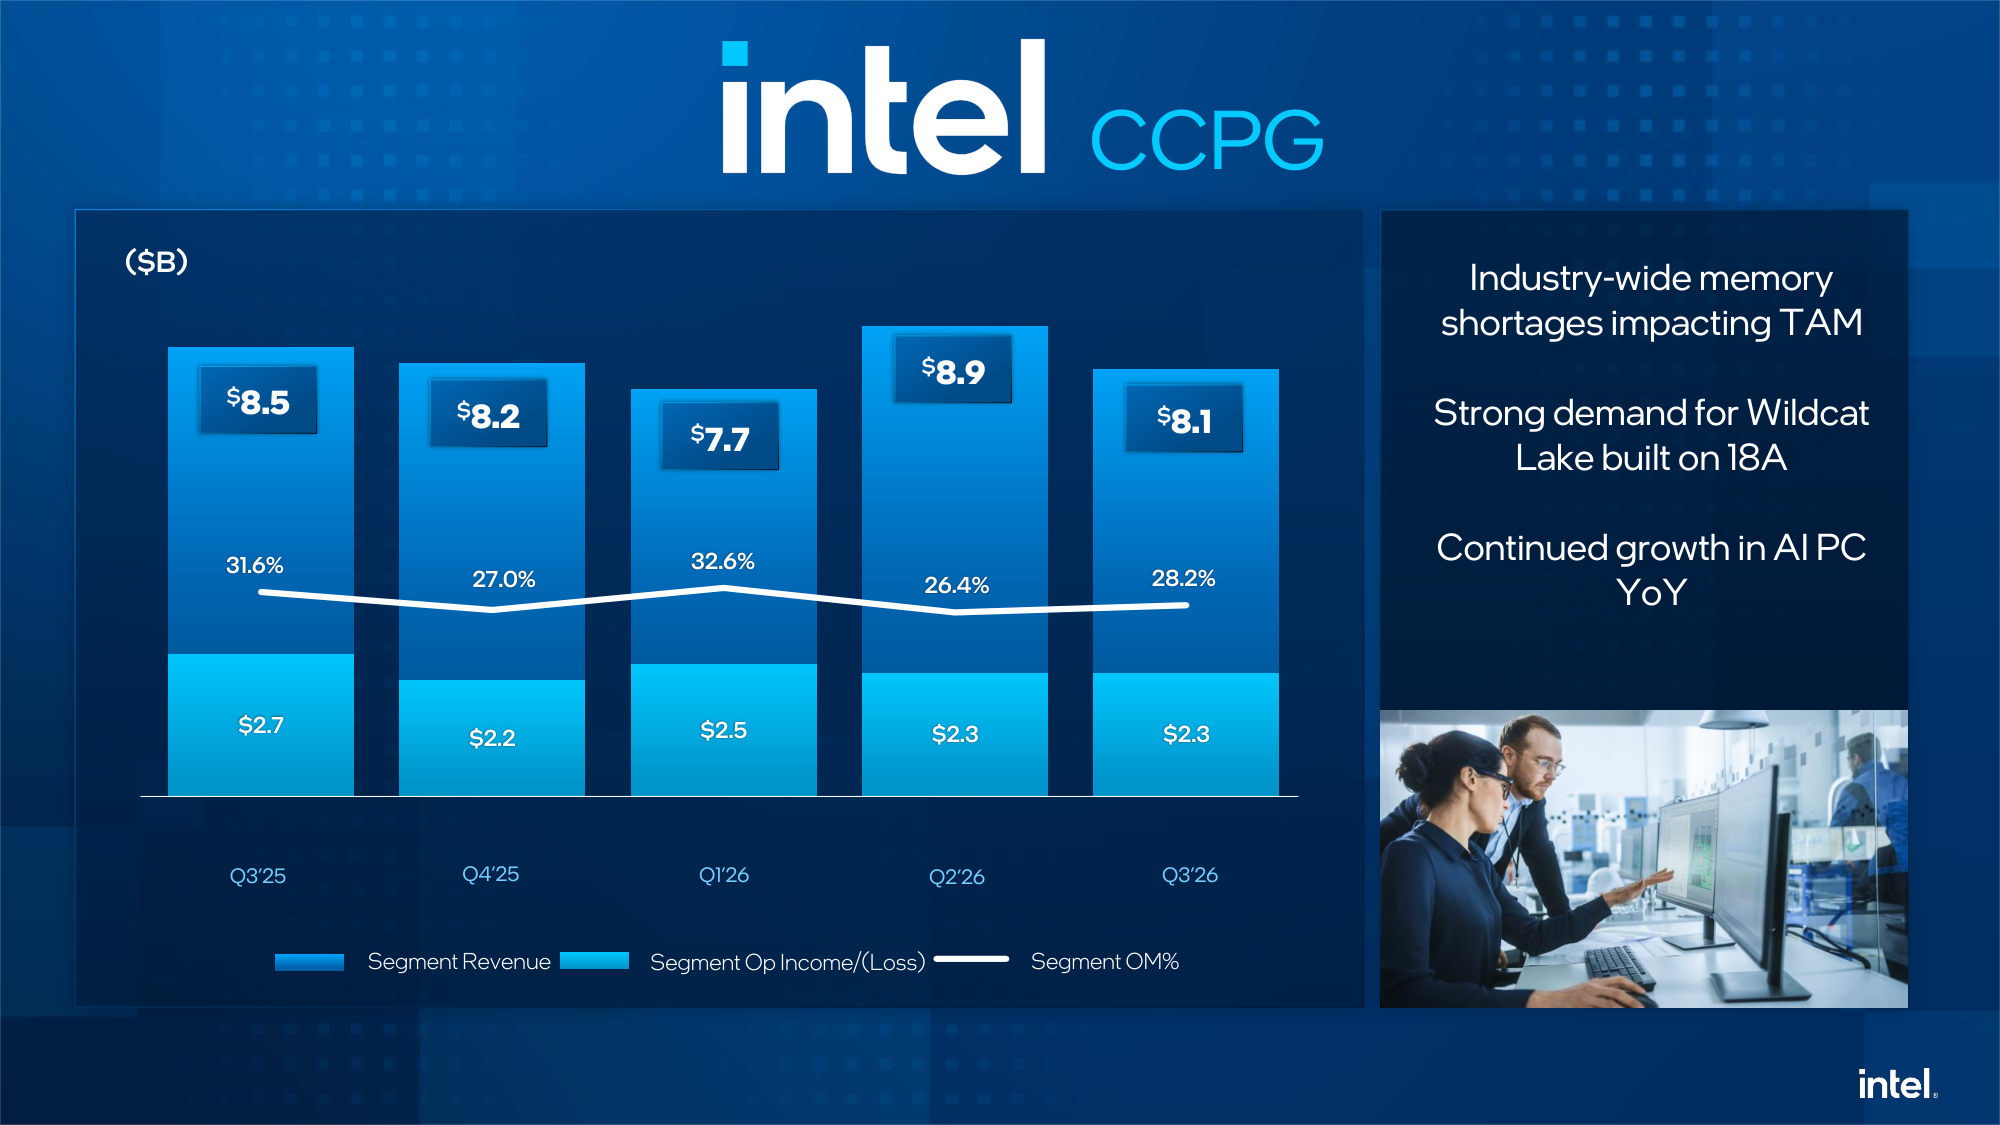
- Slide 8 puts CCPG revenue at $8.5 billion, $8.2 billion, $7.7 billion, $8.9 billion and $8.1 billion over the same five quarters, with a 28.2% segment margin in Q3. The first line on the right reads that industry-wide memory shortages are hurting the size of the PC market. Management had flagged memory as a second-half risk earlier, and said the pressure built late in Q3 and changed how customers were buying.
- The other two lines on the slide are good news. Wildcat Lake, a cost-optimized PC chip built on Intel 18A, grew units about 70% sequentially and sold out, and AI PC revenue rose +35% from a year earlier. Total CCPG revenue still fell -5.1%.
- Slide 9 covers Intel Foundry. The operating loss narrowed from $2.3 billion in Q3 2025 to $1.9 billion and the loss margin from -54.8% to -27.7%, which the slide credits to better yields and cycle times lowering wafer costs. External foundry revenue was $411 million, up $118 million from Q2, but the CFO said most of that increase came from a non-recurring customer program.
The Q4 Guide and the Fab 28 Accident
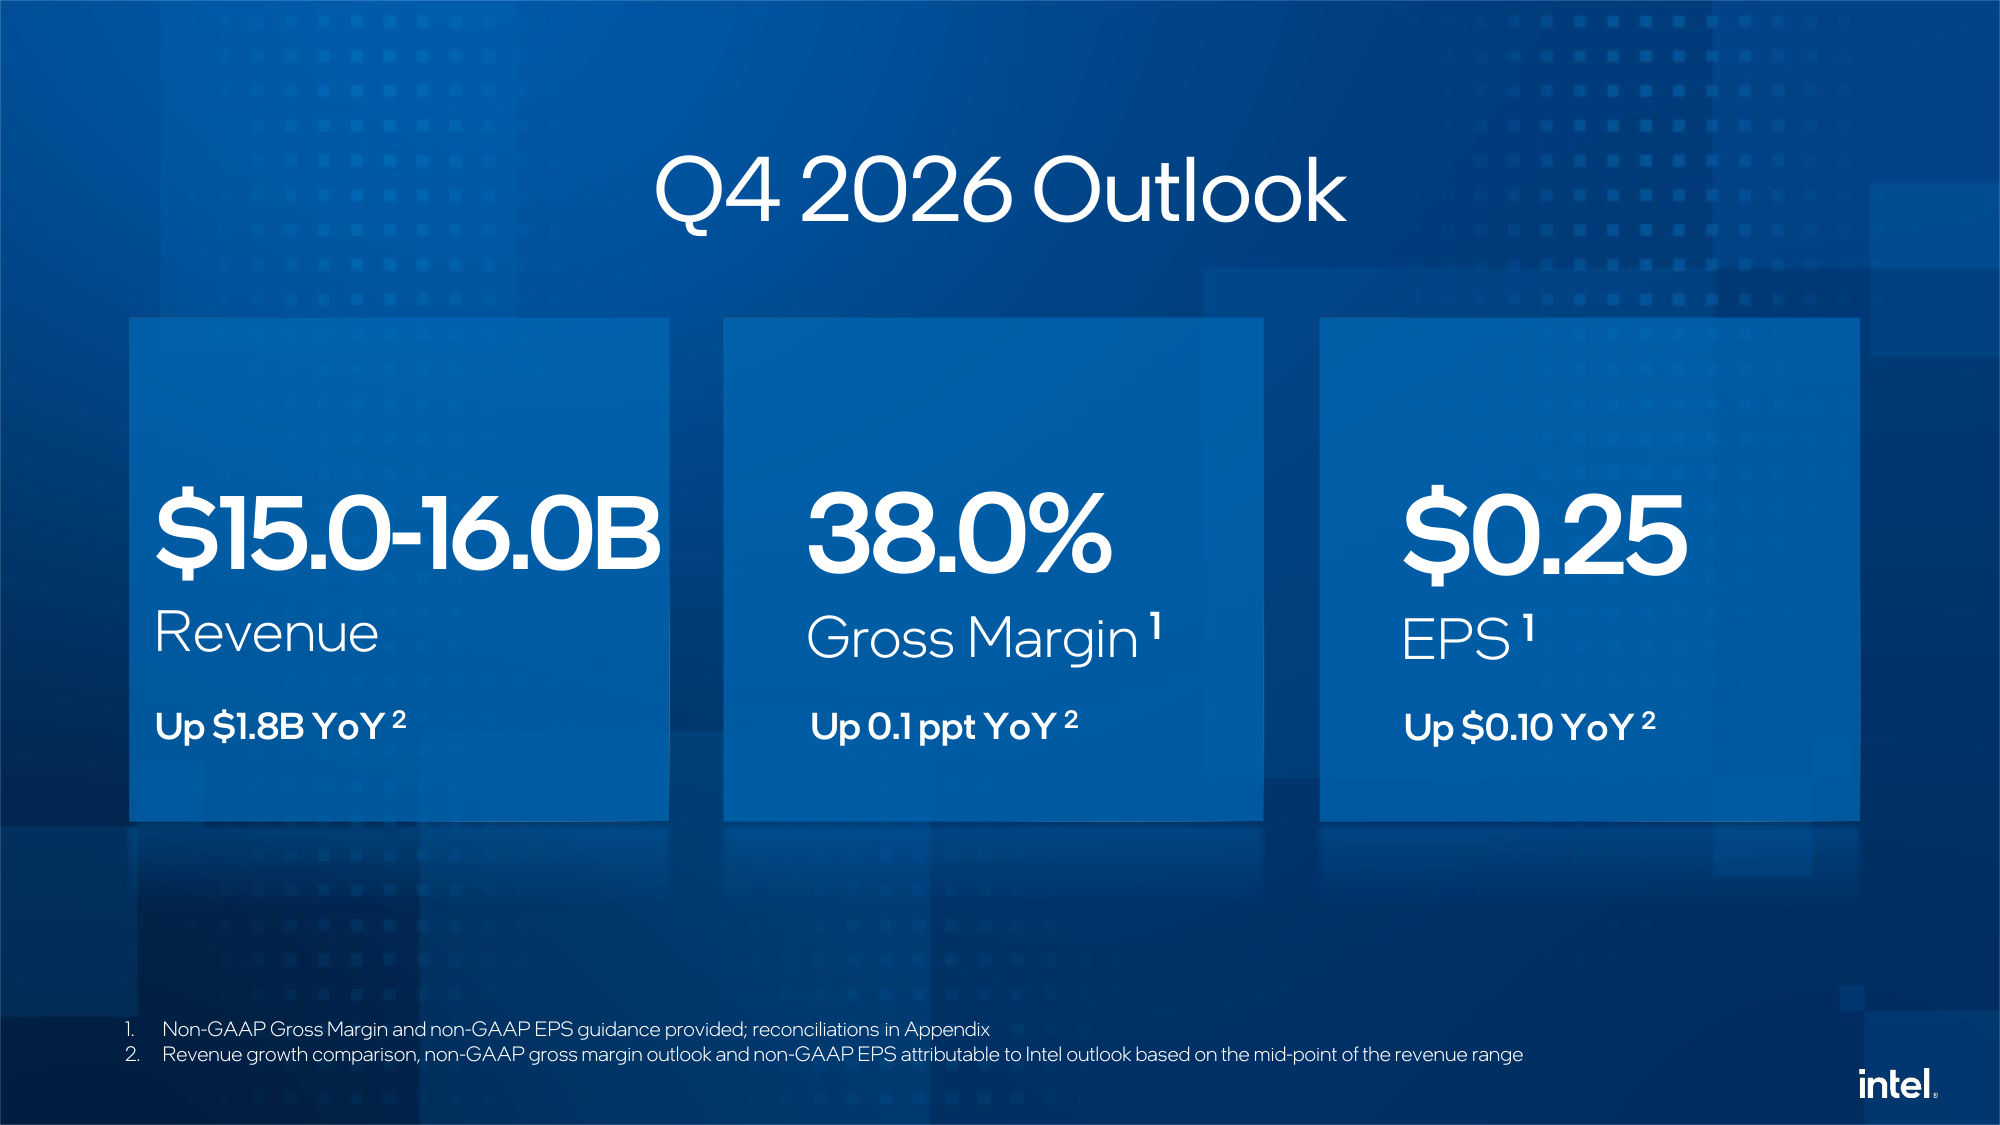
- Slide 11 shows the Q4 outlook in large type: revenue of $15.0 billion to $16.0 billion, non-GAAP gross margin of 38.0% and non-GAAP EPS of $0.25. Every comparison under those numbers is year over year: revenue up $1.8 billion, gross margin up 0.1 point and EPS up $0.10, all measured at the midpoint of the revenue range. On a GAAP basis the release guides to a 37.1% gross margin and $0.10 of EPS.
- Own calculation (Q3 release and slide 11): Against Q3 the same guide reads very differently. Revenue at the midpoint is $1.01 billion lower, non-GAAP gross margin drops 6.1 points from 44.1%, and non-GAAP EPS falls $0.27 from $0.52. Of the eight Q4 revenue guides Intel has given alongside Q3 results since 2019, a 6.1% sequential decline is the steepest, ahead of -5.5% in 2022 and -5.1% in 2020.
- By segment, the CFO guided DCAI revenue up mid-teens sequentially, with PBS growing faster than DCAI overall, and CCPG revenue down more than 20% as "customers move quickly to reduce weeks of inventory and align purchases with their expectations for 2027 consumption." He tied the margin decline mainly to "lower overall revenue against our fixed-cost base as we adjust client wafer starts to current demand conditions." The guide also absorbs about $300 million of revenue and 200 basis points of gross margin from Fab 28, and "almost all of the $300m impact from Fab 28 is related to 10nm server products."
- Filing footnote (Q3 10-Q, quarter ended September 26, 2026): In mid-October an accident at the manufacturing facility in Kiryat Gat, Israel, caused employee casualties and injuries and halted production. Operations had been suspended for about two weeks and were expected to resume by the end of October, and Intel expects Q4 charges for scrapped inventory, remediation and cleanup and under-absorbed overhead.
The Bull and Bear Case for Intel Shares
- The bull case is the server business. DCAI revenue is 1.78 times its level a year ago, its 41.5% operating margin is 13.3 points above the PC segment, and management says supply, not demand, is the constraint. Guiding DCAI up mid-teens in Q4 while losing about $300 million of server revenue to Fab 28 is the core of that argument.
- The bear case is the factory network. Because Intel makes its own chips, lower PC wafer starts leave fab fixed costs sitting on less revenue, and the 38.0% Q4 margin guide is the result. The August offering added shares, and the stock now trades -30.8% below the $95 offering price.
From the Dividend Suspension to the 2026 Share Sale
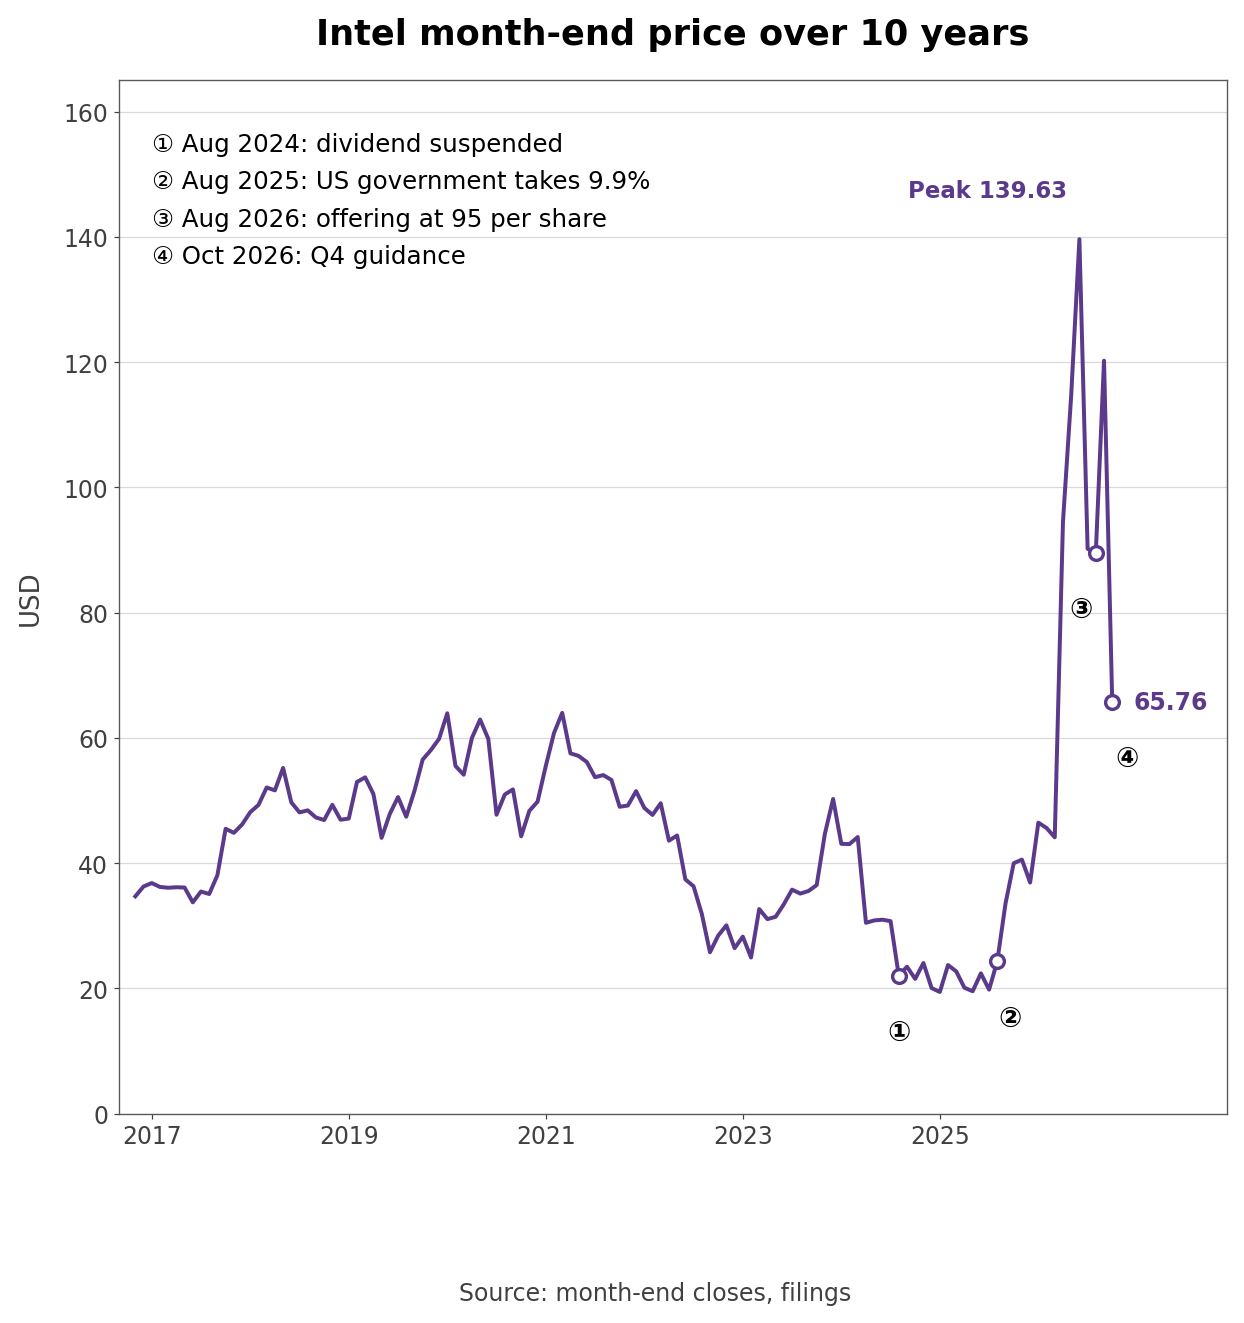
- On August 1, 2024, Intel paired its Q2 results with a cost reduction plan and said it would suspend the dividend starting in Q4. The stock ended that month at $22.04 and bottomed at a $19.43 month-end close in January 2025. In August 2025 the Commerce Department agreed to buy 433.3 million shares at $20.47 in connection with government grant disbursements, a 9.9% stake, and SoftBank bought 87 million shares at $23.00 the same year while Nvidia bought 215 million at $23.28.
- On April 8, 2026, Intel bought back the 49% stake in its Ireland Fab 34 joint venture that Apollo had acquired in June 2024, paying $14.2 billion. Two weeks later Q1 revenue came in +11.3% above the guidance midpoint with a $14.3 billion Q2 guide, and the stock went from $44.13 at the end of March to $94.48 at the end of April, +114.1%. The June month-end close of $139.63 was the 10-year high. In the Q3 remarks CEO Lip-Bu Tan said "We are only a year and a half into this journey" of rebuilding the company.
- On August 10 Intel announced a $15 billion common stock offering, upsized it to $20 billion the same day, and with the underwriters' option sold 242,105,262 shares at $95 for $23.0 billion of gross proceeds and $22.62 billion net. The close after the Q3 report, $65.76, is -52.9% from the peak and still +78.2% for 2026.
Will Data Center Revenue Pass Client Revenue in Q4?

- Own calculation (32 releases and CFO remarks): Treating mid-teens as +13% to +17% on Q3 DCAI revenue of $7.32 billion gives Q4 DCAI of $8.27 billion to $8.56 billion, while a 20% decline on CCPG revenue of $8.10 billion caps Q4 CCPG at $6.48 billion. Even at the most conservative end of the guide, DCAI comes out ahead. The two segments move from a $779 million CCPG lead in Q3 to a $2.43 billion DCAI lead at the midpoint, and of that $3.21 billion swing, $2.11 billion or two-thirds comes from the CCPG decline and $1.10 billion from DCAI growth.
- That would be a first. Across all 32 quarterly releases from Q4 2018 to Q3 2026, data center revenue never exceeded client revenue, and through three segment reorganizations it came closest in Q2 2020 at 74.9% of client revenue. The ratio was 54.1% in Q1 2025 and reached 90.4% in Q3 2026.
- The crossover needs a closer look. Revenue outside the two segments (external foundry sales, all other and intersegment eliminations) was $1.10 billion in Q3. If it stays there, the $15.5 billion midpoint minus $8.42 billion of DCAI and $1.10 billion of other revenue leaves CCPG at $5.99 billion, -26.1% from Q3, inside management's range of a decline of more than 20%.
- Fab 28 sits on the DCAI side. Nearly all of the roughly $300 million revenue hit falls on 10nm server products, so the mid-teens DCAI guide already absorbs it. Adding Fab 28 back, the Q4 revenue midpoint would be $15.8 billion, 4.3% below Q3.
What Sits Behind the 38% Margin Guide
- Non-GAAP gross margin bottomed at 29.7% in Q2 2025 and climbed to 44.1% over five quarters, and the 38.0% Q4 guide is back at the 37.9% of Q4 2025. Of the 6.1-point sequential drop, management assigned 2 points to Fab 28; the remaining 4.1 points come from fixed factory costs spread over lower revenue and from a mix shift toward PBS.
- Segment margins make that look odd at first. DCAI earned a 41.5% operating margin in Q3 against 28.2% for CCPG, so a shift toward servers should lift profitability. But Intel makes much of the silicon for both segments in its own fabs, and Intel Foundry still lost $1.85 billion on $6.70 billion of revenue in Q3. When PC chip volume drops, fab utilization drops with it, and the unabsorbed cost lands in the company-wide gross margin.
- Filing footnote (Q3 10-Q): GAAP earnings move the other way. The 132 million shares still held in escrow under the August 2025 government agreement are accounted for as a derivative liability marked to fair value each quarter, and the mark-to-market loss of $12.6 billion over nine months produced a nine-month net loss attributable to Intel of $11.44 billion, or $2.22 per share. The filing says "We expect to recognize further such gains or losses in future periods based on future decreases or increases of our stock price."
- Own calculation (Q2 and Q3 10-Qs and weekly closes): The $13.7 billion liability divided by 132 million unreleased shares is $103.8 per share, 84.4% of the $123.00 close just before quarter end, and the same ratio was 85.0% in June. If it holds through Q4 and the stock stays at $65.76, the liability shrinks to about $7.3 billion and GAAP results pick up a gain of about $6.4 billion that non-GAAP EPS leaves out.
The Stock Offering and the Apollo Buyback
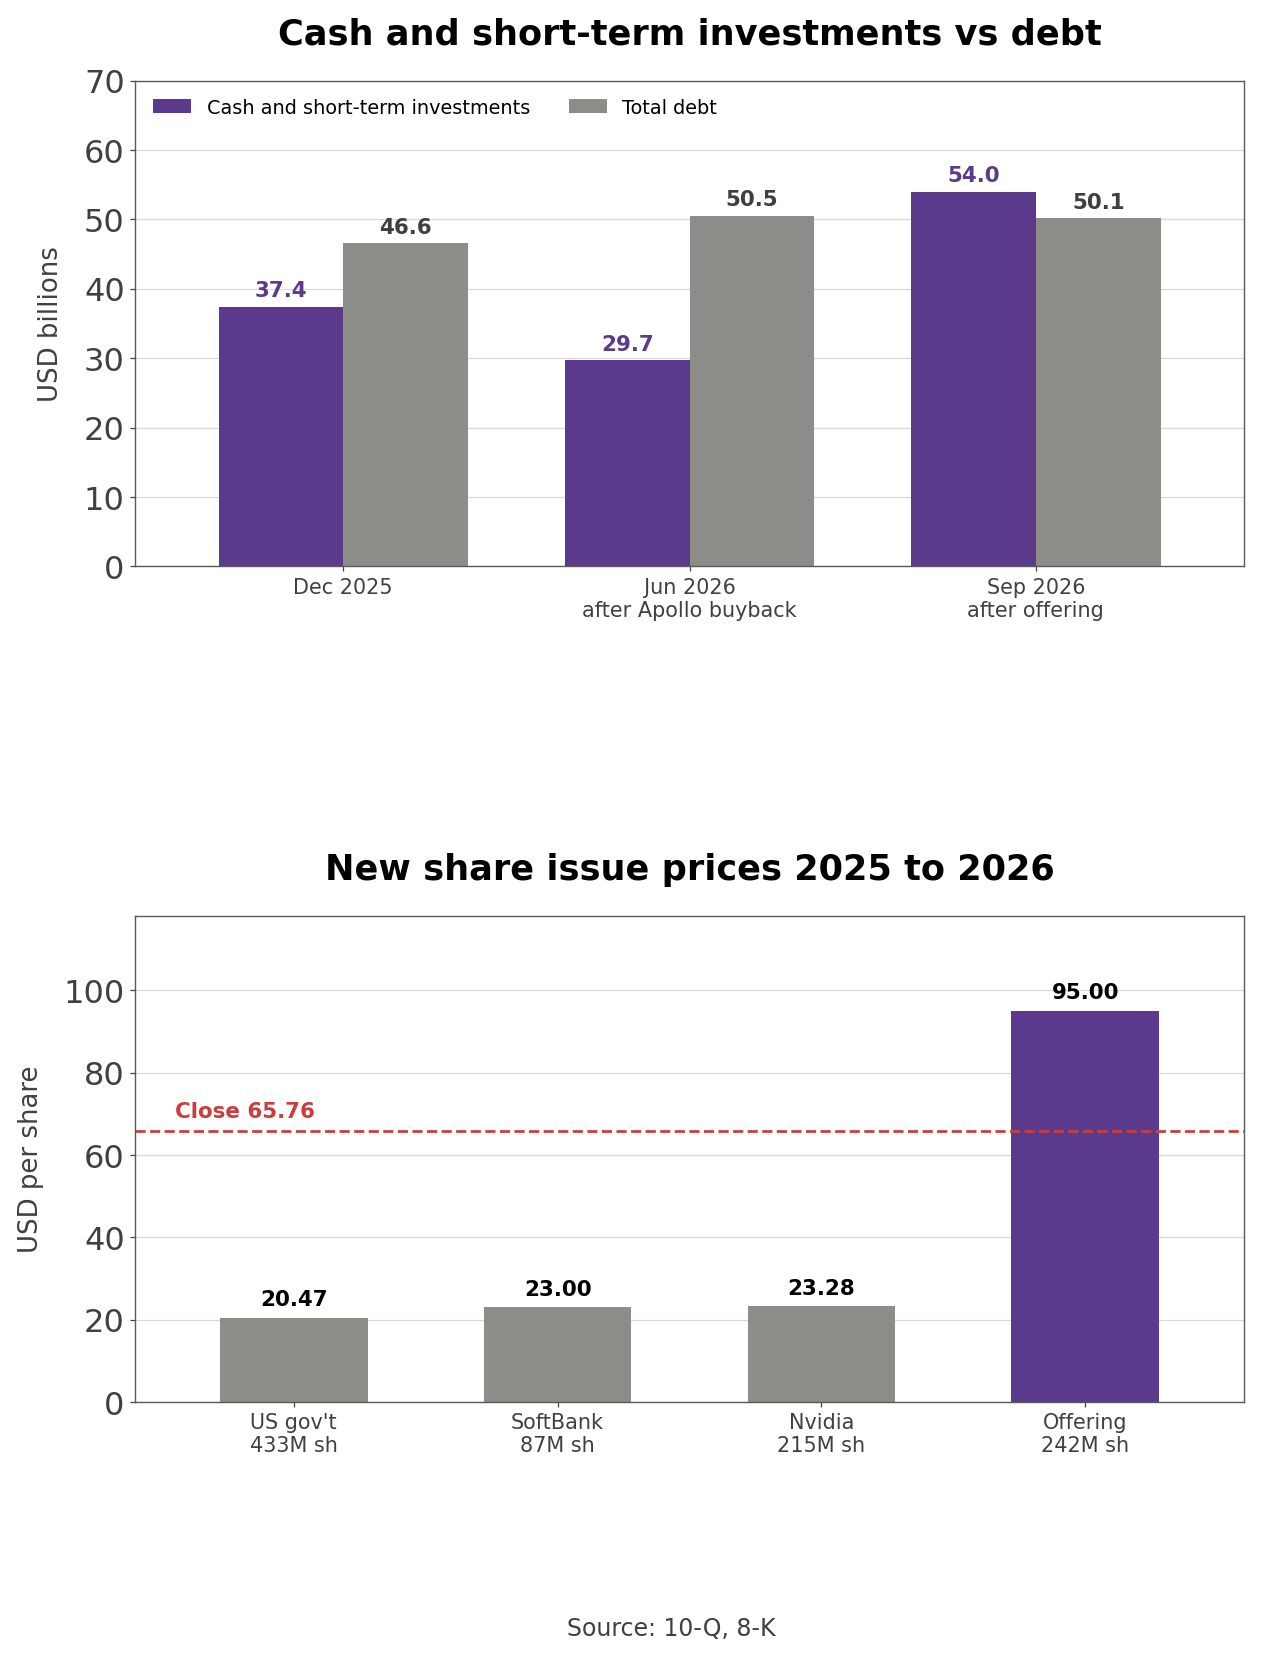
- Cash and short-term investments fell from $37.42 billion at the end of 2025 to $29.73 billion in June, after the Apollo buyback, and rose to $54.01 billion in September after the offering. Total debt went from $46.59 billion to $50.13 billion, so net cash moved from -$9.17 billion to +$3.87 billion.
- Company disclosure (8-K, April 8, 2026): Intel funded the $14.2 billion repurchase with cash on hand and a $6.5 billion bridge loan. The Q2 10-Q shows $6.5 billion of senior notes issued in the same quarter, and over nine months Intel raised $13.0 billion of term debt, including the bridge, and repaid $9.0 billion.
- Intel's own adjusted free cash flow shows the deal plainly. The measure adds net SCIP partner contributions, so the payment to Apollo comes straight out of it: adjusted free cash flow was -$8.42 billion in Q2, after -$2.02 billion in Q1 and before +$1.64 billion in Q3, for -$8.80 billion over nine months.
- The 10-Q cash flow statement explains the rest. Cash and short-term investments rose $16.59 billion over nine months. Net offering proceeds of $22.62 billion minus $14.44 billion of partner distributions, mostly Apollo, leaves $8.18 billion, about half the increase. Operating cash flow of $13.18 billion exceeded capex of $11.83 billion by $1.35 billion, and the Arizona joint venture partner contributed $5.03 billion while net borrowing added $4.0 billion. Roughly 63% of the net proceeds effectively refilled the $14.2 billion paid to Apollo four months earlier.
- The share count on the 10-Q cover rose from 5.044 billion in July to 5.315 billion in October, +5.4%, and is up 30.0% from 4.089 billion in April 2022. Basic weighted shares in Q3 were 5.244 billion, +16.2% from a year earlier, so the same net income now spreads over that many more shares.
How Intel Makes Money From Chips and Factories
- Intel reports two businesses. Intel Products sells chips through CCPG (PC processors) and DCAI (server processors), and its $15.42 billion of Q3 revenue was most of the company's $16.51 billion. Intel Foundry booked $6.70 billion, but most of that is wafers sold to Intel Products, so about $6.29 billion is eliminated in consolidation and external foundry revenue was $411 million.
- The weight inside Intel Products has shifted in a year. CCPG was 52.5% of product revenue in Q3 and DCAI 47.5%, against 67.5% CCPG a year earlier. Through 2025 Intel earned roughly two-thirds of its product revenue from PCs; on the Q4 guide it becomes a company that sells more server chips than PC chips.
- Profit comes from products and the foundry takes some back. In Q3, CCPG earned $2.29 billion of operating income on $8.10 billion of revenue and DCAI $3.04 billion on $7.32 billion, $5.32 billion together, a 34.5% product margin. Add $179 million from all other, subtract the $1.85 billion foundry loss and $1.06 billion of unallocated corporate costs and eliminations, and company operating income was $2.52 billion.
- CCPG sells notebook and desktop CPUs plus chips for industrial edge devices. In Q2 2026 Intel renamed it from the Client Computing Group to the Client Computing and Physical AI Group, and management said the edge business held up better than PCs on edge and physical AI design wins. Its customers are PC makers, so when memory prices push up system prices and OEMs cut inventory, Intel's orders fall first. Panther Lake on Intel 18A is in volume production, and Nova Lake, the first client product on 18A-P, is expected to launch with twice the design wins of Panther Lake.
- DCAI sells Xeon server CPUs and custom silicon. Granite Rapids on Intel 3 is the workhorse, Clearwater Forest, the first 18A server chip, is shipping for revenue, and Diamond Rapids on 18A-P is due to ramp in 2027. PBS designs chips to the specifications of hyperscalers and AI labs; management said it has tripled over three years and is poised to triple again. Intel also introduced an inference GPU, the D-series, formerly code-named Crescent Island.
- Management's case for server CPU demand runs through AI agents. The CEO said 2027 demand for Clearwater Forest is significant, especially in CPU-dense agentic rack-scale infrastructure, and in October Intel demonstrated racks with more than 46,000 cores at about 133 kilowatts. Slide 6 calls the server CPU foundational to AI infrastructure, and the CFO's release quote cites "our strongest data center revenue growth in 15 years." Intel also announced plans to buy Classiq, an Israeli quantum computing software company.
- Intel Foundry runs fabs in Oregon, Arizona, Ireland and Israel plus packaging sites in New Mexico and Malaysia. Intel 18A is ramping in Oregon and Arizona, where Fab 62 is the second high-volume 18A fab, and Intel released its 0.9 process design kit for 14A to select customers in October. Demand for EMIB, which ties multiple chips into one package, is strong outside Intel, but a shortage of advanced organic substrates limited output in Q3. The Ohio site is still under construction.
- Foundry revenue is the internal price Intel Products pays for wafers, so the segment narrows its loss either by cutting wafer cost through yield or by winning outside customers. Slide 4 lists better Intel 3 and 18A yields, the 14A 0.9 PDK and EMIB-T yield as signs of improved execution. Intel does not name foundry customers, but the CEO said he is encouraged by progress with multiple potential 14A customers and expects 18A-P to be an attractive node for outside customers.
- Ownership of the fabs is part of the model. The Ireland joint venture is 100% Intel again after the April buyback, while an investment partner holds 49% of the Arizona joint venture and contributed $5.03 billion over nine months. Intel owns 76% of Mobileye, the driver-assistance chip company, and deconsolidated Altera, the FPGA maker, after selling 51% in September 2025.
How Intel Compares With Three Chip Peers
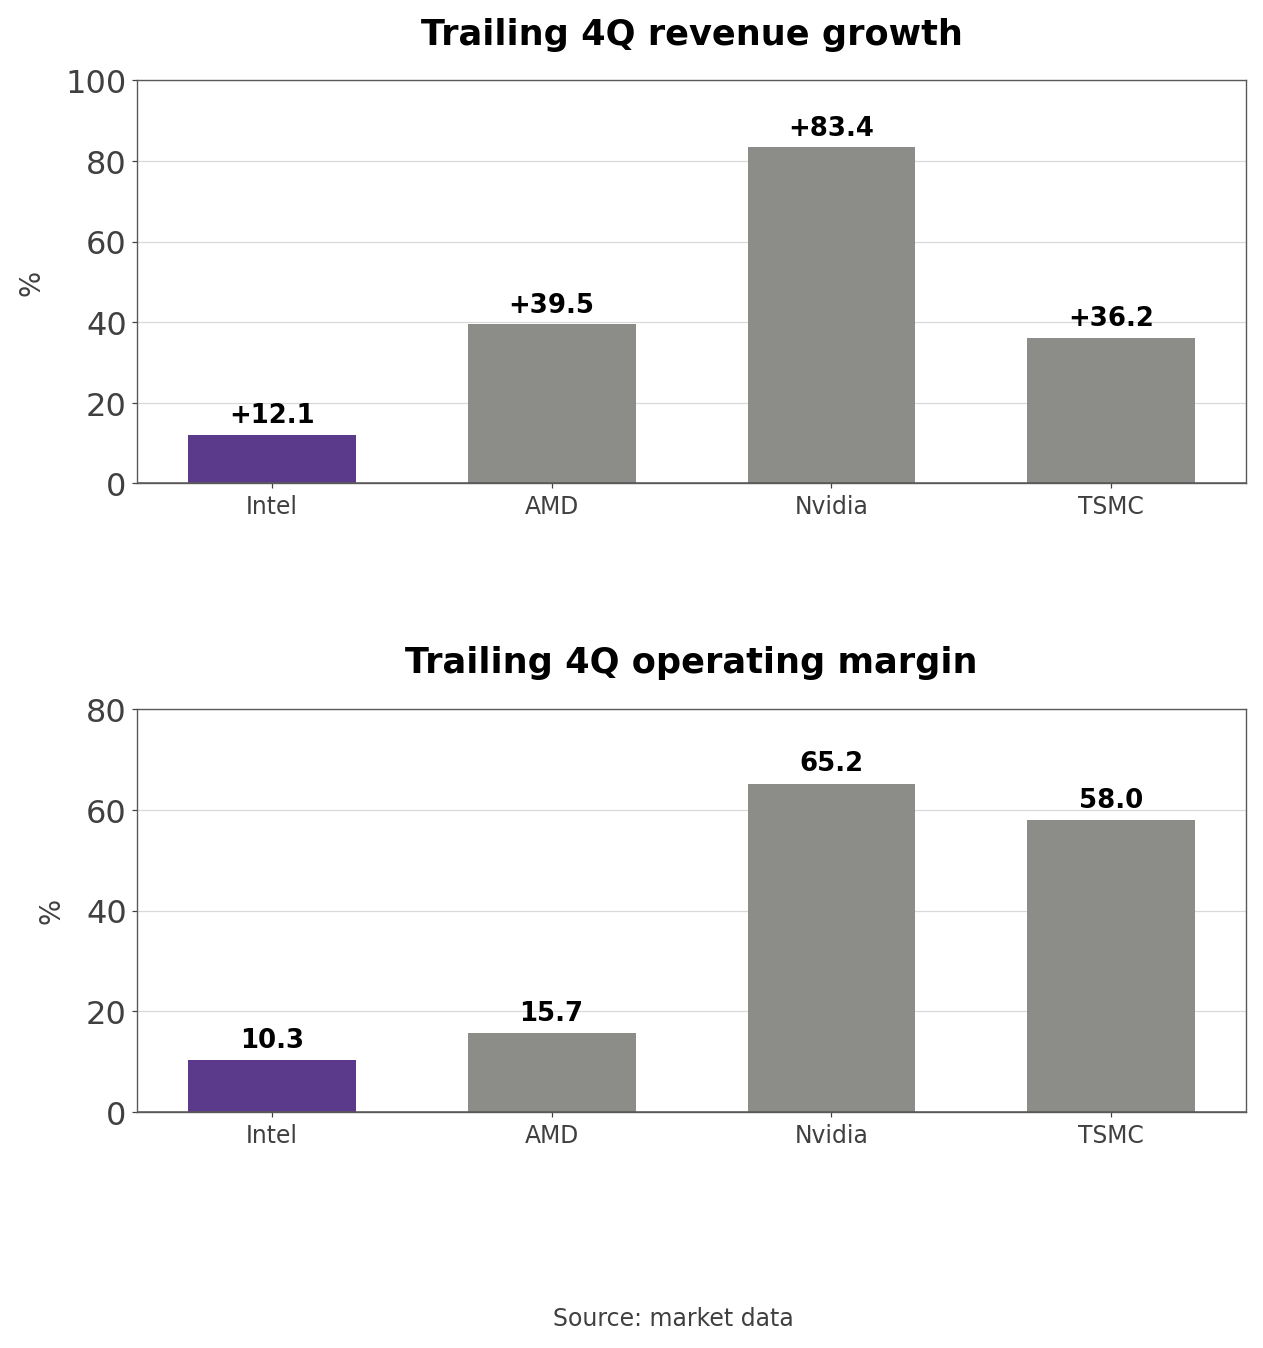
- The comparison set is AMD, which competes with Intel in both PC and server x86 CPUs, Nvidia, whose AI accelerators take the largest share of data center budgets, and TSMC, the contract manufacturer Intel Foundry is chasing. Nvidia is also an Intel shareholder after its 2025 purchase. On market data, trailing four-quarter revenue growth is +83.4% at Nvidia, +39.5% at AMD, +36.2% at TSMC and +12.1% at Intel, and operating margin is 65.2%, 58.0%, 15.7% and 10.3% in the same order. AMD and Nvidia report on June and July quarters, one quarter behind Intel.
- AMD fights Intel chip for chip, Nvidia sells the accelerators that sit next to the CPU in AI servers, and TSMC builds chips for both of them, which makes it the benchmark Intel Foundry has to meet to win outside work. Intel's 10.3% includes the foundry loss; product-only operating margin in Q3 was 34.5%, above AMD's trailing 15.7%.
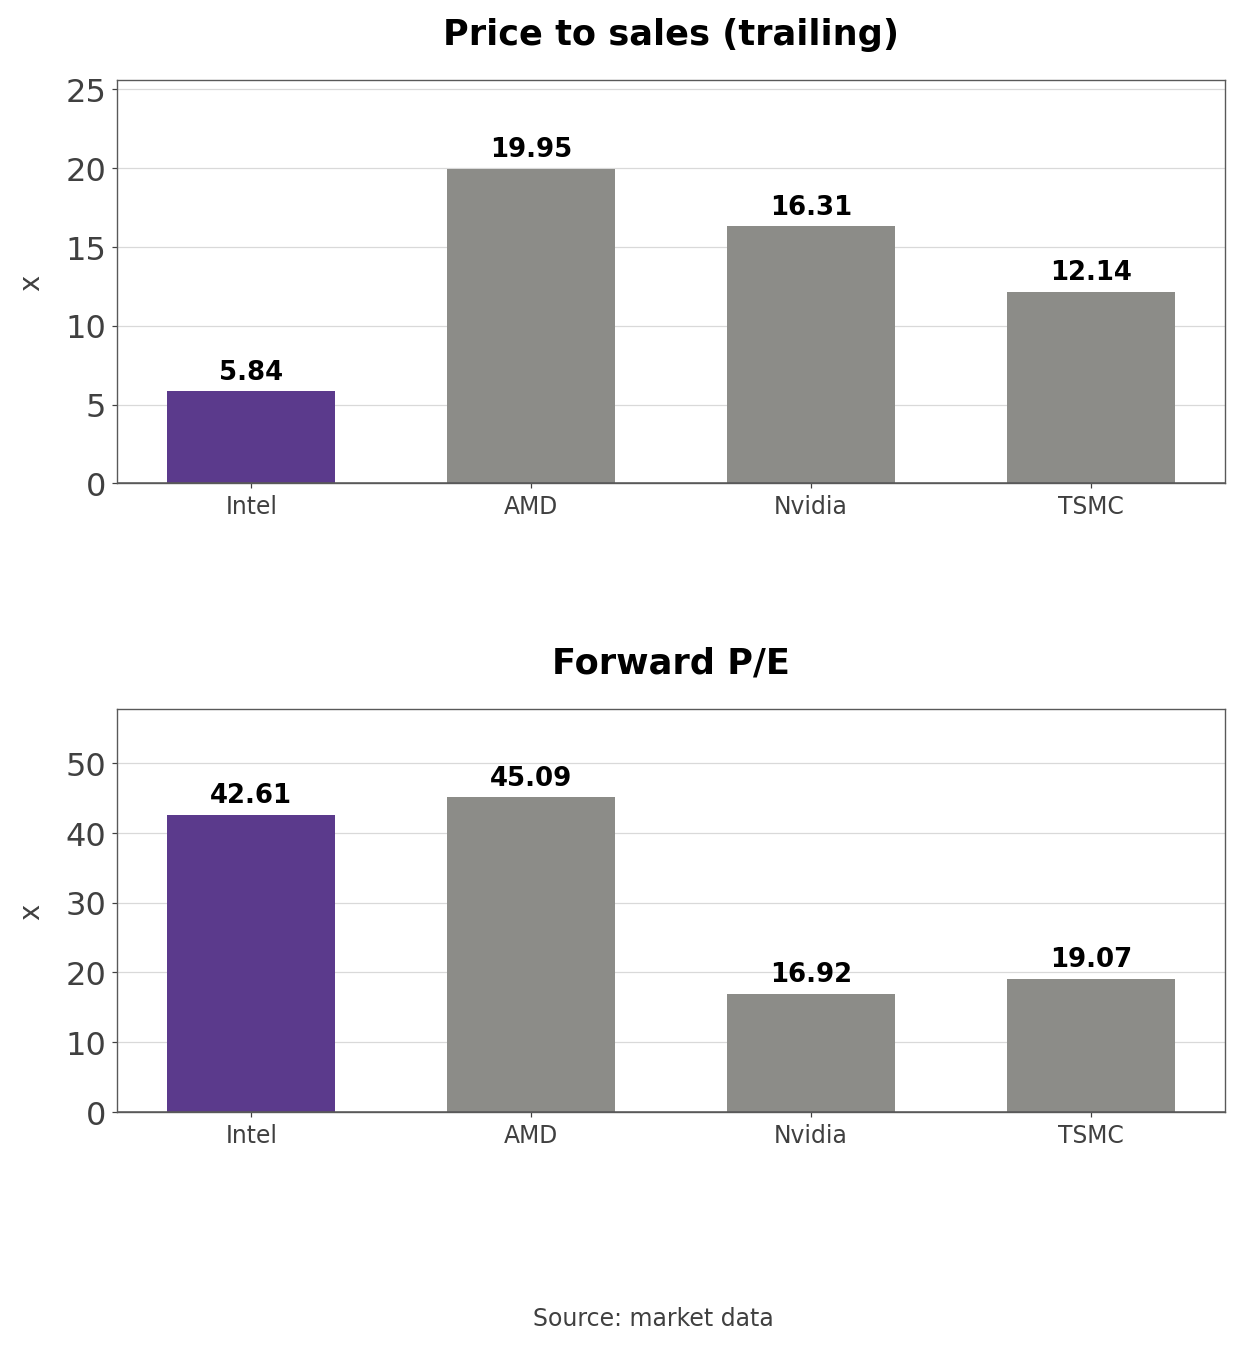
- Price to sales is 19.95 at AMD, 16.31 at Nvidia, 12.14 at TSMC and 5.84 at Intel, the lowest of the four. Forward P/E is 45.09 at AMD, 42.61 at Intel, 19.07 at TSMC and 16.92 at Nvidia, so on earnings Intel is the second most expensive. One-year market value change is +93.2% at Intel, +92.1% at AMD, +47.6% at TSMC and -1.8% at Nvidia.
Intel's Price-to-Sales and Price-to-Book Band
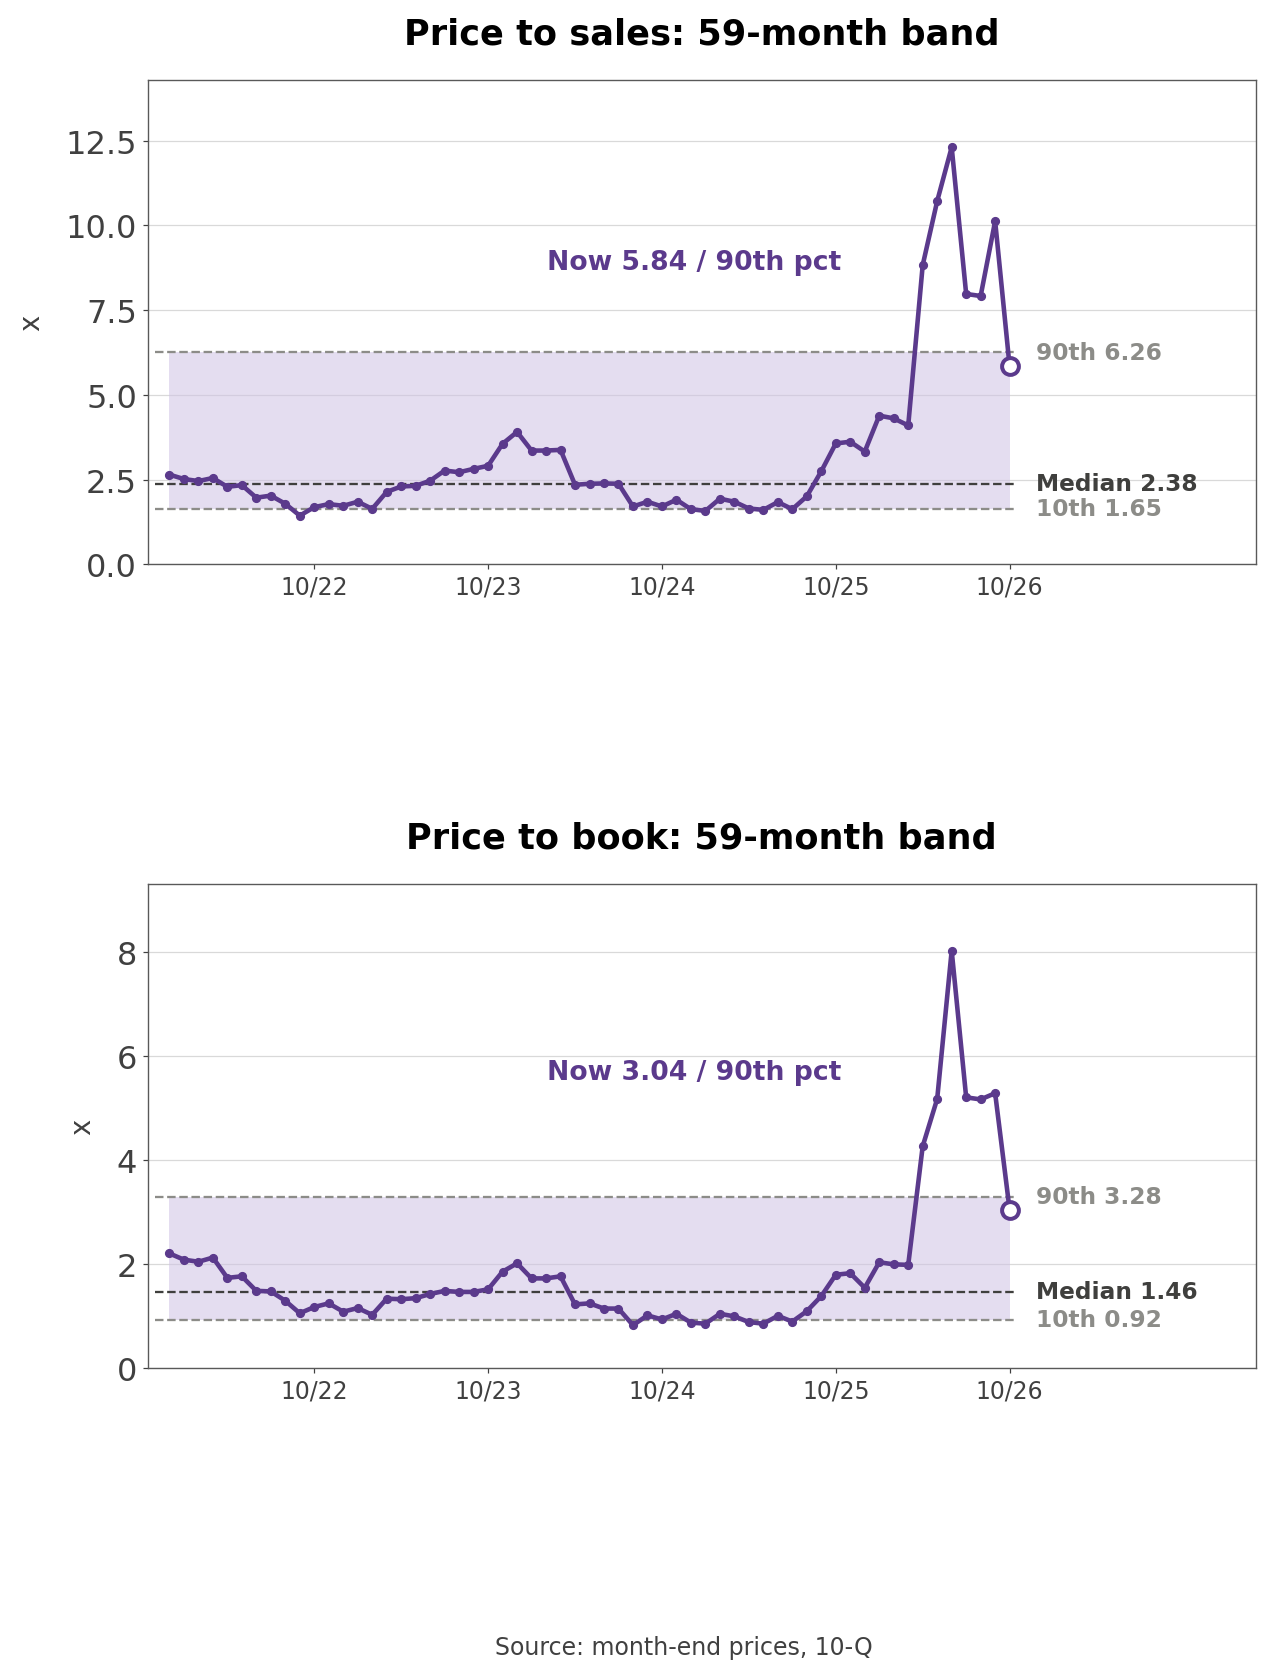
- Trailing GAAP EPS is negative because of the escrow share losses, so there is no P/E, and non-GAAP EPS also turned negative between Q3 2024 and Q2 2025, which rules out an adjusted P/E band. Sales and book value are the yardsticks instead.
- Using month-end prices and 10-Q equity, market value over trailing revenue of $59.89 billion gives a price-to-sales ratio of 5.84, more than twice the 59-month median of 2.38 since December 2021; only six months were higher. The high was 12.31 in June 2026 and the low 1.44 in September 2022. Price to book on Intel stockholders' equity of $114.91 billion is 3.04 against a median of 1.46, with a low of 0.82 in August 2024.
- The book value denominator swung twice this year. In Q2, $13.5 billion of the Apollo payment came out of equity and escrow losses piled up, taking stockholders' equity down to $87.5 billion; the Q3 offering brought it back to $114.9 billion. The 8.02 price-to-book reading in June combined the price peak with that shrunken equity base.
- Outside view (market data consensus, right after Q3 results): Of 49 analysts, 11 rate Intel a strong buy, 1 a buy, 36 a hold and 1 a strong sell, so holds make up more than 70% of ratings.
Three Conditions That Move the Stock
- DCAI revenue should land between $8.27 billion and $8.56 billion if the guide holds. If Fab 28 recovers on time and PBS keeps growing, a number at the top of that range says the server crossover is more than a one-quarter event; a number below it says supply is limiting growth before demand does.
- Non-GAAP gross margin is the measure of what the PC cutback costs. A return to the 40% range in Q1 would show the hit was temporary; if OEM inventory cuts run into Q1 and Intel trims wafer starts further, margin stays below 38% and Q3's 44.1% becomes the number from a quarter when PCs and servers filled the fabs together.
- Share count stands at 5.315 billion after the offering. Net cash turned positive at $3.87 billion in September, but the CEO said Intel is evaluating ways to accelerate the Ohio build-out, and if bigger capex leads to another equity raise, each share's claim thins again. The 132 million escrow shares and the government's 240.5 million warrants are also still outstanding.
What to Watch in the Q4 Report
- Fourth-quarter results in late January will show how far CCPG actually fell and what Intel guides for PCs in Q1. The CEO said "We expect the current environment to persist until memory availability and prices begin to normalize," and promised more on Nova Lake at CES in January.
- One question stays open. Once PC makers bring inventory weeks back to normal, will Intel's PC chip orders recover before memory prices settle?
Related Analysis
- AMD Stock Analysis: Q2 2026 Earnings and the Debt Raise: Intel's closest CPU rival, useful for comparing AMD's debt raise with Intel's equity offering and term debt.
- TSMC (TSM) Stock: 60% Margins and Guidance It Keeps Beating: the foundry benchmark, a contrast with Intel Foundry's -27.7% operating margin.
- NVIDIA (NVDA) Stock Analysis: Guarantees and Cash Flow: the company that bought Intel shares at $23.28 in 2025, a read on the data center spending that drives DCAI demand.
#Intel #INTCStock #Semiconductors #DataCenter #Foundry #AIChips #USStocks #StockAnalysis #EquityResearch #GlobalStockBrief
'US Stock Analysis' 카테고리의 다른 글
| Chevron (CVX) Stock: Refining Carried Q3 as Brent Fell (0) | 2026.11.03 |
|---|---|
| AstraZeneca (AZN) Stock: Oncology Fills the Farxiga Gap (0) | 2026.11.03 |
| Verizon (VZ) Stock: Record Adds and Flat Revenue Ex Frontier (0) | 2026.11.02 |
| ServiceNow (NOW) Stock: Armis Inside an 18.5% cRPO Guide (0) | 2026.11.02 |
| Amazon (AMZN) Stock: AWS Up 39% and Free Cash Flow Negative (0) | 2026.11.01 |


