Coinbase Global (NASDAQ: COIN) reported third-quarter 2026 net income of $718.7 million, but operating income was only $61.7 million. Of $823.9 million of pre-tax income, $715.0 million, or 86.8%, came from gains on the crypto assets the company holds for investment. Total revenue was $1.216 billion, -34.9% on a year earlier, and the first nine months of 2026 still show a net loss of $34.9 million. A September rebound in crypto prices produced the profit, while the core business earned about one-eighth of its operating income a year earlier.
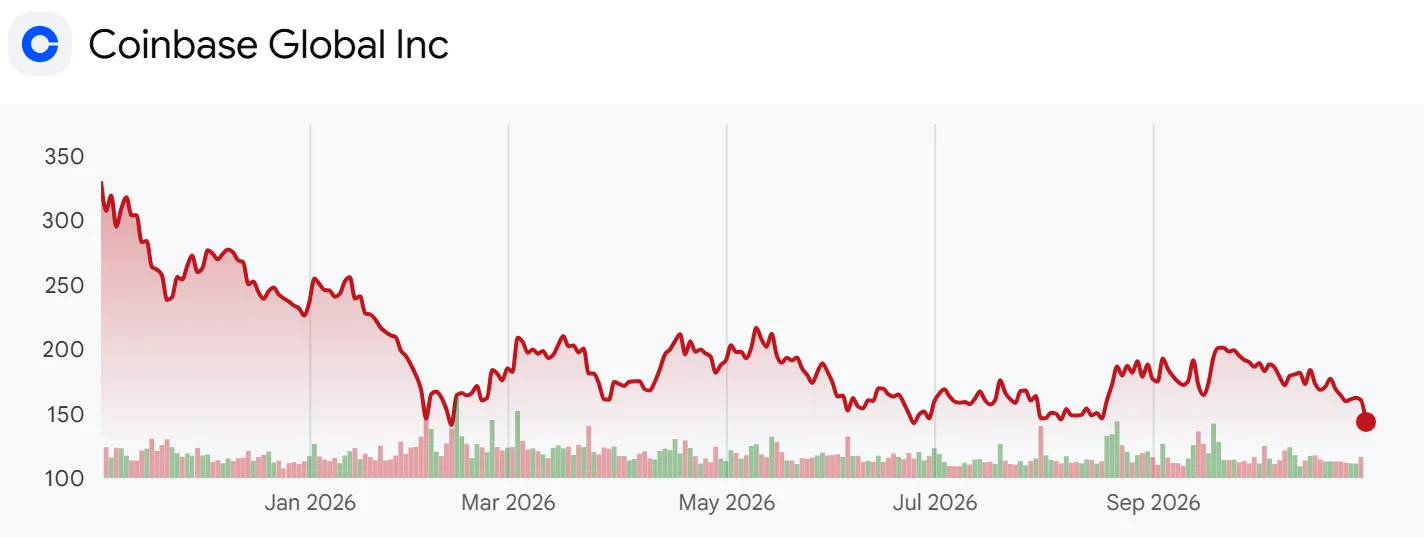
Coinbase runs the largest crypto exchange in the United States. It earns trading fees when retail and institutional customers buy and sell crypto, a share of the interest on the reserves behind the USDC stablecoin, staking rewards, fees from its Coinbase One subscription, and fees from prediction markets and derivatives. It came to Nasdaq through a direct listing in April 2021, and at the October month-end close of $143.54 it is worth about $38.0 billion on market data, -57.6% over a year.
Coinbase one-year share price chart
The question here is what remains at Coinbase once the crypto prices that drive its net income are stripped out, and how much of the shrinking trading revenue stablecoins, subscriptions and prediction markets are replacing. The analysis lines up the Q3 2026 earnings deck, the Q3 2026 10-Q, 19 shareholder letters and earnings decks since 2022 and four 2026 8-Ks on executive changes.
Two caveats apply. Net revenue is the company’s own definition, total revenue minus other revenue, and adjusted EBITDA and adjusted net income are non-GAAP measures that exclude crypto investment gains and losses, stock compensation and other items. Share counts are the quarter-end shares outstanding (Class A and Class B combined) shown in the deck, and figures run through September 30, 2026.
What the Q3 Deck Says About the Revenue Mix
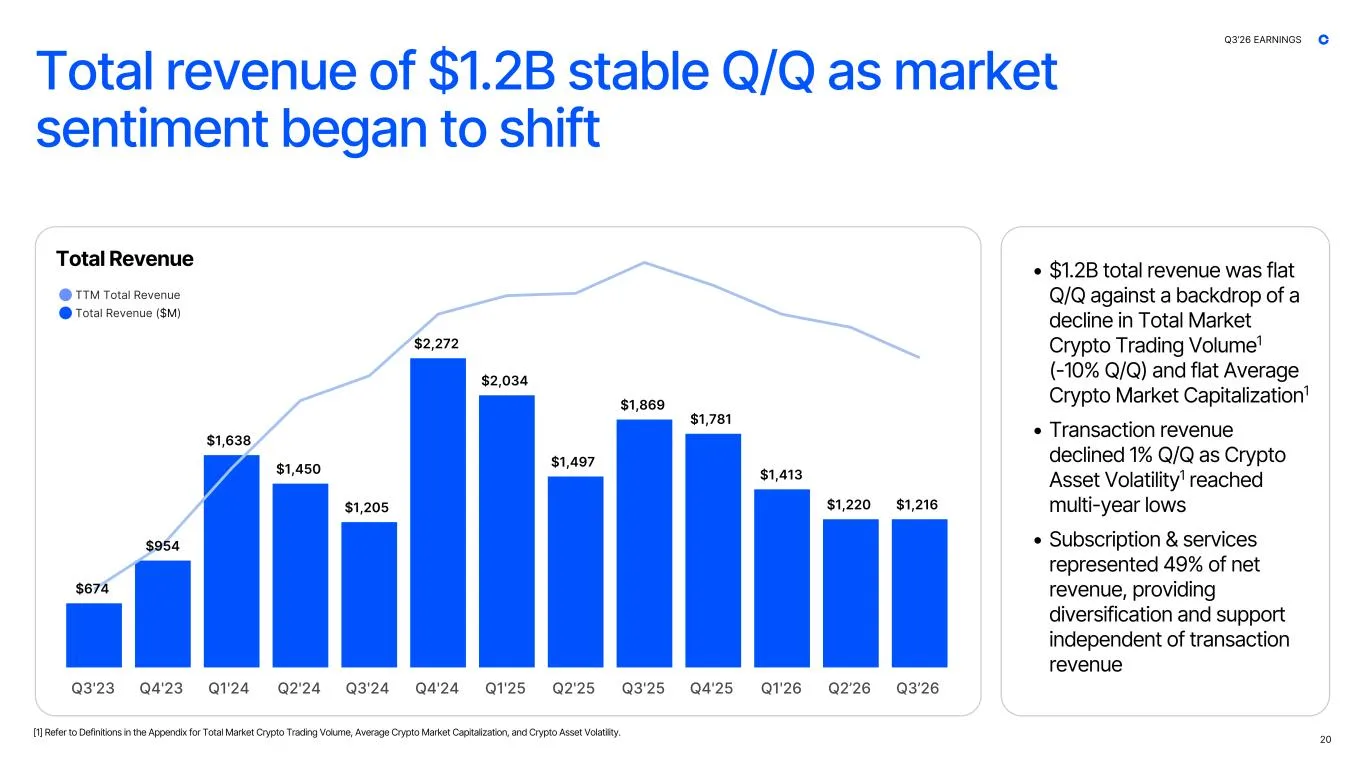
Q3 2026 deck page 20: total revenue over 13 quarters
The Q3 deck runs 42 pages. Page 20 stacks 13 quarters of total revenue: the high was $2.272 billion in Q4 2024, Q3 2025 came in at $1.869 billion and Q3 2026 at $1.216 billion. The page says total revenue was flat sequentially while total market trading volume fell 10% and average crypto market capitalization held steady, and it presents subscription and services at 49% of net revenue as support that does not depend on trading.
Company disclosure (Q3 2026 earnings deck, October 29, 2026): Page 18 is a report card headed “The business is healthy”. It lists market share gains, prediction market growth, the larger subscription share and adjusted expenses below the Q3 outlook. The right side reads soft volume, low volatility and the September price rebound as “Macro headwinds have begun to shift”.
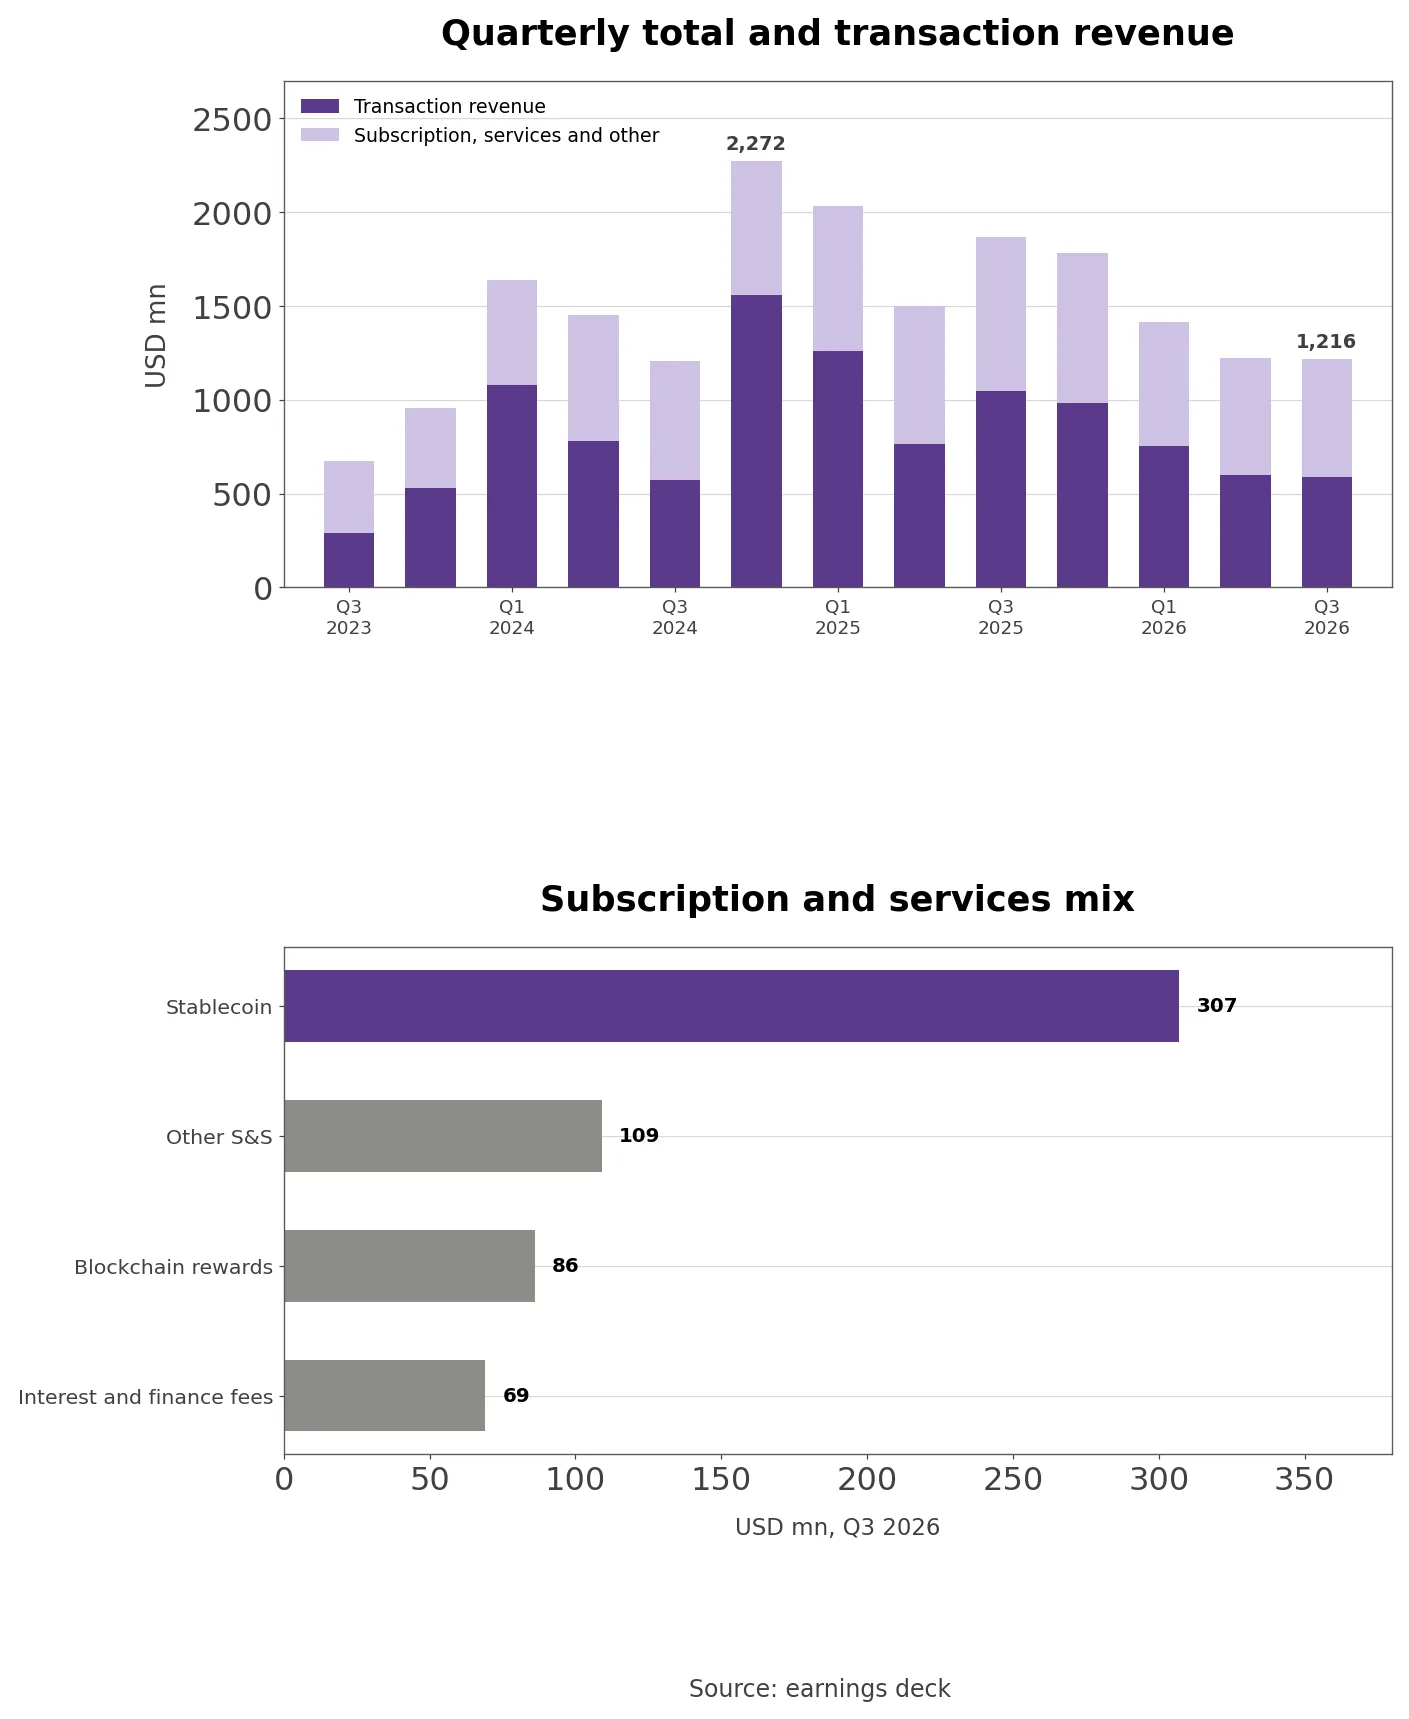
Checked against the filings, the growth engine has changed. Transaction revenue was $590.2 million, -43.6% from $1.046 billion a year earlier and -62.1% from the Q4 2024 peak of $1.556 billion. Its share of total revenue fell from 56.0% to 48.5%. Within it, retail brought in $450 million, about flat sequentially because prediction markets offset a 9% drop in retail spot volume and a 6% drop in derivatives volume; institutional was $92 million, -8%, and other $48 million.
Subscription and services, the line whose share rose, also shrank in dollars. The appendix table on page 30 shows it at $570.2 million against $716.6 million a year earlier, -20.4%, while adjusted EBITDA fell from $800.7 million to $332.9 million, -58.4%. Corporate interest and other income dropped from $105.8 million to $55.1 million, -47.9%. Adjusted expenses came down only 10.4%, from $1.089 billion to $975.0 million. The 49% share is the product of trading revenue falling faster, not of subscription revenue growing.
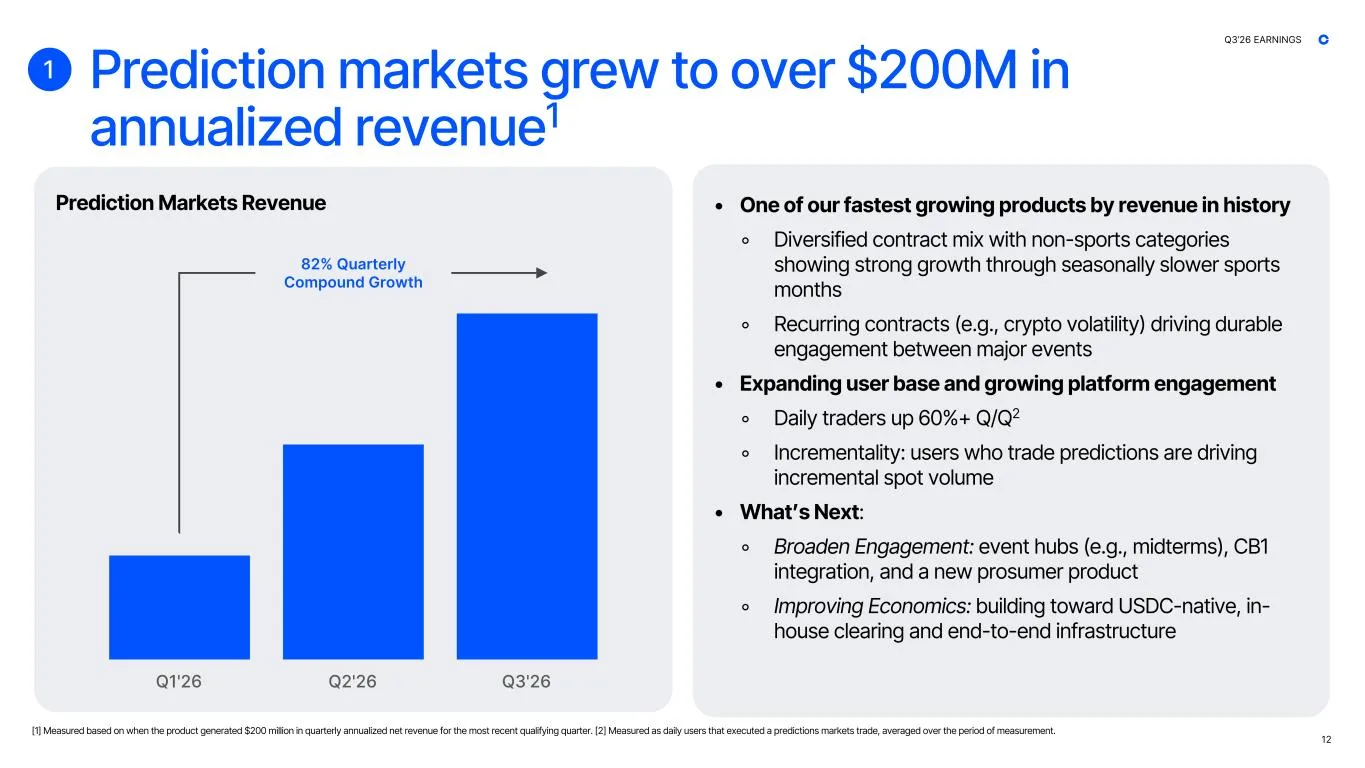
Page 12 says prediction markets passed $200 million of annualized revenue and calls them “One of our fastest growing products by revenue in history”, with 82% quarterly compound growth since launch and daily traders up more than 60% sequentially. $200 million annualized is about $50 million a quarter, 8% to 9% of Q3 transaction revenue. Page 11 says derivatives volume has compounded at 179% a year over two years and U.S. open interest hit a record, that the INTX and Deribit integration was completed in October, and that a relaunched Coinbase Pro will put spot, futures, perpetuals, options and equities in one portfolio in Q4. It also warns of “Some near-term volatility expected as participants adjust”.
The Q4 Outlook and Buybacks in the Deck
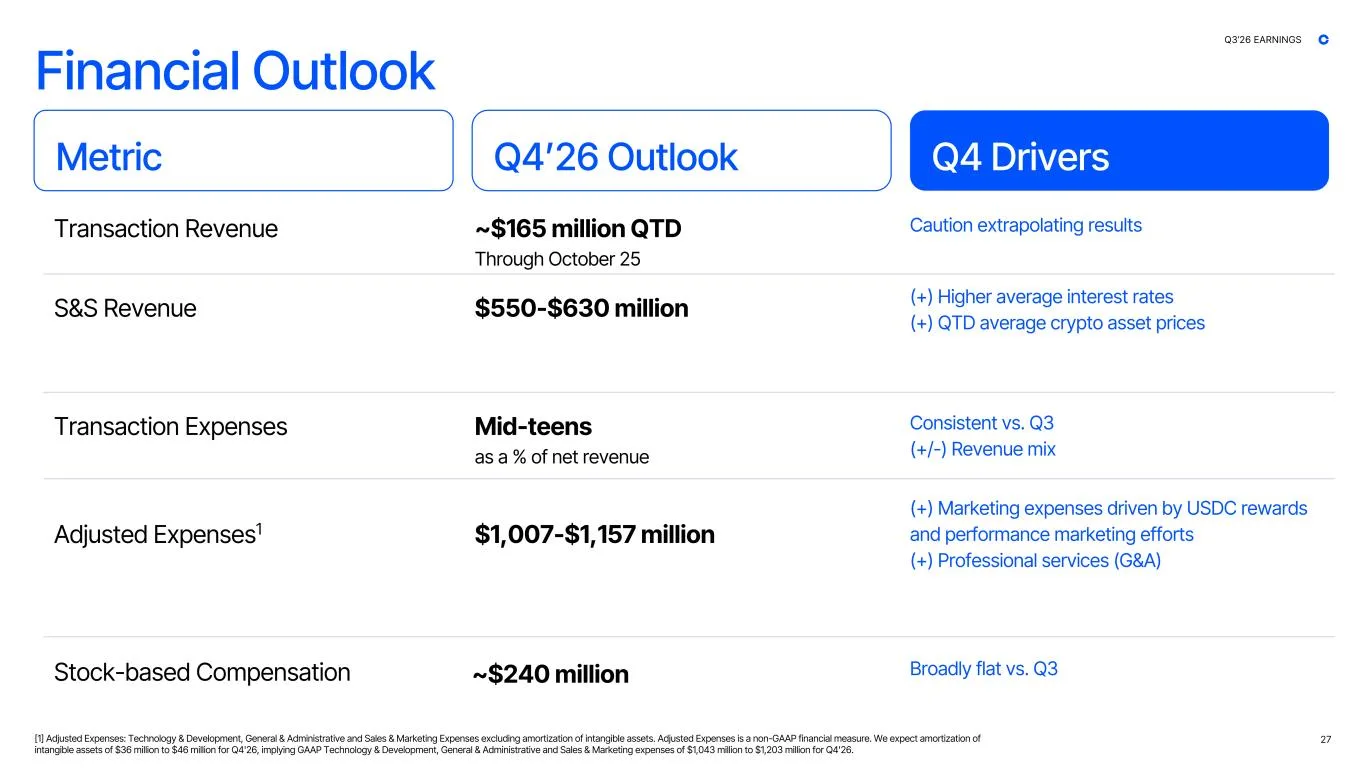
Q3 2026 deck page 27: Q4 outlook
The Q4 outlook on page 27 gives no range for transaction revenue. It says only that transaction revenue was about $165 million through October 25 and adds “Caution extrapolating results”. Subscription and services are guided to $550 million to $630 million, adjusted expenses to $1.007 billion to $1.157 billion and stock-based compensation to about $240 million. In Q3, Coinbase delivered $570 million of subscription and services revenue inside its $500 million to $580 million outlook and spent $975.0 million of adjusted expenses, below the $980 million low end.
Own calculation (deck pages 21 and 27): Q3 transaction revenue over 92 days is about $6.41 million a day, while the $165 million over the first 25 days of Q4 works out to about $6.60 million a day, 2.9% faster. The Q4 adjusted expense midpoint of $1.082 billion, however, is more than $100 million above Q3.
Page 28 cuts the full-year 2026 adjusted expense outlook once more, under the line “We are reducing and narrowing our 2026 Adjusted Expenses guidance range again”. The range started the year at $4.25 billion to $4.60 billion, moved to $4.20 billion to $4.45 billion with the Q2 results and now stands at $4.15 billion to $4.30 billion, with the midpoint falling by $100 million each time.
Own calculation (deck pages 28 and 30): Nine-month adjusted expenses of $3.143 billion plus the Q4 outlook give $4.150 billion to $4.300 billion, consistent with the full-year range, and the $4.225 billion midpoint is only 1.3% below the $4.282 billion spent in 2025. Total revenue fell by about a third over the year while annual costs stayed nearly level.
Q3 2026 deck page 26: quarter-end shares outstanding and buybacks
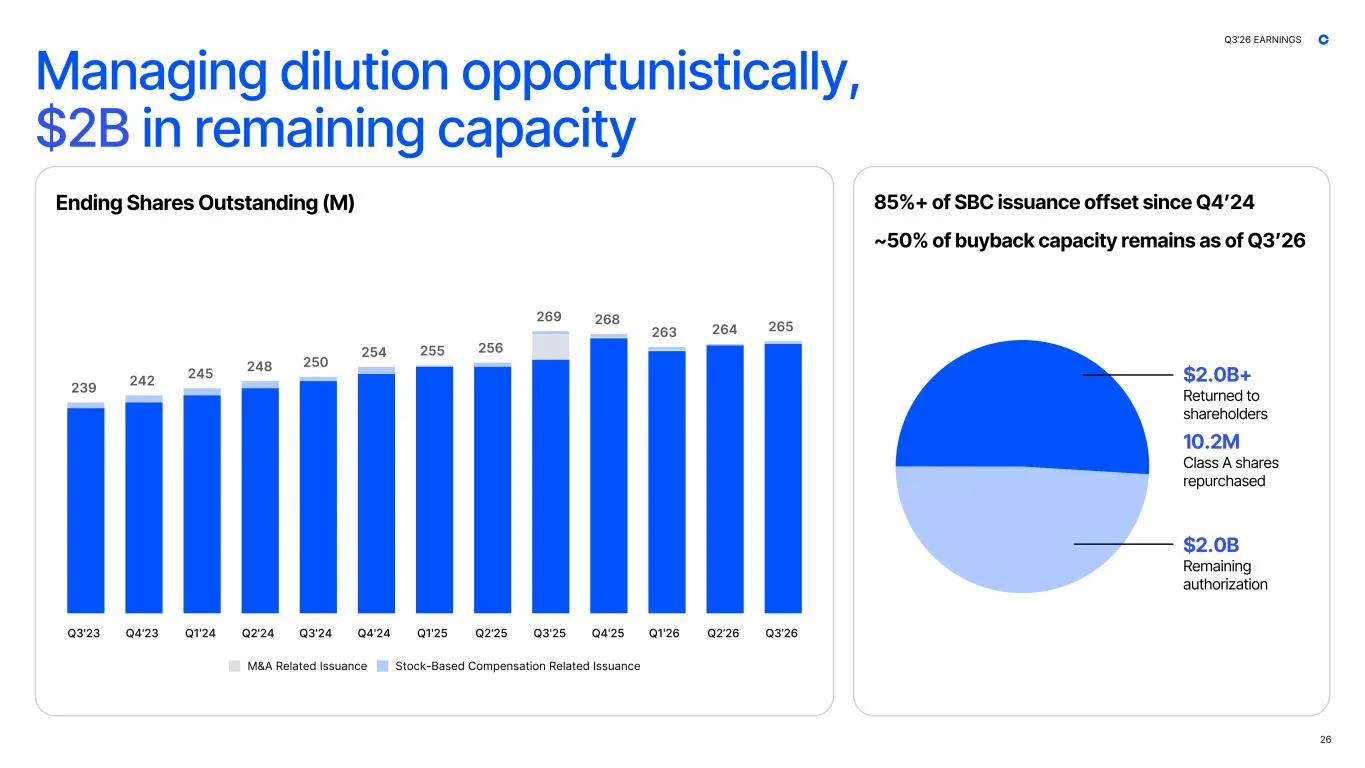
Page 26, headed “Managing dilution opportunistically”, says Coinbase has repurchased 10.2 million Class A shares, returned more than $2.0 billion, has $2.0 billion of authorization left and has offset more than 85% of stock-based compensation issuance since Q4 2024. Yet the bars on the same page show quarter-end shares rising from 239 million in Q3 2023 to 265 million in Q3 2026, +10.9%, with an acquisition-related jump of 13 million shares in Q3 2025.
Checked against the 10-Q, buybacks were concentrated in the first half of 2026. Coinbase bought 7.13 million shares for $1.189 billion over nine months, about $166.7 a share, but only 38,000 shares for $5.32 million in Q3. Cumulative purchases of 10.17 million shares cost an average of about $196.7 a share, and the October month-end close of $143.54 sits 27.0% below that.
The Bull and Bear Case for Coinbase Stock
The bull case is the change in mix. Subscription and services are half of net revenue, stablecoin revenue rises with record USDC balances, prediction markets and derivatives are filling the gap left by spot trading, adjusted EBITDA has been positive for 15 straight quarters, and the full-year expense outlook is $200 million below where it started.
The bear case is crypto dependence. The Q3 GAAP operating margin was 5.1%, net income flips sign with crypto marks, shares are up 10.9% in three years despite buybacks, subscription and services are 20.4% lower than a year earlier, and the stablecoin half of that line falls when interest rates fall.
From Direct Listing to the Stablecoin Law
Coinbase month-end share price with four dates
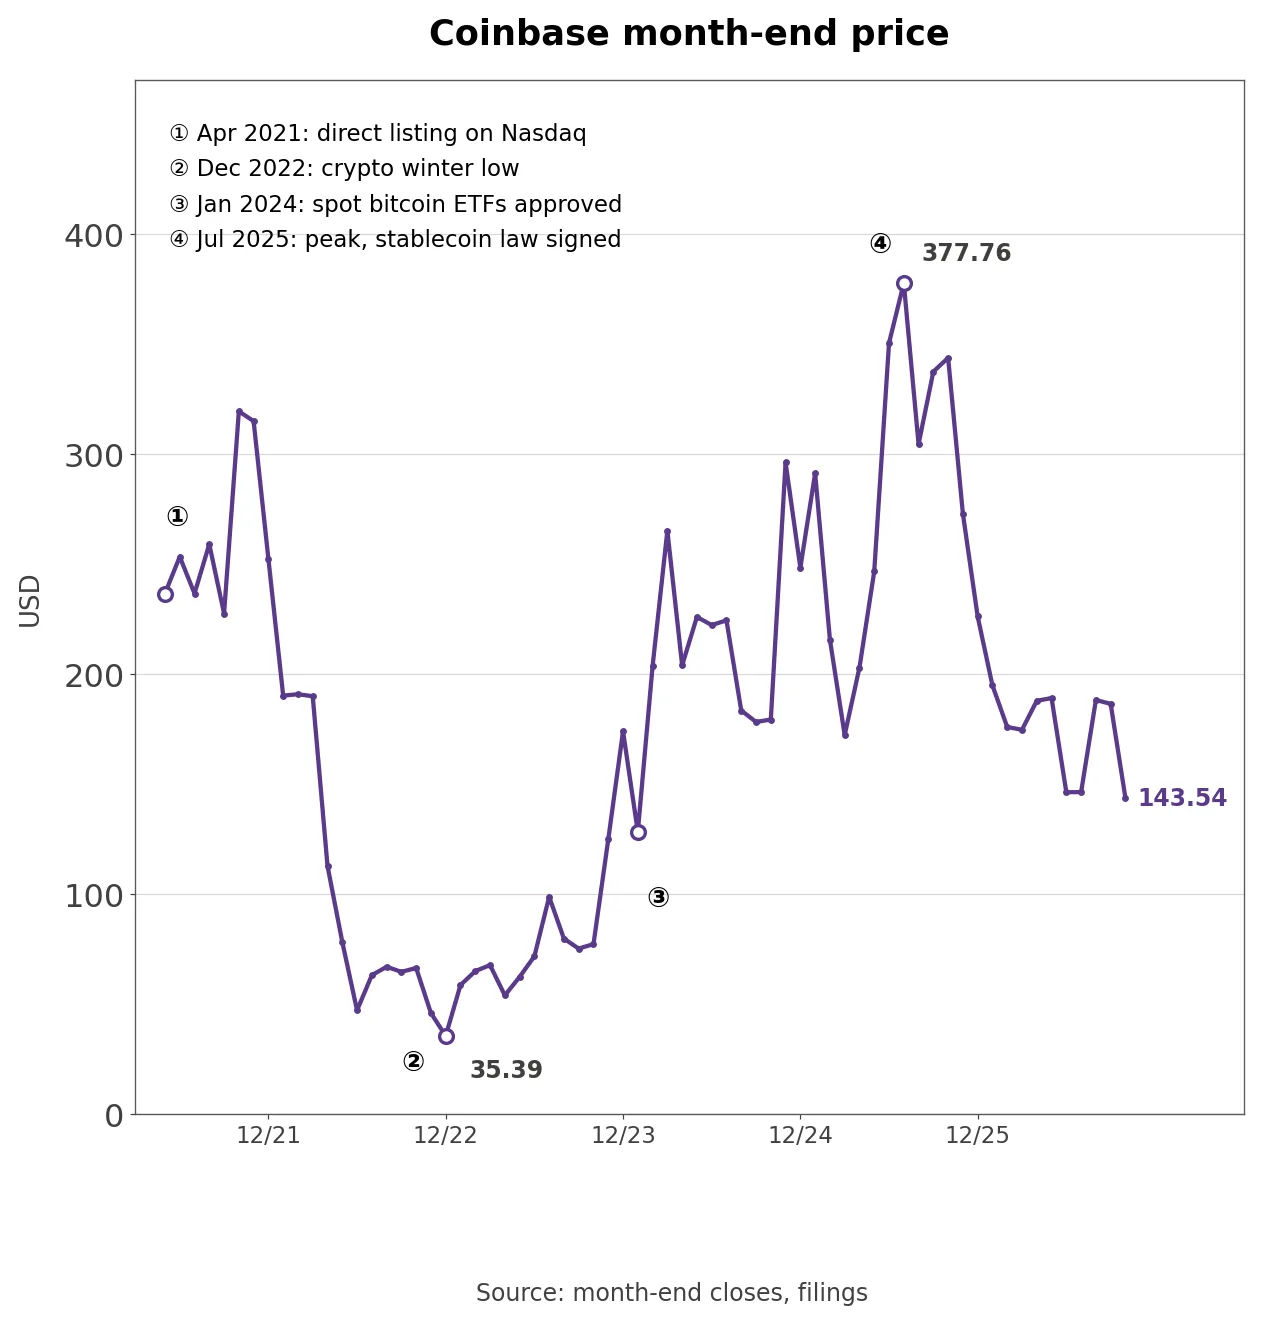
Coinbase was founded in 2012 and came to Nasdaq in April 2021 through a direct listing, with no new shares sold. Its first month-end close, in May 2021, was $236.54. Crypto prices collapsed in 2022, rival exchange FTX failed in November, and the December 2022 close of $35.39 is the low since listing. In June 2023 the SEC sued Coinbase for operating an unregistered exchange.
The rebound started with U.S. approval of spot bitcoin ETFs in January 2024, with Coinbase acting as custodian for many of them. The SEC dropped its case in February 2025 and Coinbase joined the S&P 500 in May. The stock closed March 2024 at $265.12 and July 2025 at $377.76, the high of this stretch, in the month the U.S. stablecoin law was signed and gave the USDC business a legal footing. Coinbase closed its acquisition of Deribit, a crypto derivatives exchange, on August 14, 2025.
As crypto prices fell, Coinbase posted three straight quarterly net losses from Q4 2025 through Q2 2026. The October 2026 close of $143.54 is -62.0% from July 2025 but still 4.06 times the 2022 low, and the stock fell more than 10% on the trading day after the Q3 report. Along the way, the chief legal officer and the chief people officer gave notice in July 2026, followed by the chief accounting officer in September.
How Much of the Profit Came From Crypto Prices?
Coinbase quarterly net income against crypto investment gains and operating income
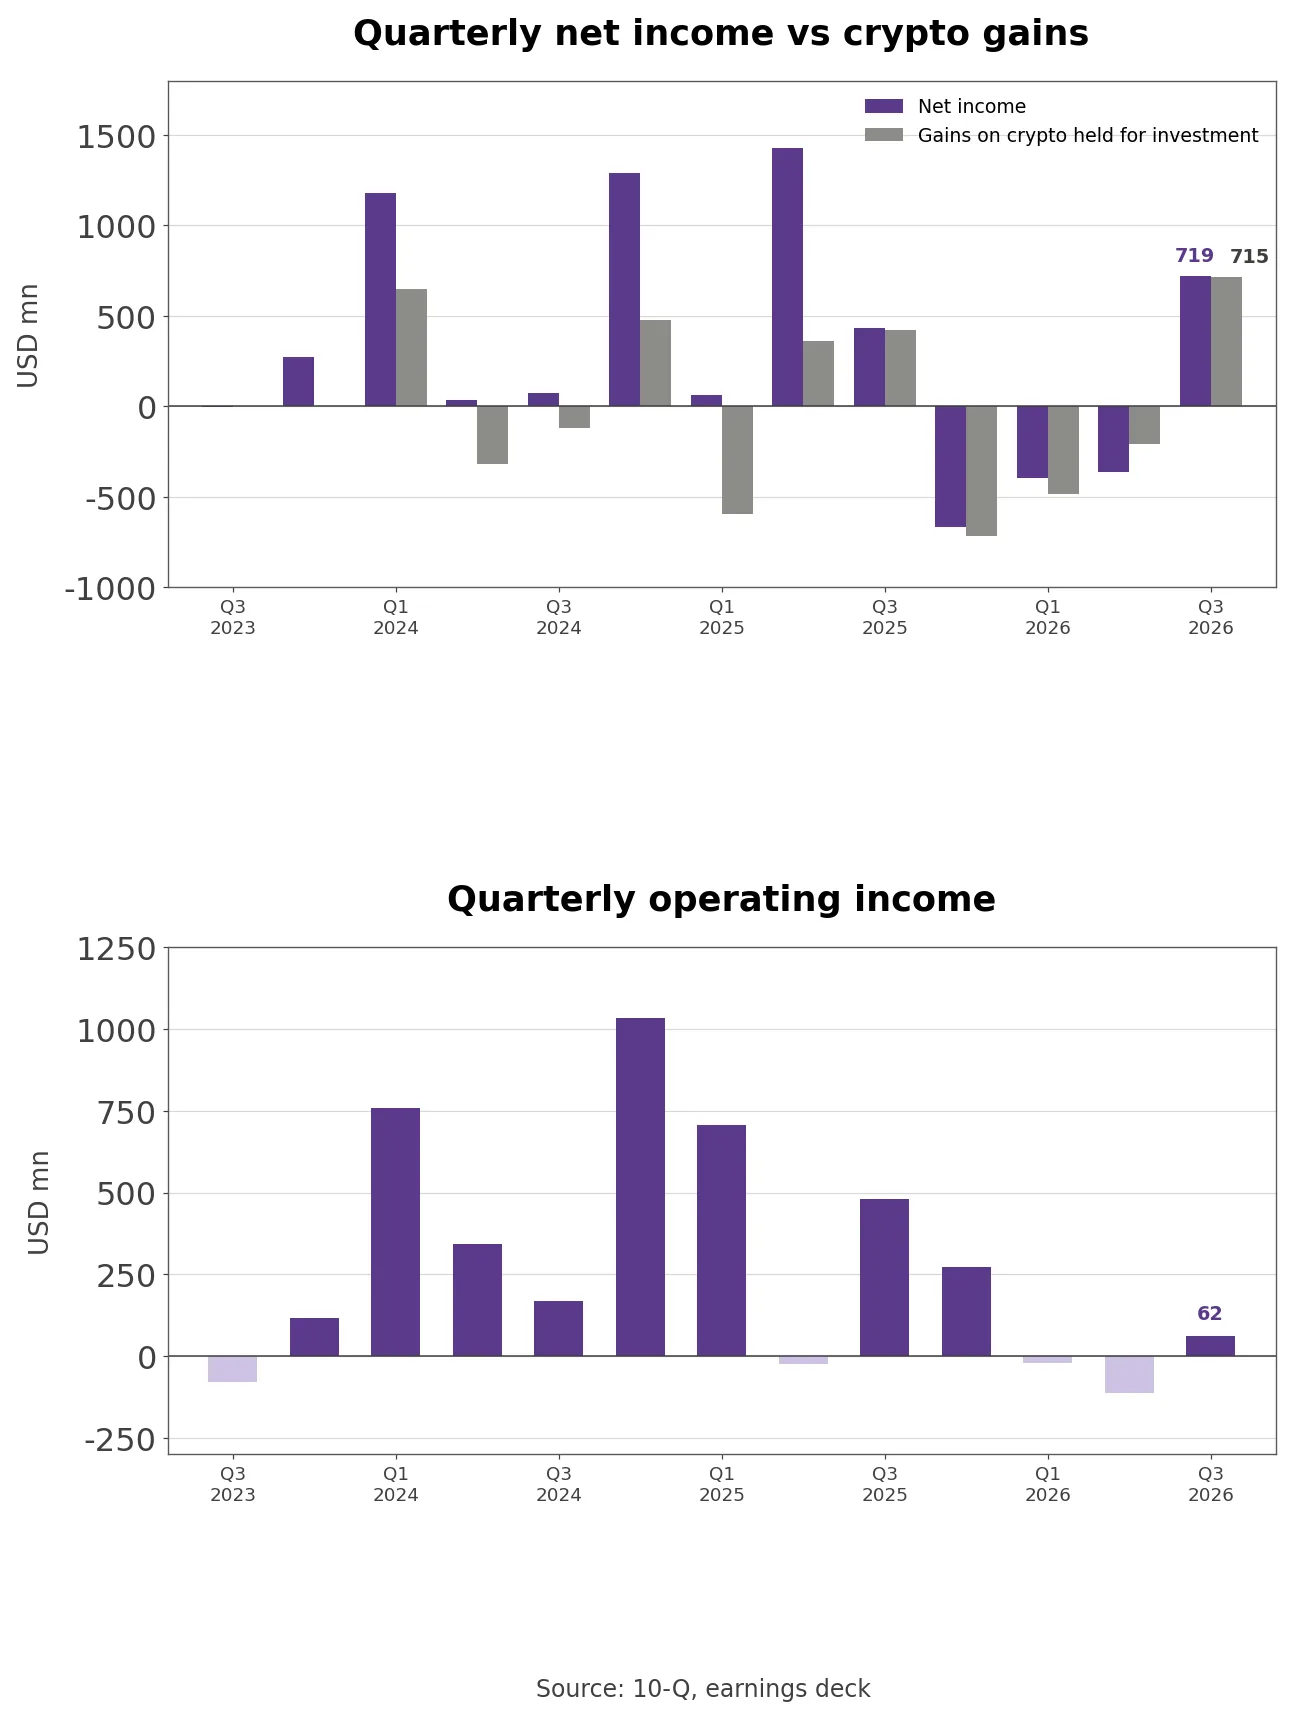
Coinbase holds crypto on its own balance sheet, separate from customer assets, and marks this crypto held for investment to market every quarter through non-operating income. Net income therefore follows crypto prices more closely than it follows the business.
Own calculation (10-Q and XBRL, 13 quarters): In 9 of the 13 quarters from Q3 2023, net income and gains or losses on crypto held for investment had the same sign. Trailing four-quarter net income totals a $701.6 million loss, against a $695.1 million loss on crypto investments and $200.6 million of operating income over the same period.
The Q3 income statement adds up this way: operating income of $61.7 million, plus $715.0 million of crypto investment gains and $66.7 million of other income (including $39.2 million of net gains on investments), less $19.5 million of interest expense, gives pre-tax income of $823.9 million. After $105.2 million of income tax, net income is $718.7 million.
By quarter, the Q4 2025 net loss of $666.7 million came from $718.2 million of crypto losses, and Q3 2026 net income of $718.7 million came from $715.0 million of crypto gains. Operating income peaked at $1.034 billion in Q4 2024, was negative in Q1 and Q2 2026 and returned to $61.7 million in Q3. Adjusted net income, which excludes the crypto marks, was $78 million.
Share Count and the Price Paid for Buybacks
Why did the share count rise after $2.0 billion of buybacks? One reason is stock compensation: $233 million in Q3 alone, with about $240 million guided for Q4. The other is shares issued as acquisition consideration; in Q3 2025, when the Deribit deal closed, quarter-end shares went from 256 million to 269 million.
Buybacks reversed part of that. Shares fell from 268 million in Q4 2025 to 263 million in Q1 2026 on first-half purchases, then rose back to 265 million by the end of Q3. With the stock at $146.19 at the end of June and $143.54 at the end of October, near its lows of the year, Q3 purchases came to just $5.32 million, at odds with the dilution management that page 26 promises.
Own calculation (10-Q and deck page 27): Q3 buybacks of $5.32 million equal 2.3% of Q3 stock compensation of $233 million. The 85% offset on page 26 is cumulative since Q4 2024; taken on its own, Q3 offset almost nothing.
The Business Behind Trading and Stablecoin Revenue
Coinbase’s revenue splits into transaction revenue and subscription and services. Transaction revenue is fees on crypto trades, and in Q3 retail accounted for $450 million of the $590 million, or 76.3%. Retail pays higher fees but crowds in when prices rise and leaves when they fall; institutions trade more volume at lower fee rates. The deck puts Coinbase’s share of crypto trading volume at 10.7%, up for a fourth straight quarter, and ranks it first in U.S. spot volume. Assets on the platform held at 12.5% of total crypto market capitalization, flat on a year earlier at a peak level, which the company reads as customer assets staying put while trading slowed.
Coinbase transaction revenue against other revenue and the subscription and services mix
More than half of the $570 million of subscription and services revenue is stablecoin revenue. Coinbase has an agreement with Circle, the issuer of the dollar-pegged USDC, to share the interest earned on USDC reserves, which sit mostly in short-term Treasuries. Q3 stablecoin revenue was $307 million, +5% sequentially, which the company attributes to record average USDC held in Coinbase products and higher rates. Average USDC held in Coinbase products was $22 billion, 30.1% of the $73 billion average USDC market capitalization, and the 10-Q states that the company “renewed our arrangement with Circle Internet Financial, LLC on the same terms” during the quarter. Stablecoins alone produced 26.5% of net revenue, so revenue holds up when trading slows as long as rates and USDC balances hold, and falls when rates fall.
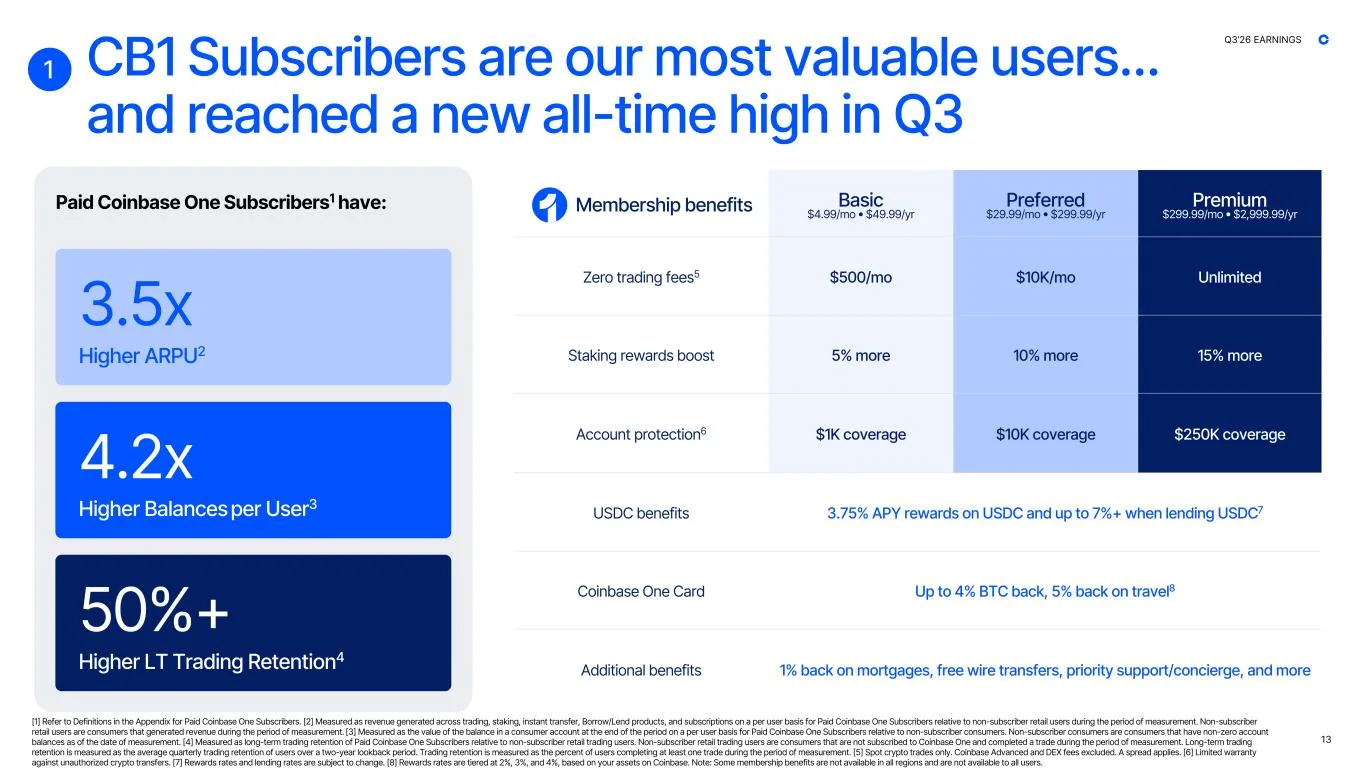
The rest is $86 million of blockchain rewards (Coinbase’s share of staking rewards on customer crypto), $69 million of interest and finance fees and $109 million of other subscription and services. Average borrow and lend balances rose from $610 million a year earlier to $1.866 billion, 3.06 times, and the other line includes Coinbase One, priced from $4.99 to $299.99 a month. Page 13 says paid subscribers reached a record, with 3.5 times the revenue per user and 4.2 times the balances of other retail users.
Q3 2026 deck page 13: the Coinbase One subscription
The newer engines are prediction markets and derivatives. Prediction markets are contracts on the outcome of events such as elections, sports and economic data, and they have passed $200 million of annualized revenue. Derivatives are being built on the options business of Deribit, acquired in 2025, and on U.S. futures. The company’s 2026 priorities are an Everything Exchange for crypto, equities, prediction markets, commodities and FX, then stablecoins and payments, then onchain finance.
Onchain, Coinbase builds on Base, its own Ethereum layer-2 network. Page 16 says Base ranked first among layer-2 networks in Q3 for spot crypto trading and for DeFi total value locked, and that tokenized stocks traded on Base have passed $1 billion of cumulative volume since launch. None of this shows up as a separate revenue line yet.
Stablecoins carry a cost as well. Coinbase One subscribers earn 3.75% APY rewards on USDC, and those rewards run through sales and marketing. Coinbase earns interest on the reserves and spends part of it to keep customer balances on the platform, so growth in stablecoin revenue does not reach profit in full.
By line item, Q3 expenses were technology and development of $447.4 million, general and administrative of $318.9 million, sales and marketing of $242.6 million and transaction expense of $194.5 million. Page 23 says technology and development fell 5% sequentially on a full quarter of the May 2026 cost cuts, G&A fell 11% on lower professional services, and sales and marketing rose 1% on higher USDC rewards. Transaction expense rose to 17% of net revenue, up 32 basis points, on exchange fees tied to prediction market growth, a cost that travels with that revenue.
Coinbase vs Robinhood Interactive Brokers and CME Group
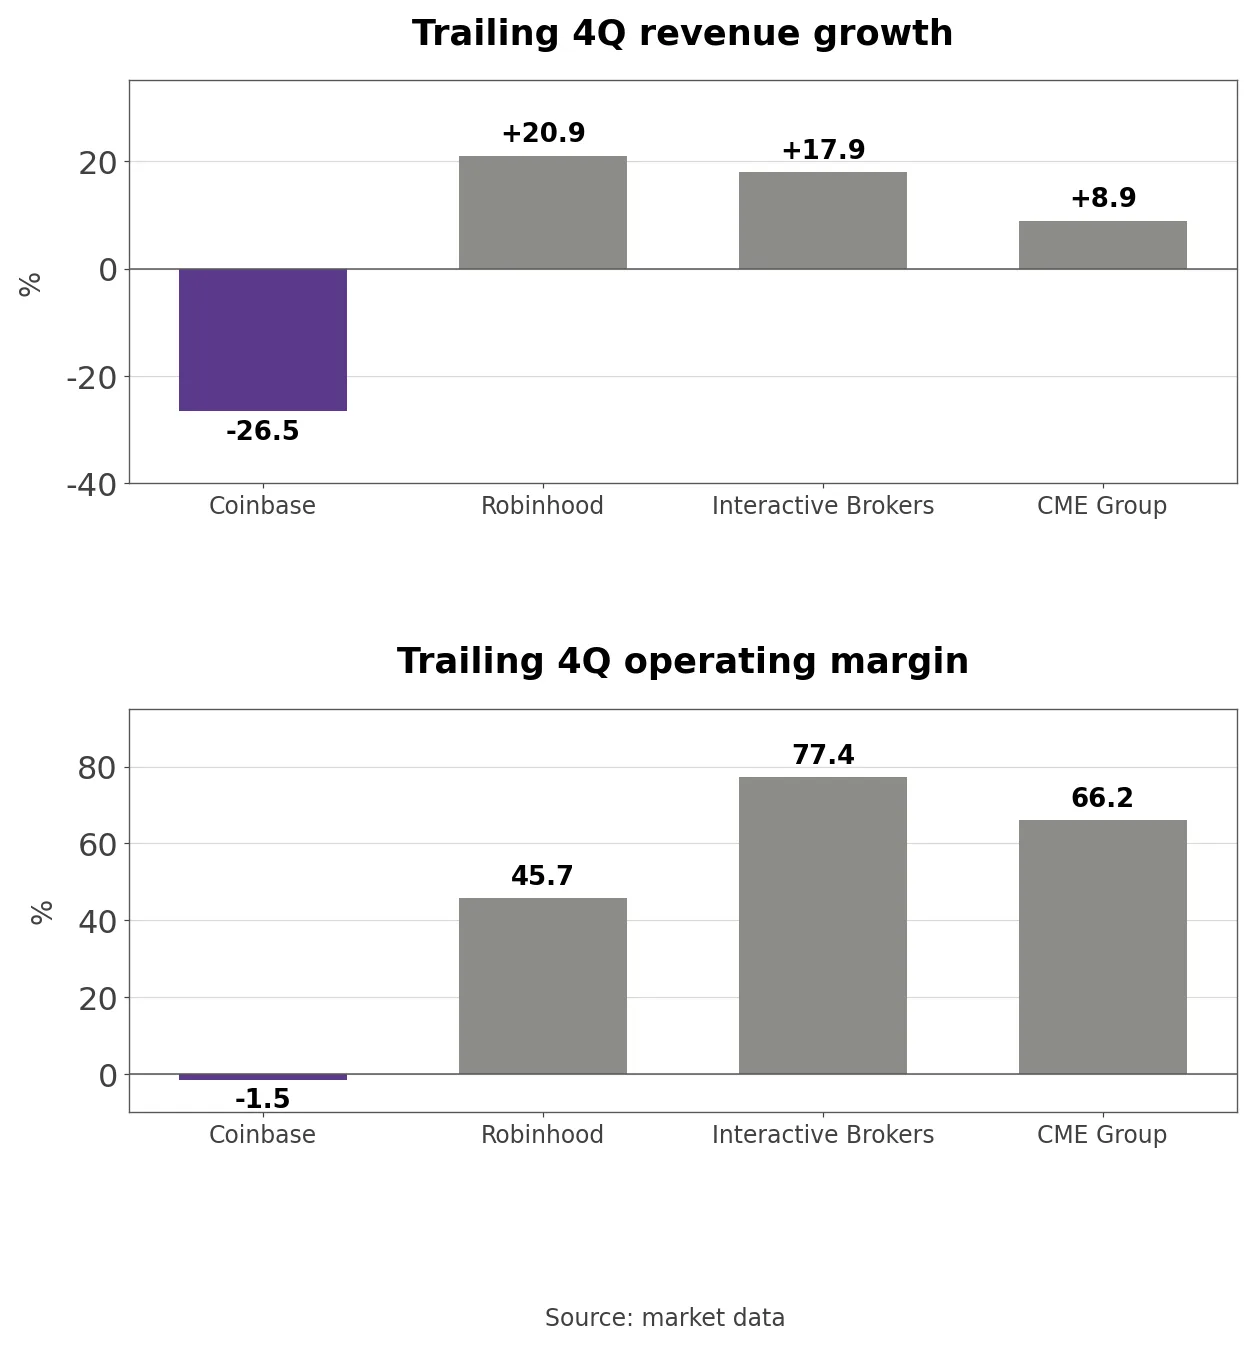
Revenue growth and operating margin at Coinbase Robinhood Interactive Brokers and CME Group
The comparison set is a retail trading app, a broker and an exchange. Robinhood sells stocks and crypto through its retail app and competes directly for Coinbase’s retail customers; Interactive Brokers is a global stock and futures broker; CME Group is the largest U.S. derivatives exchange and lists bitcoin futures. On market data, trailing-twelve-month (TTM) revenue growth was -26.5% at Coinbase, +20.9% at Robinhood, +17.9% at Interactive Brokers and +8.9% at CME, which makes Coinbase the only one of the four with shrinking revenue.
TTM operating margins were 77.4% at Interactive Brokers, 66.2% at CME and 45.7% at Robinhood, against -1.5% at Coinbase on market data. Robinhood, with the same kind of retail customer, kept growing because equity and options trading and interest on customer assets offset lower crypto trading; Coinbase still gets almost half of its revenue from crypto trading.
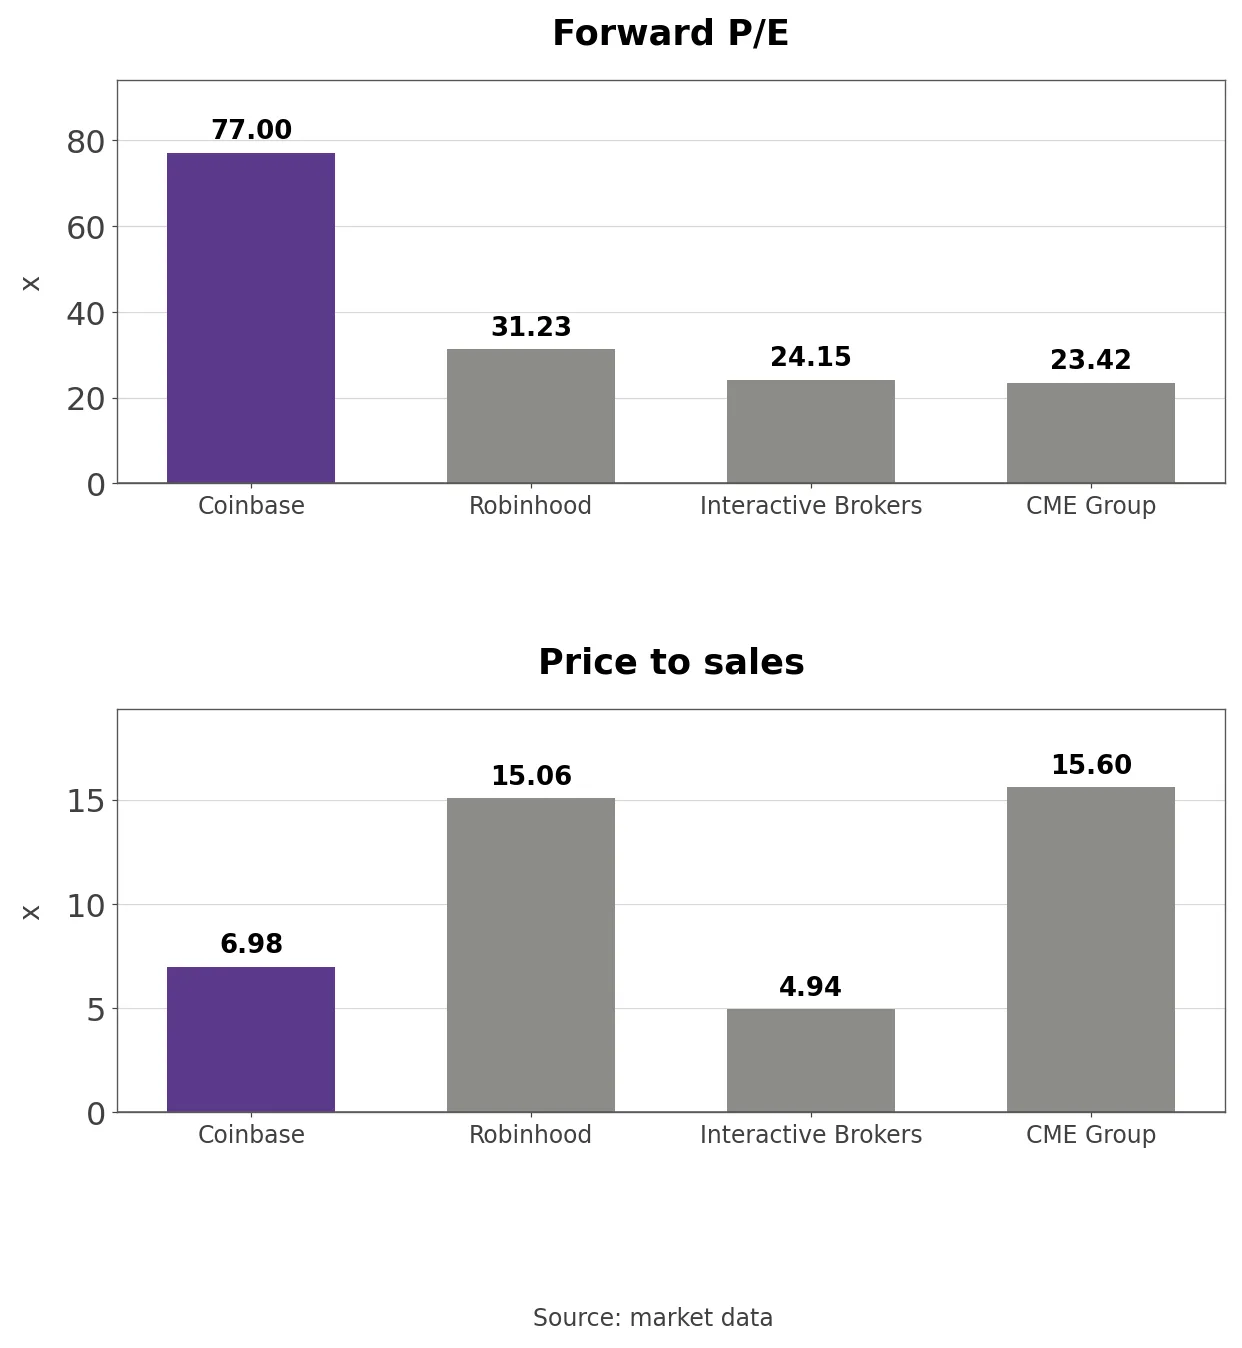
Forward P/E and price to sales at Coinbase Robinhood Interactive Brokers and CME Group
Forward P/E is 77.00 at Coinbase, 31.23 at Robinhood, 24.15 at Interactive Brokers and 23.42 at CME. Coinbase’s forward multiple divides by an estimate for a year with little profit and says little; on price to sales, Coinbase’s 6.98 is below Robinhood’s 15.06 and CME’s 15.60 and above Interactive Brokers’ 4.94. CME is worth $108.5 billion, Robinhood $76.5 billion, Coinbase $38.0 billion and Interactive Brokers $34.8 billion, and over a year Coinbase’s market value changed -57.6% and Robinhood’s -40.5%, the two most exposed to crypto. On payout, Coinbase pays no dividend and returns cash through buybacks alone, $1.189 billion over nine months of 2026, and stock compensation has absorbed much of that.
The Price-to-Sales and Price-to-Book Band
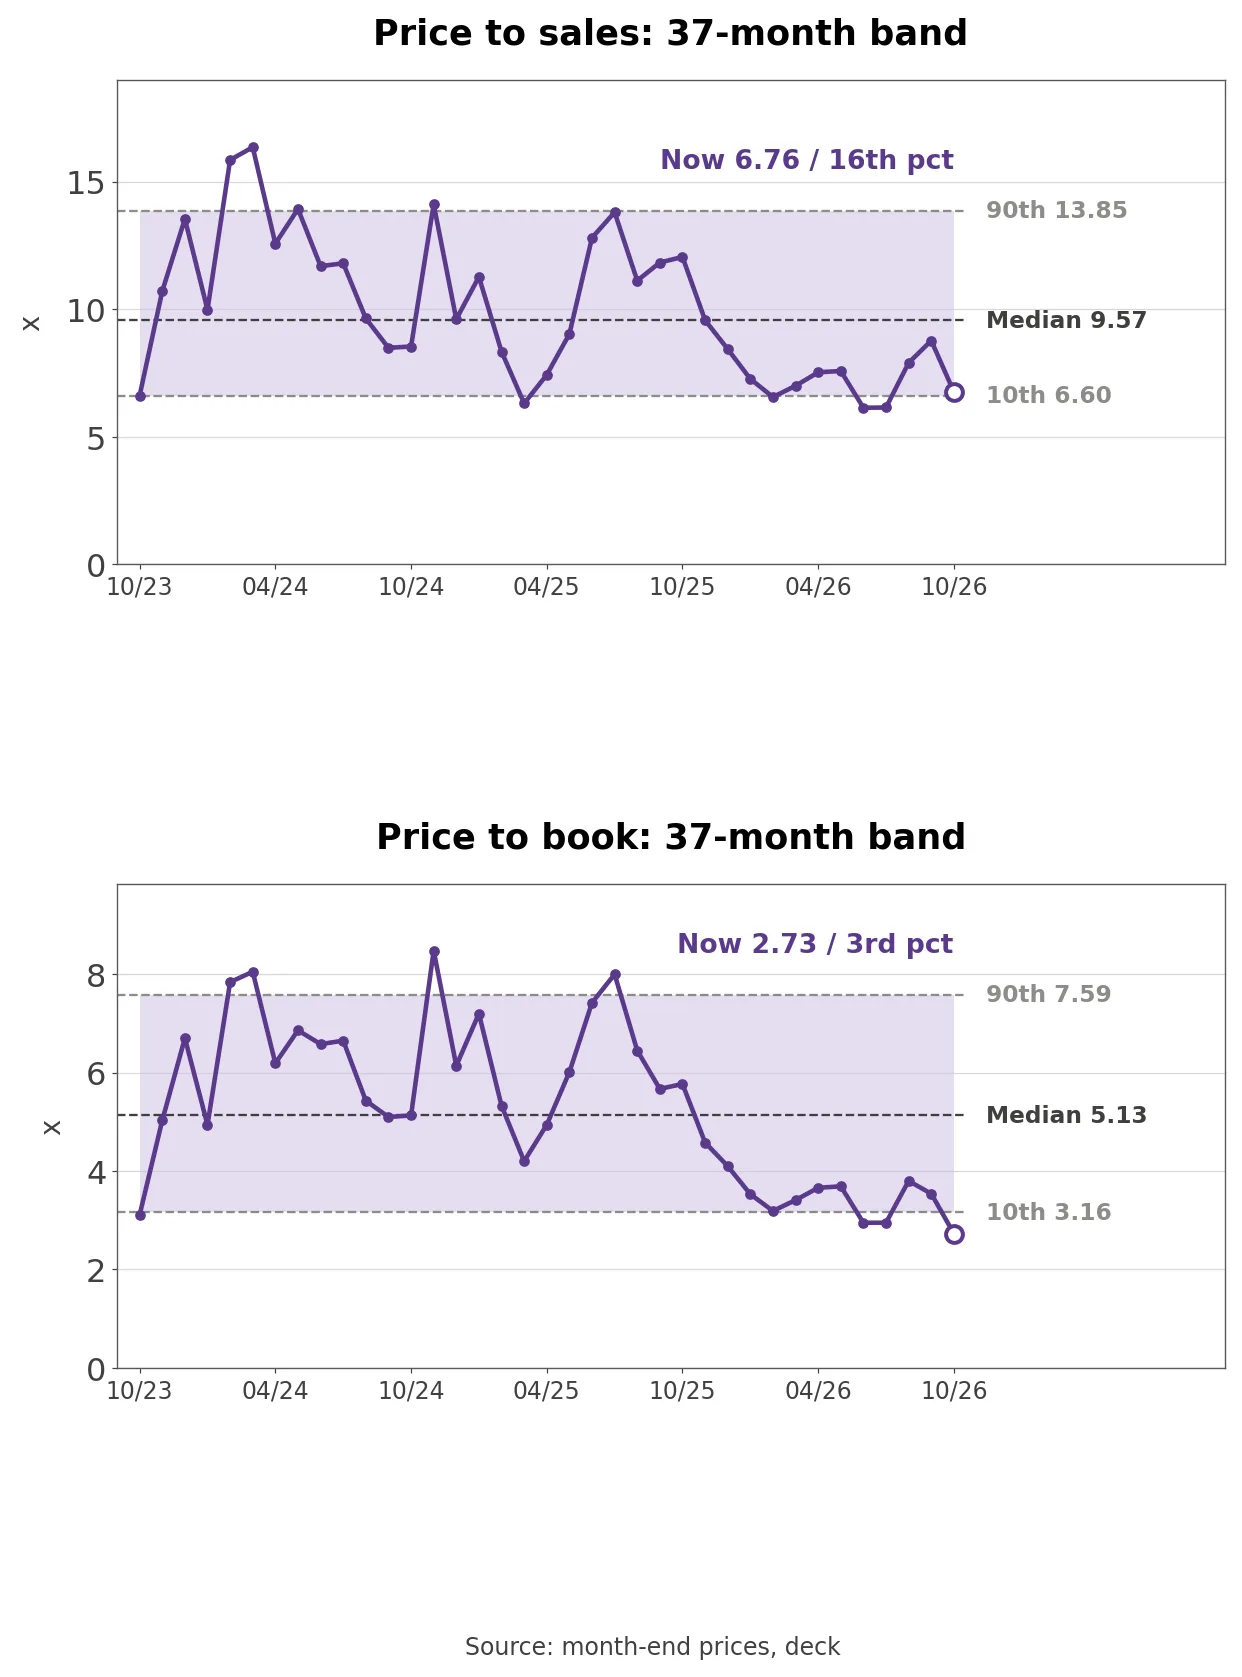
Coinbase price to sales and price to book over 37 months
The band covers 37 months, October 2023 to October 2026, starting the month after Q3 2023, the first quarter-end share count available from the decks. Trailing four-quarter net income is negative and quarterly profit swings with crypto marks, so the band leaves out P/E.
Own calculation (month-end prices, decks and the 10-Q): Price to sales of 6.76 sits at the 16.2nd percentile of 37 months (median 9.57, high 16.35 in March 2024), and price to book of 2.73 sits at the 2.7th percentile, the lowest of the 37 months (median 5.13).
Shareholders’ equity fell from $16.02 billion at the end of September 2025 to $13.94 billion at the end of September 2026 as net losses and buybacks reduced it, but the stock fell faster, which pushed price to book to its low. Price to sales stayed at the 16.2nd percentile because revenue shrank along with the price.
Three Conditions That Move the Stock
Transaction revenue mirrors crypto volume and volatility. If the first 25 days’ pace of about $6.60 million a day holds through Q4, or prediction markets and derivatives outgrow the decline in retail spot trading, that supports the stock; a long volatility trough that pushes transaction revenue below Q3’s $590 million would hurt it.
Stablecoin revenue depends on rates and USDC balances. Record balances and steady rates that lift subscription and services toward the $630 million top of the Q4 outlook would support the shares; rate cuts or lower USDC balances that pull stablecoin revenue below $307 million would weigh on them.
The share count shows how the buyback authorization gets used. Putting the remaining $2.0 billion to work at low prices and bringing quarter-end shares below 263 million would support the stock; continued growth in shares from stock compensation and acquisition issuance would hurt it.
What to Watch in the Q4 Report
The Q4 report, likely in mid-February, should first show whether transaction revenue kept its October pace, whether subscription and services landed in the $550 million to $630 million range and whether adjusted expenses rose as guided. Crypto investment gains and losses can flip the sign of net income again depending on quarter-end prices, so operating income and adjusted EBITDA are worth reading separately. The 10-K should add the timing and prices of buybacks, the size of stock compensation and whether a new chief accounting officer has been named.
One question stays open. Stablecoins and prediction markets are filling the hole left by trading revenue, but both depend on rates, events and crypto sentiment. If crypto prices do not recover, how much revenue does Coinbase have that can defend its operating income?