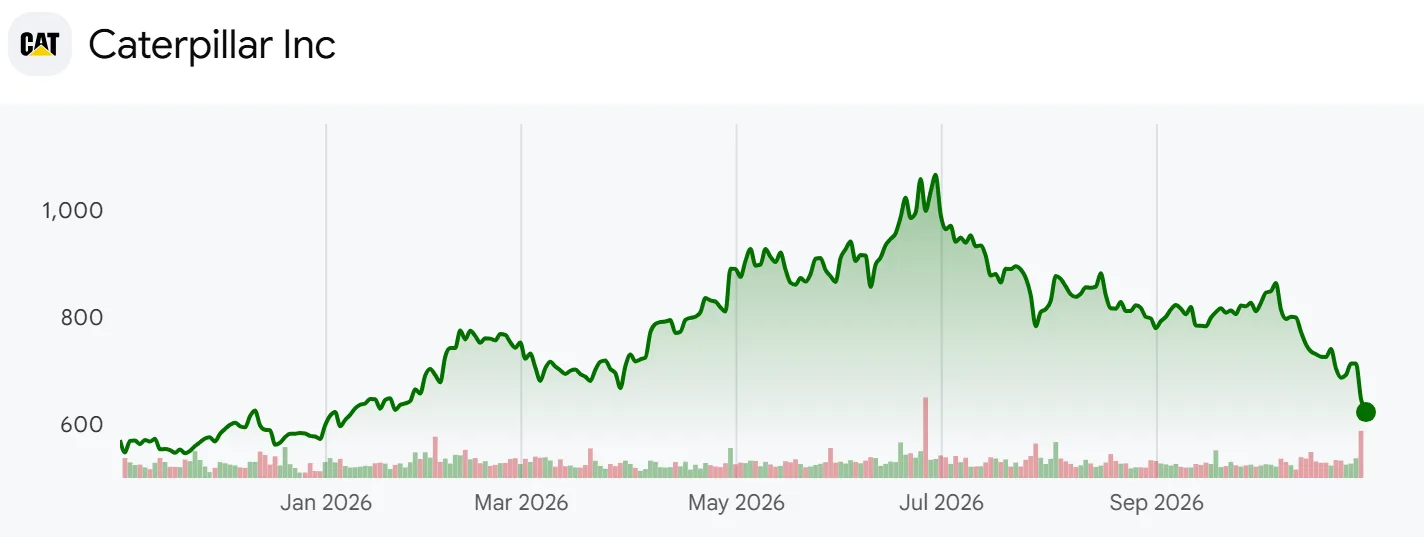
Caterpillar (NYSE: CAT) reported third-quarter 2026 sales and revenues of $20.682 billion, +17.3% on a year earlier, and a record order backlog of $78.1 billion, nearly double the $39.9 billion of a year before. The stock went the other way: the month-end close fell from $1,064.90 in June to $622.75 in October, -41.5%. Trailing earnings per share rose over the same months, so the whole decline came from a lower multiple. Two figures in the company’s own material give investors a reason for that: dealers added inventory quickly in 2026, and tariffs hold the margin near the bottom of the target range.
Caterpillar one-year share price chart
Caterpillar, based in Irving, Texas, is the largest maker of construction and mining equipment. It sells excavators and wheel loaders, giant mining trucks and locomotives, and through its Power & Energy segment it sells reciprocating engines, gas turbines and generator sets that now go into data centers. At the October month-end close the company is worth $286.26 billion on market data, and third-quarter GAAP earnings per share were $7.13.
The question is whether the numbers explain why the P/E has nearly halved despite record results. The analysis lines up the Q3 2026 earnings release, the Q3 2026 dealer retail statistics, the 28-page Q3 analyst deck, the earnings call, and the segment sales bridges and retail statistics from 23 quarterly 8-Ks since early 2021.
One caveat applies. The retail statistics come from unaudited reports dealers provide voluntarily, and construction retail is measured in price-neutral units, so it is a close but not identical yardstick to Caterpillar’s sales volume.
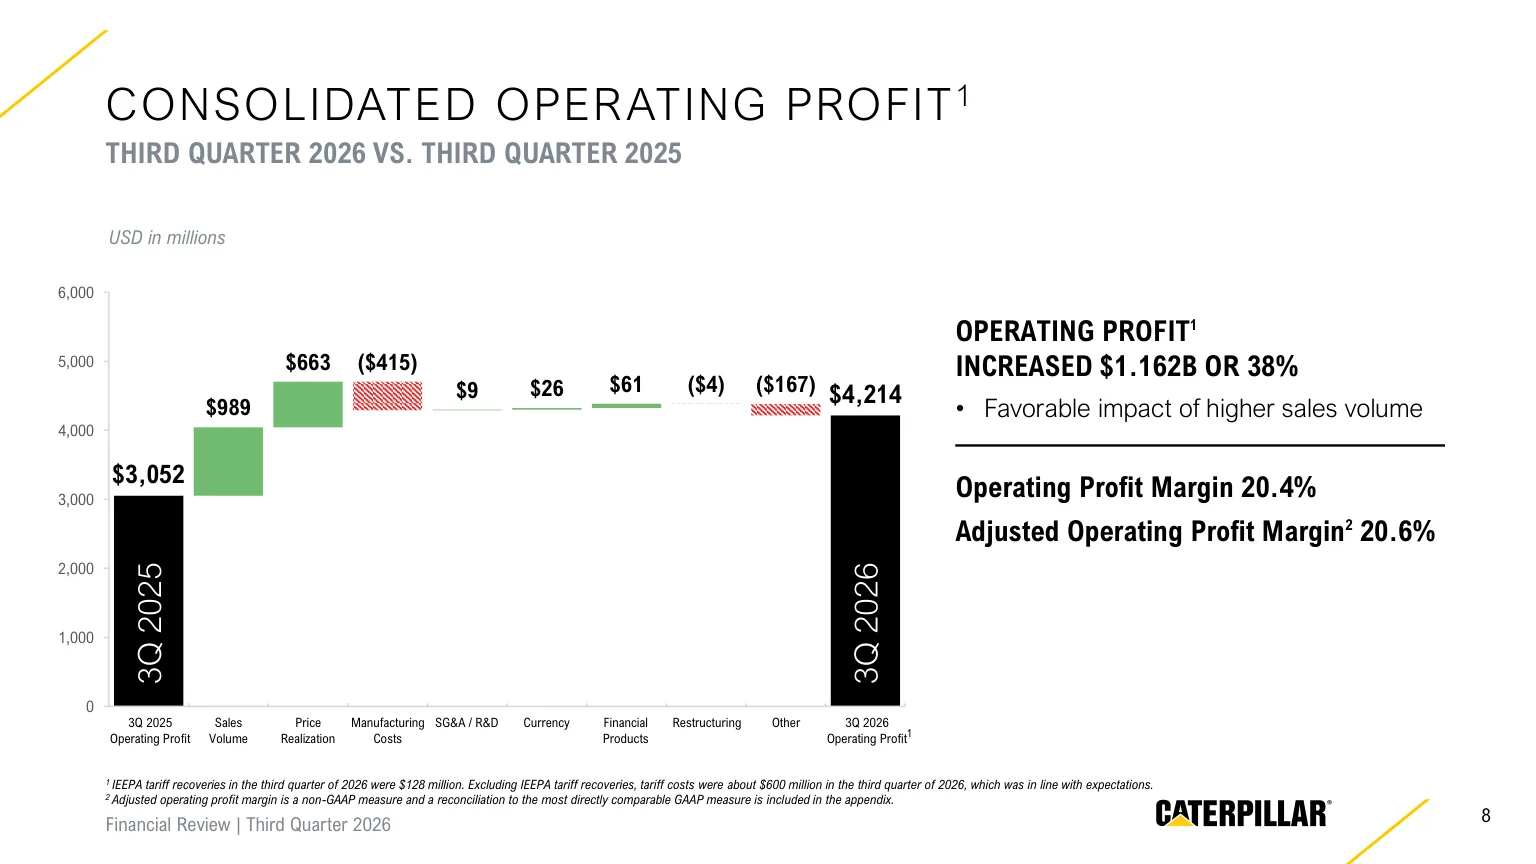
Page 8 of the deck walks operating profit from $3.052 billion a year earlier to $4.214 billion. Sales volume adds +$989 million and price realization +$663 million, while manufacturing costs take away $415 million and other items $167 million. The operating margin rose from 17.3% to 20.4%, and a footnote puts third-quarter tariff costs at about $600 million before $128 million of IEEPA tariff recoveries.
Own calculation (deck page 8): The volume and price bars together come to $1.652 billion, 1.42 times the $1.162 billion increase in operating profit. Volume and price did more than the whole gain, and manufacturing costs, which carry the tariffs, plus other items absorbed the $490 million difference.
By segment, Power & Energy sales were $8.784 billion (+17.7%) with a 24.4% segment margin, Construction Industries $7.983 billion (+18.1%) at 22.9%, and Resource Industries $4.615 billion (+15.4%) at 13.5%. The release explains higher volume in several places with the same sentence: “Higher sales volume was mainly driven by the impact from changes in dealer inventories.”
Pages 10 to 12 show segment profit up 31% in Power & Energy, 33% in Construction and 14% in Resource Industries, with the Power & Energy margin rising from 21.9% to 24.4% and the construction margin from 20.4% to 22.9%. Only Resource Industries held its margin flat, 13.6% to 13.5%, because $208 million of higher manufacturing costs almost cancelled $181 million from volume and $96 million from price. Page 9 says EPS of $7.13 includes about $0.21 a share of IEEPA recoveries; without it, adjusted EPS of $7.20 becomes about $6.99, still +41.2% on the $4.95 of a year earlier. Page 14 shows MP&E free cash flow of $3.8 billion in the quarter, $600 million more than a year before, and $7.9 billion of cash plus $1.6 billion of slightly longer-dated securities.
The Backlog and Dealer Inventory Pages
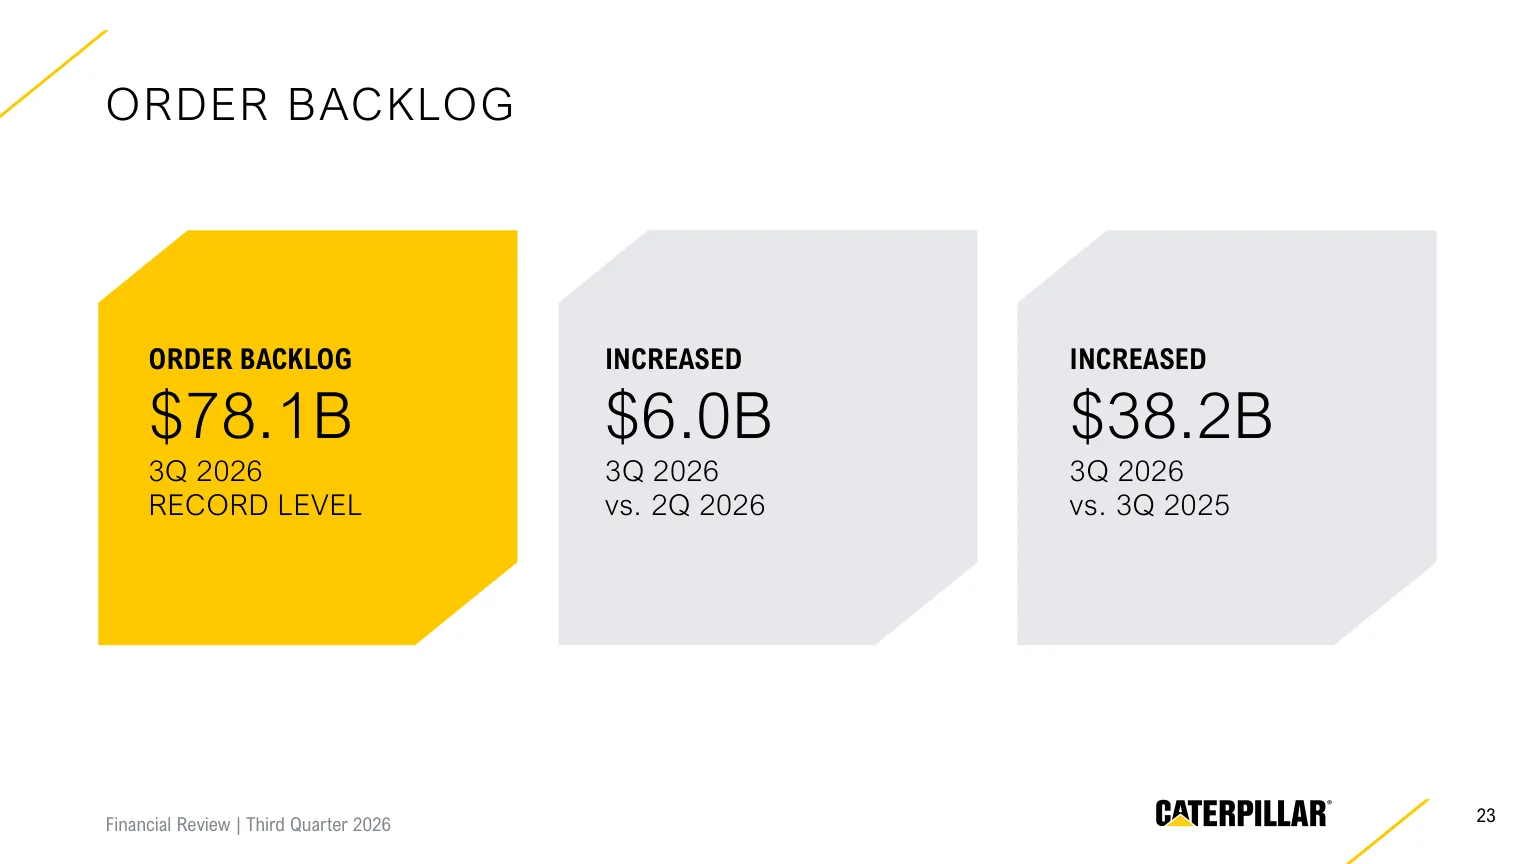
Q3 2026 deck page 23: order backlog of 78.1 billion dollars
Page 23 puts the backlog at $78.1 billion, up $6.0 billion from Q2 and $38.2 billion from a year earlier, 1.96 times the year-ago level. On the call management said 58% of it should ship within 12 months, against 59% a quarter earlier, which is about $45.3 billion, 2.2 times third-quarter sales. The backlog grew in oil and gas, power generation, Resource Industries and Construction Industries.
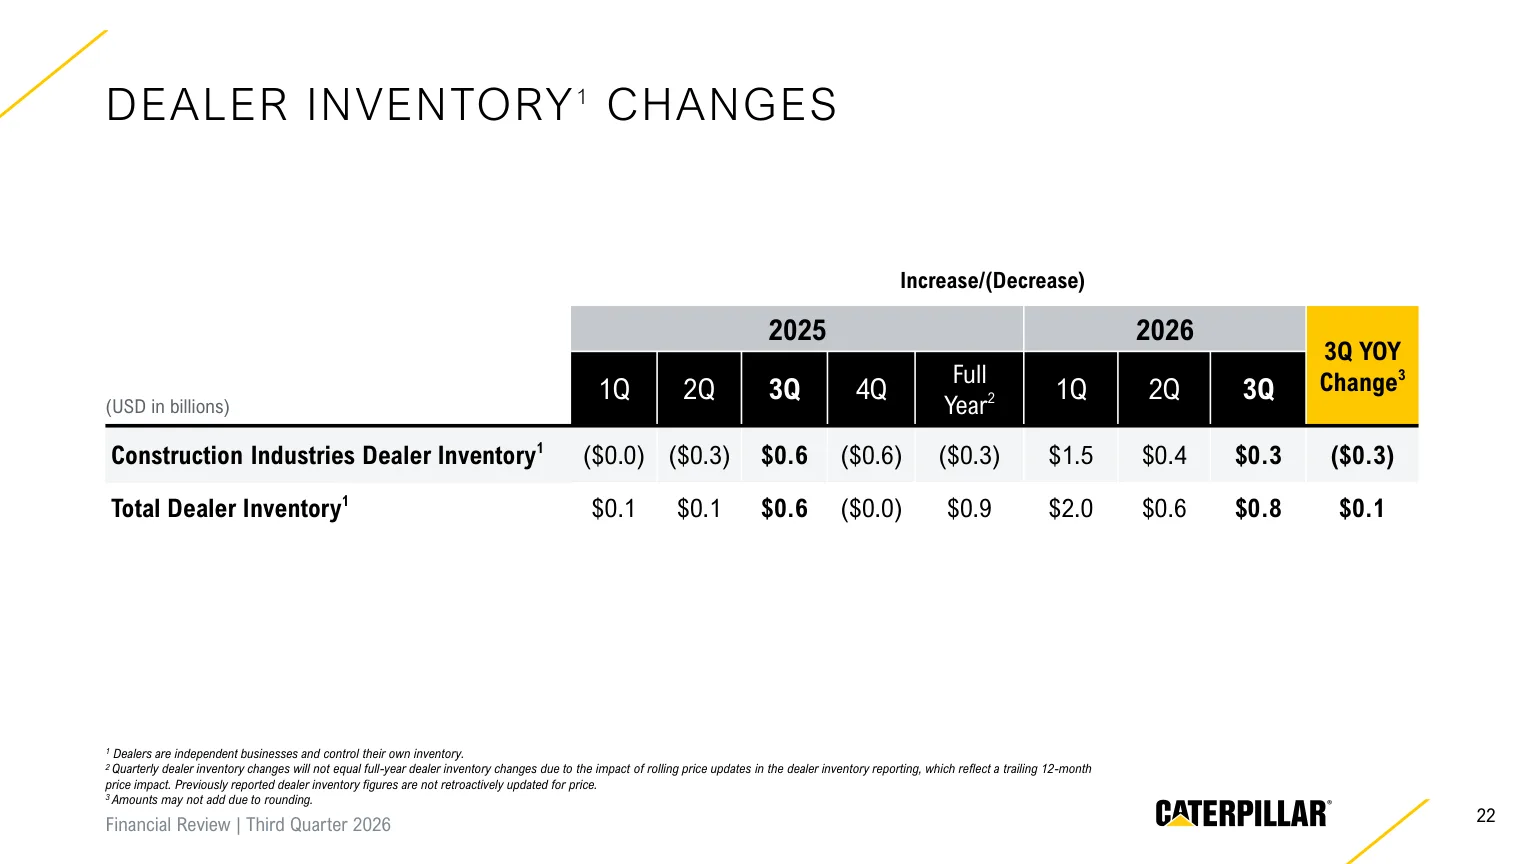
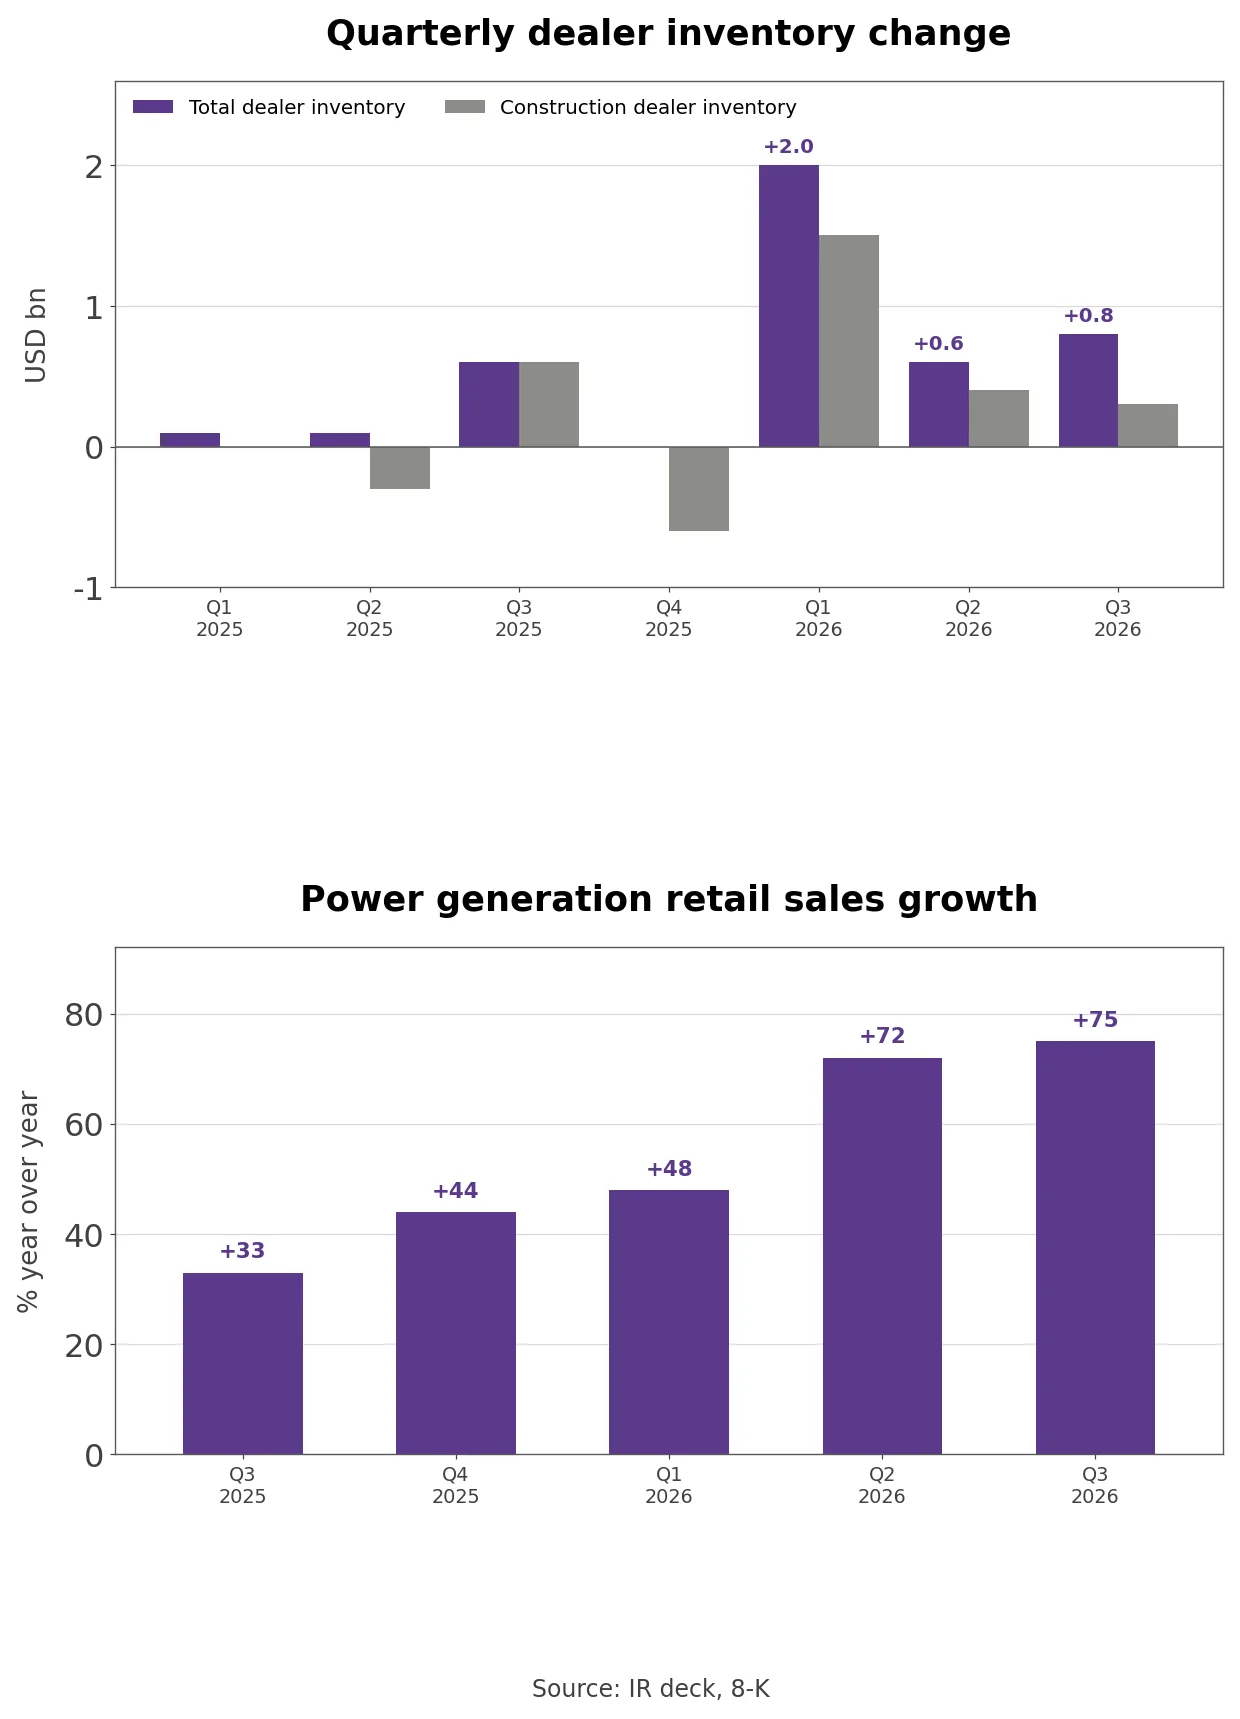
Page 22 tells the other half. Total dealer inventory rose +$2.0 billion in Q1 2026, $0.6 billion in Q2 and $0.8 billion in Q3. Dealer inventory rose $3.4 billion in the first nine months of 2026, 3.8 times the $0.9 billion added in all of 2025. Construction dealers alone added $2.2 billion, including $1.5 billion in Q1, after reducing inventory by $0.3 billion over 2025.
Company disclosure (Q3 2026 earnings call, October 29, 2026): Management expects construction dealer inventory to fall by about $1.6 billion in the fourth quarter on normal seasonality, against a $0.6 billion decline a year earlier, a year-over-year volume headwind of about $1.0 billion that leaves fourth-quarter construction volume modestly lower. It still expects year-end dealer inventory to be higher than a year ago, ahead of solid end-user demand in 2027.
Page 25 shows the adjusted operating margin target range set at the November 2025 investor day: 15% to 19% at $60 billion of sales, 18% to 22% at $72 billion and 21% to 25% at $100 billion. Page 16 keeps 2026 sales growth in the mid-to-high teens on 2025’s $67.6 billion, with the adjusted margin near the bottom of the range excluding IEEPA recoveries, tariff costs of around $2.2 billion and MP&E free cash flow in the top half of its $6 billion to $15 billion target.
Own calculation (deck pages 16 and 25): Mid-to-high-teens growth on $67.6 billion gives $77.7 billion to $80.4 billion, and at the $79.1 billion midpoint the range runs from about 18.8% to 22.8%. Tariffs of $2.2 billion equal 2.8 percentage points of that revenue, so adding them back to the bottom of the range gives 21.5%, above the 20.8% middle. Chief executive Joe Creed said on the call that he wants to run the business at the middle of the range. Page 24 adds about $3.3 billion of 2026 MP&E capital expenditure and about $300 million of restructuring costs, and the capacity build behind that spending will add depreciation from 2027.
The Bull and Bear Case for Caterpillar Stock
The bull case is orders. The backlog doubled in a year and power generation retail sales rose 75% in the third quarter. Without tariffs the margin would already sit above the middle of the target range, and $2.0 billion of the quarter’s $3.8 billion of MP&E free cash flow went back to shareholders. Gas turbines and large engines also carry decades of service revenue after the sale.
The bear case is the quality of 2026 growth. Construction sales ran ahead of end-user sales and dealers absorbed $3.4 billion of inventory, part of which reverses in the fourth quarter. The P/E has come down from 45.84 in June but at 24.44 it still sits well above the 59-month median of 17.04, a multiple that assumes data center demand outweighs the dealer cycle the equipment business has always had.
From the 2020 Low to the Data Center Power Boom
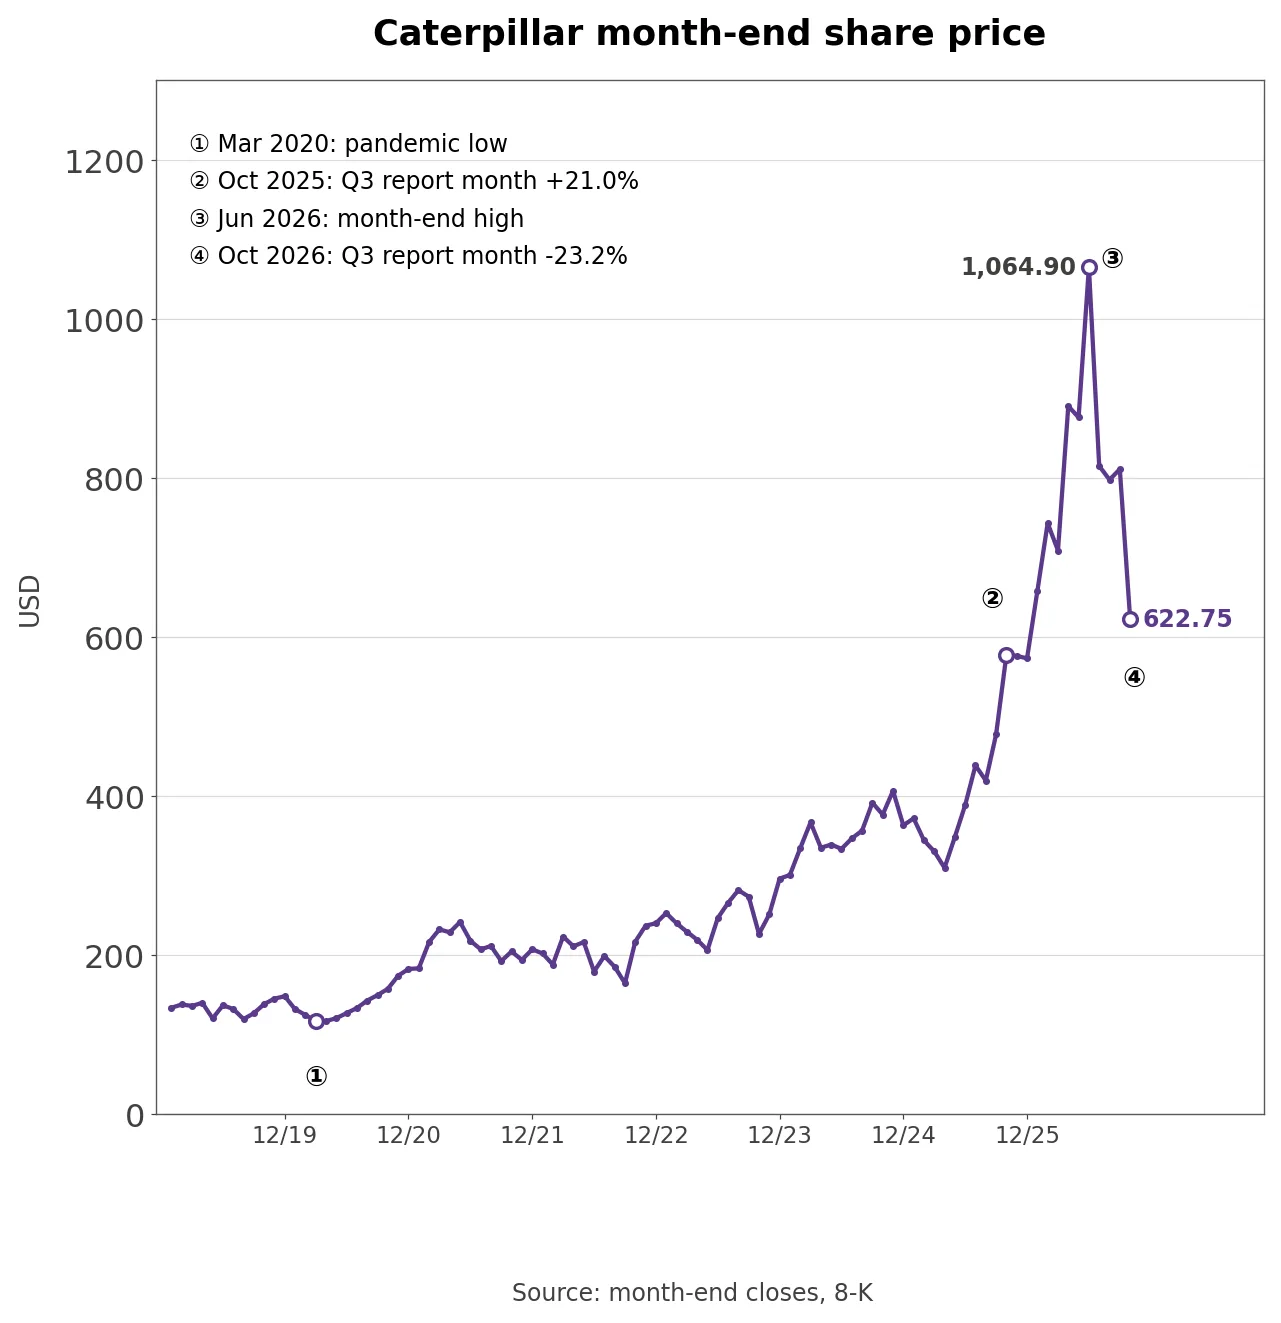
Caterpillar month-end share price over 94 months with four dates
Caterpillar’s month-end close bottomed at $116.04 in March 2020 and reached $362.76 by the end of 2024, rising and falling with construction and mining cycles. From $309.27 in April 2025 the pattern changed as data center generator demand reached the results, and the stock gained +21.0% in October 2025, the month of the third-quarter report. Full-year 2025 sales of $67.6 billion were only 4.3% above 2024’s $64.8 billion, and construction price realization was negative in every quarter of 2025, yet the stock priced in power orders before revenue.
From April 2025 the month-end close reached $1,064.90 in June 2026, 3.4 times higher in 14 months. It then fell -23.5% in July and -23.2% in October, the month of this year’s third-quarter report. A year earlier the report month brought a gain; this time record results brought a decline.
How Much of the Drop Came From the Multiple?
Own calculation (month-end prices, 10-Qs and the Q3 release): The 41.5% fall from the June month-end close of $1,064.90 to $622.75 in October is the product of a 9.7% rise in trailing EPS and a 46.7% drop in the P/E. Trailing four-quarter EPS went from $23.23 to $25.48 while the P/E went from 45.84 to 24.44.
Earnings did not turn down. Quarterly EPS was $4.20, $4.62, $4.88 and $5.11 through 2025, then $5.47, $7.77 and $7.13 in the first three quarters of 2026, with Q2 and Q3 up 68% and 46% on a year earlier. What the market took back was the assumption that this growth rate carries into 2027 and beyond, and the dealer inventory data is what tests that assumption.
Construction Volume Against Dealer Retail Sales
Caterpillar sells most of its machines to independent dealers, who resell them to end users. Its own explanation of the retail statistics is that they help readers understand the business “particularly in light of the time delay between Caterpillar’s sales to dealers and dealers’ sales to end users.” When dealers restock, Caterpillar’s sales run ahead of end-user sales; when they destock, sales lag.
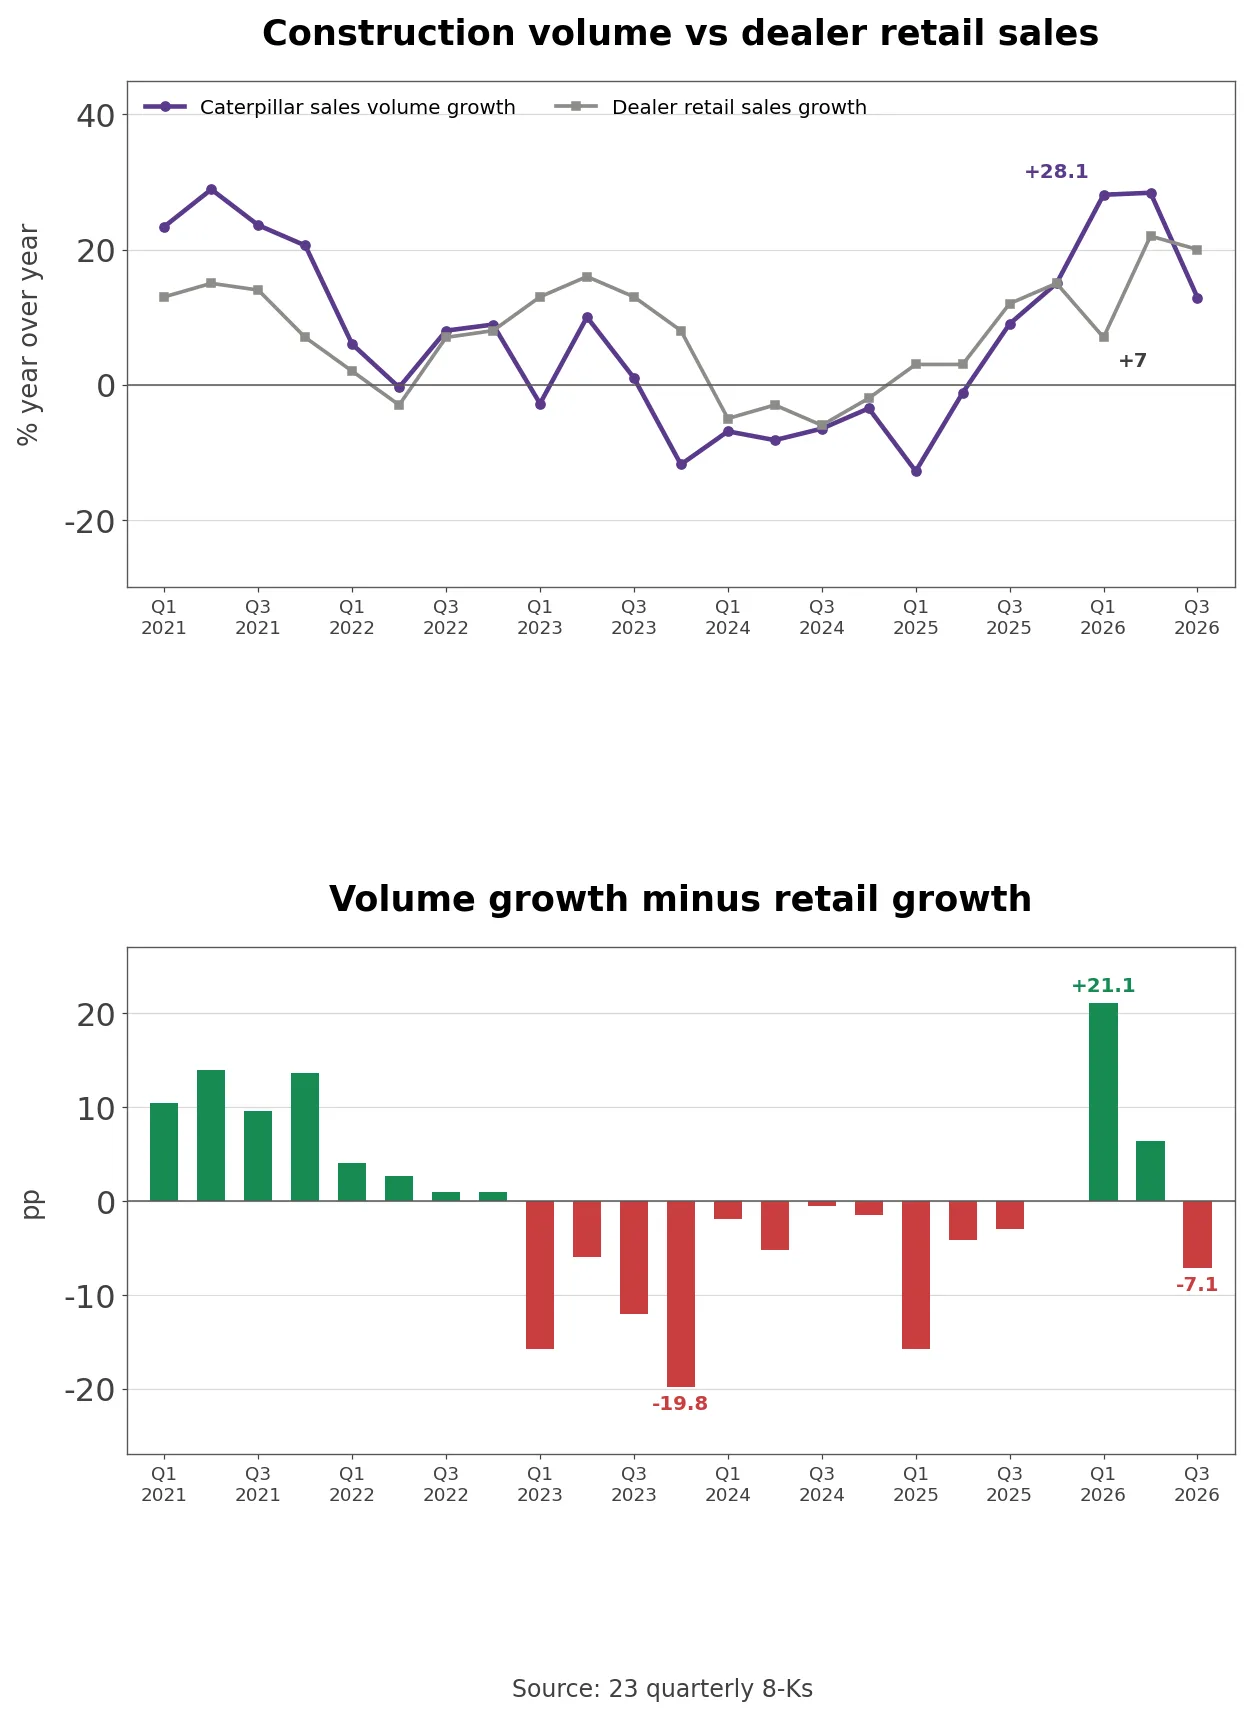
Own calculation (23 quarterly 8-Ks): Dividing the sales volume bar in each quarter’s segment bridge by year-earlier sales gives construction volume growth, which can be set beside construction retail growth for the same quarter from Q1 2021. In Q1 2026 construction sales volume grew 28.1% while dealer retail sales grew 7%, a gap of 21.1 percentage points.
Construction sales volume growth against dealer retail sales growth over 23 quarters
Across 23 quarters the gap traces a clear cycle. It averaged +11.9 points in 2021 as dealers rebuilt after the pandemic and -13.4 points in 2023 as they destocked. In 2026 it hit +21.1 points in Q1, the largest of the 23 quarters, then +6.4 points in Q2 and -7.1 points in Q3. The four quarters of 2025 had run -15.8, -4.2, -3.0 and 0.0 points, so the 2026 restocking came right after a destocking phase.
The dealer inventory page tells the same story. Construction dealer inventory of $1.5 billion in Q1 is close to that quarter’s $1.459 billion construction volume bar. Multiplying the 21.1-point gap by year-earlier Q1 construction sales of $5.184 billion gives about $1.09 billion, 73% of the $1.5 billion inventory build, from the retail data alone. Two independent sources point the same way: part of 2026’s $23.49 billion of nine-month construction sales, up 29.5%, went into dealer yards, and the $1.6 billion seasonal decline in Q4 is the first unwinding.
Resource Industries showed the same shape in Q3. Its volume bar of $478 million was 12.0% of year-earlier sales while its retail sales rose 4%, a gap of 8.0 points, and the release again attributed higher mining and quarry equipment sales to dealer inventory changes.
How Caterpillar Makes Money Across Three Segments
Power & Energy sells reciprocating generator sets, Solar Turbines gas turbines and compressors, oil and gas engines, and marine and industrial engines. It was the largest segment in Q3 with $8.784 billion of sales and $2.143 billion of profit, and the release says power generation growth came mainly from turbines and large reciprocating engines for data centers.
The September 2026 Power & Energy investor materials split 2025 external sales into power generation 43%, oil and gas 32% and industrial 25%. The power products run from reciprocating engines up to 10MW to gas turbines of 1MW to 39MW, and engines once sold as diesel backup for data centers now also serve as primary power. The same materials say primary power installations generate more than 40 times the services revenue of backup units and that gas turbines bring 30 to 40 years of service work, which turns one-off equipment sales into long-lived parts and service income.
Quarterly dealer inventory changes and power generation retail sales growth
Power generation retail growth climbed for five quarters in a row: 33% in Q3 2025, 44% in Q4, 48% in Q1 2026, 72% in Q2 and +75% in Q3. Oil and gas retail slowed from 36% in Q4 2025 to 5%, and industrial from 14% to -3%, so power generation is carrying the segment while the other 57% of its sales cools. On the call management said orders run to 2029 for large reciprocating engines and 2030 for turbines, with some production slots still open. While orders sit ahead of capacity, how fast capacity grows sets the ceiling on this segment’s sales.
Construction regained pricing power in 2026. The $454 million rise in Q3 construction profit came from $356 million of volume and $349 million of price. The price bar in the construction bridge was negative in all four quarters of 2025 (-$355 million, -$459 million, -$262 million and -$60 million) and turned positive at +$356 million, +$309 million and +$349 million in 2026, consistent with dealers buying back in at higher prices after a year of destocking.
Construction retail sales rose 27% in North America, 13% in Latin America, 16% in Europe, Africa and the Middle East and fell 2% in Asia/Pacific. North American construction retail accelerated from 11% in Q3 2025 to 27% in Q2 and Q3 2026, so end demand did strengthen. North America supplied $12.017 billion, or 58.1%, of total Q3 sales and revenues, up 24%, while Asia/Pacific fell 2% with a weaker yen.
Resource Industries sells mining trucks, large excavation equipment and locomotives, with rail moved over from Power & Energy, and had the lowest Q3 margin at 13.5%. Mining, heavy construction and quarry retail rose 8% while rail fell 70%. The company is expanding autonomous hauling from a Virginia quarry pilot, where autonomous trucks have moved more than 3.5 million tons since November 2024, to two more sites. Cat Financial earned $264 million on $1.028 billion of revenues in Q3, financing both dealers and customers.
Caterpillar vs Deere Cummins and CNH
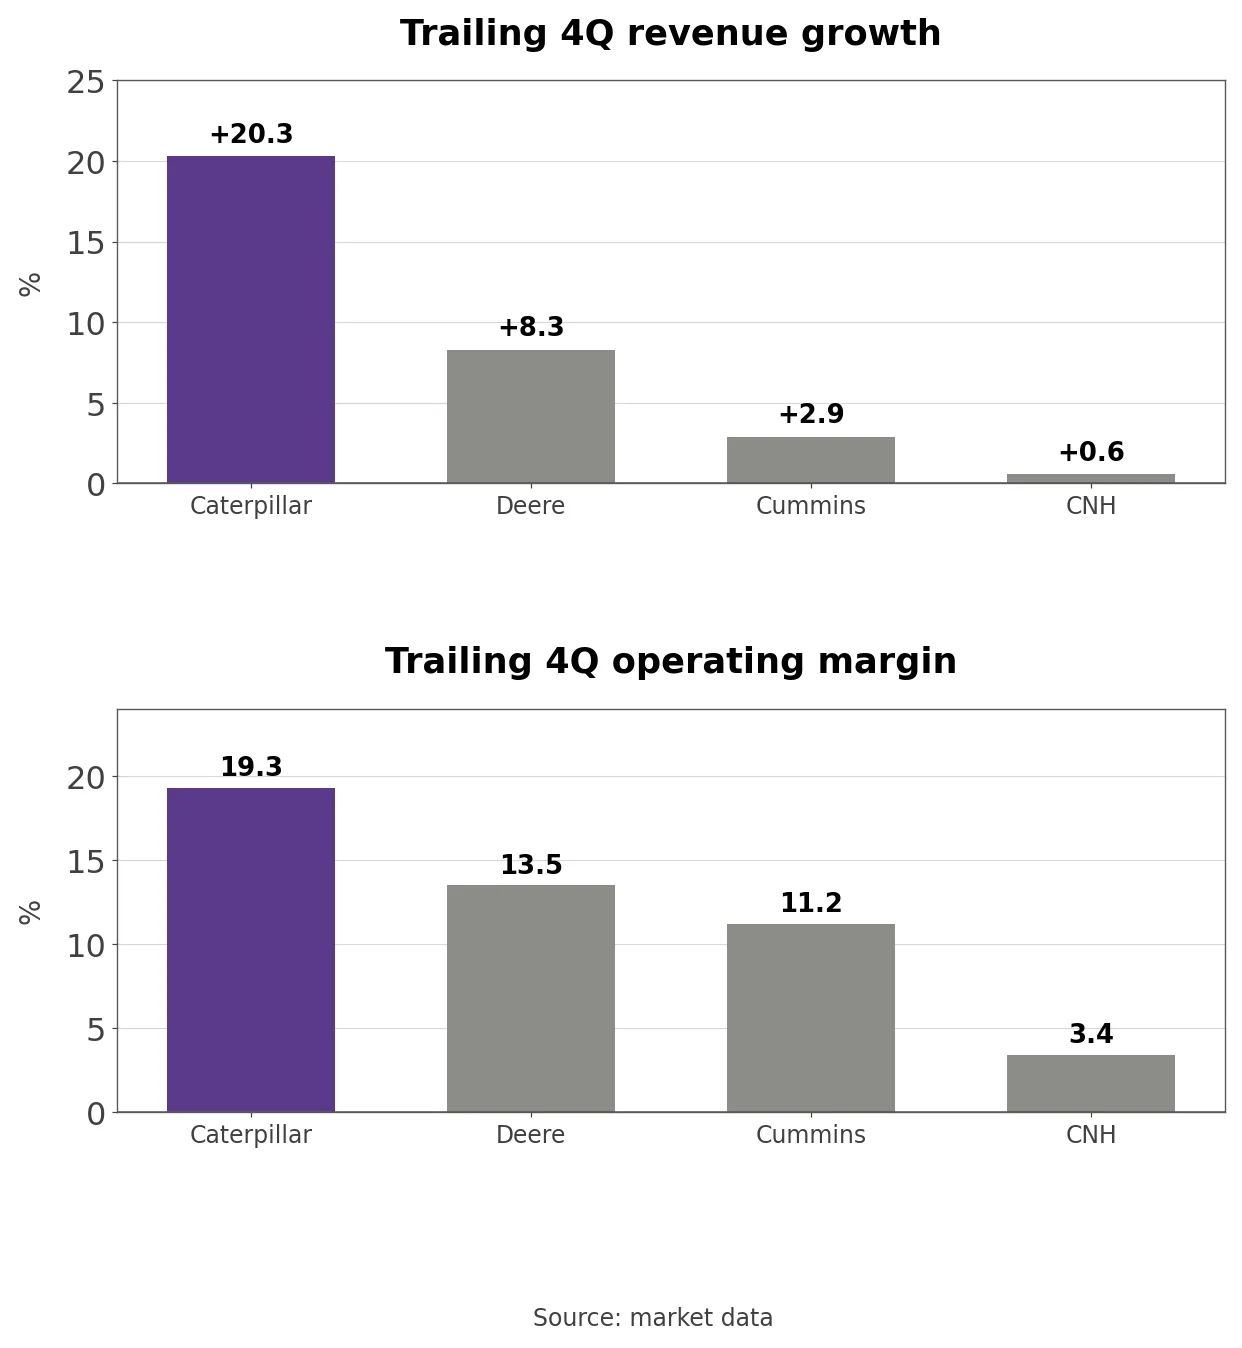
Revenue growth and operating margin at Caterpillar Deere Cummins and CNH
Trailing four-quarter revenue growth was fastest at Caterpillar, +20.3%, against +8.3% at Deere, +2.9% at Cummins and +0.6% at CNH, and its 19.3% trailing operating margin on market data also led Deere’s 13.5%, Cummins’ 11.2% and CNH’s 3.4%. The comparison runs through the September quarter for Caterpillar, the August quarter for Deere and the June quarter for Cummins and CNH. Cummins is the closest peer to Power & Energy, and its 2.9% revenue growth against that segment’s 17.7% shows how much more of the data center demand went to the company with both large engines and gas turbines.
Forward P/E and dividend yield at Caterpillar Deere Cummins and CNH
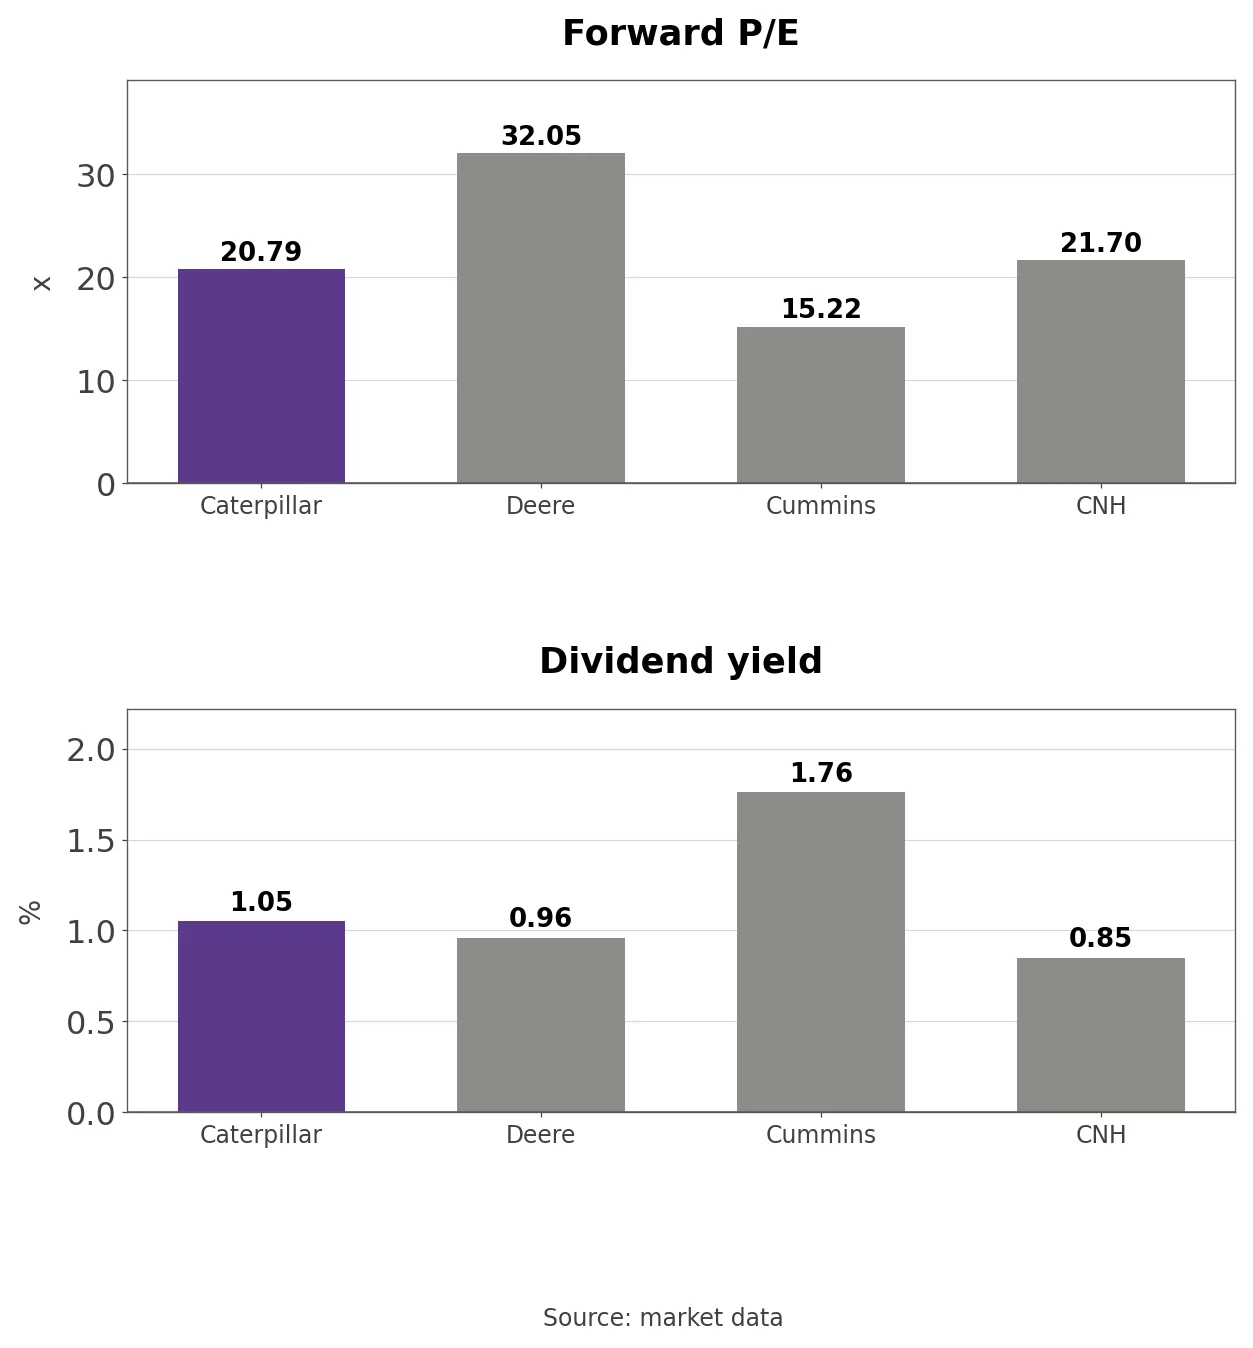
The multiples do not follow growth. Forward P/E is 20.79 at Caterpillar, below Deere’s 32.05 and CNH’s 21.70 and above Cummins’ 15.22. The dividend yield is 1.05%, but on payout Caterpillar spent $1.2 billion on buybacks in Q3, 1.7 times its $0.7 billion of dividends. Market value rose only 4.4% over the past year at Caterpillar against 42.3% at Deere, which means most of 2025’s gain has been given back.
The P/E and Price-to-Sales Band
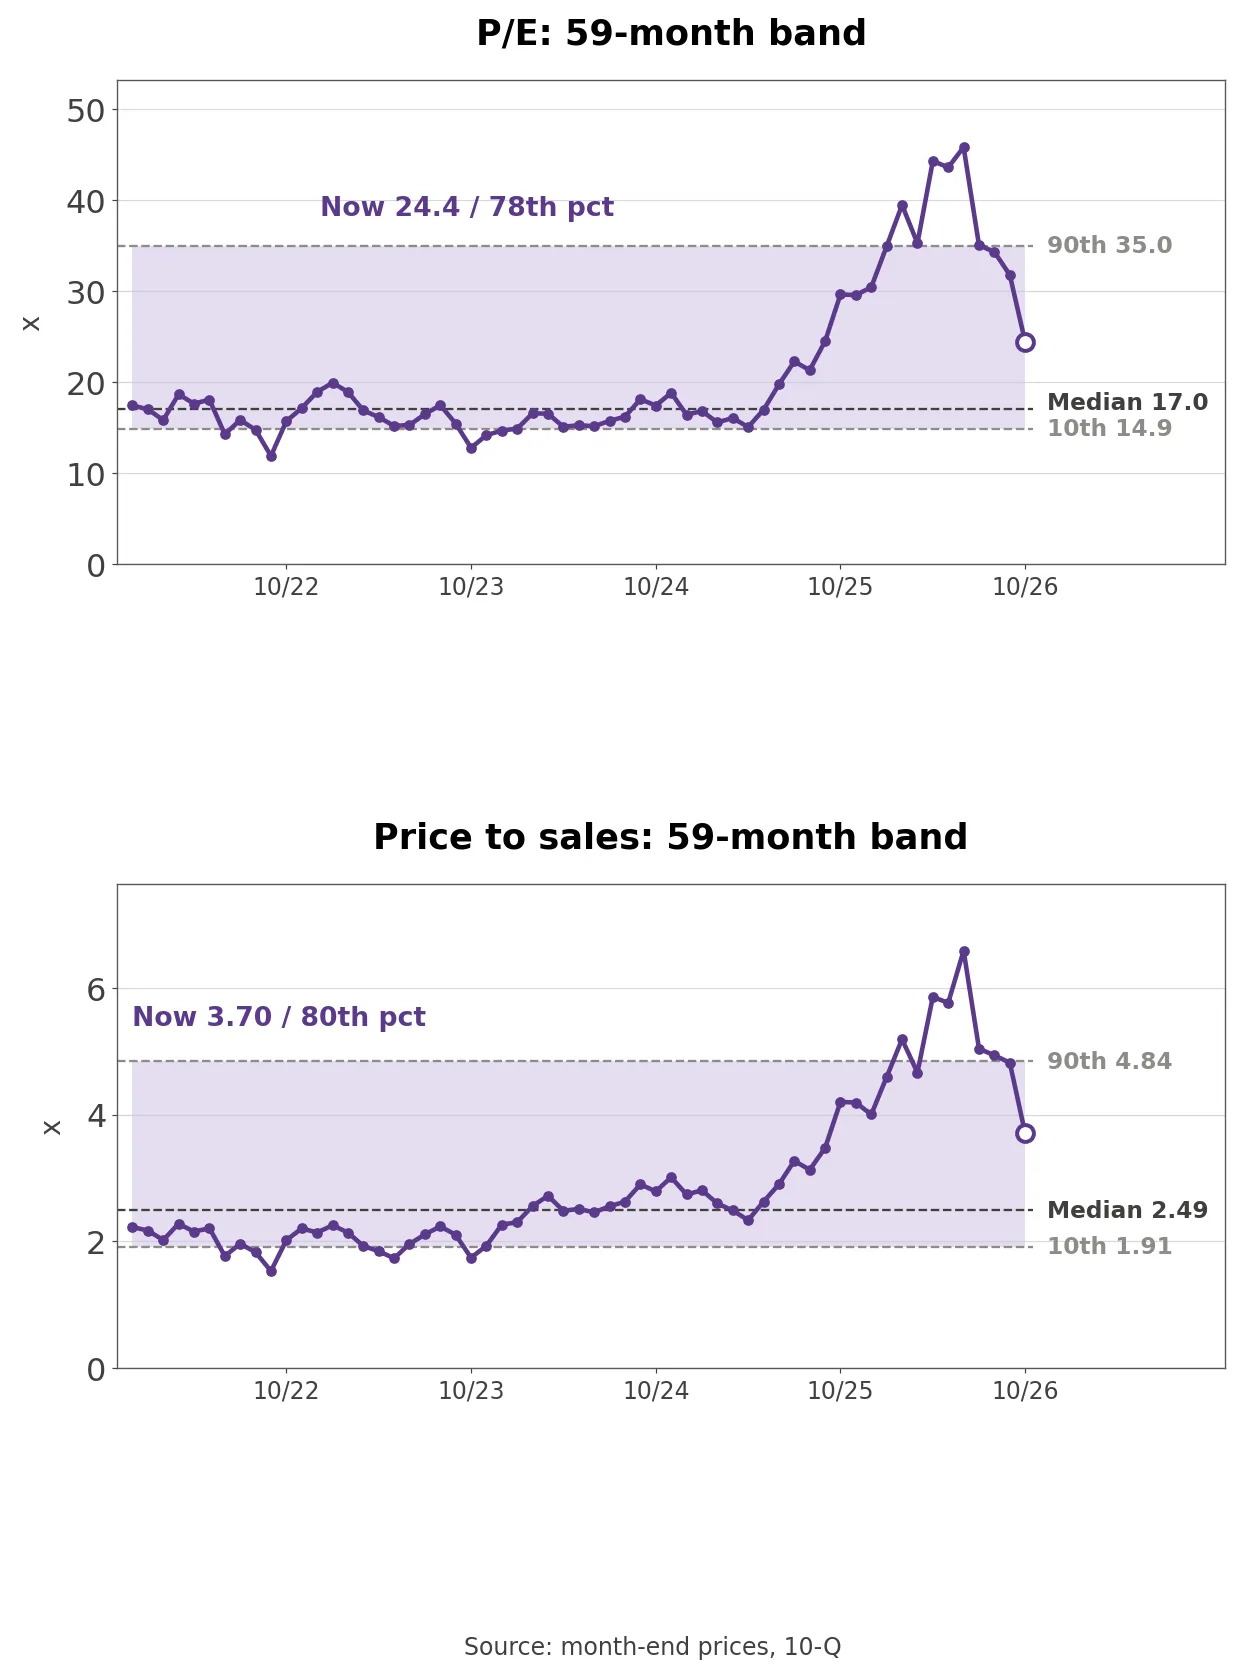
Caterpillar P/E and price to sales over 59 months
Own calculation (month-end prices, 10-Qs and the Q3 release): The month-end price over the trailing four quarters of diluted EPS ($25.48) gives a P/E of 24.44, above the 59-month median of 17.04 and below the 90th percentile of 34.98. Market value over trailing revenue of $77.77 billion gives price to sales of 3.70, also above the 2.49 median and at the 79.7th percentile.
From December 2021 to mid-2025 the P/E mostly sat between 12 and 20, with a low of 11.92 in September 2022, and price to sales stayed around 2 before reaching 6.59 in June 2026. The 45.84 P/E of June 2026 was the point where data center power demand lifted an equipment maker to a growth-stock multiple; 24.44 gives back nearly half of it. Dividing the price by the 20.79 forward P/E implies expected EPS of about $29.95 over the next 12 months, +17.6% on the trailing $25.48, growth that has to come without a repeat of Q1 2026’s dealer restocking.
Three Conditions That Move the Stock
Dealer inventory is the first test. Management expects construction dealer inventory to fall about $1.6 billion in the fourth quarter. A larger decline, or no rebuild in Q1 2027, would leave the volume-retail gap negative for longer as in 2023 and weigh on the stock, while higher year-end inventory alongside steady end-user sales would support it.
Power generation retail growth reached 75% in Q3 after five quarters of acceleration. With 58% of the $78.1 billion backlog due within a year, the quarter when that growth rate turns will set the multiple’s next direction, and holding near 75% would support the stock.
The adjusted operating margin stays tied to the bottom of the range while tariffs persist. Fourth-quarter tariff costs are expected at about $600 million, roughly $200 million lower than a year earlier; moving toward the middle of the range as tariffs ease would support the stock, while freight and growth investment eating that relief would weigh on it.
What to Watch in the Q4 Report
The fourth-quarter report is scheduled for February 2, 2027, with the retail statistics filed the same day. Management expects moderate sales growth, an adjusted operating margin above the year-ago 15.6%, strong Resource Industries sales and modestly lower construction volume. Three numbers will matter: the size of the Q4 construction dealer inventory decline, the gap between construction volume and retail growth, and power generation retail growth. The open question is whether end demand can absorb the 21.1 points pulled into Q1 2026: will construction retail sales run ahead of sales volume in early 2027?