At $324.14, FedEx (NYSE: FDX) trades at 9.23 times trailing GAAP earnings, one of the cheapest readings in five years, and at 18.16 times trailing adjusted earnings, one of the most expensive. The gap comes from the 19.9% stake FedEx kept when it spun off FedEx Freight on June 1. The stake sits on the books with no cost basis, so its entire fair value has flowed through income, and that is why 2026 GAAP EPS guidance of $35.30 to $35.90 is nearly twice adjusted EPS guidance of $18.00 to $18.60. Third-quarter adjusted EPS was $3.74, +27.6% from a year earlier, but only about six-tenths of that gain came from operations. A lower tax rate and lower interest expense supplied the rest.
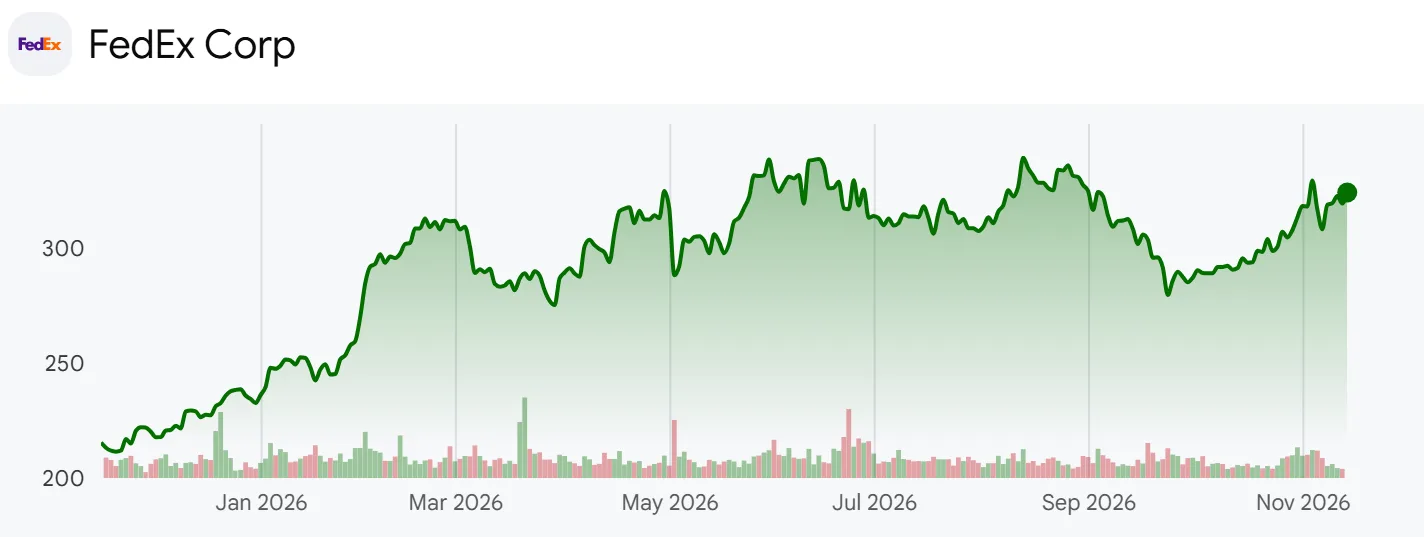
FedEx one-year share price chart
FedEx is the Memphis-based parcel and express company. U.S. domestic parcels (priority, deferred and ground) bring in about two-thirds of revenue, and international express, air freight and customs brokerage make up the rest. The market value is about $75.9 billion. In 2026 the company moved its fiscal year end from May to December, separated its less-than-truckload freight business, and on October 1 sold its supply chain unit to CMA CGM for $1.4 billion.
I worked through the third-quarter 10-Q, two recast exhibits filed after the spin-off, 24 earnings releases since 2020, the third-quarter slides and the October 28 call. One question remains: how much of an $18 adjusted EPS comes from running the network, and how much from the lines below operating income?
Two limits apply. Pre-spin numbers include Freight while post-spin numbers are continuing operations. Because of the fiscal year change, June 2026 was reported as a one-month transition period, and the third quarter now means July through September.
What Slide 20 Says About June and the Raised Guidance
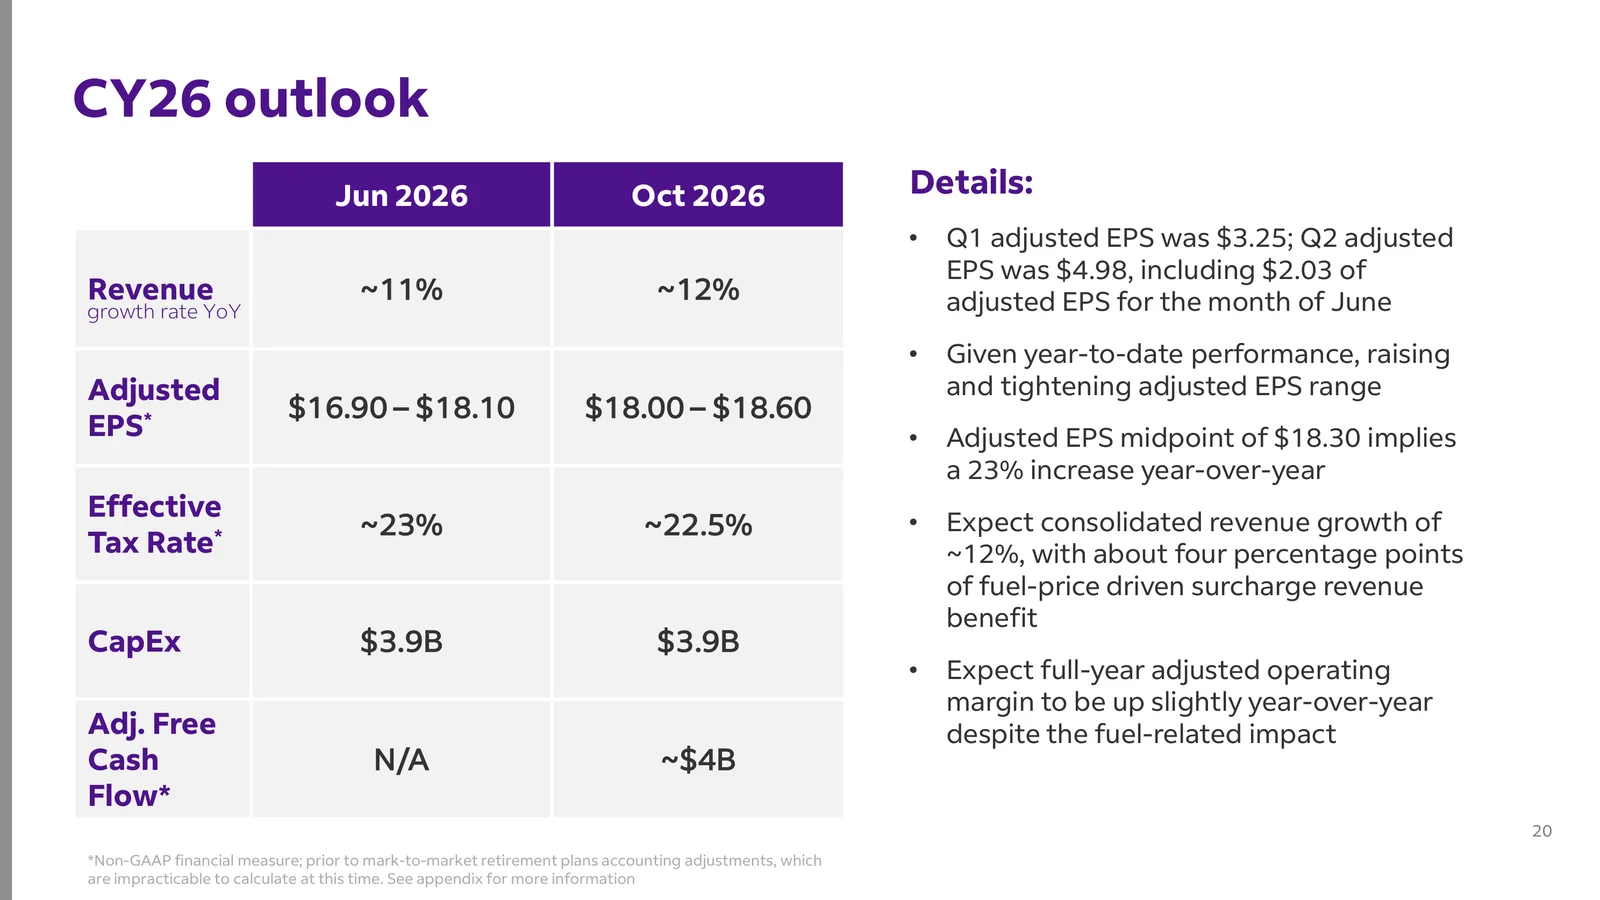
Q3 CY2026 earnings slide 20 with 2026 adjusted EPS guidance of 18.00 to 18.60
Slide 20 of the third-quarter deck raises 2026 adjusted EPS guidance from $16.90 to $18.10 in June to $18.00 to $18.60 and narrows the range. Revenue growth moves from about 11% to about 12%, and the tax rate from about 23% to about 22.5%. The $18.30 midpoint is +23.4% above 2025 adjusted EPS of $14.83. The same slide notes that second-quarter adjusted EPS of $4.98 included $2.03 from the month of June alone.
That is one month producing 54.3% of what the entire third quarter earned ($3.74). Note 13 of the 10-Q gives the one-month income statement: June operating income was $544 million, 3.5 times the $157 million of June 2025, and the operating margin on $7.787 billion of June revenue was 7.0%, above the third quarter’s 5.3% adjusted margin. Interim CFO Claude Russ explained the month on the call as “supported by one extra operating day and healthy U.S. Domestic demand helped in part by a timing shift from July in sales by retailers.” Part of July’s volume showed up in June.
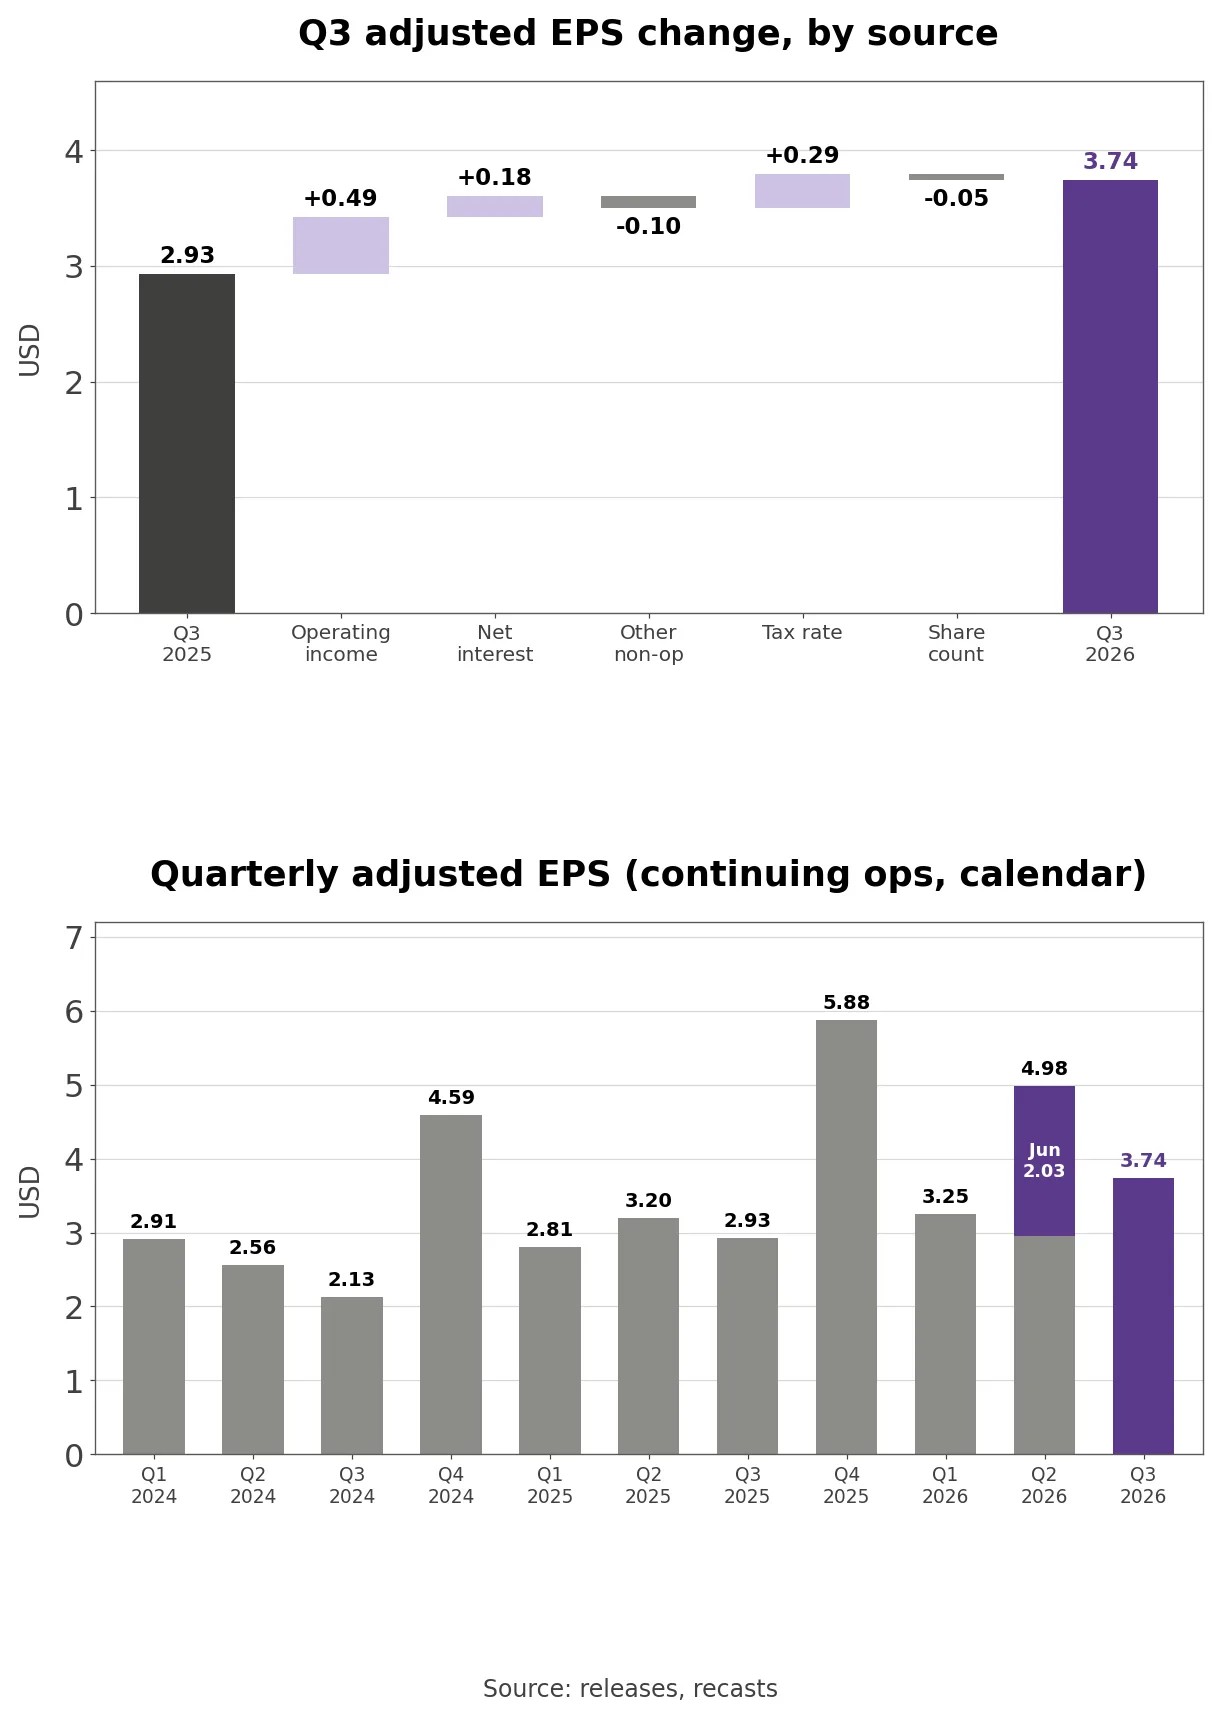
Measured against the same quarter a year earlier, adjusted EPS grew +15.7% in the first quarter, +55.6% in the second quarter that holds June, and +27.6% in the third. The fourth-quarter range embedded in guidance is $6.03 to $6.63, against $5.88 a year earlier, which works out to +2.6% to +12.8%. At the midpoint that is +7.7%, well below the +23.4% for the full year. The $0.80 increase in the guidance midpoint since June came from quarters that are already reported, and the quarter still ahead carries the slowest growth of the year.
Slide 22 expects the fourth-quarter U.S. Domestic adjusted margin to slip on purchased transportation, fuel and temporary costs while International expands, on about 238 million shares. At the $6.33 midpoint that is about $1.507 billion of adjusted net income, +8.1% above the $1.394 billion of a year earlier.
Slide 20 also adds adjusted free cash flow of about $4 billion. Slide 28 gets there from $5.48 billion of free cash flow by adding back pension contributions and subtracting $2 billion of IEEPA tariff refunds FedEx owes to customers.
Company disclosure (Q3 slides, October 28, 2026): Fuel-price-driven surcharges account for about four percentage points of the roughly 12% revenue growth expected for 2026.
Slide 21 Shows Where the Yield Gains Went
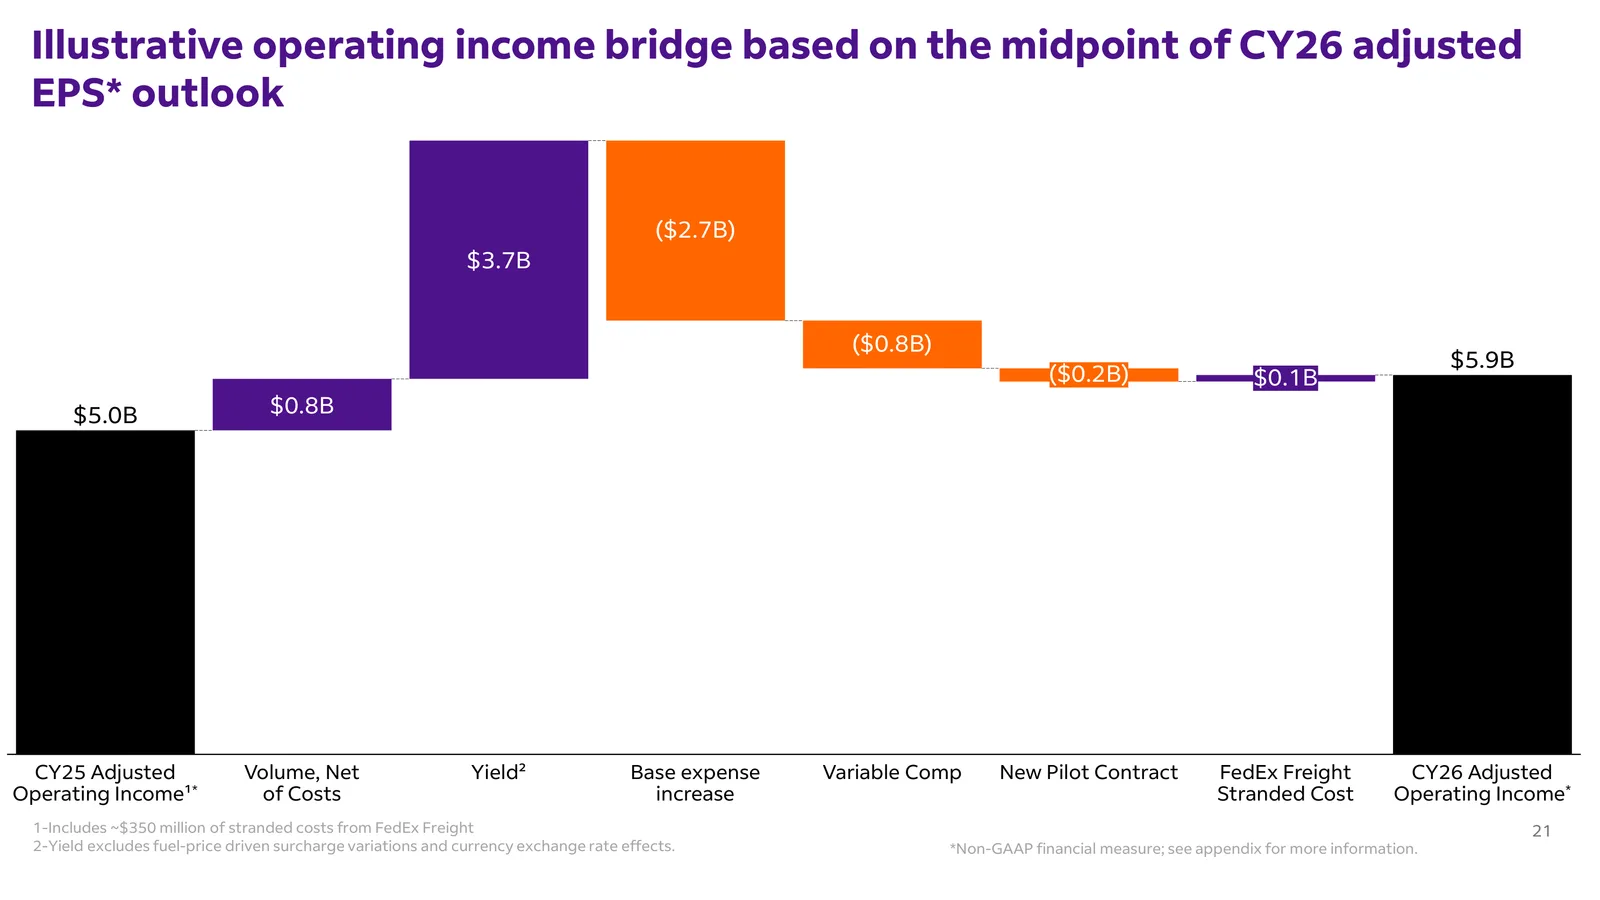
Earnings slide 21 bridging 2025 adjusted operating income of 5.0 billion to 5.9 billion
Slide 21 bridges 2025 adjusted operating income of $5.0 billion to $5.9 billion in 2026. Yield adds $3.7 billion and volume, net of costs, adds $0.8 billion. Base expense growth takes away $2.7 billion, variable compensation $0.8 billion and the new pilot contract $0.2 billion. Removing stranded costs left behind by Freight adds back $0.1 billion.
Base expense growth consumed 73.0% of the $3.7 billion yield gain, and adding variable compensation brings that to 94.6%. Operating income rises from $5.01 billion to $5.9 billion, +17.8%, while adjusted EPS guidance rises +23.4%. The difference comes from below operating income, in interest and taxes.
On the call, $100 million of the $200 million pilot headwind and $75 million of the $800 million variable compensation headwind landed in the third quarter. The pilot contract is a fixed cost that carries into 2027. This year’s bridge adds $900 million of operating income, more than the roughly $700 million a year needed for the 2029 goal, but only because yields did the work.
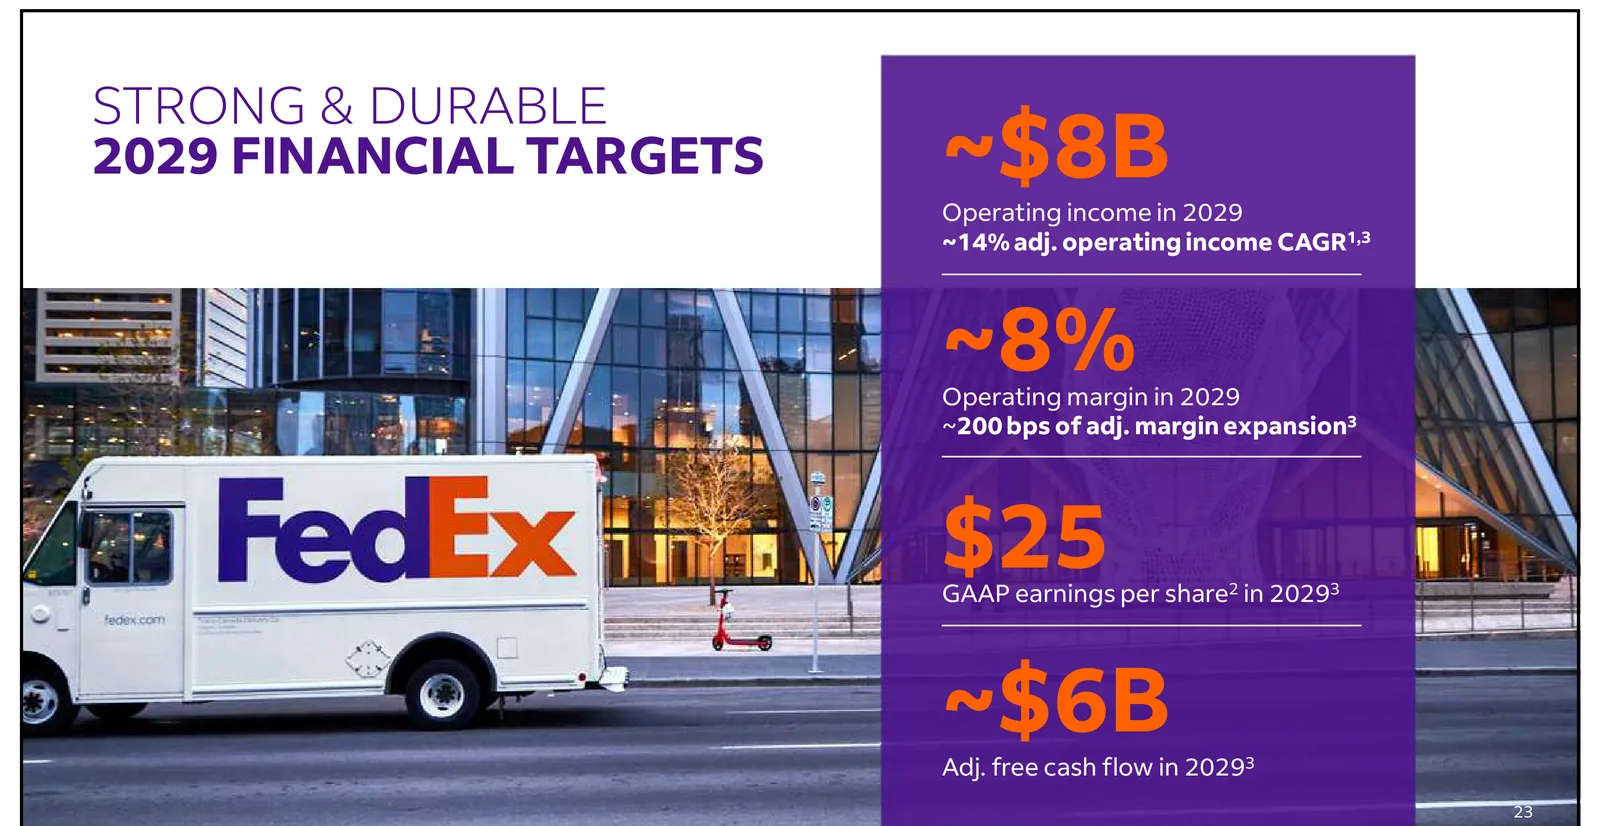
Roadshow slide with 2029 targets of about 8 billion operating income and 25 GAAP EPS
The roadshow deck repeats the 2029 targets from the February 12 investor day: about $8 billion of operating income, an operating margin of about 8%, GAAP EPS of $25 and about $6 billion of adjusted free cash flow. Getting from $5.9 billion of adjusted operating income in 2026 to $8 billion requires +10.7% a year for three years, and getting from $18.30 of adjusted EPS to $25 requires +11.0% a year.
The revenue assumption behind those targets is $85 billion for fiscal 2026 excluding Freight, rising about 4% a year to $98 billion in 2029. At an 8% margin, $98 billion produces $7.84 billion of operating income, close to the $8 billion goal. With revenue growing only 4% a year, the margin has to rise every year through Network 2.0 savings and the European restructuring. On the call, management said Europe should add $650 million to International adjusted operating income by the end of 2029.
The $25 GAAP EPS target sits 29.8% below the 2026 GAAP guidance midpoint of $35.60. The target was set in February, before the spin-off created a stake to mark to market, so it contains no such gains. The company’s own target treats 2026 GAAP EPS as a one-year number.
The Bull and Bear Case After the Spin-Off
The bull case rests on yields and international. U.S. domestic composite package yield rose +7.3% and international composite package yield +17.3%, and International adjusted operating income grew +51.5%. It has $4.3 billion of buyback authorization left.
The bear case is earnings quality. A lower tax rate produced 35.5% of the third-quarter adjusted EPS gain. Lower interest expense came from bonds bought back with a roughly $4.1 billion dividend that Freight paid FedEx just before the spin. GAAP EPS now moves by hundreds of millions of dollars a quarter with the share price of a different company, FedEx Freight (FDXF). The stock is priced off adjusted EPS, and on that measure it sits near the top of its five-year range.
From a 2022 Profit Warning to the Freight Spin-Off
FedEx weekly share price since 2021 and daily closes since May 2026
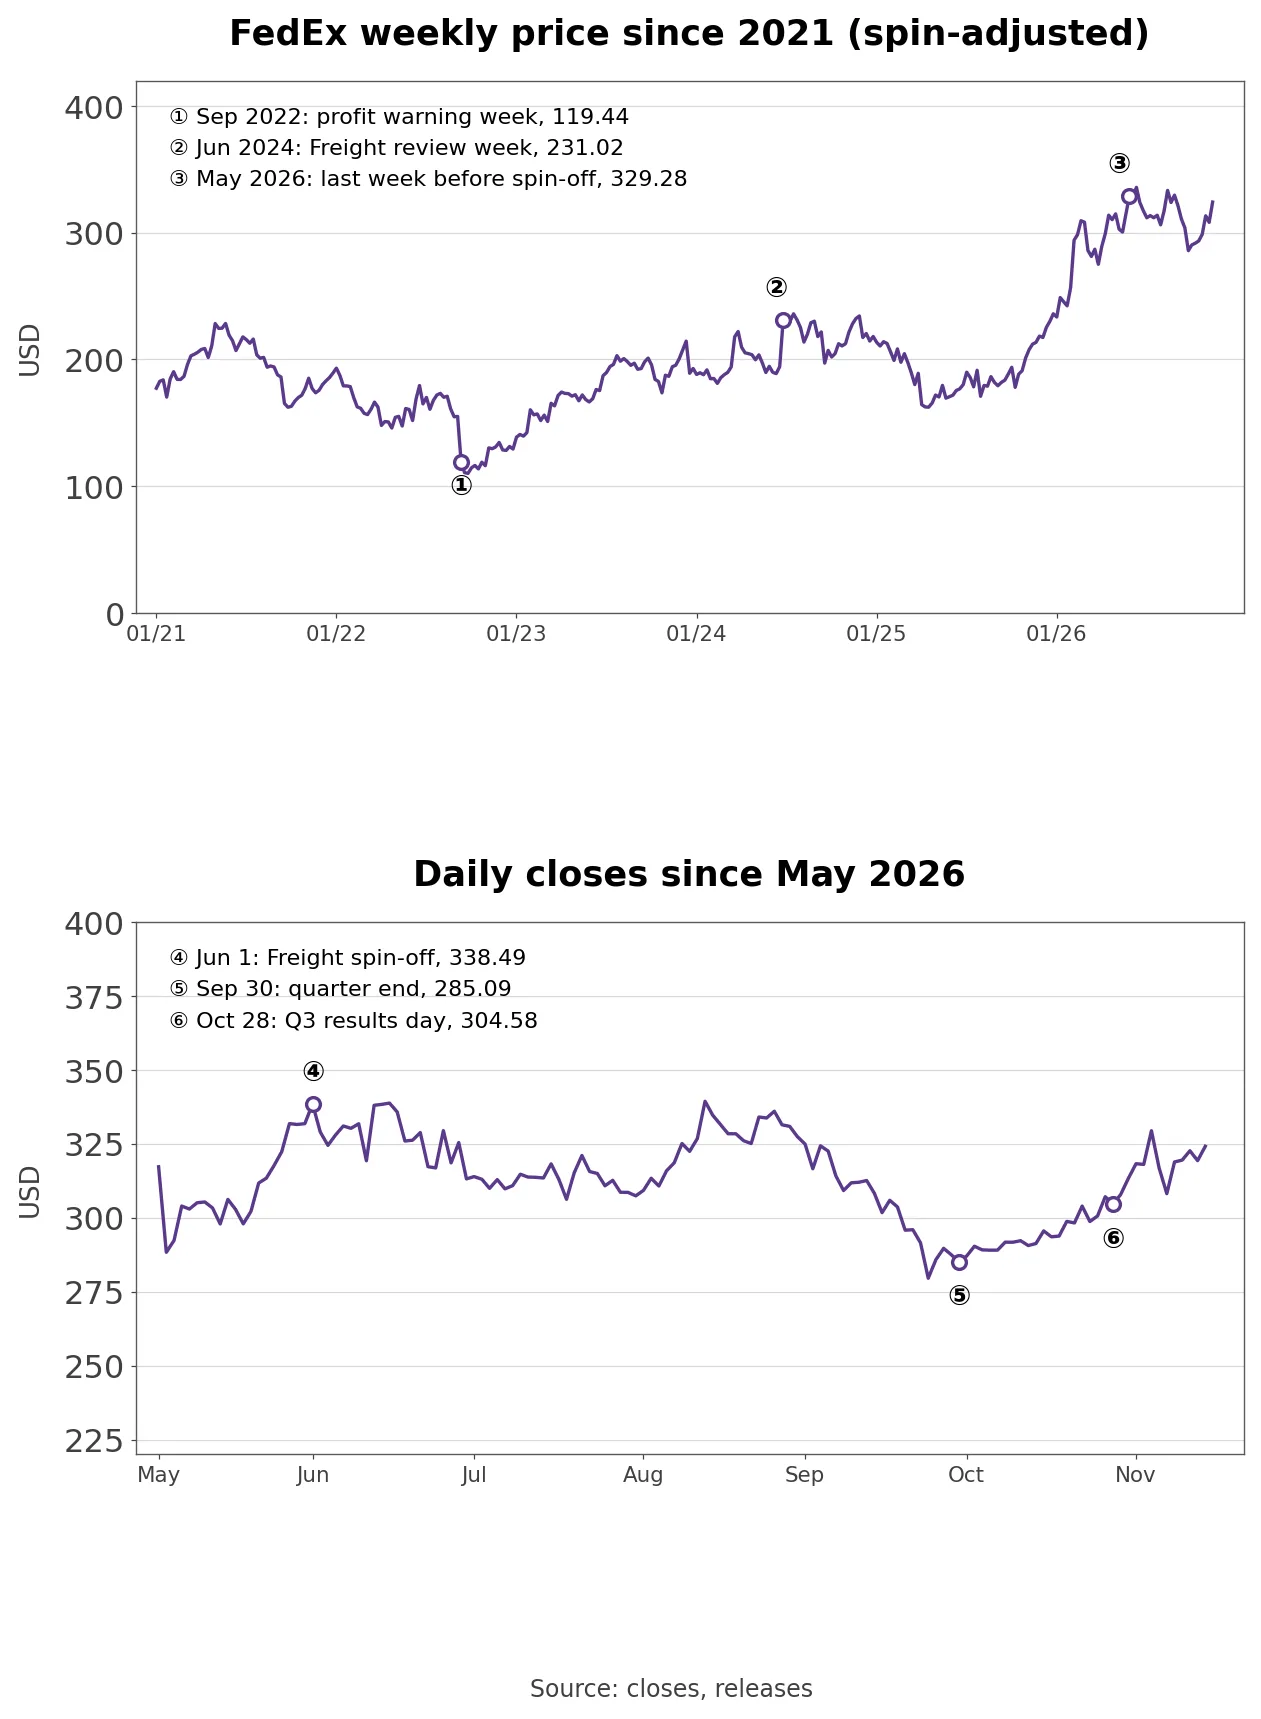
The last five years at FedEx were about fixing the cost base. In the week of September 16, 2022, after FedEx warned on quarterly results, the spin-adjusted share price fell to $119.44. The company then started Network 2.0, which merges the air and ground delivery networks, and its DRIVE cost program, which it said would save $2.2 billion in fiscal 2025.
The stock fell -15.2% on September 20, 2024 after a results miss and -12.0% on April 3, 2025, the day after the U.S. tariff announcement.
On June 25, 2024, with its fiscal year-end results, FedEx said it would review the role of FedEx Freight, and the stock rose +15.5% the next day. In December 2024 it decided to spin the business off, and on June 1, 2026 it distributed one FDXF share for every two FDX shares. The actual closing price was $411.75 at the end of May and $313.13 at the end of June. Most of that difference is the FDXF stock that went to shareholders.
The fiscal year change took effect the same day. June was reported on its own as a transition month, and results now come out on calendar quarters. Hollander called the October 28 call “our first earnings call that aligns our results with the calendar year and fiscal year.” The stock rose +1.1% the day after results and is +6.4% above the results-day close of $304.58.
Why GAAP EPS Guidance Is Twice Adjusted EPS
Bridge from 2026 adjusted EPS guidance to GAAP EPS guidance and monthly value of the Freight stake
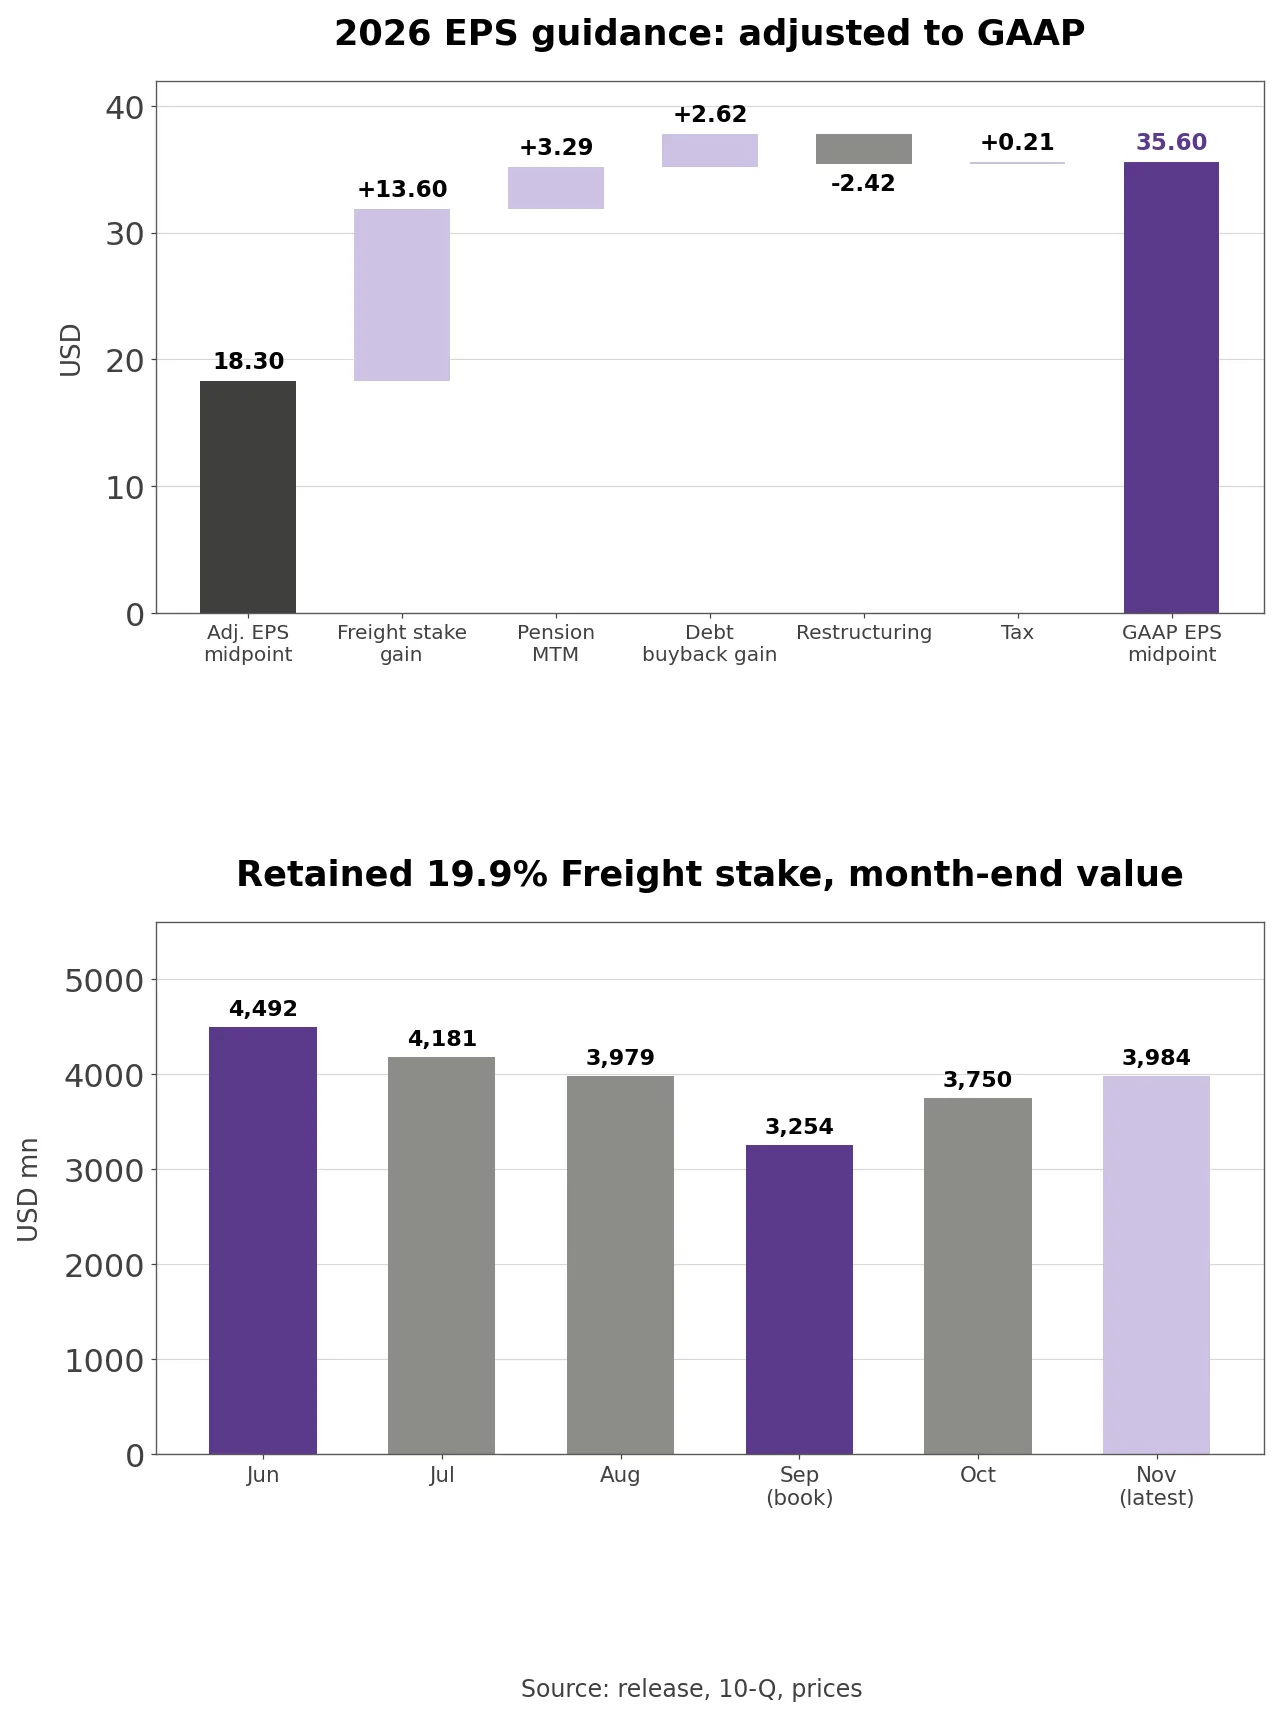
The midpoint of 2026 GAAP EPS guidance, $35.60, is $17.30 above the adjusted midpoint of $18.30. Dividing the reconciliation items by the share count, the gain on the retained Freight stake accounts for $13.60, pension mark-to-market for $3.29 and the gain on buying back bonds below par for $2.62. Restructuring costs of $2.42 run the other way, and tax effects add $0.21. The Freight stake alone explains 78.6% of the gap.
The stake’s book value of $3.254 billion at September 30 exactly equals the $3.254 billion nine-month “gain on short-term investment” in the income statement. With a book cost of zero, every dollar of fair value has been booked as income. The $4.492 billion value at the end of June was a June gain, and the $1.238 billion drop in the third quarter was a third-quarter loss, as FDXF fell from $151 at the end of June to $109.38 at the end of September. That loss is why third-quarter GAAP EPS of $1.21 sits $5.18 below adjusted EPS of $3.74.
Own calculation: Dividing the September book value by the September FDXF close gives FedEx about 29.75 million FDXF shares. At the latest FDXF price of $133.93 the stake is worth $3.984 billion, $730 million more than at the end of September, which would add about $3.07 a share to fourth-quarter GAAP EPS. That is why the GAAP guidance says further mark-to-market changes are excluded.
The $3.984 billion is $17.01 per FedEx share, or 5.2% of the market value. Russ said on the call: “To preserve the tax-efficient status of the separation, we are required to monetize the stake within 24 months of the spin date.”
Where the Q3 Adjusted EPS Gain Came From
Q3 adjusted EPS change by source and quarterly adjusted EPS on continuing operations
Of the $0.81 increase in third-quarter adjusted EPS, operating income contributed $0.49, the lower tax rate $0.29 and lower interest $0.18. Other non-operating income took away $0.10 and the share count $0.05. Operations account for 60.8% of the gain, while tax and interest together account for 57.4%, and the two negative items absorb the overlap.
The adjusted tax rate fell from 28.9% to 23.1%. Adjusted operating income was $1.197 billion, up $164 million, and net interest expense fell from $125 million to $66 million, -47.2%. The interest saving traces back to the roughly $4.1 billion dividend Freight paid FedEx before the spin. FedEx used that cash and cash on hand on July 14 to buy back $4.858 billion of 13 series of long-dated bonds in a tender offer.
Those bonds mature between 2031 and 2065 and carry coupons of 2.4% to 5.1%, so they traded below par. Buying back 48.6% of the $10 billion originally issued at a discount produced a $627 million gain, and long-term debt fell from $20.302 billion at the end of December to $17.304 billion at the end of September, a reduction of $2.998 billion. In September, FedEx issued €2 billion of new euro notes at 4.000% and 4.625%.
The share count rose despite buying 6.3 million shares at an average of $317.5: third-quarter diluted shares were 239 million, +0.8% above a year earlier, as $1.010 billion of stock issuances offset the buyback.
How FedEx Makes Money After the Spin-Off
Earnings slide 18 with Q3 adjusted operating income for U.S. Domestic and International
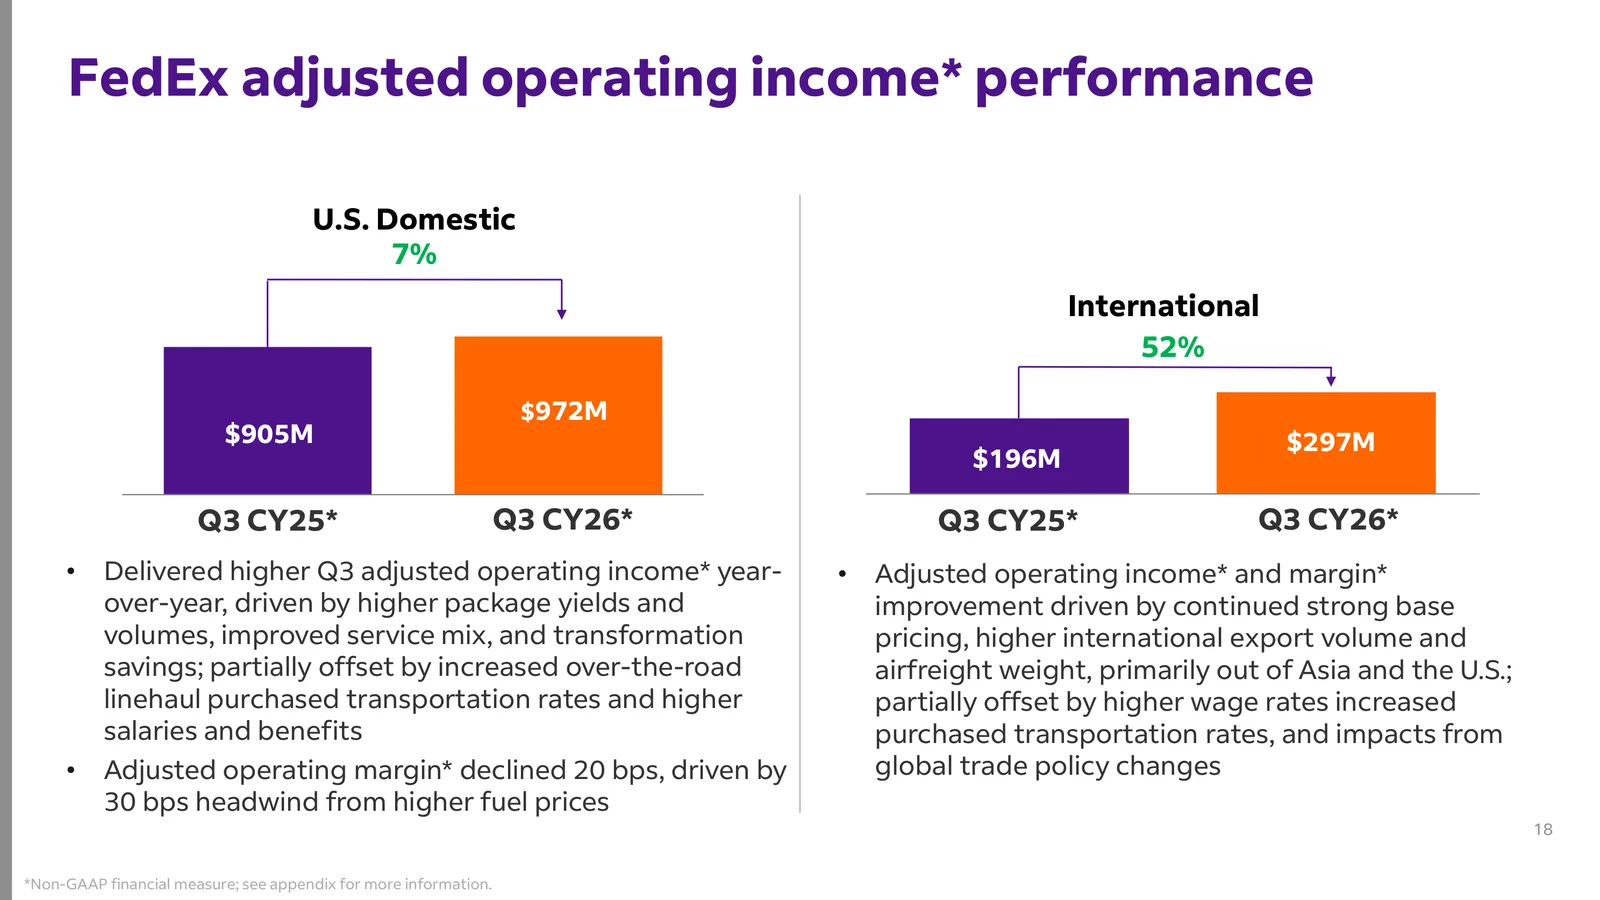
Of $22.855 billion of third-quarter revenue, Express U.S. Domestic brought in $14.710 billion, Express International $7.465 billion and the corporate and other bucket, which holds FedEx Office and FedEx Dataworks, $680 million. Ground packages, delivered by truck in one to five days, are 65% of U.S. domestic revenue at $9.545 billion, with air-based priority at $3.142 billion and deferred at $1.406 billion.
U.S. Domestic earned $972 million of adjusted operating income at a 6.6% margin and International $297 million at 3.9%, so the domestic business generates 76.6% of the total. International revenue is half the domestic figure, so each point of International margin matters a lot.
U.S. average daily package volume was 14.37 million, +2.0%, with 7.05 million in ground home delivery and economy. International average daily volume was 2.83 million, -4.0%, because intra-country international domestic volume fell -11%. FedEx Logistics, the customs and forwarding unit, moved into the International segment this year. Air freight revenue of $1.442 billion grew fastest at +28%, and average daily freight pounds rose +15%, with exports out of Asia and the U.S. leading.
On the customer side, FedEx is pushing business-to-business shipping. Slide 7 says most of the quarter’s revenue growth came from B2B services and names healthcare, automotive, data centers and aerospace as target verticals, which the roadshow sizes at more than $130 billion of addressable market. In residential delivery, the strategy is to win longer-haul, higher-yield packages, and slide 15 says ground economy volume will keep declining in the fourth quarter. On September 24, FedEx paid €2.2 billion for a 37% stake in the holding company of InPost, the European parcel locker network.
Costs hinge on Network 2.0. Slide 8 says about 65% of eligible volume now flows through about 630 optimized stations and more than 260 stations have closed. The company expects about $1 billion of savings by year-end and $2 billion by the end of 2027.
Fuel Surcharges and Yields Behind 12% Revenue Growth
Third-quarter revenue grew $2.423 billion, +11.9%, while volume moved +2.0% in the U.S. and -4.0% internationally. The growth came from price, and price includes fuel surcharges. Fuel expense rose to $1.270 billion, +64.1%, and purchased transportation to $6.455 billion, +19.1%. Those two cost lines alone grew by $1.532 billion, 63.2% of the revenue gain.
Slide 18 attributes the purchased transportation increase to higher outsourced linehaul trucking rates. Salaries and benefits rose to $7.434 billion, +5.0%, slower than revenue, and that gap held up operating income.
Company disclosure (Q3 call, October 28, 2026): Russ said: “While fuel price-driven increases in surcharges drove higher revenue, they were not a material driver of the year-over-year change in our adjusted operating income in the quarter.”
The U.S. Domestic adjusted margin was 0.2 points lower than a year earlier, and the company said fuel cost it 0.3 points. For the fourth quarter, FedEx assumes fuel surcharges account for three points of U.S. Domestic revenue growth and seven points of International revenue growth, and it expects the U.S. Domestic adjusted margin to slip. Parcel rates rise an average of 5.9% on January 4, 2027.
Fuel surcharges inflate revenue and costs together, which makes margins look thinner, so reading the roughly 12% revenue growth for 2026 as the pace of demand would overstate it.
FedEx vs. UPS and the Freight Forwarders
Revenue growth and forward P/E at FedEx UPS Expeditors and C.H. Robinson
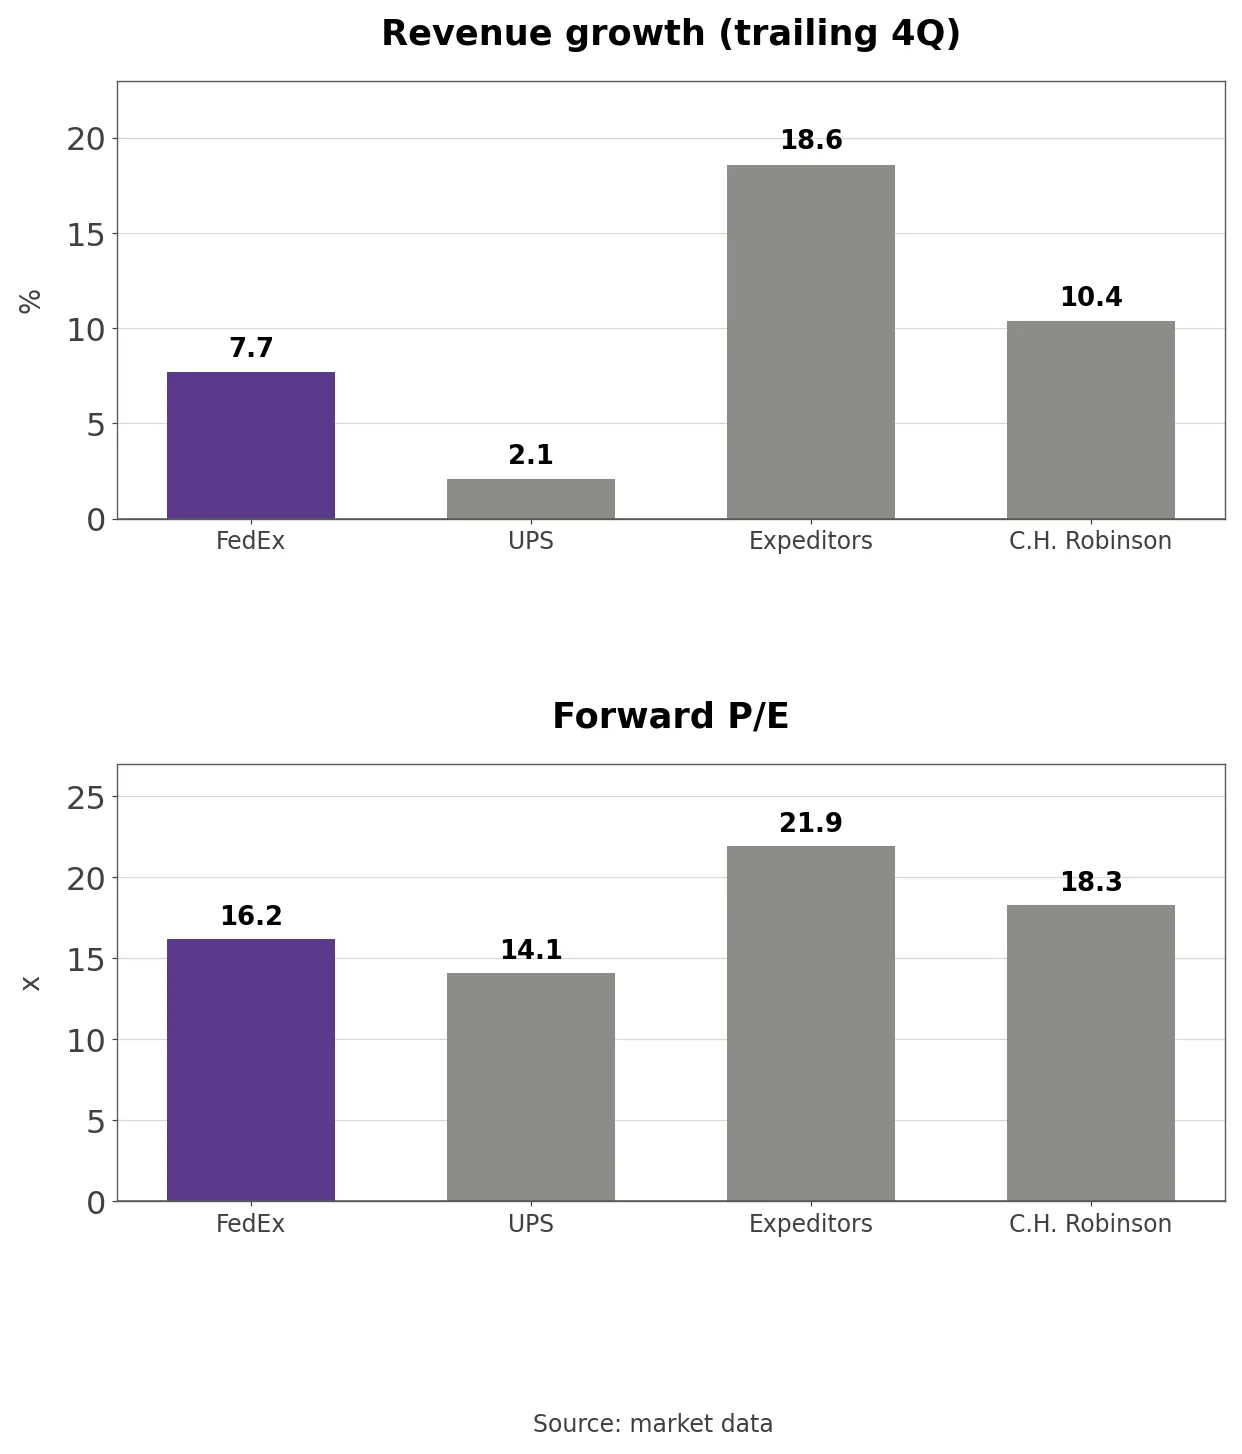
The peers are UPS, the direct competitor in parcels and express, plus Expeditors (EXPD) and C.H. Robinson (CHRW), which overlap with the forwarding and brokerage work inside FedEx’s International segment. Trailing four-quarter revenue growth is 7.7% for FedEx, 2.1% for UPS, 18.6% for Expeditors and 10.4% for C.H. Robinson.
Forward P/E is 16.19x for FedEx, 14.09x for UPS, 21.93x for Expeditors and 18.31x for C.H. Robinson. The two companies that fly planes and run trucks trade below the two asset-light brokers, and FedEx sits 2.10 turns above UPS.
Price to free cash flow and shareholder yield at FedEx and three peers
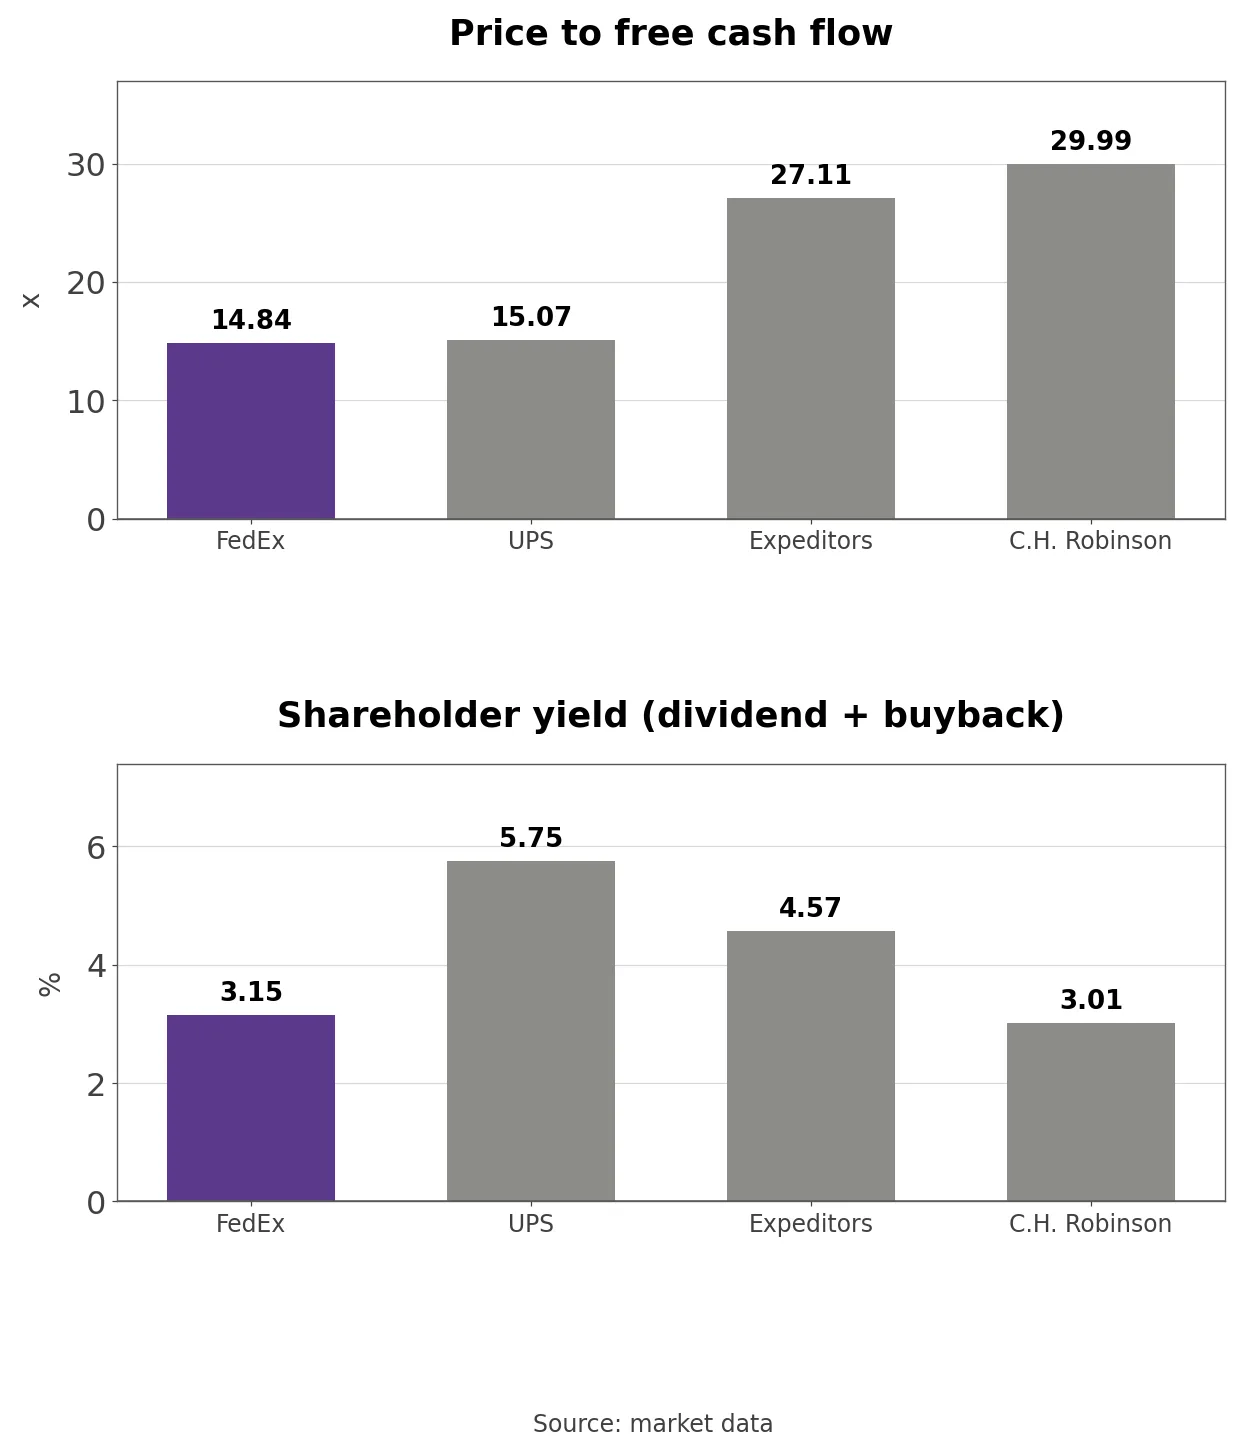
Price to free cash flow is 14.84x for FedEx and 15.07x for UPS, with both brokers above 27x. The free cash flow behind FedEx’s market data figure includes tariff refunds owed to customers. Own calculation: Dividing FedEx’s market value by the company’s 2026 adjusted free cash flow guidance of $3.955 billion gives 19.2x, more expensive than UPS. Shareholder yield, dividends plus buybacks, is 3.15% at FedEx and 5.75% at UPS. Return on equity is 14.85% at FedEx and 28.64% at UPS, so closing stations under Network 2.0 feeds straight into capital efficiency. The spun-off FDXF trades at 30.58x trailing earnings.
GAAP P/E and Adjusted P/E Bands
FedEx GAAP P/E and adjusted P/E over 60 months
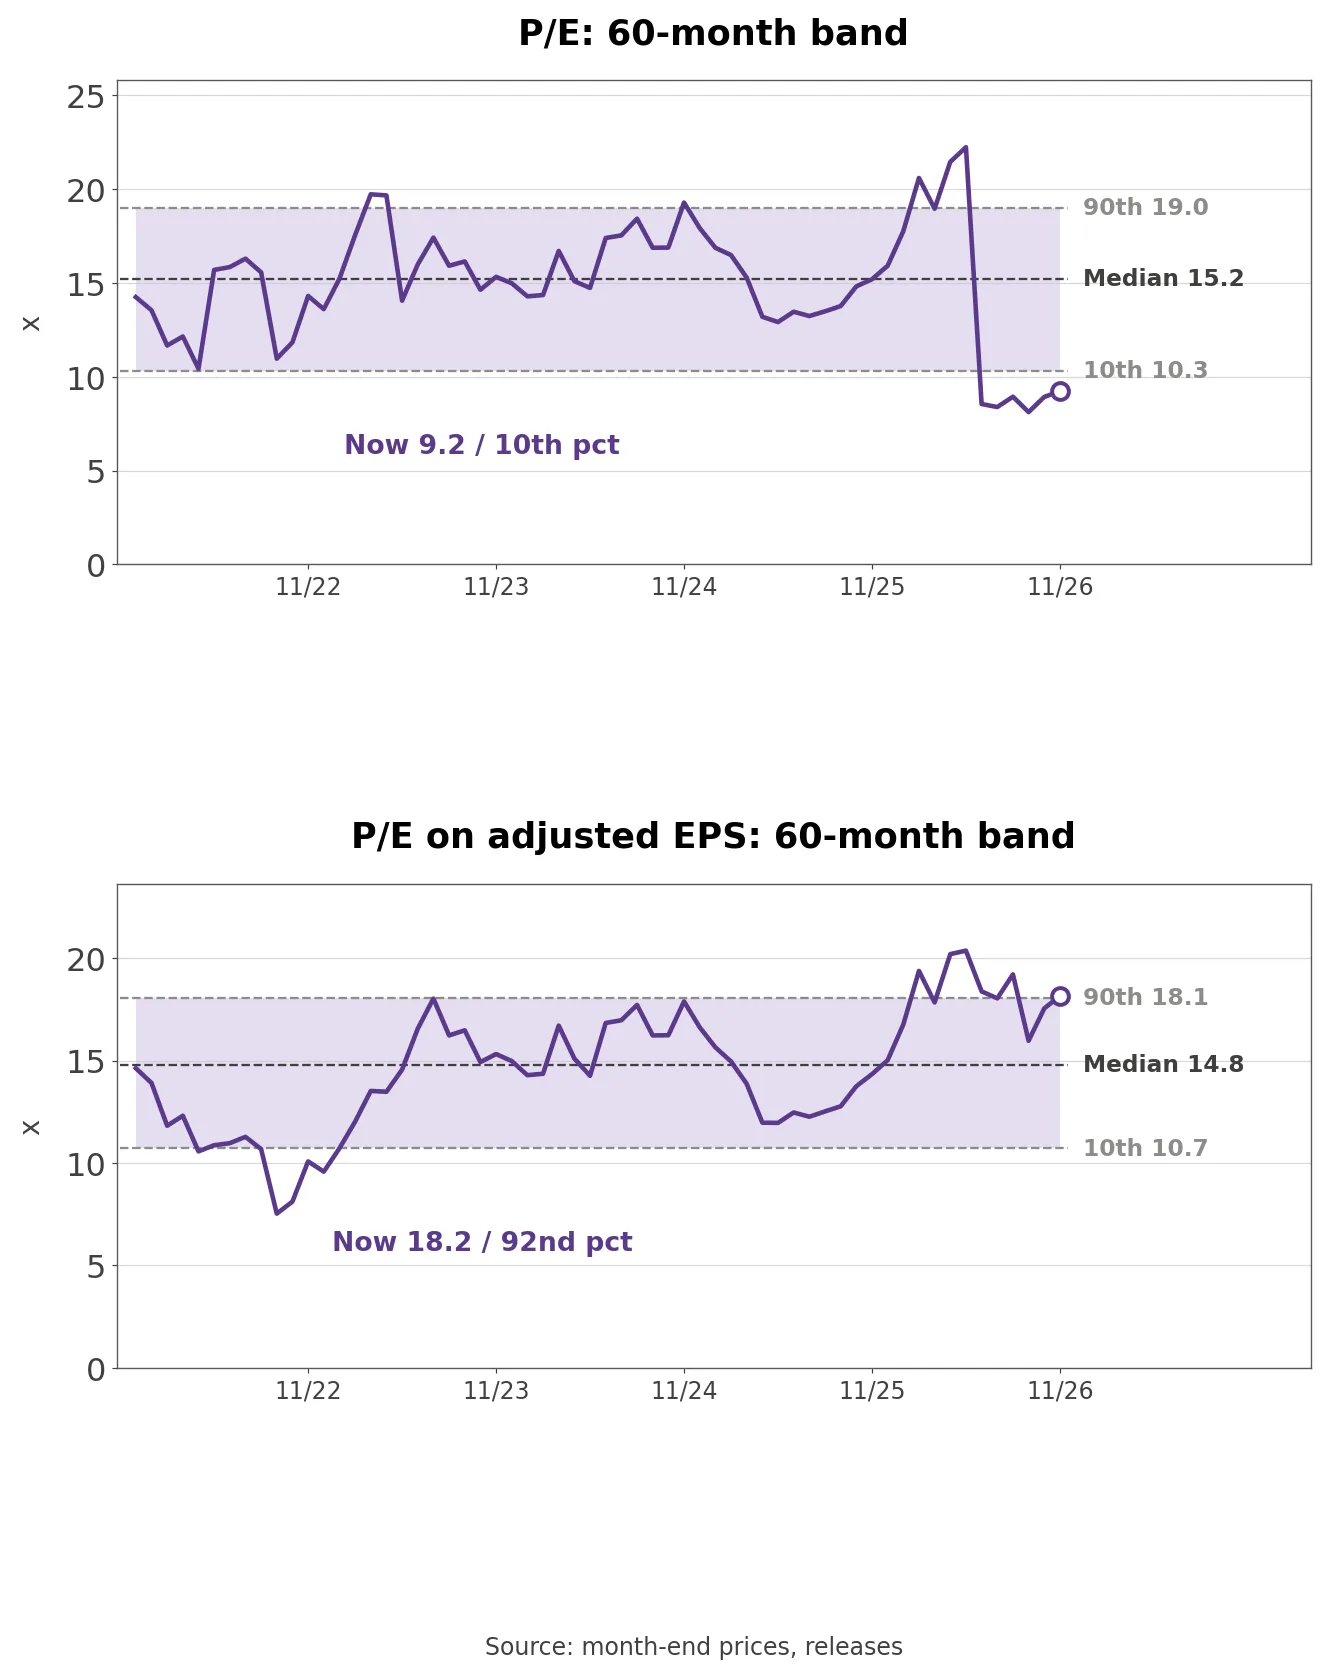
The bands use trailing four-quarter earnings (TTM). For months before the spin-off, they pair consolidated EPS that includes Freight with actual closing prices; for months after it, continuing-operations EPS with actual closing prices, so numerator and denominator describe the same company. On trailing GAAP EPS of $35.10, the P/E of 9.23x sits in the bottom 10.0% of 60 months, against a median of 15.21x. The low was 8.12x in September and the high was 22.24x in May, just before the spin-off.
On trailing adjusted EPS of $17.85, the P/E of 18.16x sits at the 91.7th percentile of 60 months, against a median of 14.78x. The high was 20.37x in May and the low was 7.53x in September 2022. The same share price looks like a five-year low on GAAP and a five-year high on adjusted earnings.
The GAAP P/E dropped from 22.24x in May to 8.55x in June mostly because trailing GAAP EPS jumped from $18.51 to $36.62 with the stake gain. The adjusted P/E moved only from 20.37x to 18.38x, so it carries across the spin-off.
Removing only the stake gain leaves trailing GAAP EPS of $21.48 and a P/E of 15.09x, back near the median. On the 2026 adjusted EPS guidance midpoint the stock trades at 17.7x, and at 16.8x after taking the $17.01 per share Freight stake out of the price.
Three Conditions That Move the Stock
The FDXF share price drives both GAAP earnings and the eventual proceeds. FDXF rose from $109.38 at the end of September to $133.93, +22.4%, adding $730 million to the stake. Swapping the stake for FedEx bonds cuts debt, and swapping it for FedEx shares reduces the share count, both of which help the stock. A falling FDXF does the opposite.
U.S. Domestic adjusted operating margin shows what the network earns. It was 6.6% in the third quarter, and the test is whether it dips in the fourth quarter as guided and then recovers in 2027. Network 2.0 savings of $2 billion need to stay in margin rather than fund price, or the 2029 operating income goal of $8 billion moves out of reach.
Adjusted free cash flow sets the pace of buybacks. Guidance for 2026 is about $3.955 billion and the 2029 target is about $6 billion. About $2.7 billion of the $7.961 billion of September cash is tariff refunds held for customers.
How Will FedEx Dispose of the Freight Stake?
To keep the spin-off tax-free, FedEx has to sell or transfer the FDXF stake within 24 months of the spin date. The spin-off release lists exchanges in repayment of FedEx debt, dividends to FedEx shareholders and exchanges for outstanding FedEx shares as the options.
Own calculation: Using the $3.984 billion stake in a share exchange at $324.14 would retire about 12.29 million FedEx shares, 5.2% of the market value, and lift EPS by about 5.5%. Using it in a debt exchange would retire about 23% of long-term debt; assuming a 4% average interest rate and a 22.5% tax rate, the interest saving is about $0.52 a share, 2.8% of adjusted EPS.
Until then, every $10 move in FDXF changes the stake’s value by about $1.25 per FedEx share, and quarterly GAAP EPS records every bit of it. A share exchange does more for EPS, but it leaves the debt in place. Which route will FedEx take?
Related Analysis
lululemon (LULU) Stock Analysis: Margin Decline and Tariffs: a retailer that ships across borders and absorbed tariff costs, a useful counterpart to the trade-policy pressure on FedEx International and the tariff refunds sitting in FedEx’s cash.