At $465.67, Amgen (NASDAQ: AMGN) trades at 20.09 times trailing non-GAAP earnings, the second-highest reading in five years. What the market is paying for is the growth portfolio. In the third quarter, Repatha, EVENITY, TEZSPIRE and the rare disease, innovative oncology and biosimilar groups added $1.508 billion of sales from a year earlier, about twice the $758 million that the bone drug denosumab (Prolia and XGEVA) lost to biosimilars. Excluding denosumab, product sales grew +20.2%. Non-GAAP EPS was $6.45, +14.4%, but a fifth of that gain came from a lower tax rate.
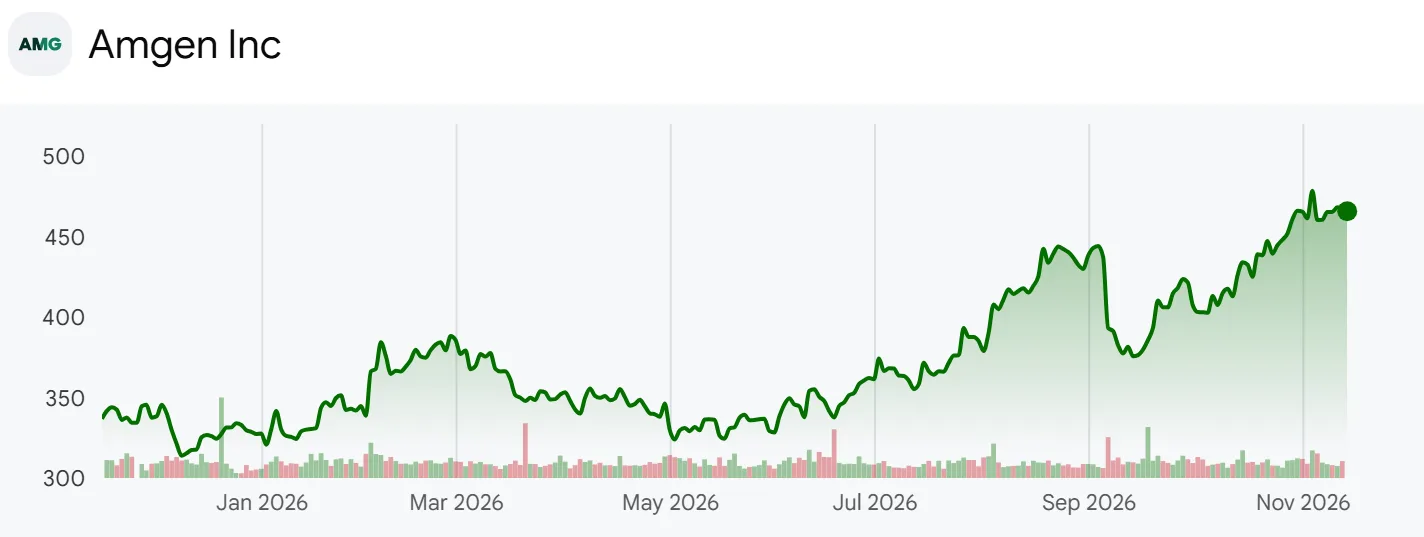
Amgen one-year share price chart
Amgen is the Thousand Oaks, California, biotech that sells the cholesterol drug Repatha, the osteoporosis drugs EVENITY and Prolia, the asthma drug TEZSPIRE, the rare disease drugs that came with the 2023 Horizon acquisition, cancer drugs and biosimilars. Third-quarter product sales were $9.883 billion, 73.4% of them in the U.S. The market value is about $251.9 billion.
I worked through the third-quarter 10-Q, the earnings release, the 28-slide earnings deck, the November 3 call and 25 earnings releases since 2020. The open question is how long the growth products can outrun the denosumab decline, and whether that pace supports a multiple near its five-year high.
Two limits apply. The year-ago biosimilar figure is backed out from the 26% growth rate management gave on the call, so it carries a few million dollars of rounding. Quarterly EPS uses the restated figures from each following year’s release, which changed five quarters in 2020 and 2021.
What Slide 6 Leaves Out About Denosumab
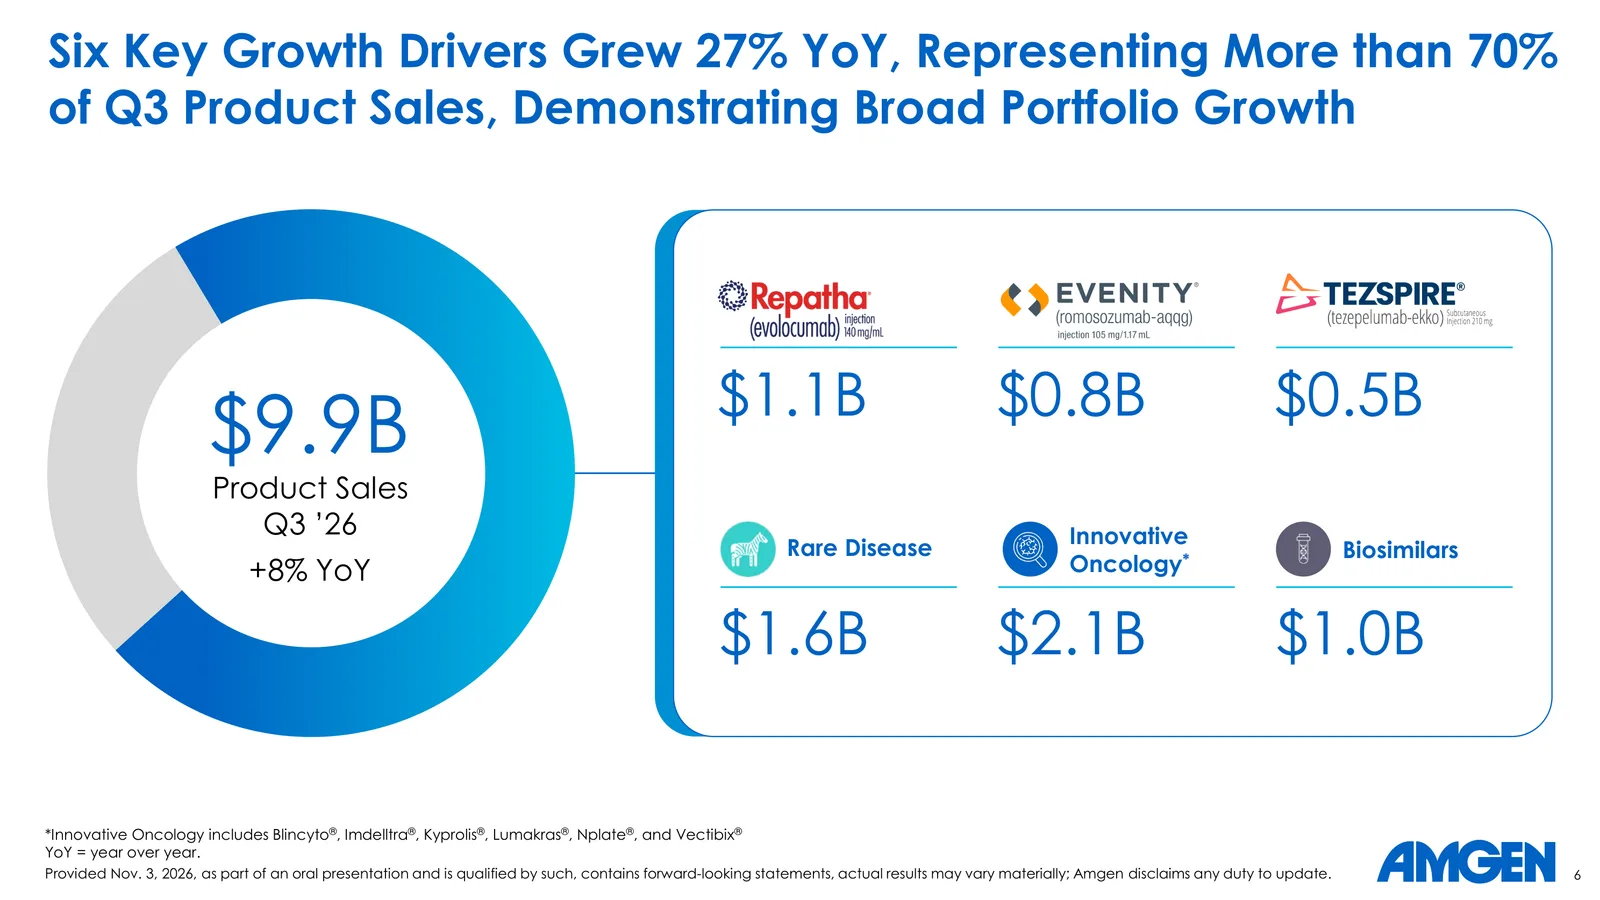
Q3 2026 earnings slide 6 with six growth drivers at 7.1 billion of 9.9 billion product sales
Slide 6 of the deck reads: “Six Key Growth Drivers Grew 27% YoY, Representing More than 70% of Q3 Product Sales.” The circle shows Repatha at $1.1 billion, EVENITY $0.8 billion, TEZSPIRE $0.5 billion, rare disease $1.6 billion, innovative oncology $2.1 billion and biosimilars $1.0 billion.
Rebuilding it from the release’s product table, the five groups other than biosimilars total $6.126 billion, +27.1% from $4.820 billion a year earlier. Adding the $977 million of biosimilar sales cited on the call gives $7.103 billion, 71.9% of product sales, which matches the slide’s rounded $7.1 billion. The claim holds. The innovative oncology group does include KYPROLIS, whose sales fell -8.1% to $330 million, so growth inside each bucket is uneven.
What about the other 28%? Of the $2.780 billion outside the growth drivers, denosumab is $920 million, -45.2% from $1.678 billion a year earlier. The rest of the products outside the six drivers come to $1.860 billion, almost the same as $1.864 billion a year earlier. Otezla’s decline was offset by Neulasta and Enbrel.
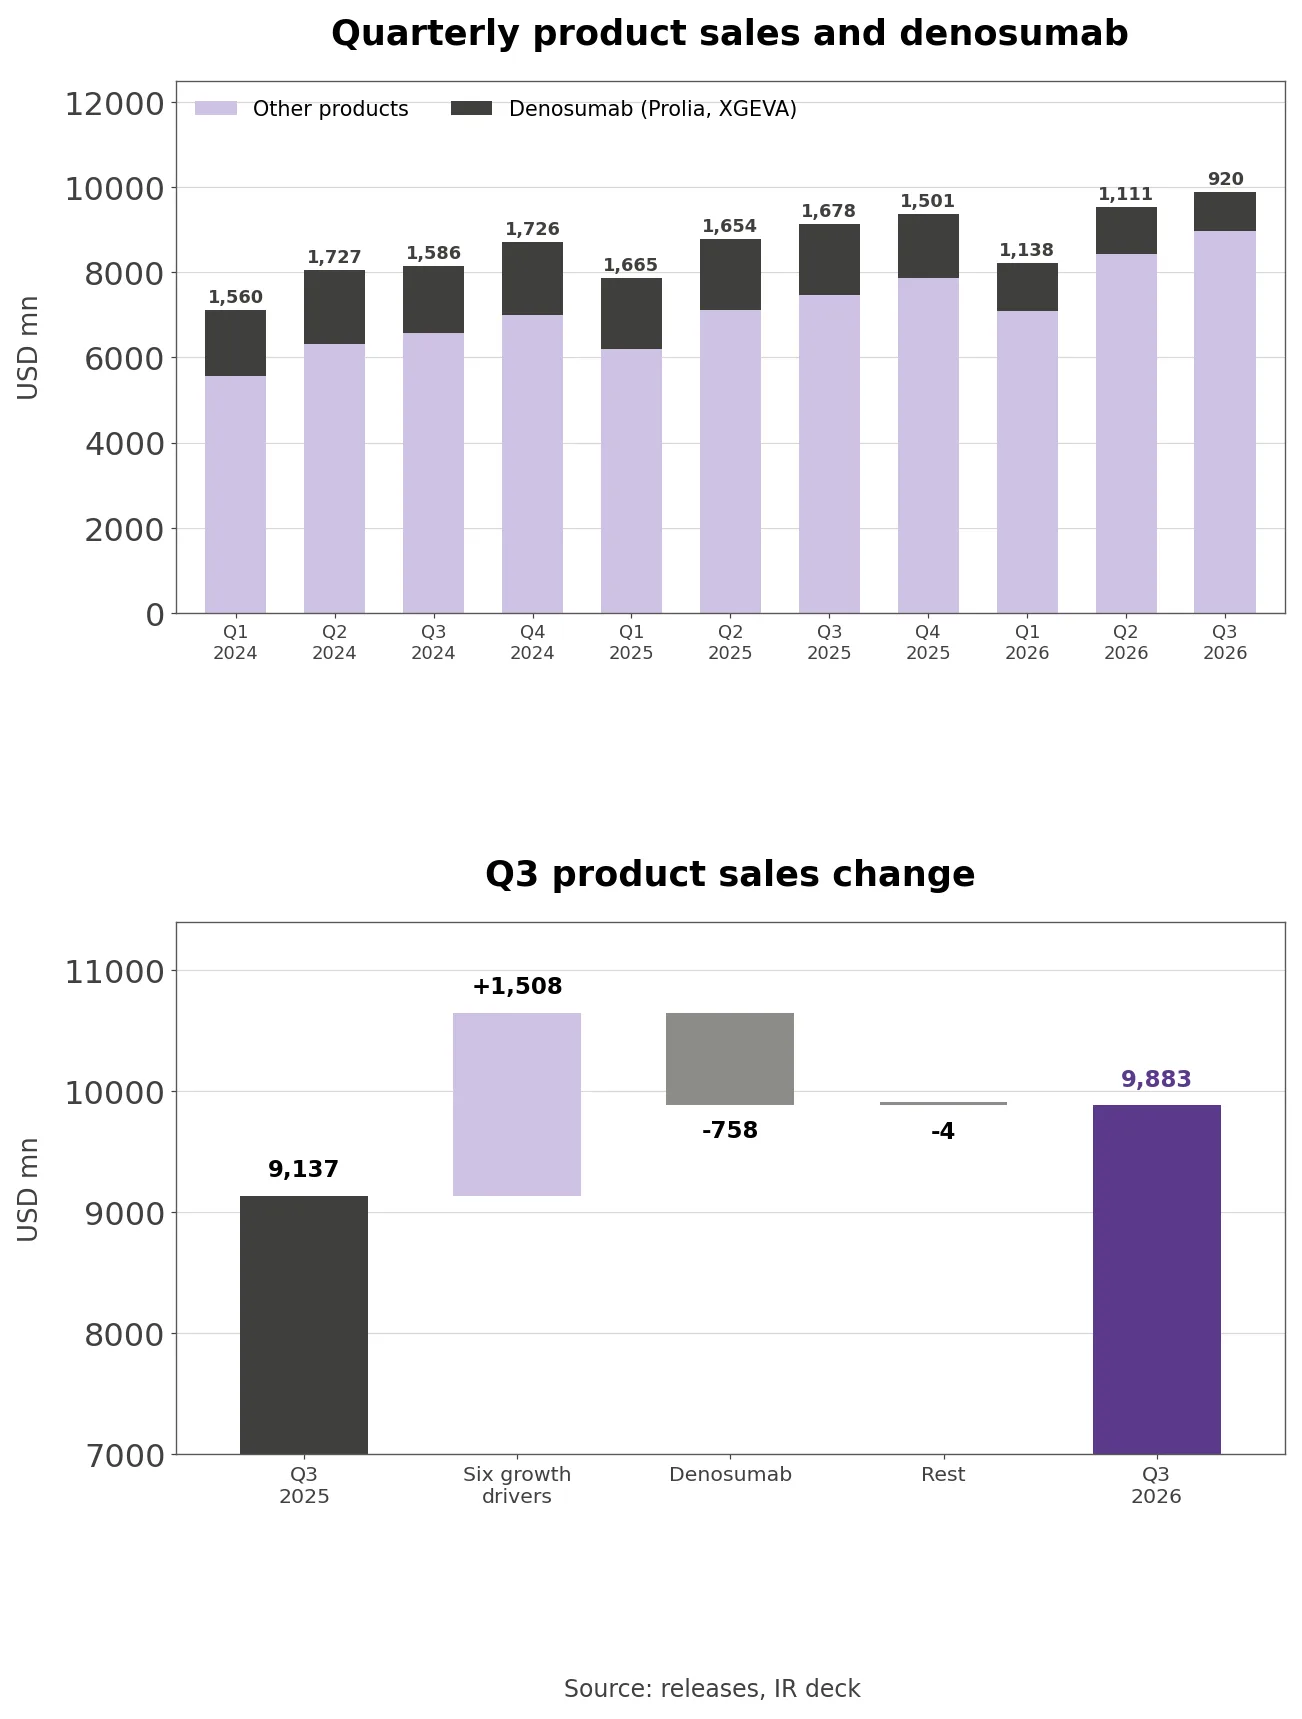
Denosumab does not appear on slide 6, and the names Prolia and XGEVA do not appear anywhere in the call transcript. The $746 million increase in product sales is the sum of +$1.508 billion from the drivers and -$758 million from denosumab.
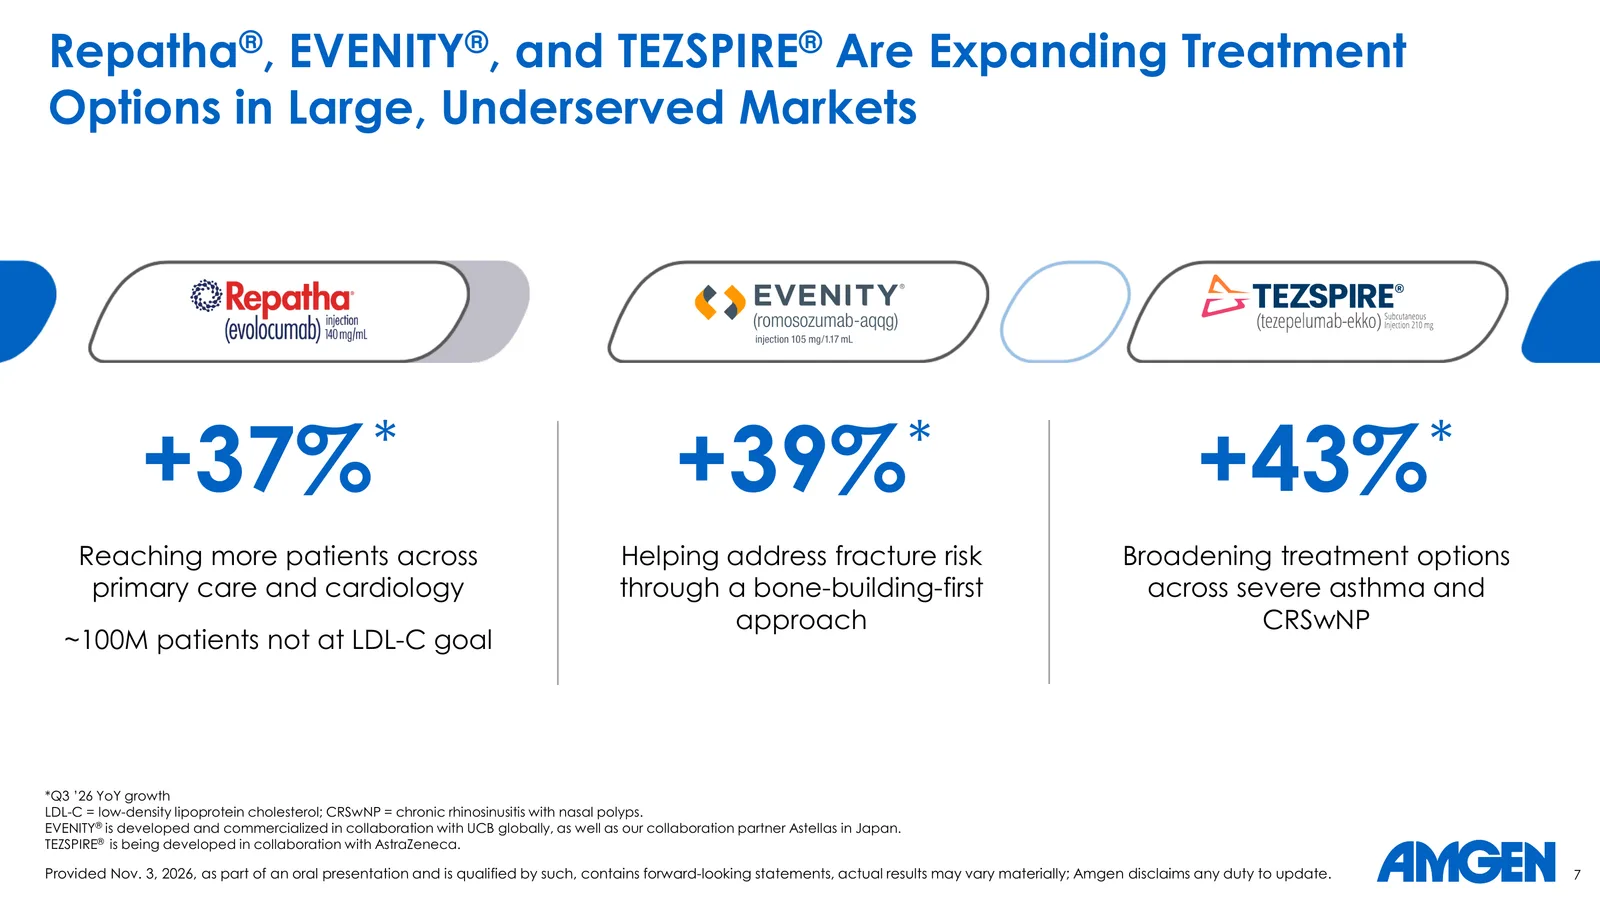
Earnings slide 7 with Repatha up 37 percent EVENITY up 39 percent and TEZSPIRE up 43 percent
Slide 7 highlights Repatha +37%, EVENITY +39% and TEZSPIRE +43%. Those three added $662 million, 87.3% of the denosumab decline. Slide 5 adds that 17 products are annualizing above $1 billion. Counting products with more than $250 million of third-quarter sales gives exactly 17, but six of them shrank from a year earlier: Prolia, XGEVA, Otezla, KYPROLIS, TEPEZZA and Aranesp. Together those six fell from $3.539 billion to $2.586 billion.
Slide 20 Raises Guidance but Q4 Slows
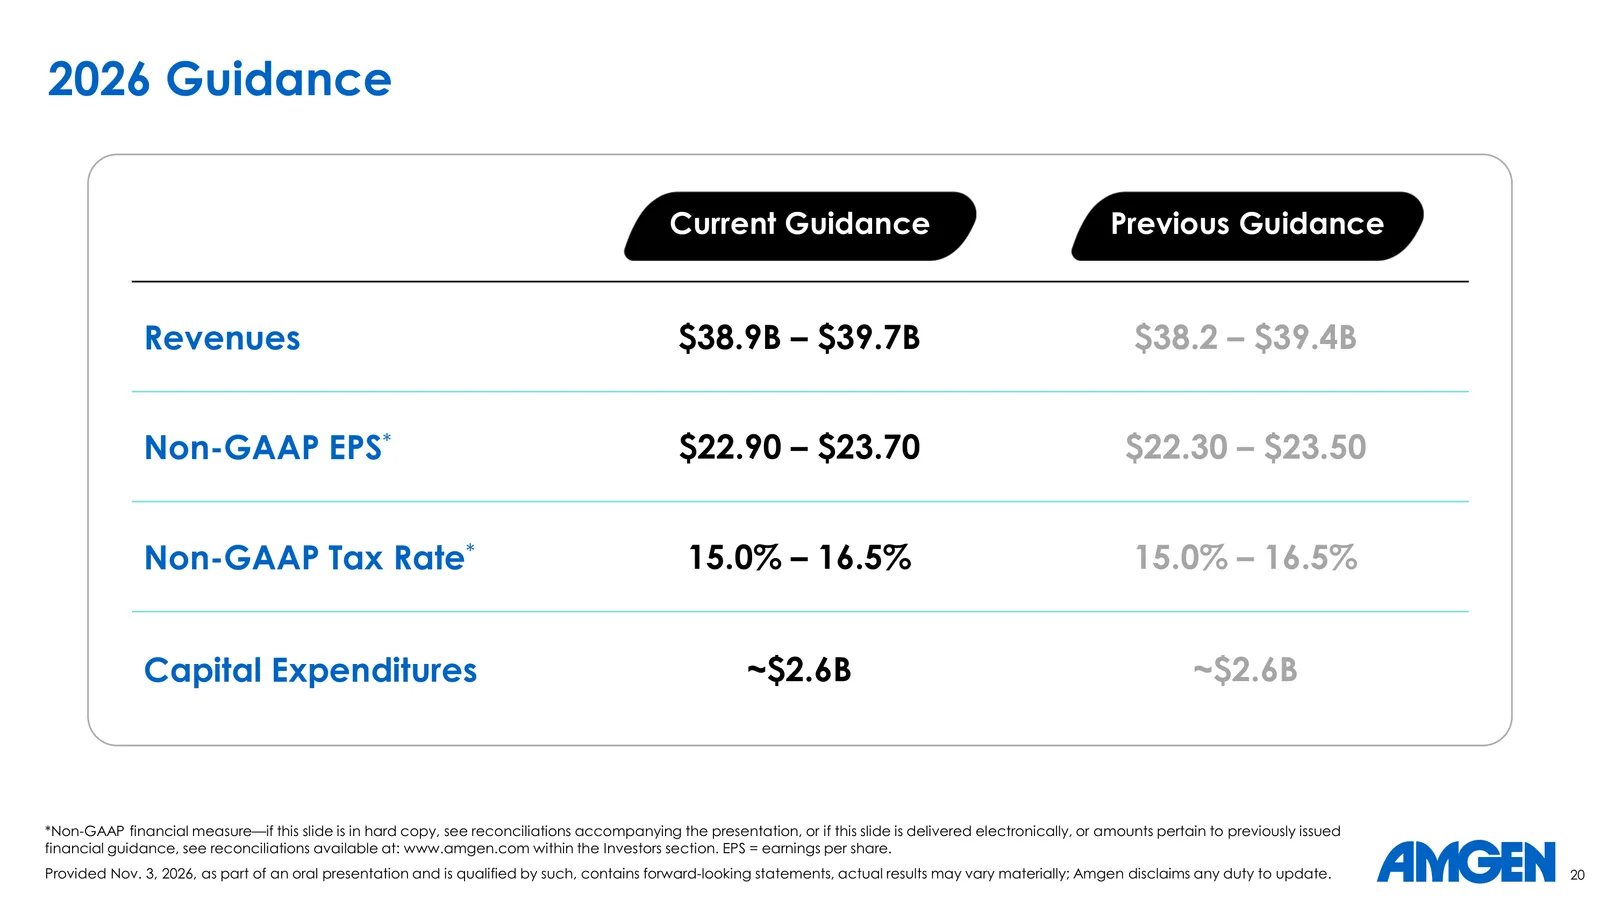
Earnings slide 20 with 2026 non-GAAP EPS guidance of 22.90 to 23.70
Slide 20 raises 2026 revenue guidance from $38.2 billion to $39.4 billion to $38.9 billion to $39.7 billion, and non-GAAP EPS guidance from $22.30 to $23.50 to $22.90 to $23.70. The tax rate range of 15% to 16.5% and capital spending of about $2.6 billion are unchanged. Across four releases since the first range of $21.60 to $23.00 in February, the EPS midpoint has risen from $22.30 to $23.30, +4.5%, and the revenue midpoint from $37.7 billion to $39.3 billion, +4.2%.
The $23.30 midpoint is +6.6% above 2025 non-GAAP EPS of $21.85. Nine-month non-GAAP EPS is already $17.88, which leaves $5.02 to $5.82 for the fourth quarter, $5.42 at the midpoint. Against $5.29 a year earlier, that is -5.1% to +10.0%, or +2.5% at the midpoint, well below the third quarter’s +14.4%.
Company disclosure (Q3 call, November 3, 2026): CFO Thomas Dittrich said: “we expect a meaningful sequential increase in operating expenses, consistent with our established pattern of higher spending in the final quarter of the year.” He kept full-year non-GAAP operating margin at roughly 45% to 46% of product sales, against 47.1% for the first nine months.
Own calculation: Taking the $39.3 billion revenue midpoint, subtracting about $1.9 billion of other revenue and applying a 45.5% margin to the remaining $37.4 billion of product sales implies a fourth-quarter non-GAAP operating margin of about 41.1%, six points below the nine-month average. Fourth-quarter spending peaks are a yearly pattern, so this does not by itself mean the trend has turned, but the guidance raise does not carry into fourth-quarter earnings growth.
The GAAP EPS guidance in the footnote is $18.34 to $19.28. Against the August range of $15.80 to $17.08, the midpoint rose $2.37, almost six times the $0.40 increase in the non-GAAP midpoint. Most of the GAAP increase reflects the BeOne equity gain already booked in the third quarter; the operating improvement is the $0.40 on the non-GAAP side. Dittrich added: “Looking ahead to 2027, we do not anticipate a step-down in operating margin compared with our 2026 guidance.”
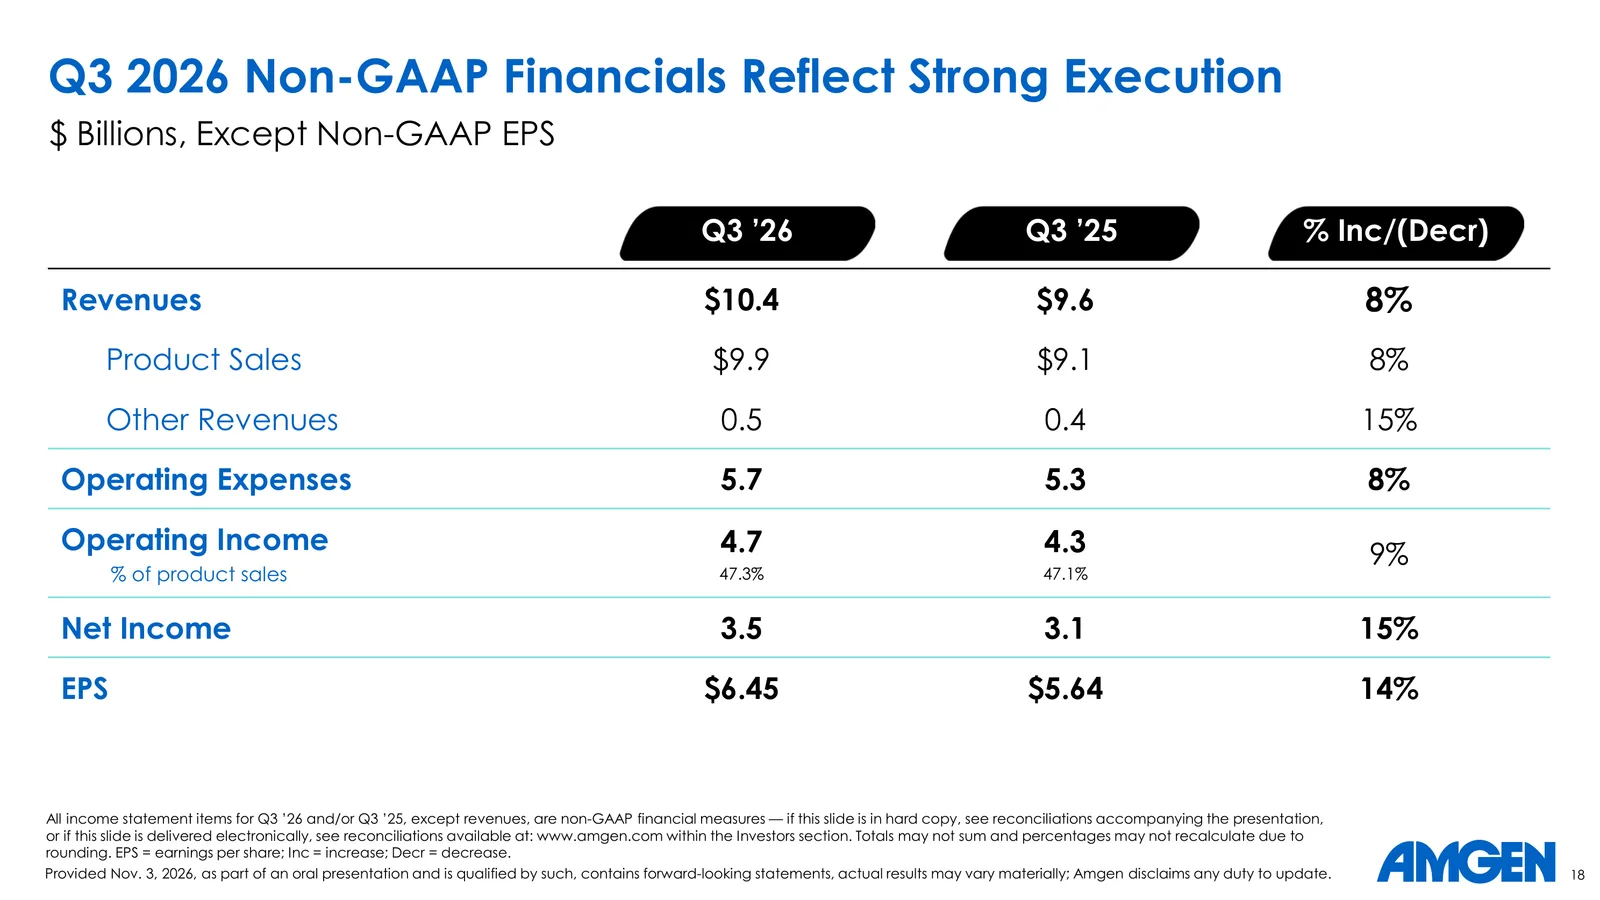
Earnings slide 18 with Q3 non-GAAP results and EPS of 6.45
The cash flow slide reads differently from the income statement. Third-quarter free cash flow was $3.7 billion against $4.2 billion a year earlier, which the company attributes to favorable timing of rebates and collections in the prior-year quarter. Nine-month operating cash flow was $10.432 billion, +24.9% from $8.355 billion. The same slide shows zero buybacks and $1.4 billion of dividends.
The Bull and Bear Case for Amgen
The bull case is breadth. By the company’s count, seventeen products grew at double-digit rates in the quarter. IMDELLTRA reported an overall survival benefit in a Phase 3 small cell lung cancer study, and the obesity candidate MariTide completed enrollment in several Phase 3 trials.
The bear case is price. The non-GAAP P/E of 20.09x sits at the 98.3rd percentile of 60 months. A lower tax rate supplied 22.1% of the non-GAAP EPS gain. Denosumab still brings in $920 million a quarter, and Medicare price setting cut Enbrel’s net selling price by 14%. Amgen bought no stock in the quarter and carries $40.8 billion of net debt.
From the Horizon Deal to Denosumab Biosimilars
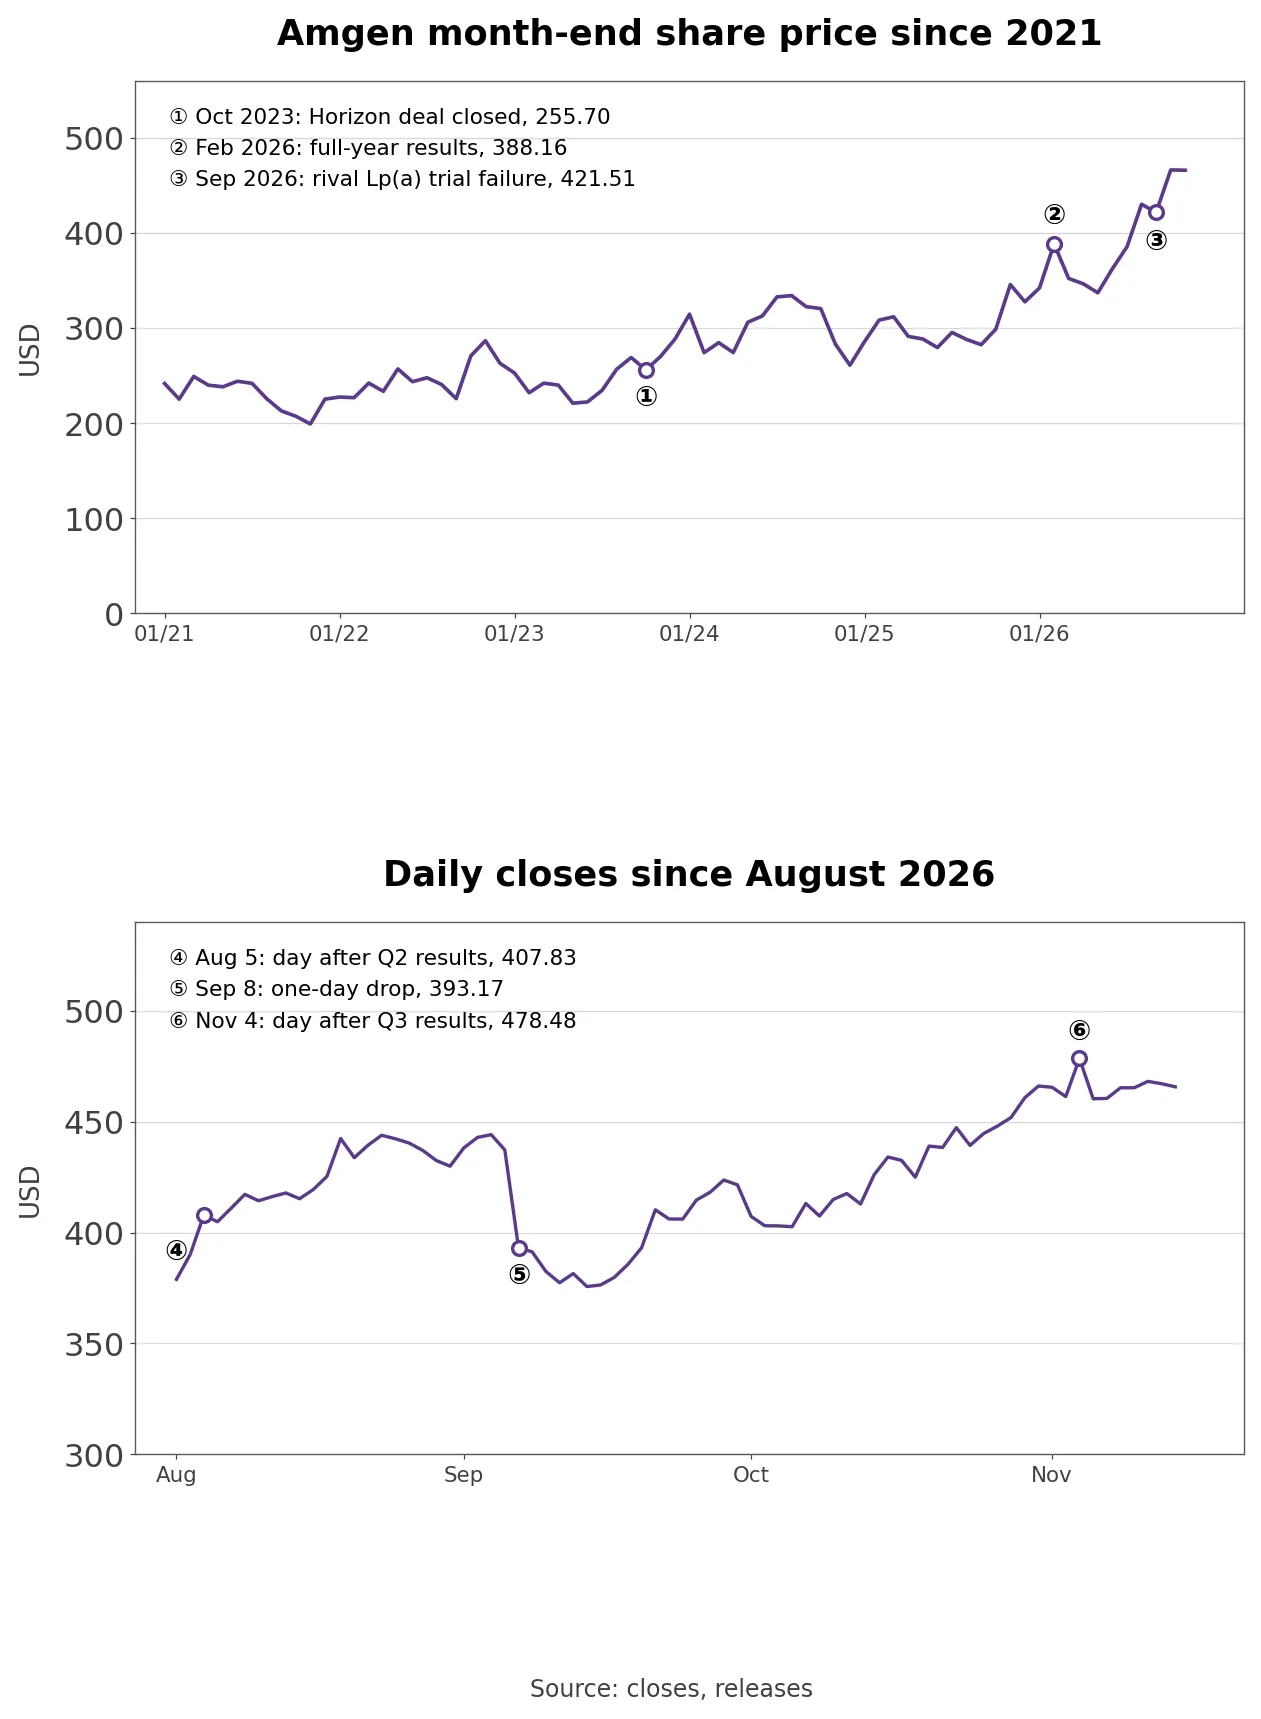
Amgen month-end share price since 2021 and daily closes since August 2026
Amgen’s last five years combined a large acquisition with patent expirations. It closed the Horizon Therapeutics deal on October 6, 2023, adding rare disease drugs such as TEPEZZA, KRYSTEXXA and UPLIZNA; the stock ended that month at $255.70. As amortization of the acquired assets began, GAAP EPS was a loss of $0.21 in the first quarter of 2024, against non-GAAP EPS of $3.96.
Denosumab sales peaked at $1.727 billion in the second quarter of 2024. After biosimilars launched around the world, they fell to $1.138 billion, $1.111 billion and $920 million in the first three quarters of 2026. The stock rose +11.8% on May 3, 2024 and +7.8% on November 5, 2025, both the day after quarterly results, and +8.2% after full-year results in February 2026.
On September 8, with no filing from Amgen, the stock fell from $437.23 to $393.17, -10.1%. According to press reports, Novartis’s lipoprotein(a) drug pelacarsen failed in Phase 3, and Amgen’s candidate in the same class, olpasiran, was marked down with it. The stock has since recovered +18.4% to $465.67. It rose +3.7% to $478.48 the day after third-quarter results and fell -3.8% the following day.
Growth Products Covered Twice the Denosumab Decline
Quarterly product sales split into denosumab and other products and the Q3 sales bridge
Measured against the same quarter a year earlier, denosumab fell -31.7%, -32.8% and -45.2% in the first three quarters of 2026. Product sales excluding denosumab accelerated over the same quarters: +14.0%, +18.4% and +20.2%. Total product sales grew +4.4%, +8.7% and +8.2%.
Denosumab’s share of product sales halved from 18.4% a year earlier to 9.3%. Prolia fell -44.5% to $632 million on 23% lower volume plus price and deduction changes; XGEVA fell -46.6% to $288 million on 32% lower volume and 11% lower price. More than 37% of denosumab sales are outside the U.S., where biosimilars arrive on different timetables.
Products outside the six growth drivers, excluding denosumab, total $1.860 billion, almost the same as $1.864 billion a year earlier. The $1.508 billion added by the growth drivers is 1.99 times the denosumab decline. At this pace, even if denosumab lost all of its remaining $920 million a quarter, the drivers would add more in a year.
The largest gains came from UPLIZNA ($296 million, +191%), Repatha ($291 million), IMDELLTRA ($228 million, +128%) and EVENITY ($210 million). Those four produced 68.0% of the drivers’ gain.
How Much of the EPS Gain Came From Tax
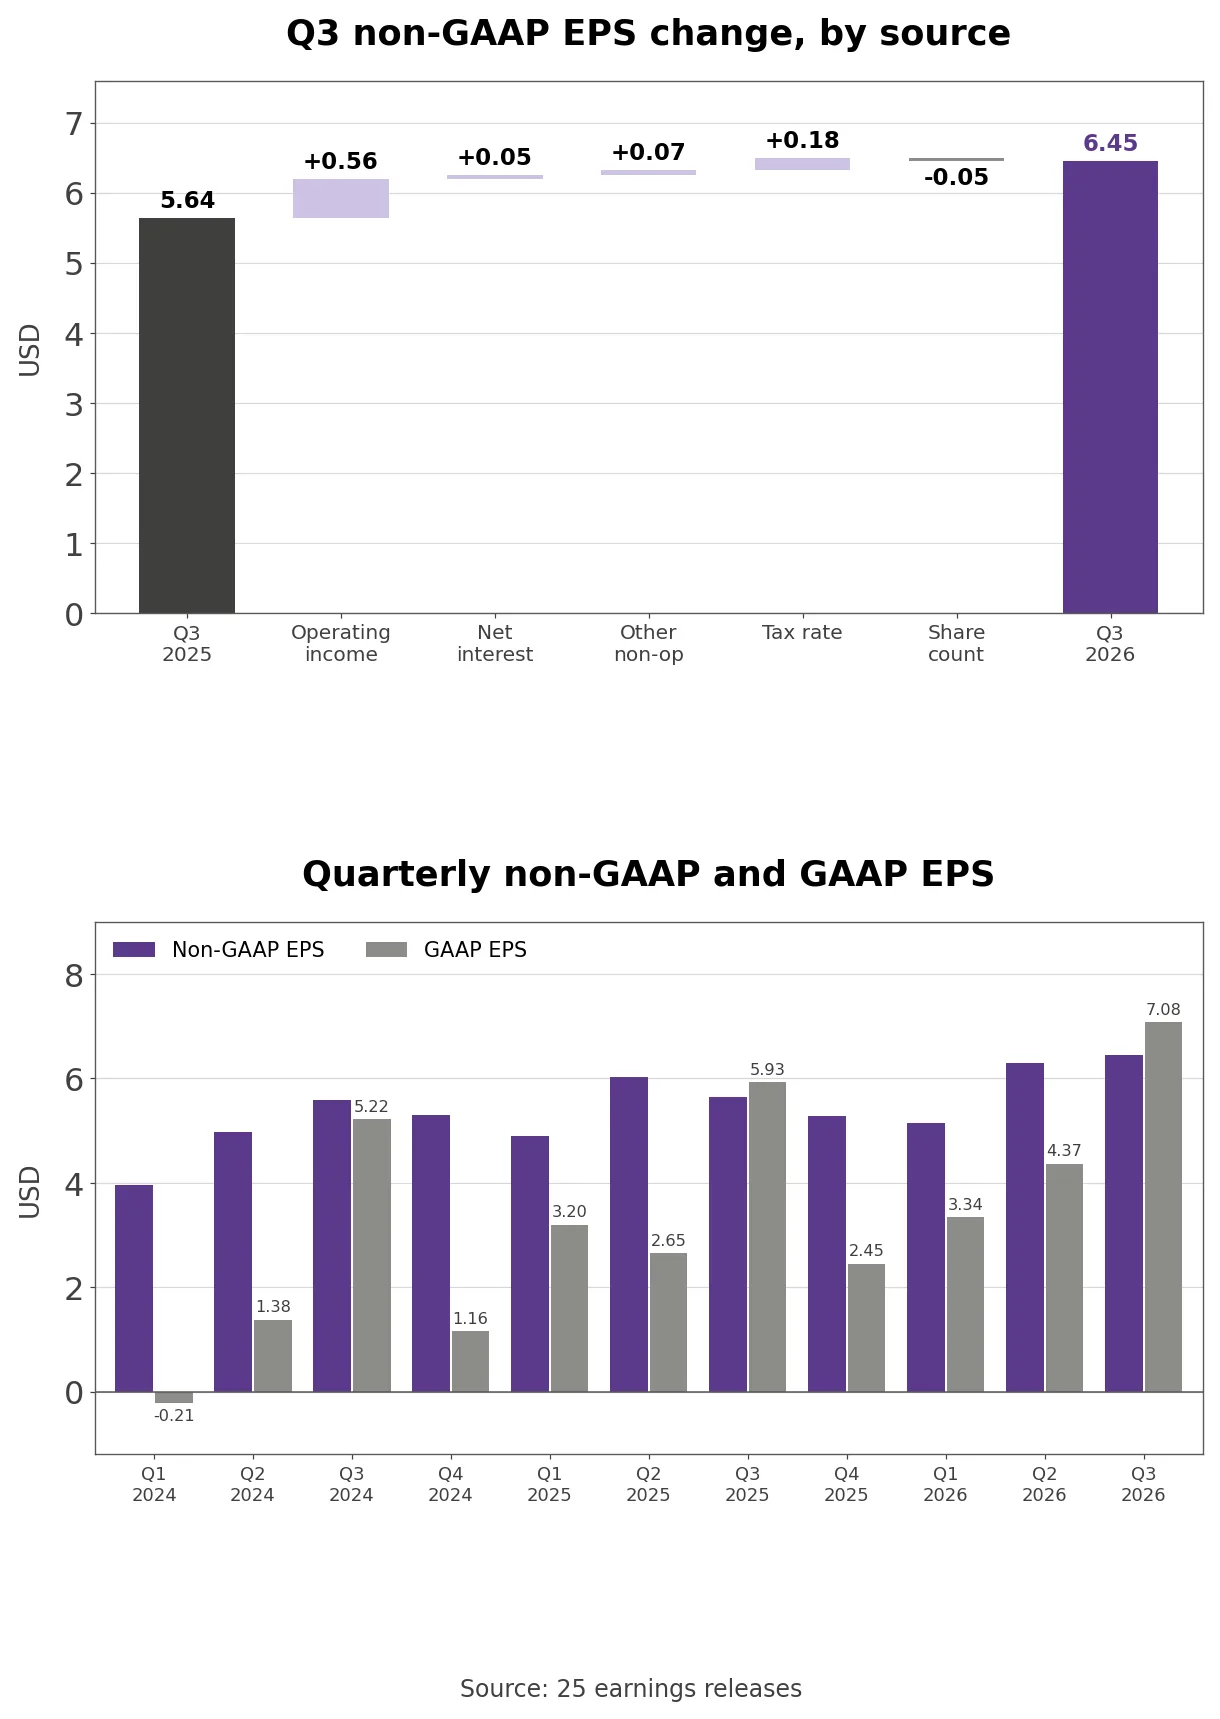
Q3 non-GAAP EPS change by source and quarterly non-GAAP vs GAAP EPS
Of the $0.81 increase in third-quarter non-GAAP EPS, operating income contributed $0.56 and the lower tax rate $0.18. Other non-operating income added $0.07 and lower net interest $0.05, while a higher share count took away $0.05. Operations account for 69.1% of the gain and tax for 22.1%.
The non-GAAP tax rate fell from 18.2% to 15.9%, which the company attributes to the mix of earnings by jurisdiction. Non-GAAP operating income rose +8.6% to $4.676 billion, about six-tenths of the EPS growth rate. R&D grew +11.4% to $2.105 billion and non-GAAP cost of sales +14.7% to $1.907 billion, both faster than sales; cost of sales includes profit-share payments on partnered drugs such as TEZSPIRE and EVENITY.
GAAP EPS of $7.08 exceeded non-GAAP EPS of $6.45 by $0.63. The $1.465 billion unrealized gain on Amgen’s roughly 17% stake in BeOne Medicines (formerly BeiGene) outweighed the $966 million of amortization and other items excluded from non-GAAP. The stake was worth $6.9 billion at September 30, up from $5.8 billion at the end of 2025. Over nine months, GAAP EPS was $14.79 and non-GAAP EPS $17.88.
How Amgen Makes Money
Amgen’s products fall into four therapeutic areas plus biosimilars. In general medicine, Repatha ($1.085 billion) leads, followed by EVENITY ($751 million) and Prolia ($632 million). Repatha is an injection that lowers LDL cholesterol by protecting the liver’s LDL receptors; slide 7 cites about 100 million patients not at their LDL goal. EVENITY, a bone-building osteoporosis drug, is sold with UCB, and TEZSPIRE, for severe asthma and nasal polyps, was developed with AstraZeneca.
The rare disease group brought in $1.611 billion, +20.0%. Thyroid eye disease drug TEPEZZA ($526 million) fell -6.1% on lower inventory, gout drug KRYSTEXXA ($419 million) grew +30.9%, and the autoimmune drug UPLIZNA ($451 million) nearly tripled. Inflammation includes TEZSPIRE ($538 million), Enbrel ($611 million) and Otezla ($481 million). Innovative oncology, led by leukemia drug BLINCYTO ($496 million), small cell lung cancer drug IMDELLTRA ($406 million), Vectibix and Nplate, totals $2.141 billion.
R&D spending was 21.3% of product sales. In the quarter, IMDELLTRA in first-line maintenance small cell lung cancer, TEZSPIRE in eosinophilic esophagitis and dazodalibep in Sjögren’s disease all reported positive Phase 3 results. The largest candidate is MariTide, an antibody-peptide conjugate that activates the GLP-1 receptor and blocks the GIP receptor. Jay Bradner said on the call: “MariTide is emerging as the first monthly therapy for obesity, with the potential for as few as 4 or 6 doses per year.” Ten Phase 3 studies are underway, with two more diabetes trials starting in the fourth quarter.
Biosimilars and Medicare Price Setting
Amgen loses sales to biosimilars and wins sales with them. Murdo Gordon said on the call: “Our biosimilar portfolio delivered 26% year-over-year growth, generating $977 million in sales in the third quarter.” That is about $202 million of new sales against the $758 million denosumab lost. PAVBLU, the EYLEA biosimilar, grew +40.8% to $300 million, while the older Avastin biosimilar MVASI fell -21% to $168 million on an 11% lower price.
Medicare price setting under the Inflation Reduction Act applies to Enbrel from 2026. Enbrel sales rose +5.3%, but net selling price fell 14%, offset by favorable changes to sales deductions (15 points) and higher inventory (8 points). Those offsets are not recurring, so the fourth quarter may look different. Otezla fell -17.8% on lower volume, unfavorable deductions and lower price.
Amgen vs. AbbVie and Other Large Biopharma
Revenue growth and forward P/E at Amgen AbbVie Bristol Myers Gilead and Regeneron
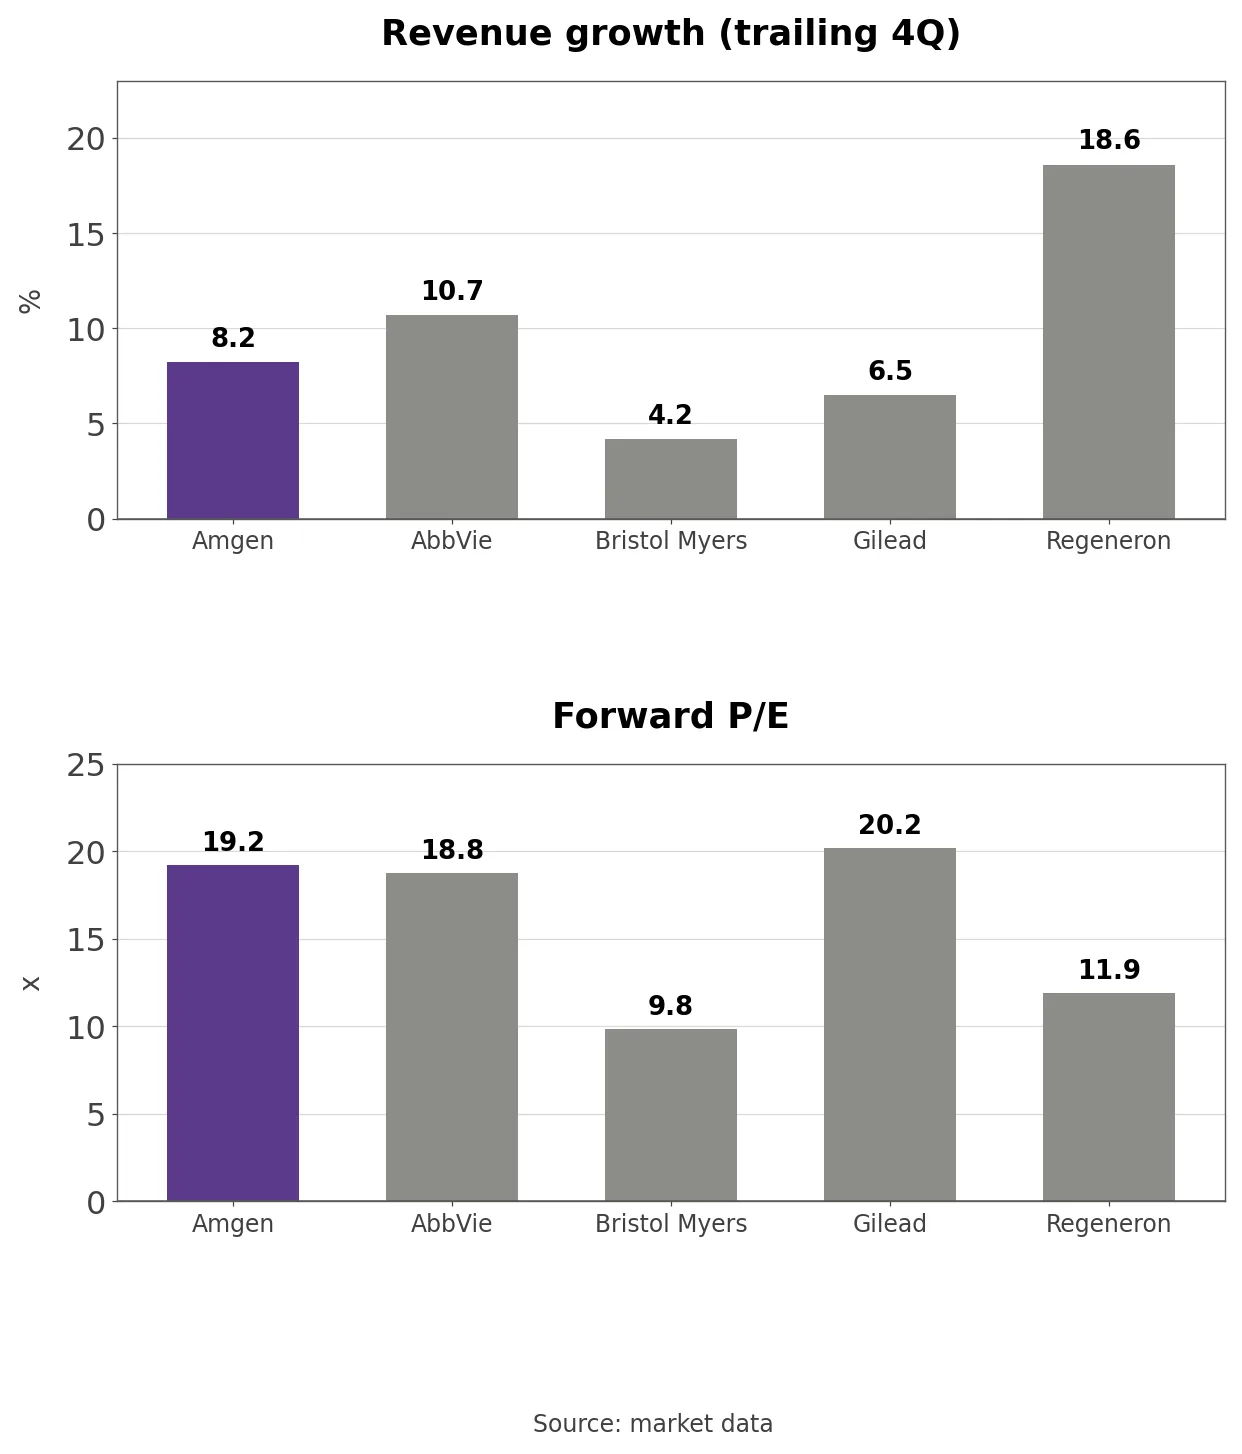
The peers are four large U.S. drugmakers working through patent expirations and product transitions. Trailing four-quarter revenue growth is 8.2% for Amgen, 10.7% for AbbVie, 4.2% for Bristol Myers Squibb, 6.5% for Gilead and 18.6% for Regeneron.
Forward P/E is 19.20x for Amgen, 18.75x for AbbVie, 9.84x for Bristol Myers, 20.16x for Gilead and 11.88x for Regeneron. Dividing forward P/E by revenue growth gives 2.34 for Amgen and Bristol Myers, 1.75 for AbbVie, 0.64 for Regeneron and 3.10 for Gilead, so on growth-adjusted terms Amgen sits on the expensive side.
Price to free cash flow and shareholder yield at Amgen and four peers
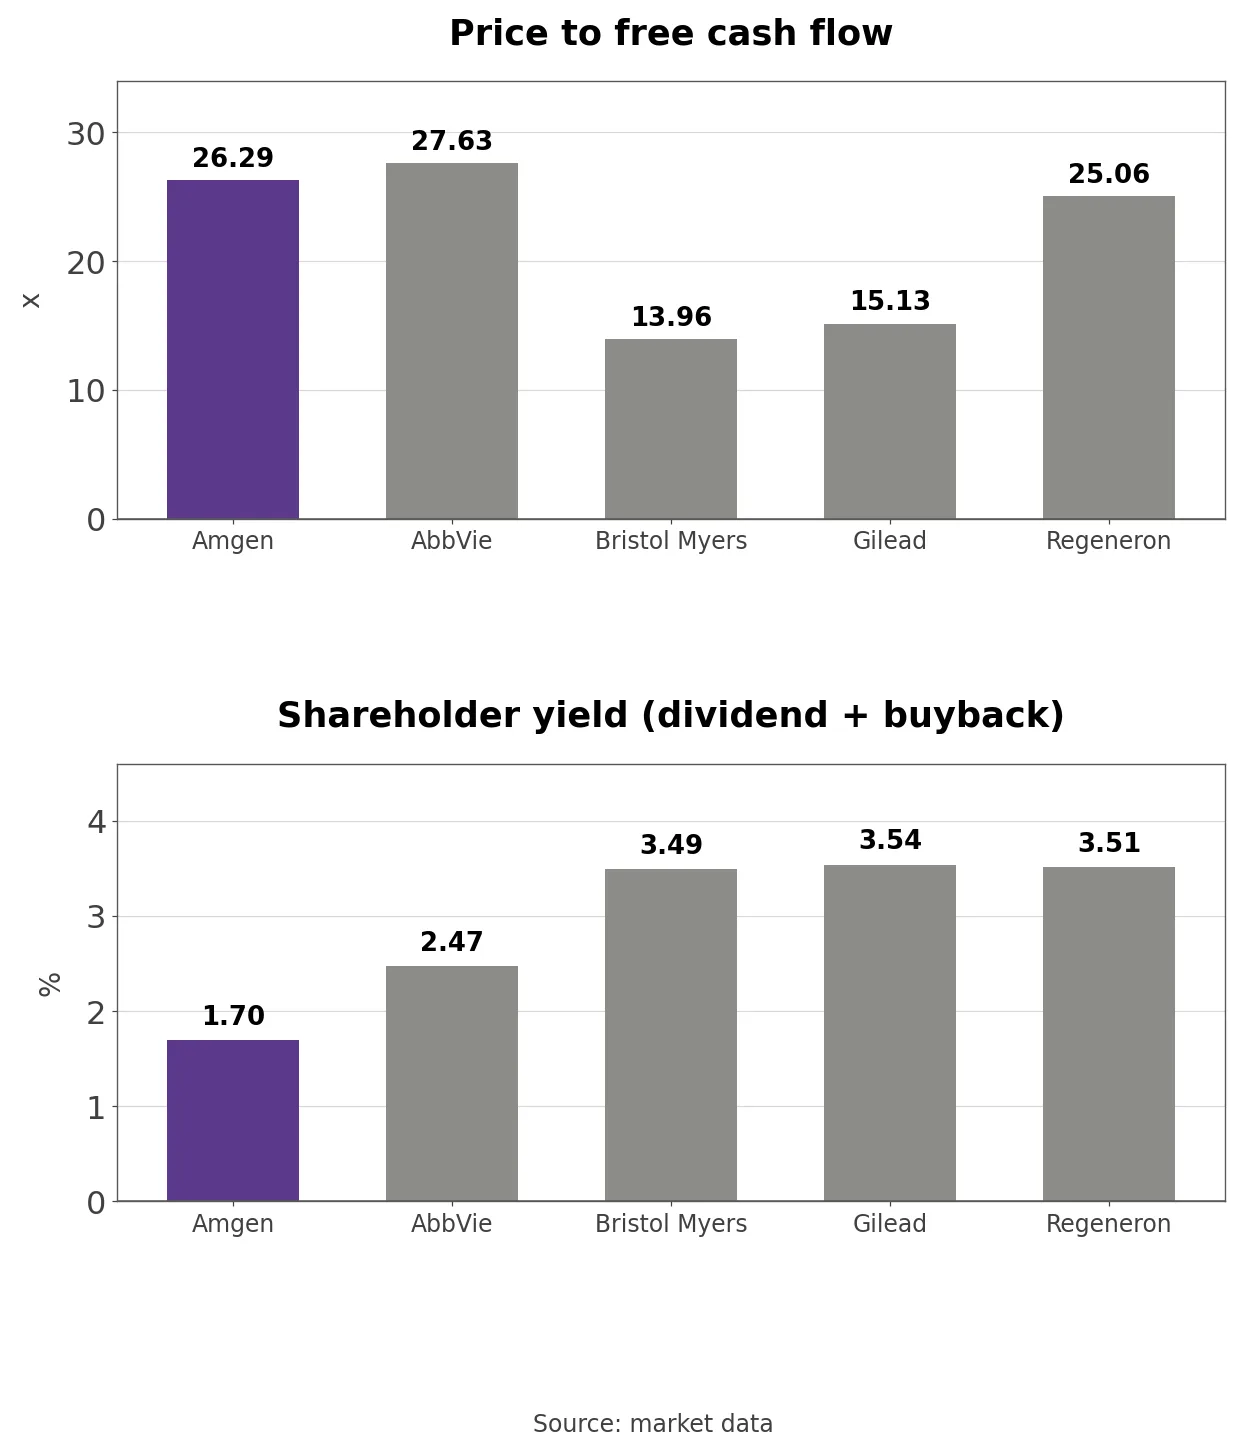
Price to free cash flow is 26.29x for Amgen and 27.63x for AbbVie, against about 15x for Bristol Myers and Gilead. Shareholder yield, dividends plus buybacks, is lowest at Amgen at 1.70%: the dividend yields 2.17% but a rising share count takes away 0.46%. Cash goes to dividends first while Amgen pays down Horizon debt.
GAAP P/E and Non-GAAP P/E Bands
Amgen GAAP P/E and non-GAAP P/E over 60 months
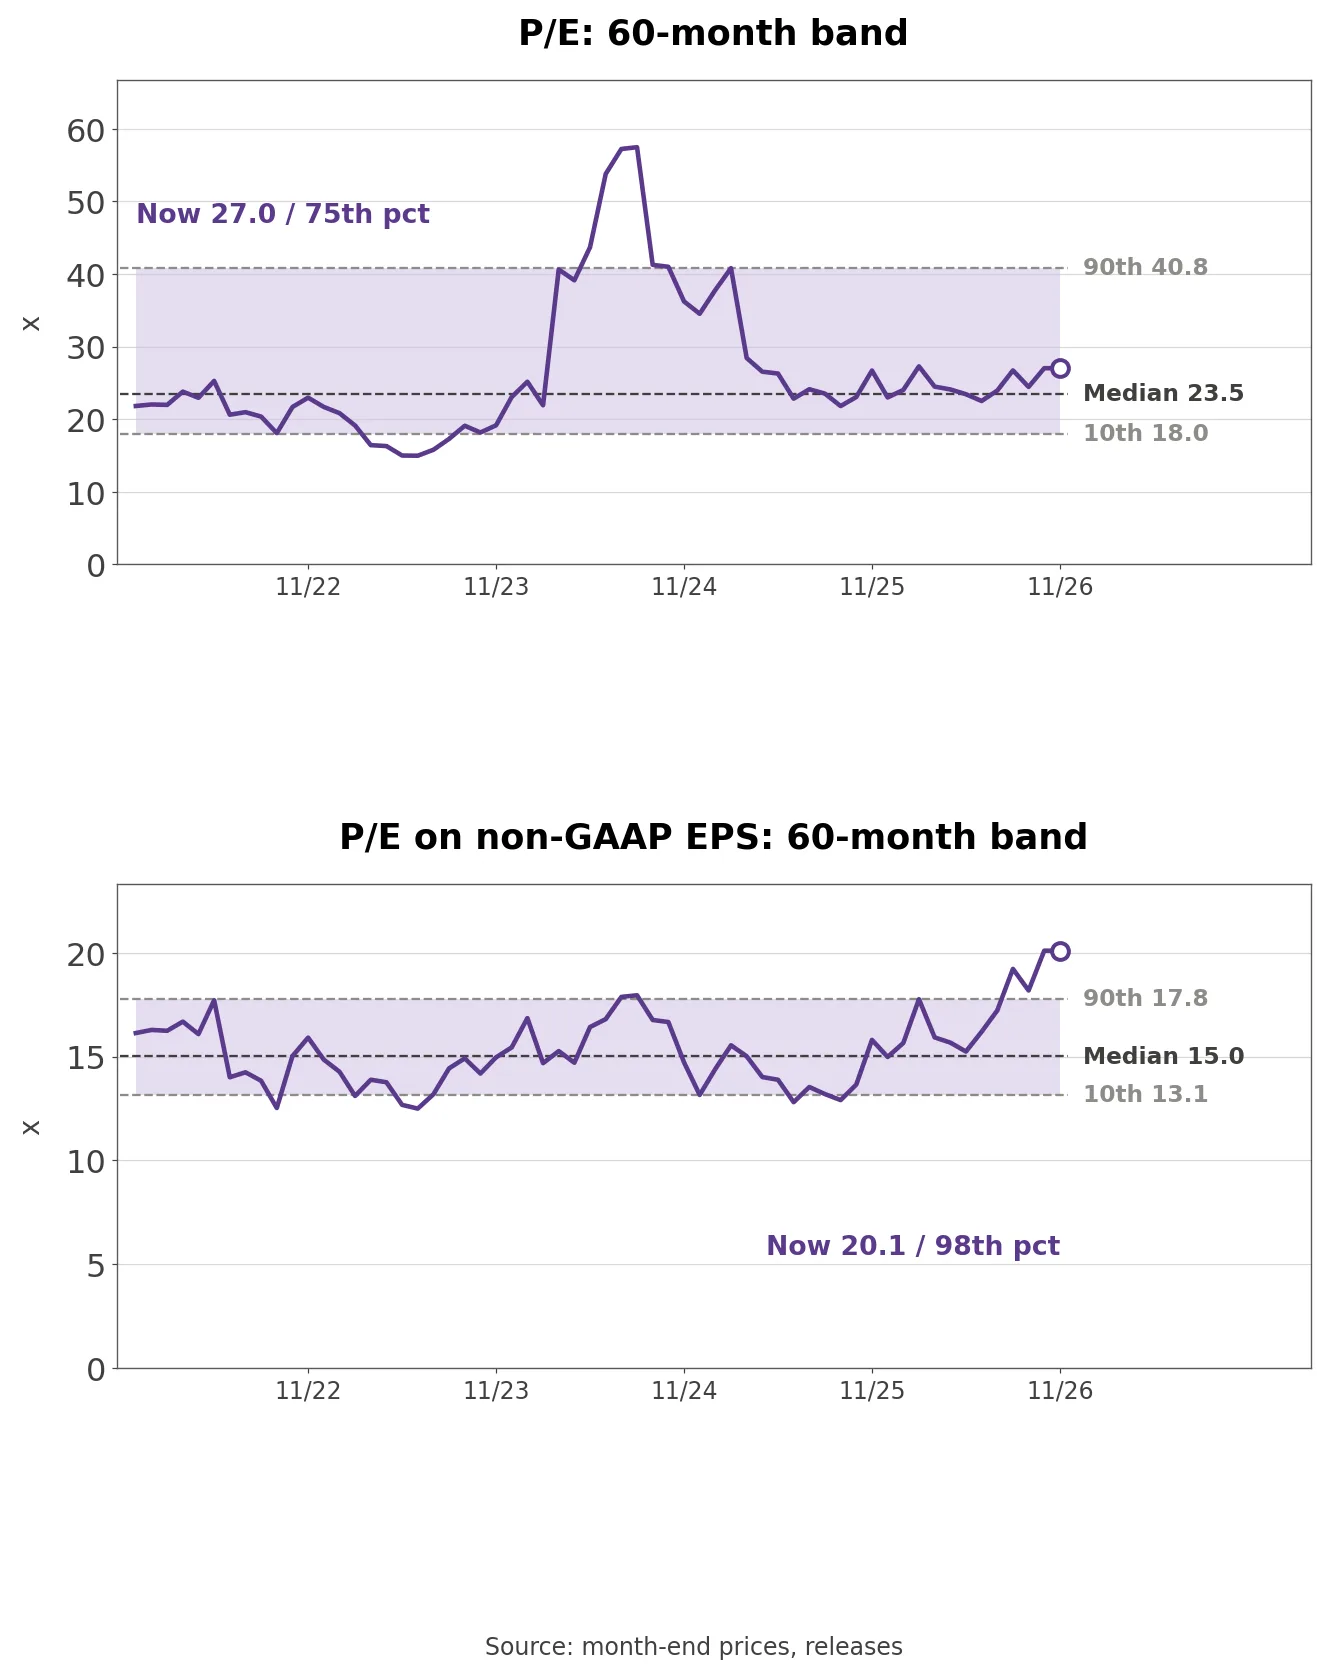
The bands use trailing four-quarter EPS (TTM). On trailing GAAP EPS of $17.24, the P/E of 27.01x sits at the 75.0th percentile of 60 months, against a median of 23.48x. The high was 57.46x in August 2024, when acquisition amortization weighed on GAAP earnings, and the low 14.97x in June 2023.
The non-GAAP P/E of 20.09x on trailing EPS of $23.18 sits at the 98.3rd percentile, second only to 20.10x a month earlier. The median is 15.02x and the low was 12.49x in June 2023.
Own calculation: A year ago, at the end of November 2025, the stock was $345.46 and the non-GAAP P/E 15.80x. Since then the stock has risen +34.8% while trailing non-GAAP EPS grew +6.0%, from $21.87 to $23.18. Most of the gain came from a 27.2% higher multiple rather than from earnings.
On the 2026 guidance midpoint the stock trades at 20.0x, and at 19.4x after removing the BeOne stake of about $12.76 per share.
Three Conditions That Move the Stock
Quarterly denosumab sales show when the decline ends. If the drop from $920 million narrows, the +20% growth of the rest of the portfolio shows up in total growth. If it widens, it eats into the drivers’ gains again.
Non-GAAP operating margin shows the quality of the growth. Guidance implies about 41% in the fourth quarter, and 2027 should not fall below 2026 guidance. The test is whether sales outpace profit-share costs and R&D growth.
Phase 3 results move the multiple. A rival’s trial failure cost the stock -10.1% in a day in September, and an analyst on the call framed a question around MariTide data next year. Strong MariTide and olpasiran results would make today’s multiple look low; weak ones would argue for a return toward the 15x median.
How Fast Can Amgen Grow After Denosumab Bottoms?
Denosumab is now 9.3% of product sales, or $3.68 billion a year at the third-quarter rate. That is the most it can still take out of growth; in the third quarter it removed the equivalent of 8.3% of year-ago product sales.
Once the decline stops, product sales growth converges on the ex-denosumab rate, which was +20.2% in the third quarter. Of the $1.504 billion ex-denosumab gain, UPLIZNA and IMDELLTRA contributed $524 million, 34.8%, and new launches usually slow. Can growth excluding denosumab stay in double digits after the launch effect fades?