Novo Nordisk A/S (NYSE: NVO) raised its 2026 outlook on a third-quarter adjusted operating profit that grew +27% at constant exchange rates. The company’s own adjusted earnings per share fell -11.7% in the same quarter, to DKK 5.79 from DKK 6.56. The two measures exclude different items, and that gap decides whether Novo’s “growth recovery” is visible in earnings or only in one of its adjusted lines.
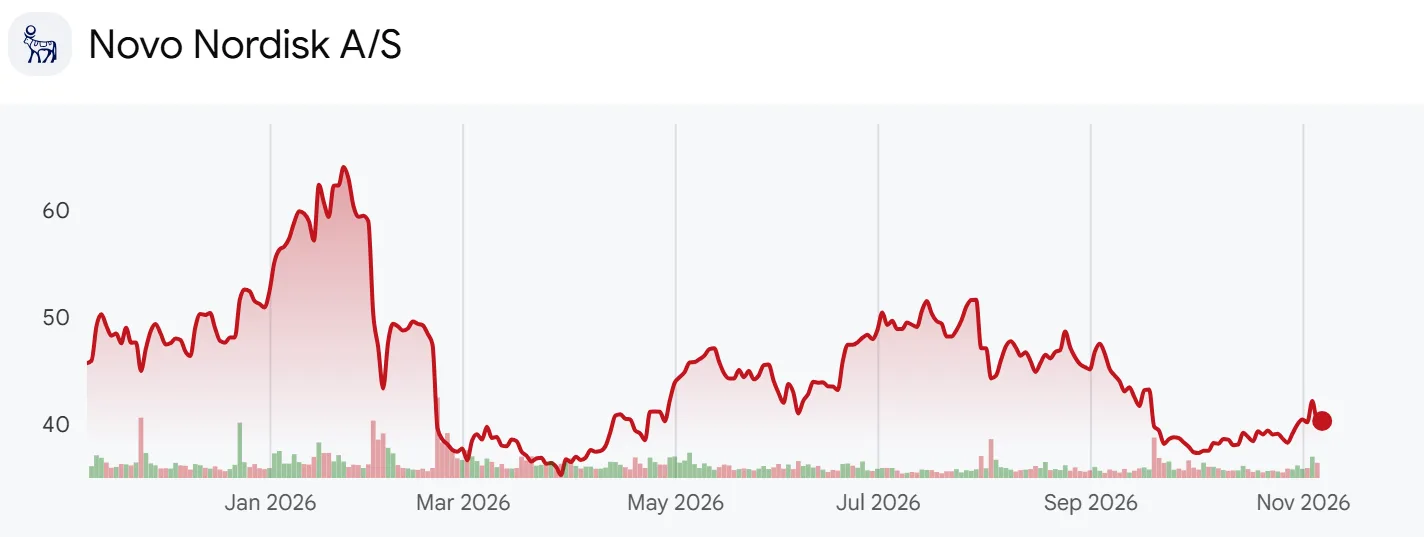
Novo Nordisk one-year ADR price chart ending near 40 dollars
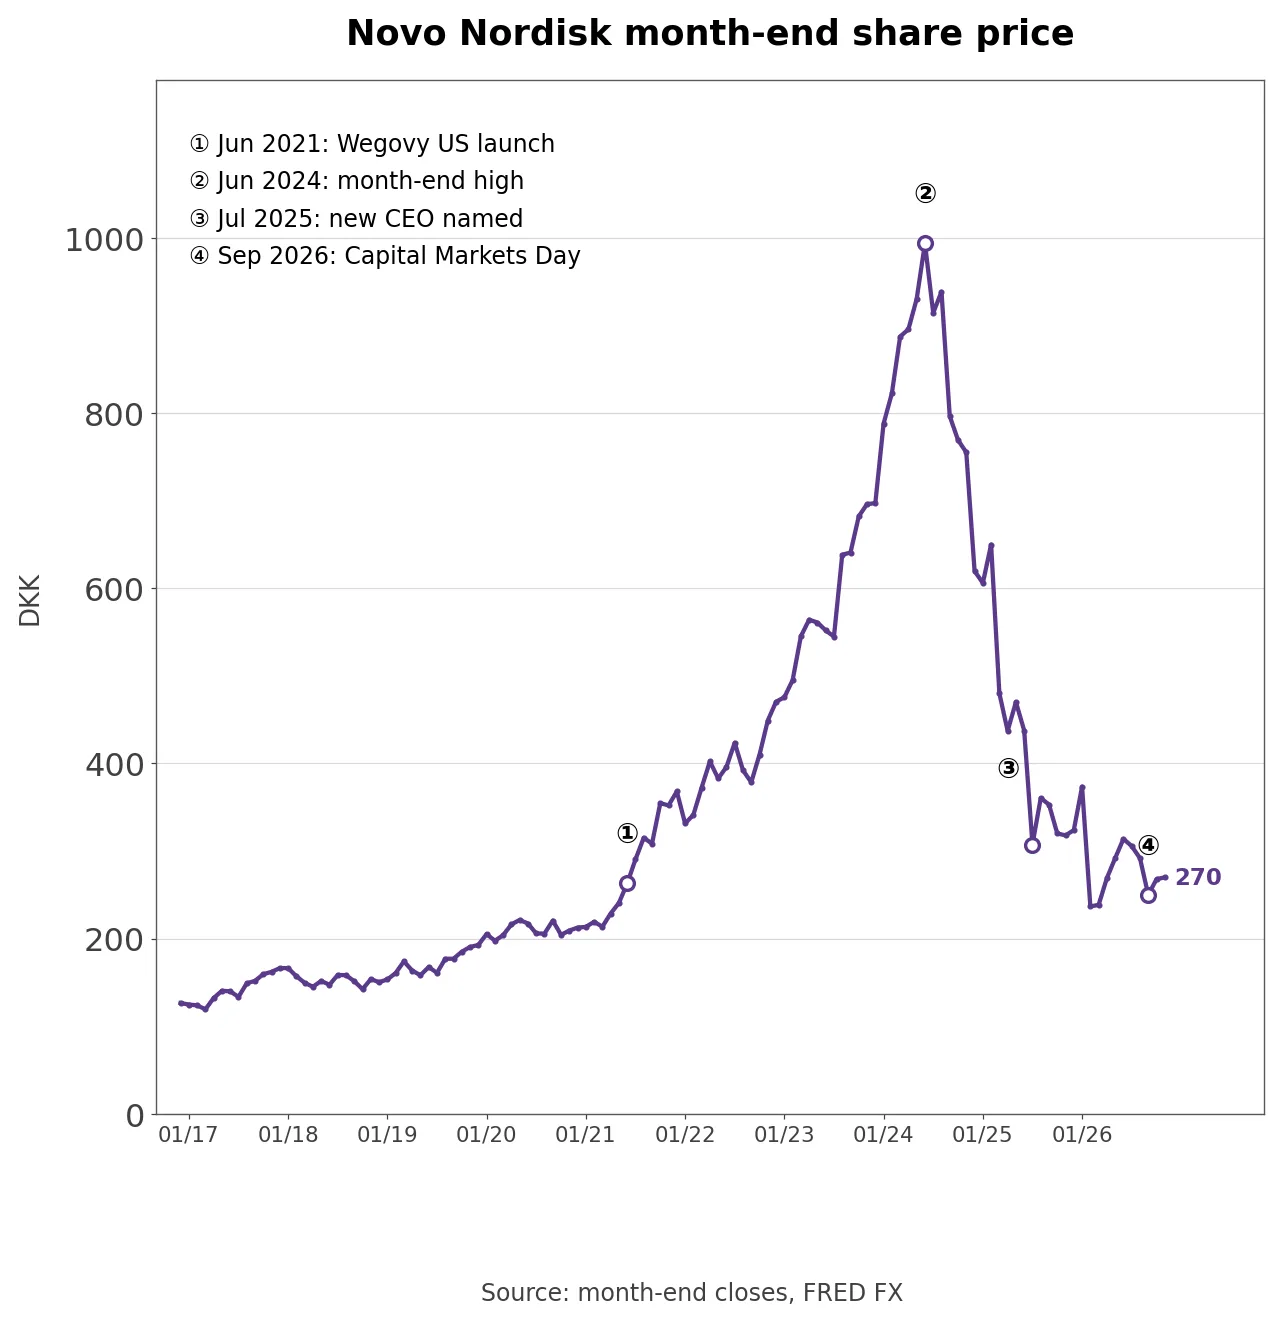
Novo Nordisk is the Danish maker of Wegovy for obesity and Ozempic for type 2 diabetes, and semaglutide products now drive most of its sales. It reports in Danish kroner under IFRS with a December year-end, and each NYSE-listed ADR represents one B share. The ADR at $40.31 converts to DKK 269.86 at the FRED rate of 6.6946, within 1% of the DKK 267.29 average price in the company’s own buyback on November 2. On 4,409 million shares outstanding excluding treasury stock, that is a market value of about $177.7 billion, and the share price sits -72.8% below its June 2024 month-end high of DKK 994.
I compared the Q3 2026 results 6-K, the 98-page Q3 investor presentation, the September Capital Markets Day finance deck and the November 4 call with all 35 quarterly results releases since 2018 and 36 weekly buyback filings from 2026. Novo files no quarterly XBRL, so quarterly figures come from the release tables, and pre-2023 EPS is restated for the 2-for-1 split.
The Adjusted P&L Slide and the Restructuring Base
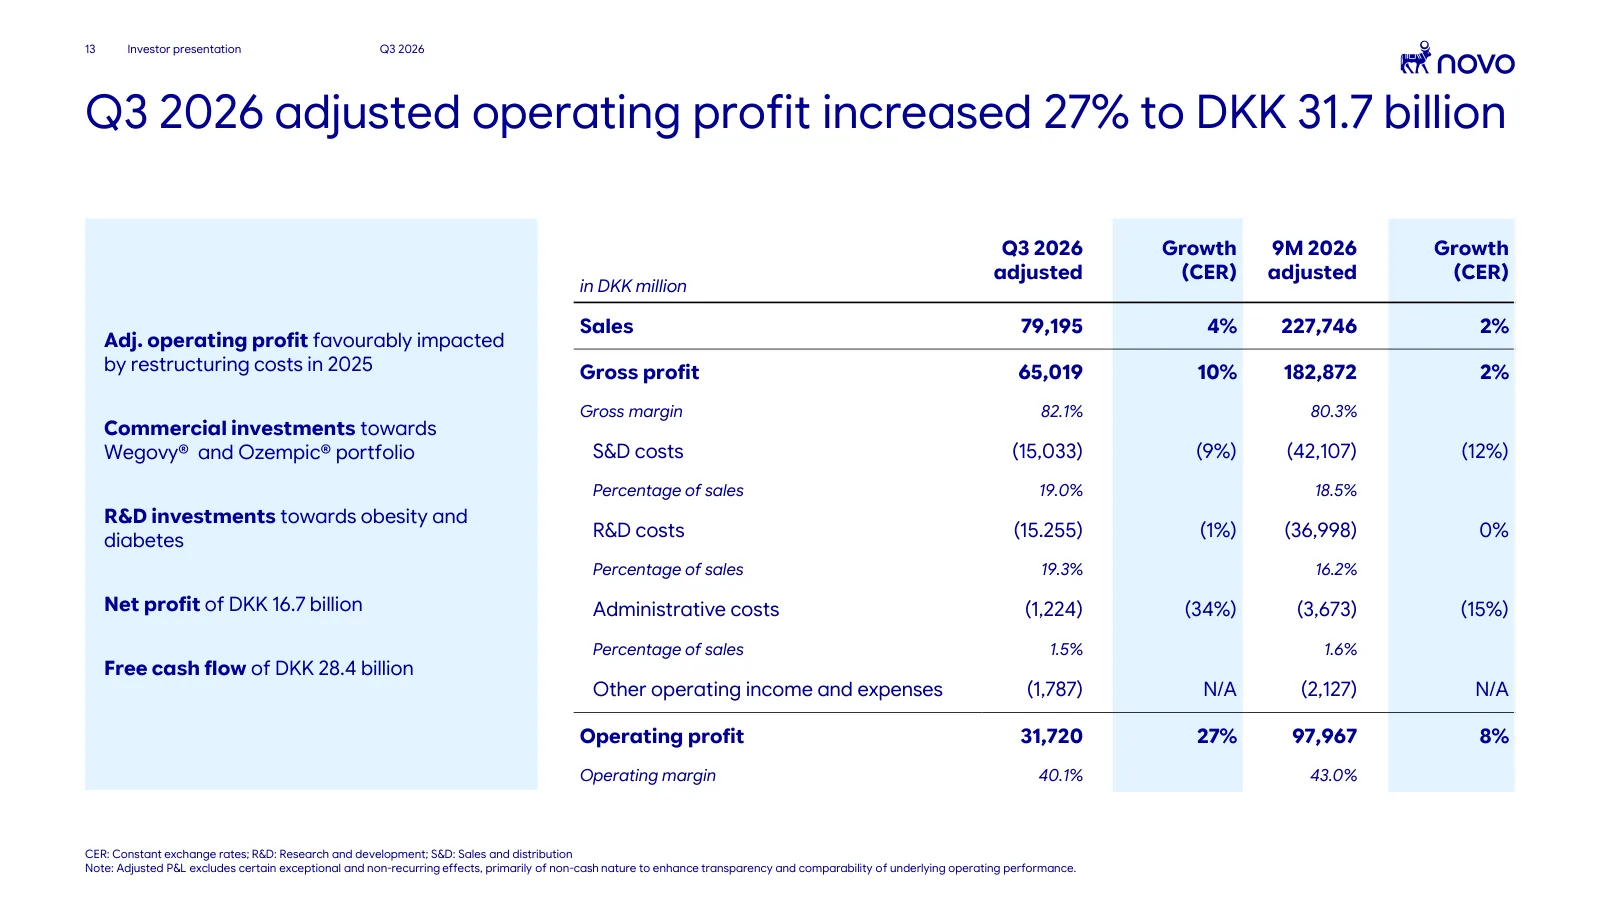
Page 13 of the Q3 presentation is titled “Q3 2026 adjusted operating profit increased 27% to DKK 31.7 billion.” It shows adjusted sales of DKK 79.2 billion (+4%), an adjusted gross margin of 82.1%, R&D at 19.3% of sales and an adjusted operating margin of 40.1%. The first line of the text box says adjusted operating profit was favourably impacted by restructuring costs in 2025, so the company itself flags that the headline growth rate stands on a depressed base.
Q3 2026 investor presentation page 13 with adjusted operating profit up 27% to DKK 31.7 billion
The same table shows sales and distribution costs of DKK 15.0 billion, down 9% at CER, and administrative costs of DKK 1.2 billion, down 34%, while adjusted R&D was roughly flat at DKK 15.3 billion. Those two cost lines are where the 2025 restructuring shows up. The rest of the text box lists net profit of DKK 16.7 billion and free cash flow of DKK 28.4 billion for the quarter, and R&D spending directed at obesity and diabetes.
Company disclosure (Q3 earnings call, Nov 4 2026): CFO Karsten Munk Knudsen said about DKK 3.5 billion of one-off costs in R&D and other operating expenses partly offset the growth.
Reported operating profit was DKK 23.0 billion, -9% at CER, after DKK 8.7 billion of impairments: DKK 4.6 billion on the ziltivekimab program and DKK 4.1 billion on right-sizing the manufacturing network. Nine-month impairments reached DKK 15.0 billion, including DKK 4.0 billion on the obesity candidate monlunabant. The 5.1-point gap between the reported gross margin of 77.0% and the adjusted 82.1% equals the DKK 4,061 million manufacturing charge divided by sales.
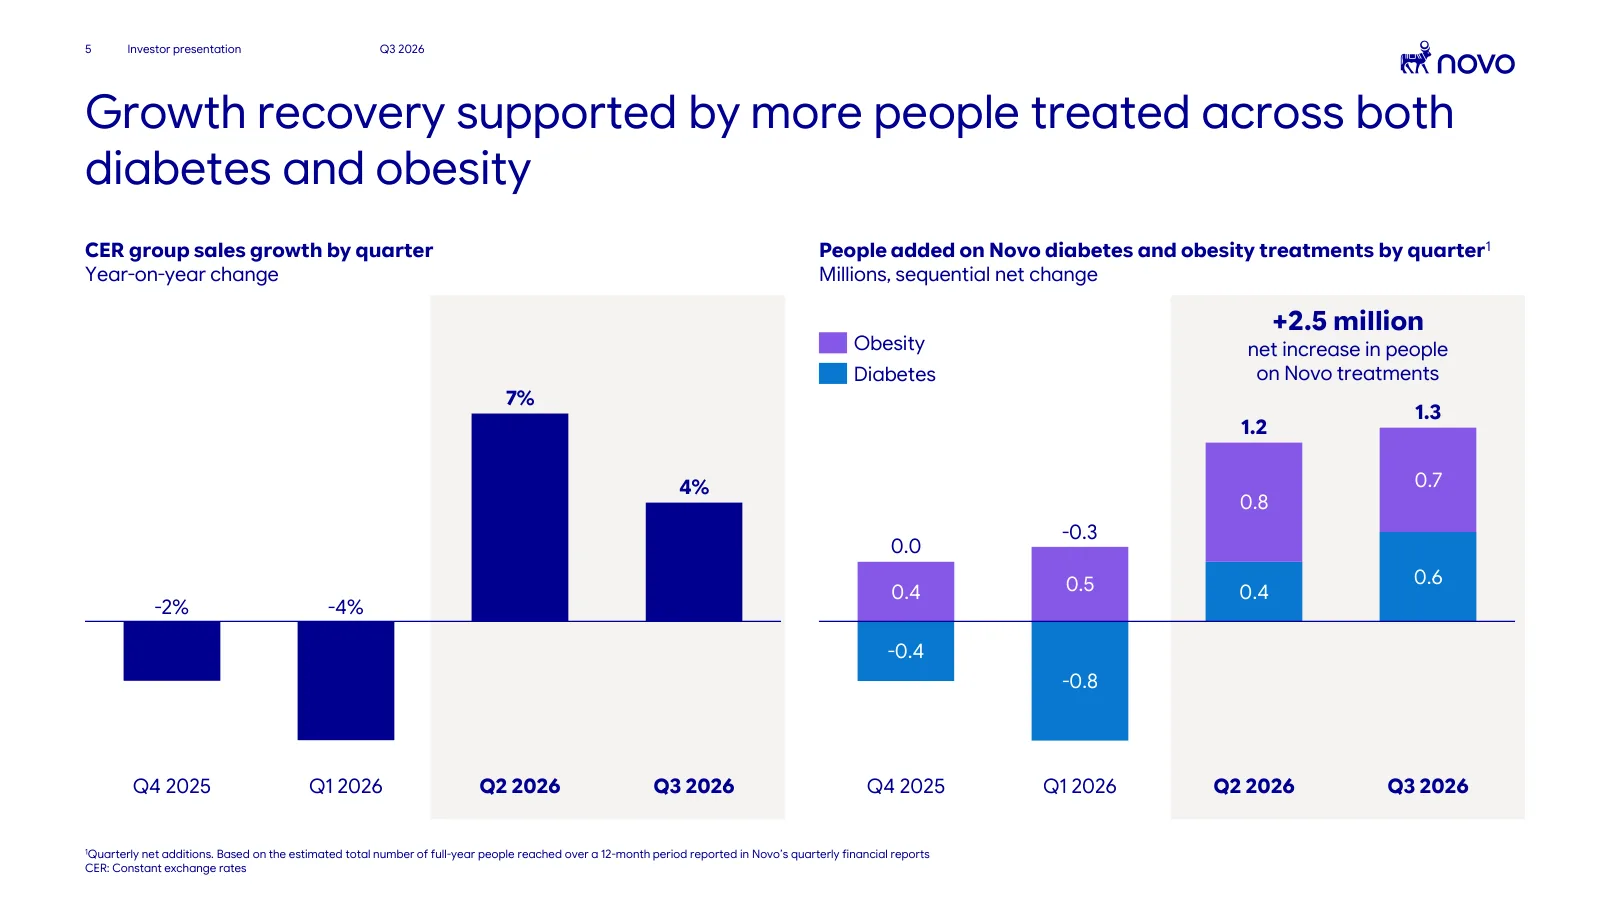
Page 5 charts constant-currency sales growth of -2% in Q4 2025, -4% in Q1 2026, +7% in Q2 and +4% in Q3, alongside net patient additions of 1.2 million in Q2 and 1.3 million in Q3. CEO Mike Doustdar said on the call that about 48 million people now use Novo’s diabetes and obesity treatments, 2 million more than a year ago.
Q3 2026 investor presentation page 5 with quarterly CER sales growth and patients added
Patient growth and sales growth are not the same thing. US operations head Jamey Millar said on the call that US injectable Wegovy volume rose about 10% from the second quarter, yet US injectable Wegovy sales were -13% lower than a year earlier. Price fell faster than volume grew.
The Raised 2026 Outlook and the 2030 Sales Ambition
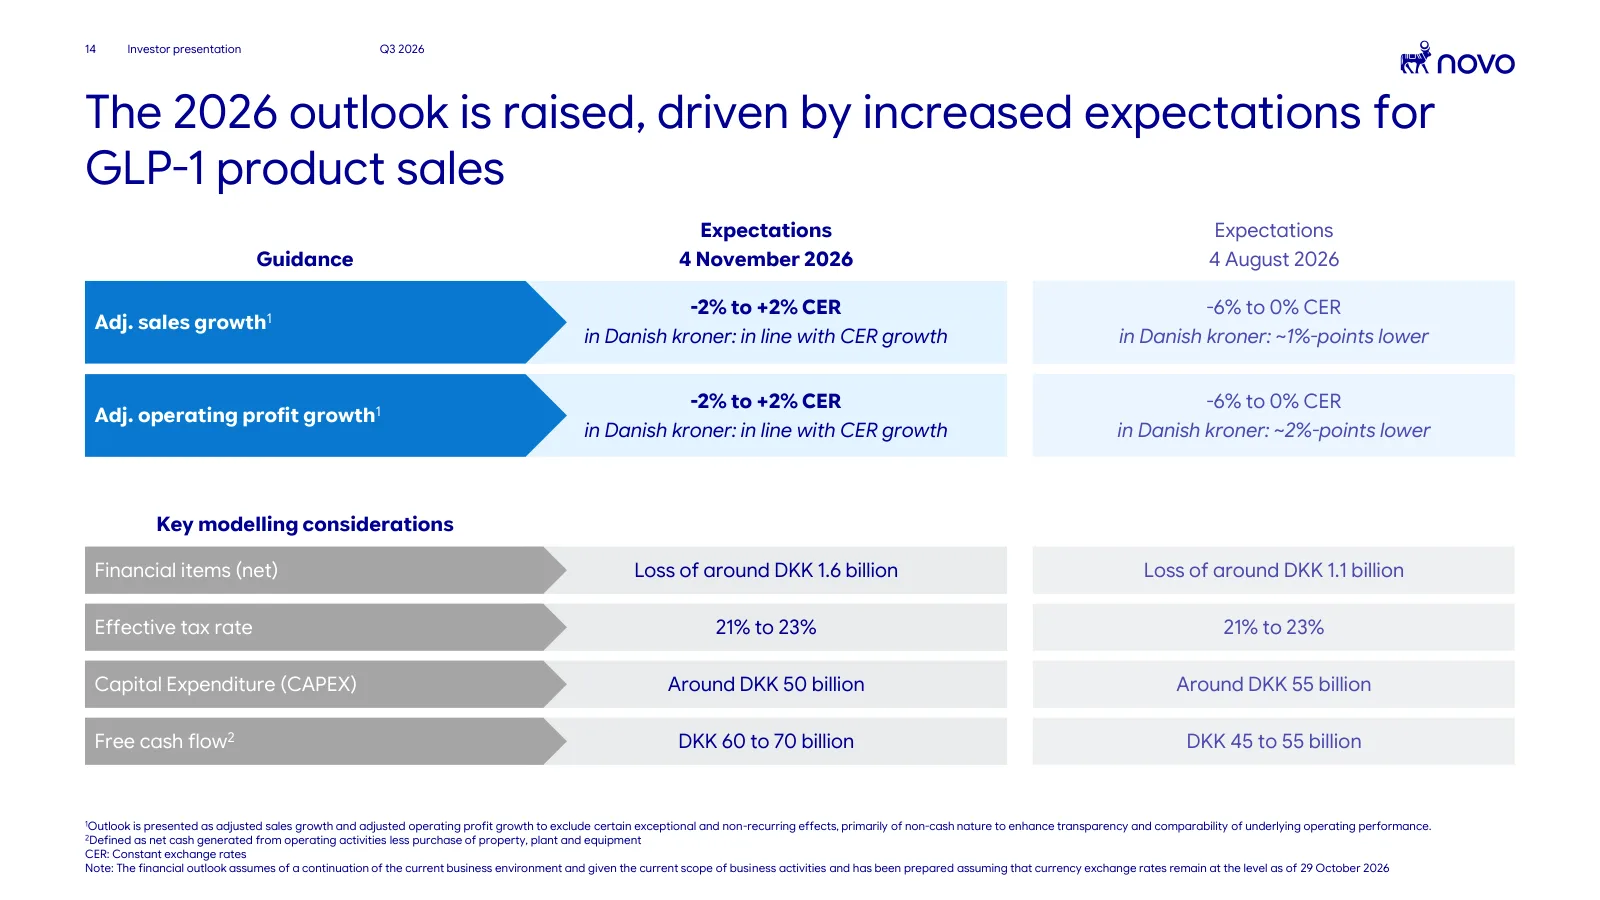
Page 14 shows adjusted sales growth and adjusted operating profit growth both raised from -6% to 0% at CER in August to -2% to +2% in November. The free cash flow outlook rose from DKK 45-55 billion to DKK 60-70 billion and capital spending was trimmed from about DKK 55 billion to about DKK 50 billion. The modelling notes assume an effective tax rate of 21% to 23%, a net financial loss of about DKK 1.6 billion and exchange rates held at their October 29 level.
Q3 2026 investor presentation page 14 with the 2026 outlook raised to -2% to +2% at CER
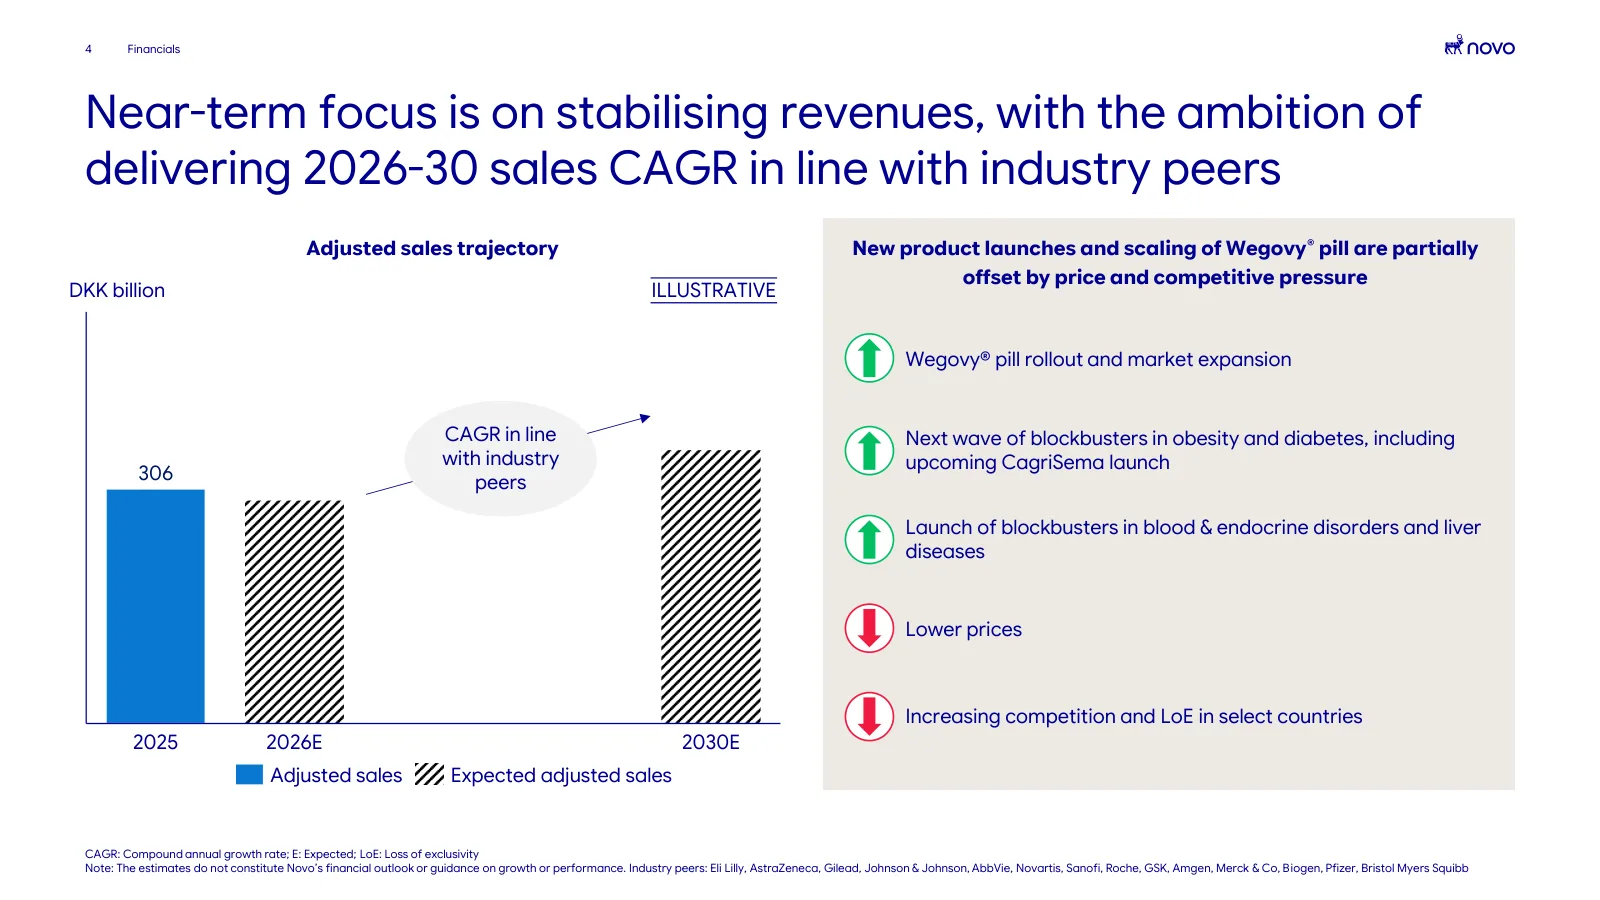
Own calculation (35 results releases, Q3 deck page 14): 2025 adjusted sales were DKK 306.5 billion after removing the DKK 2.6 billion 340B reversal from Q2 2025, matching the DKK 306 billion on page 4 of the Capital Markets Day deck. Applying -2% to +2% and subtracting nine-month adjusted sales of DKK 227.7 billion implies fourth-quarter adjusted sales of DKK 72.6 billion to DKK 84.8 billion, a range of -8.3% to +7.2% against the DKK 79.1 billion of Q4 2025. The midpoint is -0.5%.
Page 20 sets a 2026-2030 revenue CAGR “in line with industry peers,” which Doustdar described as mid-single digits, and lists CagriSema in 2027, cagrilintide in 2028 and zenagamtide in 2029 as the launches meant to deliver it. Page 4 of the September 21 finance deck is blunter: “Near-term focus is on stabilising revenues.” Its right-hand box lists the Wegovy pill and new launches as positives and lower prices and loss of exclusivity in some countries as negatives.
Capital Markets Day finance deck page 4 with 2025 adjusted sales of DKK 306 billion
Pages 7 to 9 of the same deck set the cost frame. The adjusted gross margin fell from 83% in 2021 to 81% in 2025 and is meant to stay broadly stable, the adjusted SG&A ratio fell from 29% to 23% and should keep easing, and the adjusted R&D ratio rose from 13% to 17% and should keep rising. Page 5 records a cut of 13,000 full-time employees, or 16%, between August 2025 and August 2026. Knudsen is leaving at year-end after his last earnings call, and Luigi La Corte, the CFO of Galderma, will replace him.
The Bull and Bear Case for Novo Nordisk Stock
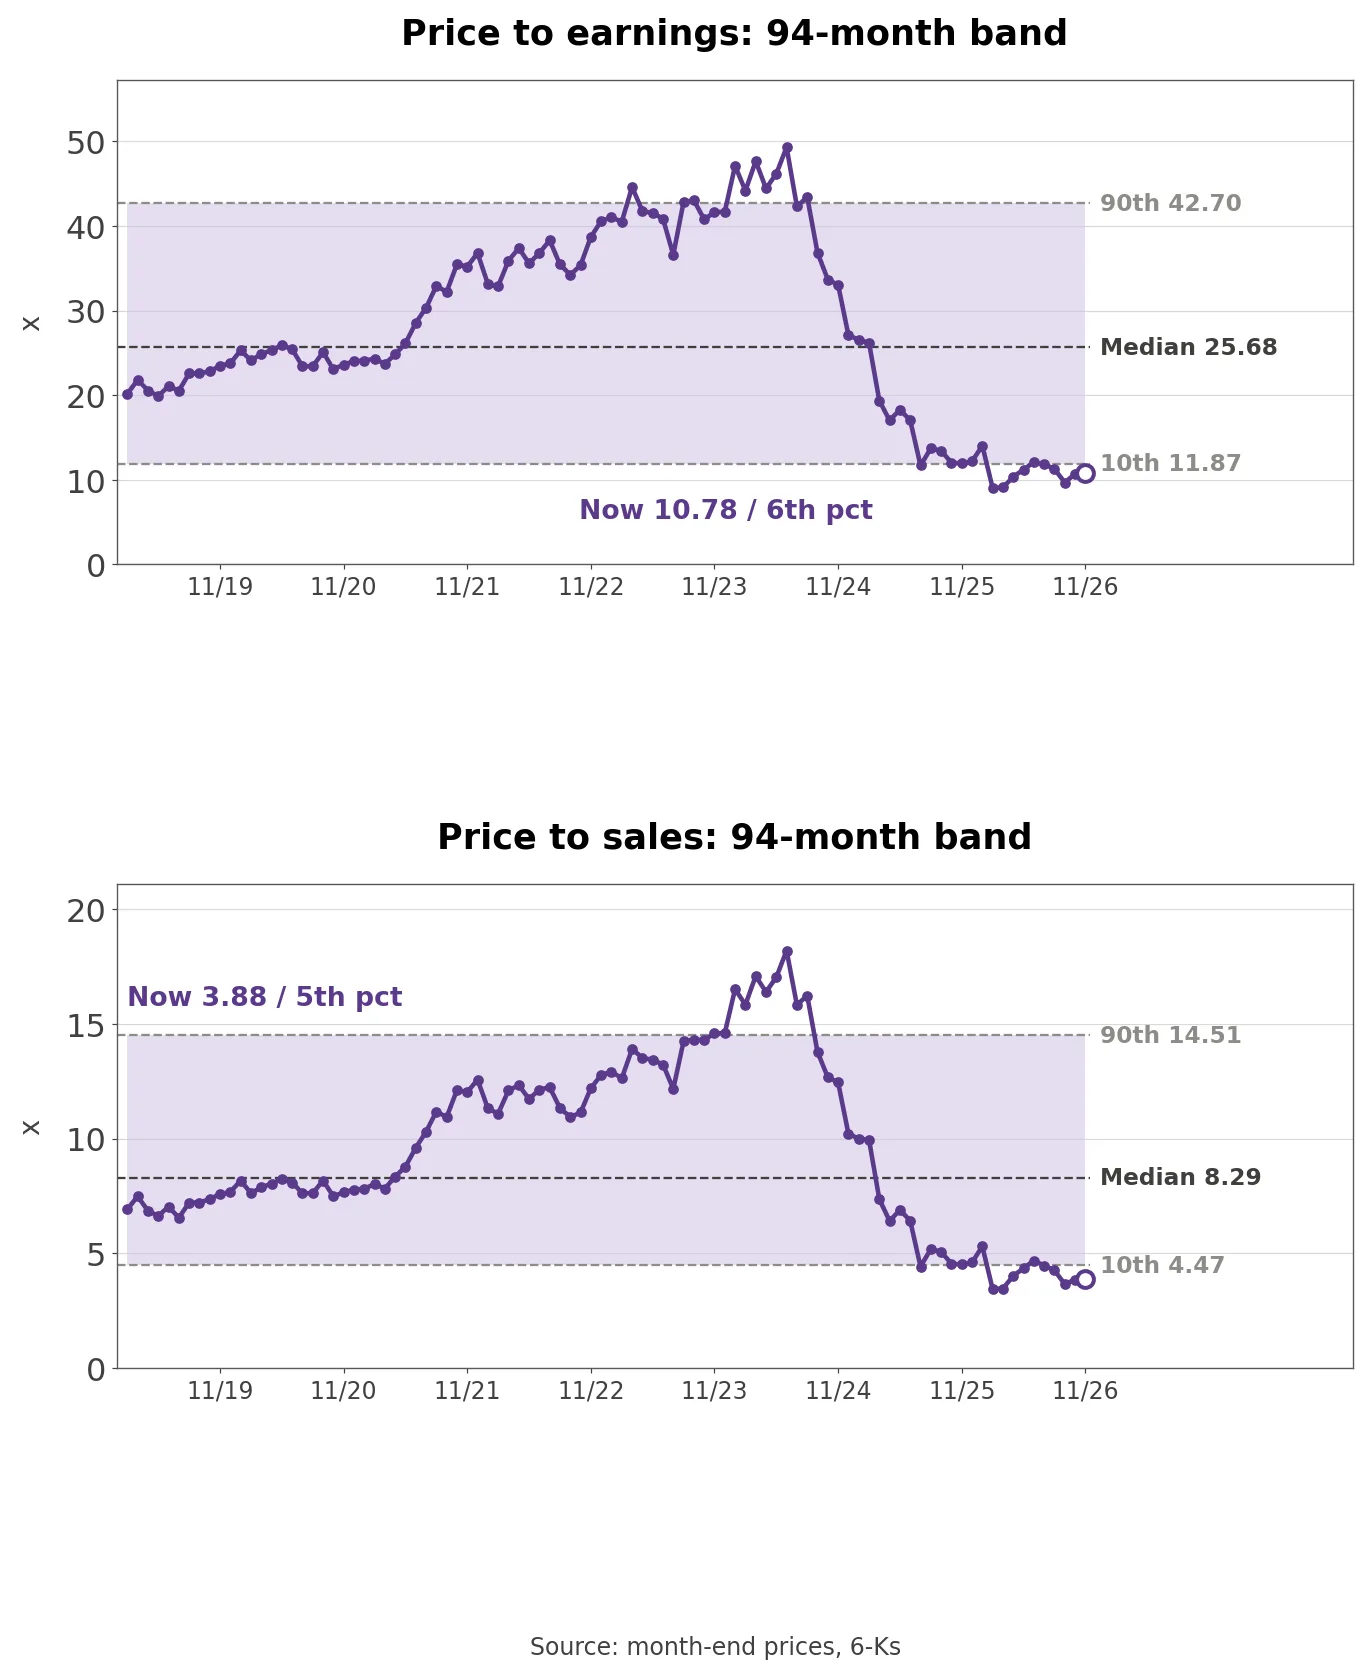
The bull case is volume and valuation. Obesity sales rose +22% at CER in the third quarter, both business units grew again, and a P/E of 10.78 on company-adjusted EPS is less than half the 94-month median of 25.68.
The bear case is US pricing and the gap between adjusted measures. US sales grew only 1% at CER, and the outlook assumes that the most-favoured-nation pricing agreement amplifies falling realised prices. Adjusted operating profit grew in a quarter when adjusted EPS shrank. BNP Paribas analyst Peter Verdult said on the call that the question investors ask most is whether Novo can return to sales growth in 2027, and Doustdar said guidance would come in February.
From the Wegovy Launch to a New CEO
Novo spent decades as an insulin company. The US launch of Wegovy in June 2021 turned it into an obesity company, and quarterly sales rose from DKK 33.1 billion in Q2 2021 to DKK 85.7 billion in Q4 2024. The 2-for-1 split came in 2023, and the share price peaked at DKK 994 at the end of June 2024.
Novo Nordisk month-end share price in kroner over 120 months with four dates
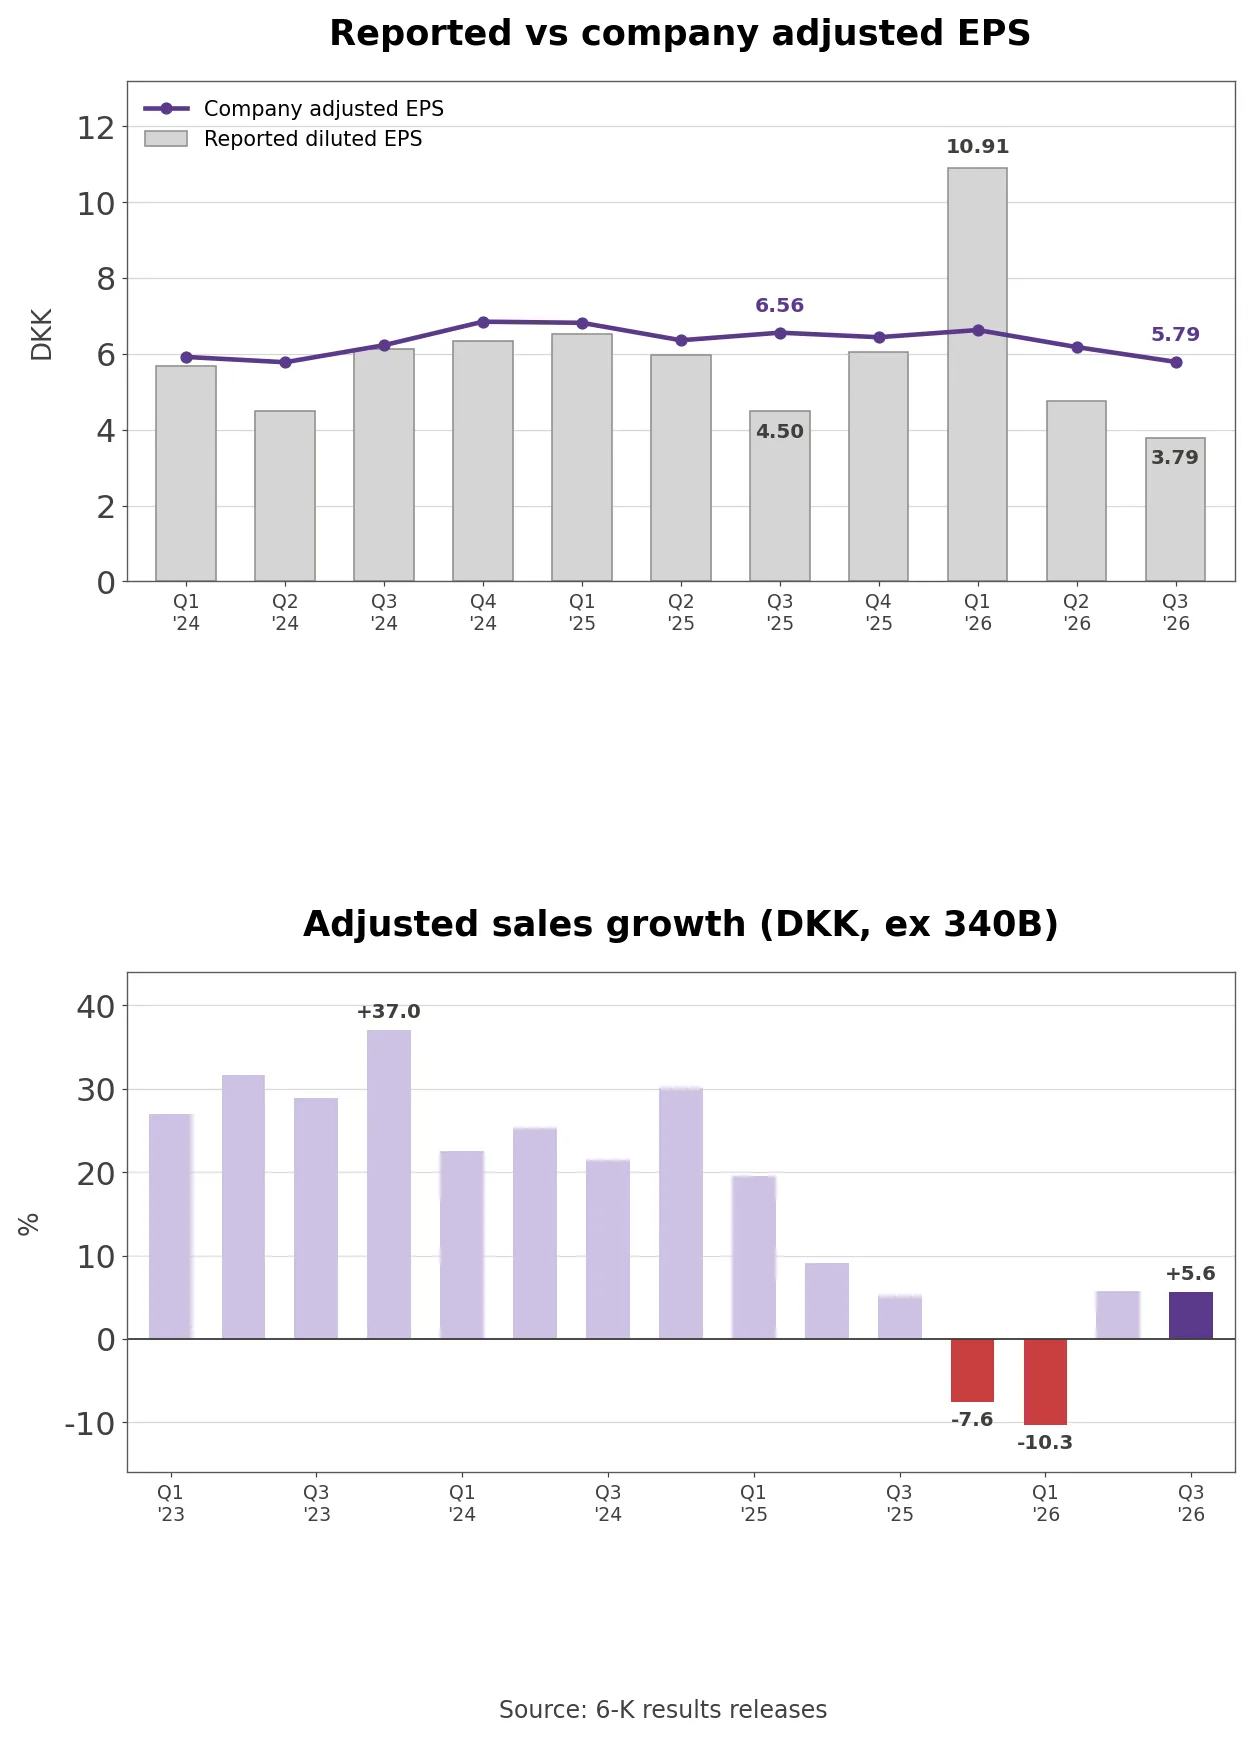
The turn came in 2025. As Eli Lilly gained share in the US with its own incretin drug, Novo’s adjusted sales growth in kroner slowed from 30.1% in Q4 2024 to 5.1% in Q3 2025. In July 2025 Novo named Mike Doustdar to succeed Lars Fruergaard Jørgensen as CEO, and in the third quarter it booked about DKK 9 billion of company-wide transformation costs, cutting operating profit by 30% in kroner. At the September 2026 Capital Markets Day it reset its ambition to industry-average growth.
Why Adjusted Profit and Adjusted EPS Moved Apart
Adjusted operating profit excludes major impairments, major legal matters and 340B reversals but keeps restructuring costs, while adjusted EPS also strips out restructuring costs and amortisation. Appendix 7 of the release defines adjusted net profit as net profit “excluding the following items and related tax effects,” a longer list than the one used for operating profit.
Reported vs company adjusted EPS over 11 quarters and adjusted sales growth over 15 quarters
In Q3 2025 there were no excluded items, so adjusted and reported operating profit were both DKK 23.7 billion, with about DKK 9 billion of restructuring costs inside. Against that base, Q3 2026 adjusted operating profit of DKK 31.7 billion is +33.9% in kroner. Adjusted EPS removes the same costs, so its Q3 2025 base was a higher DKK 6.56 and the Q3 2026 figure of DKK 5.79 is a decline. The release itself attributes the operating profit growth to “a favourable comparison base following DKK 9 billion of company-wide transformation costs recognised in Q3 2025.”
Own calculation (Q3 2026 and Q3 2025 releases): Adding back the DKK 9 billion of restructuring to Q3 2025 operating profit gives a comparable base of DKK 32.7 billion, against which Q3 2026 adjusted operating profit is -2.9%. Adjusted net profit was DKK 25.6 billion, down 12% as the company reports. The full-year outlook is also set on adjusted operating profit, so 2026 growth carries the same base effect.
The 340B Provision Reversal and Ozempic Growth
Filing footnote (Q3 release appendix 6): Reported Q1 2026 sales include a DKK 26.8 billion reversal of US 340B sales rebate provisions, and the release states that “The reversal of these provisions has no cash impact.” A smaller DKK 2.6 billion reversal under the same program was booked in Q2 2025.
340B is the US program that requires drug discounts for hospitals and pharmacies serving low-income patients, and Novo had been deducting expected discounts from sales as a provision. The reversal equals 27.6% of reported Q1 sales of DKK 96.8 billion and 38.2% of adjusted Q1 sales of DKK 70.1 billion. Nine-month reported sales grew +13% at CER while adjusted sales grew +2%.
Ozempic accounts for DKK 12.7 billion of the reversal, 47.3% of it, so its nine-month growth changes from +9% reported to -3% adjusted. Total diabetes moves from +9% to -5%. At the end of June 2025 the 340B provision stood at $4.2 billion, and the reversal converts to about $4.0 billion at 6.6946 kroner, so most of that balance came back into sales in a single quarter.
Reported EPS jumped to DKK 10.91 in Q1 and fell to DKK 3.79 in Q3, a swing that looks dramatic until set against company-adjusted EPS, which moved from DKK 6.63 to DKK 5.79 over the same period.
Did the 2026 Buyback Pay More Than the Share Price?
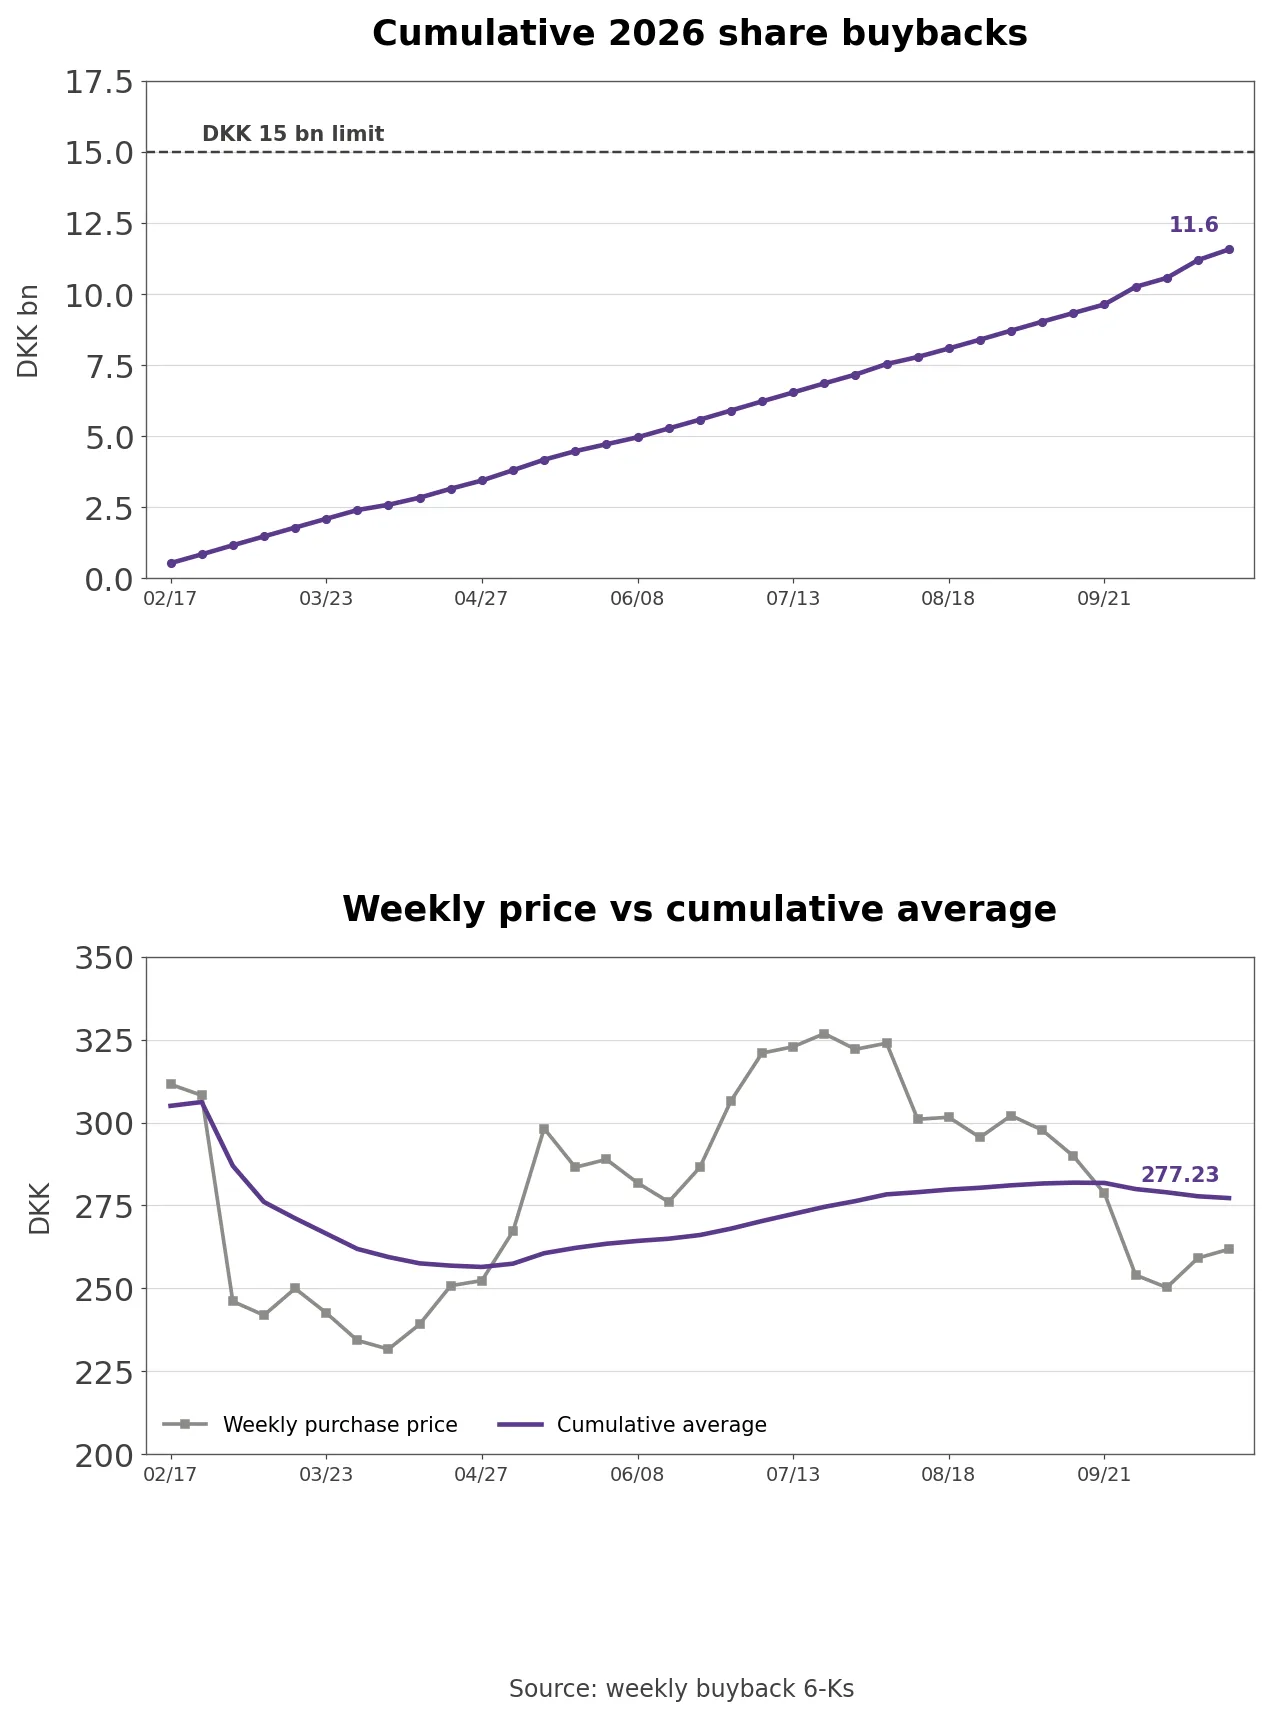
Novo is buying back up to DKK 15 billion of B shares over 12 months starting February 4, 2026, and reports transactions every Monday in a 6-K. I joined the 36 weekly filings that carry a running total.
Cumulative 2026 buybacks of DKK 11.6 billion and weekly purchase price vs average
The 41.7 million shares bought since February cost an average of DKK 277.23, 2.7% above the DKK 269.86 share price. Spending reached DKK 11.6 billion, 77.1% of the limit. The weekly purchase price was lowest at DKK 231.71 in early April and highest at DKK 326.80 in late July, and since October Novo has bought a steady 240,000 shares a day. Treasury shares total 55.8 million, 1.2% of the share count.
Nine-month shareholder returns were DKK 51.9 billion in dividends and DKK 10.0 billion in buybacks, against free cash flow of DKK 83.8 billion. Page 12 of the finance deck counts 31 consecutive years of dividend increases and shows capital use rising from DKK 69 billion in 2021 to DKK 143 billion in 2025, with buybacks shrinking from DKK 19 billion to DKK 1 billion as capital spending rose from DKK 6 billion to DKK 60 billion.
Obesity Growth Against a Shrinking Diabetes Base
Of Q3 sales of DKK 79.2 billion, obesity contributed DKK 26.1 billion (+22%), diabetes DKK 47.5 billion (-5%) and blood and endocrine disorders DKK 5.5 billion (+15%). Obesity is now a third of sales and diabetes 60%. Segment operating margin was 29.3% in obesity and diabetes, down from 34.5% as the Q3 impairments landed there, and 26.1% in blood and endocrine disorders, up from -11.4% a year earlier.
Ozempic was the largest product at DKK 29.7 billion, down 5% at CER. Insulin brought in DKK 12.3 billion, with the US down 13% and the rest of the world up 8%. In obesity, injectable Wegovy reached DKK 20.4 billion (-2%) and the Wegovy pill DKK 5.4 billion, while the older Saxenda fell 59%.
By region, US operations sold DKK 41.9 billion (+1%) and International Operations DKK 37.3 billion (+8%), led by Europe and Canada at +18%, although Canada’s realised prices fell after semaglutide exclusivity ended. International head Emil Kongshøj Larsen said on the call that Novo holds 54% of GLP-1 volume outside the US and expects the Wegovy pill in more than 20 markets by the first half of 2027. Page 20 of the presentation targets more than 50% growth in blood and endocrine disorders by 2030 from the 2026 base, and the hemophilia drug Frehemgo received a positive CHMP opinion in September.
The Wegovy Pill and Falling US Prices
In the US, third-quarter injectable Wegovy sales were DKK 11.1 billion (-13%) and Ozempic DKK 19.2 billion (-11%). The Wegovy pill sold DKK 4.2 billion in the US alone, lifting US obesity sales to DKK 15.3 billion (+20%). Nine-month Wegovy pill sales were DKK 10.9 billion.
Own calculation (Q3 release appendix 5): Working back from the CER growth rate, US injectable Wegovy sales were about DKK 12.7 billion a year earlier, so the decline was roughly DKK 1.65 billion. US Wegovy pill sales of DKK 4.18 billion were 2.5 times that decline.
Millar said the pill holds about 80% of new prescriptions for oral obesity drugs and has passed 8 million cumulative prescriptions. Pill volume grew about 20% from the second quarter, partly through a discount bridge program running at about 60,000 weekly prescriptions, and the Ozempic pill launched in May with weekly new-to-brand prescriptions roughly double the pre-launch level. The outlook assumes US sales decline for the year.
Novo Nordisk vs Eli Lilly Sanofi and AstraZeneca
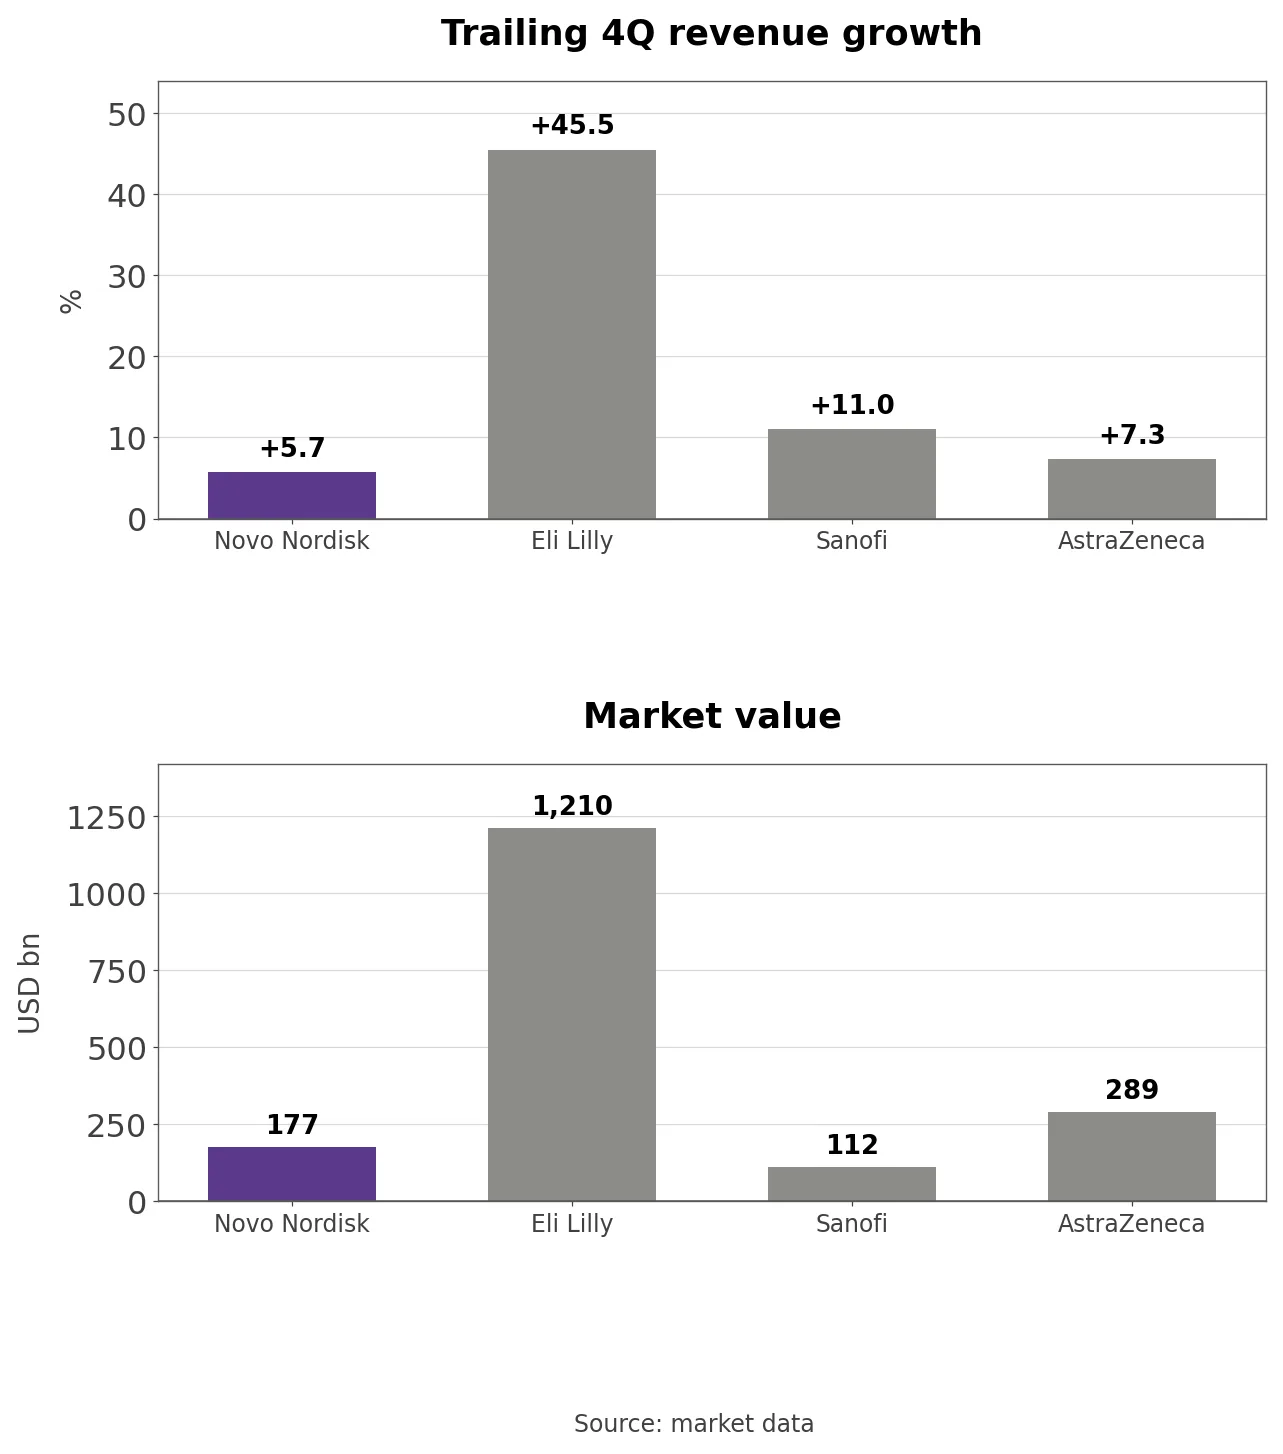
On market data, trailing four-quarter revenue grew +45.5% at Eli Lilly, +11.0% at Sanofi, +7.3% at AstraZeneca and +5.7% at Novo, and Novo’s figure includes the 340B reversal.
Trailing revenue growth and market value at Novo Nordisk Eli Lilly Sanofi and AstraZeneca
Lilly’s trailing revenue of $86.5 billion is 1.71 times Novo’s $50.7 billion, but its $1.21 trillion market value is 6.83 times Novo’s. One-year market value changes split the same way: Lilly +40.7%, AstraZeneca +14.8%, Sanofi -9.8% and Novo -17.8%.
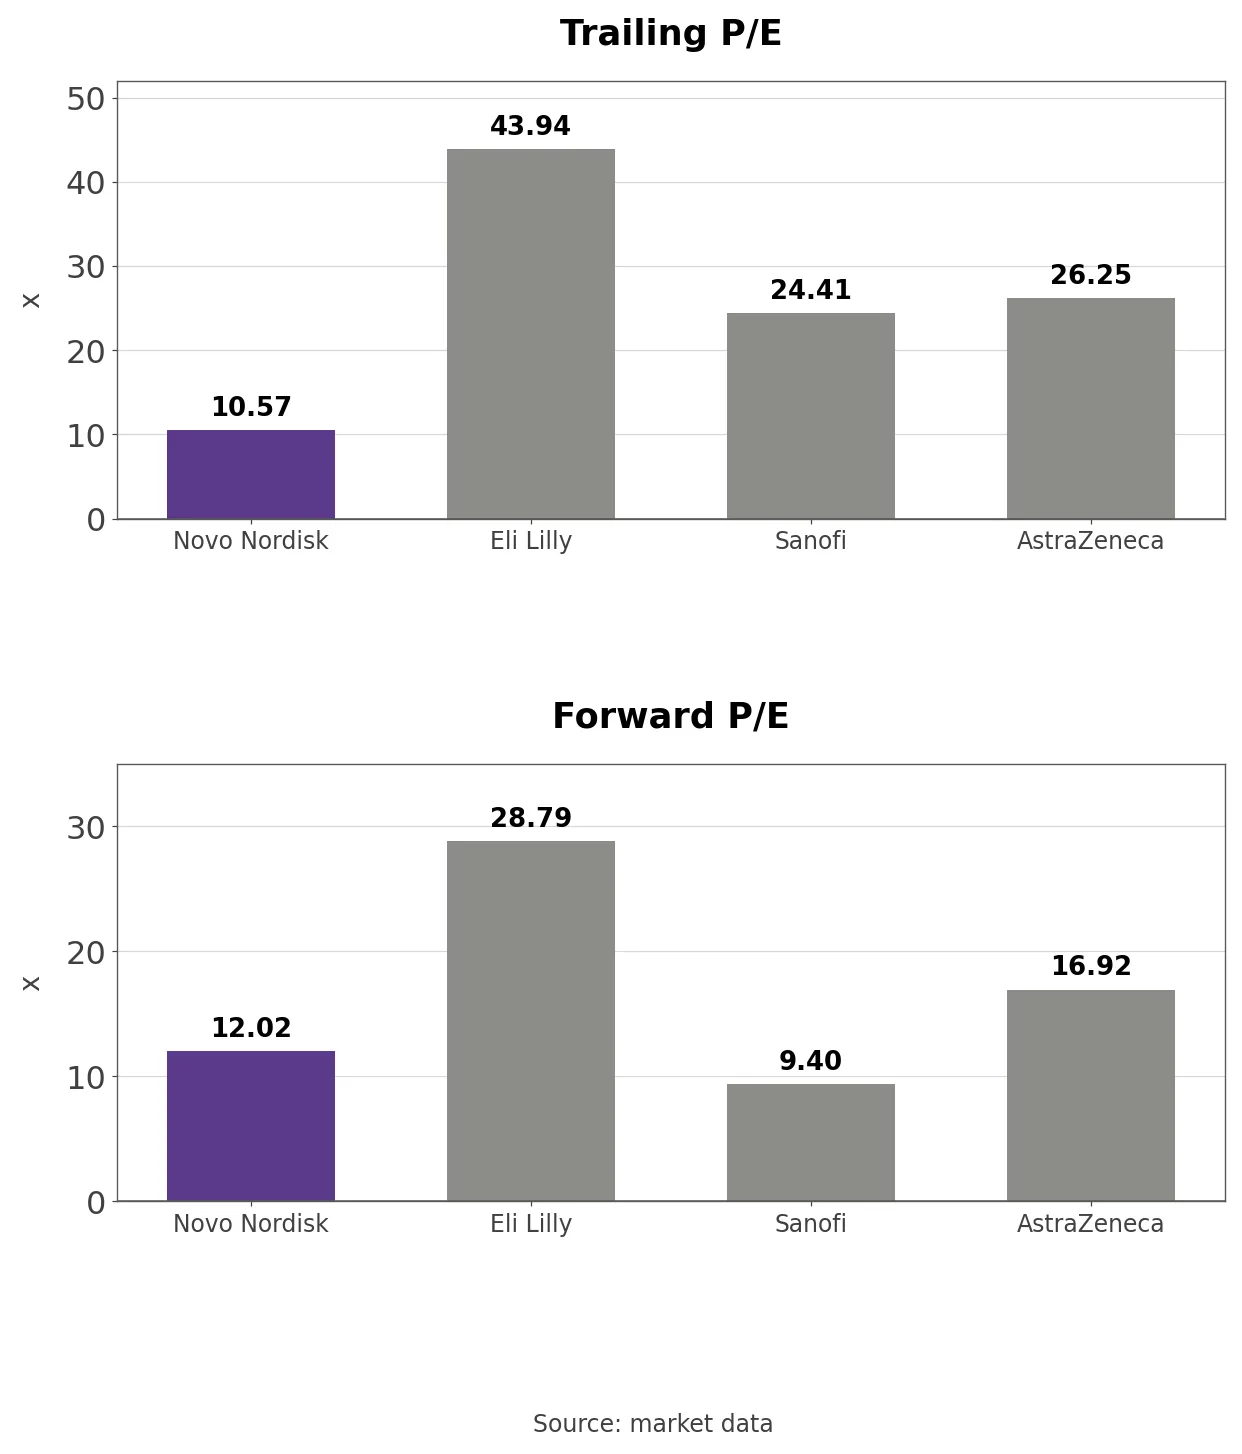
Trailing P/E on market data is 10.57 for Novo, 43.94 for Lilly, 24.41 for Sanofi and 26.25 for AstraZeneca; forward P/E is 12.02, 28.79, 9.40 and 16.92. Novo is the only one of the four whose forward P/E sits above its trailing P/E, so the market expects lower earnings next year, part of which reflects the 340B reversal in this year’s reported profit.
Trailing and forward P/E at Novo Nordisk Eli Lilly Sanofi and AstraZeneca
The Price-to-Earnings and Price-to-Sales Band
I converted 94 month-end ADR closes since February 2019 into kroner and divided by trailing EPS and sales. EPS is company-adjusted from 2024 and reported before that, and sales exclude the 340B reversals.
Novo Nordisk P/E and P/S bands over 94 months
A P/E of 10.78 sits at the 6.4th percentile against a median of 25.68; the high was 49.32 in June 2024 and the low 9.04 in February 2026. Price to sales of 3.88 sits at the 5.3rd percentile against a median of 8.29. On reported EPS the P/E is 10.59, close to the 10.57 on market data, because the Q1 reversal and the Q3 impairments roughly cancel. Trailing EPS barely changed between June 2024 and now, so almost all of the share price decline came from the multiple.
Three Conditions That Move the Stock
US adjusted sales come first. A return to US growth in the fourth quarter, with the pill still covering the injectable decline, would support the stock, while deeper price cuts under the most-favoured-nation agreement would weigh on it.
The direction of adjusted EPS is the second. Once the restructuring base effect drops out, adjusted operating profit and adjusted EPS growing together would support the stock, and another decline in adjusted EPS would confirm that the 27% was a base effect.
CagriSema approval is the third. An on-time US launch in early 2027 would give the 2027 growth case something to stand on, and a delay or a weaker label would weigh on it. Whether Novo spends the remaining DKK 3.4 billion of the buyback by February 2027 can be checked over the same months.
The CagriSema Launch and 2027 Sales
CagriSema combines semaglutide with the amylin analogue cagrilintide. It produced 21% weight loss at week 68 in REDEFINE 9, and in REIMAGINE 5 it delivered 12.4% weight loss in type 2 diabetes against 9.1% for tirzepatide 5 mg. Novo is preparing a US launch in early 2027, subject to approval.
Doustdar named three positives for 2027 on the call: continued Wegovy pill demand, a full year of the US bridge program and the CagriSema and Frehemgo launches. He named three negatives: a full year of exclusivity losses in International Operations, headwinds and an exclusivity loss in China, and a sales-to-net-profit ratio that may not be as favourable as in 2026. The open question is which adjusted measure the February guidance will use to describe a return to growth.