Eli Lilly and Company (NYSE: LLY) grew third-quarter 2026 revenue +39% to $24.4 billion, and the company split that growth into a 53% gain in volume and a -15% drag from price. Price has been negative for eight straight quarters, and this was the deepest cut since the releases began breaking growth down that way in 2022. Lilly raised its full-year revenue guide to $91 billion to $92 billion, yet the same guide implies fourth-quarter growth of only about 26%, and about $2 billion of 2026 revenue will not repeat.
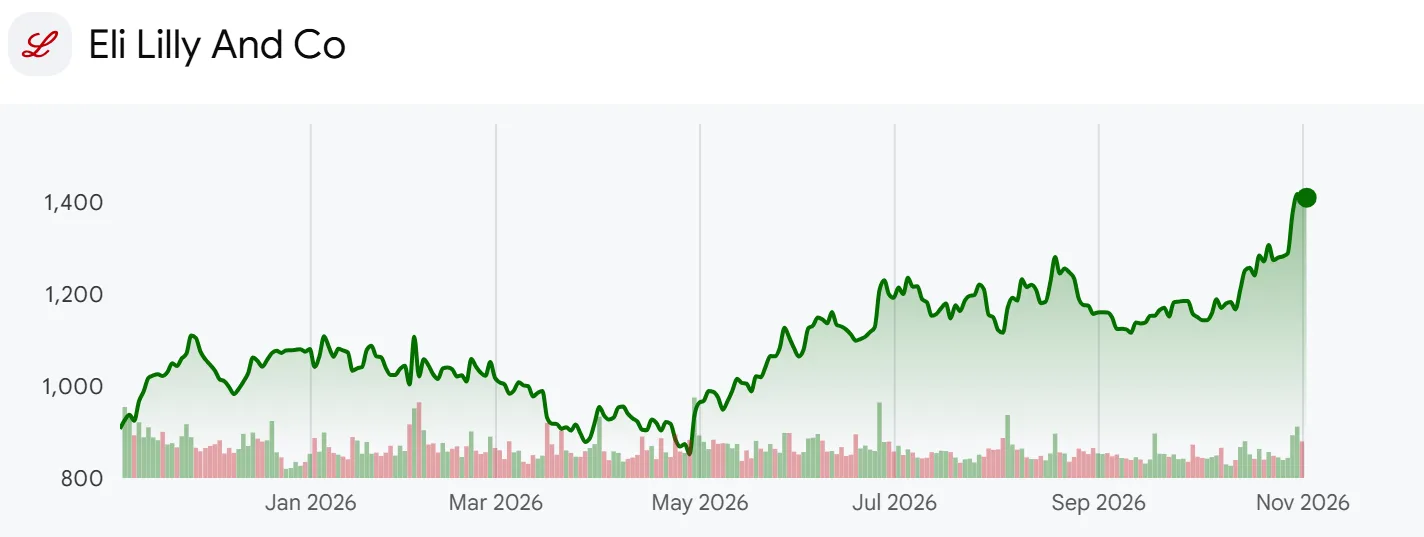
Lilly sells Mounjaro for type 2 diabetes and Zepbound for obesity, two brands of the same molecule, tirzepatide, which now make up two thirds of revenue. At $1,409.38 a share the company is worth $1.255 trillion on market data, and third-quarter diluted GAAP earnings per share were $7.22 after $4.57 of acquired in-process research and development (IPR&D) charges.
Eli Lilly one-year share price chart
I lined up the Q3 2026 earnings release, the Q3 2026 10-Q, the 59-slide Q3 earnings deck, the October 29 earnings call and 22 earnings releases going back to 2022 to measure how long volume can keep outrunning price. Lilly revises its rebate and discount estimates every quarter without disclosing the dollar amount, so the one-off part of US pricing rests on management’s statement on the call that US price fell 10% excluding those adjustments.
Price and Volume by Region in the Q3 Deck
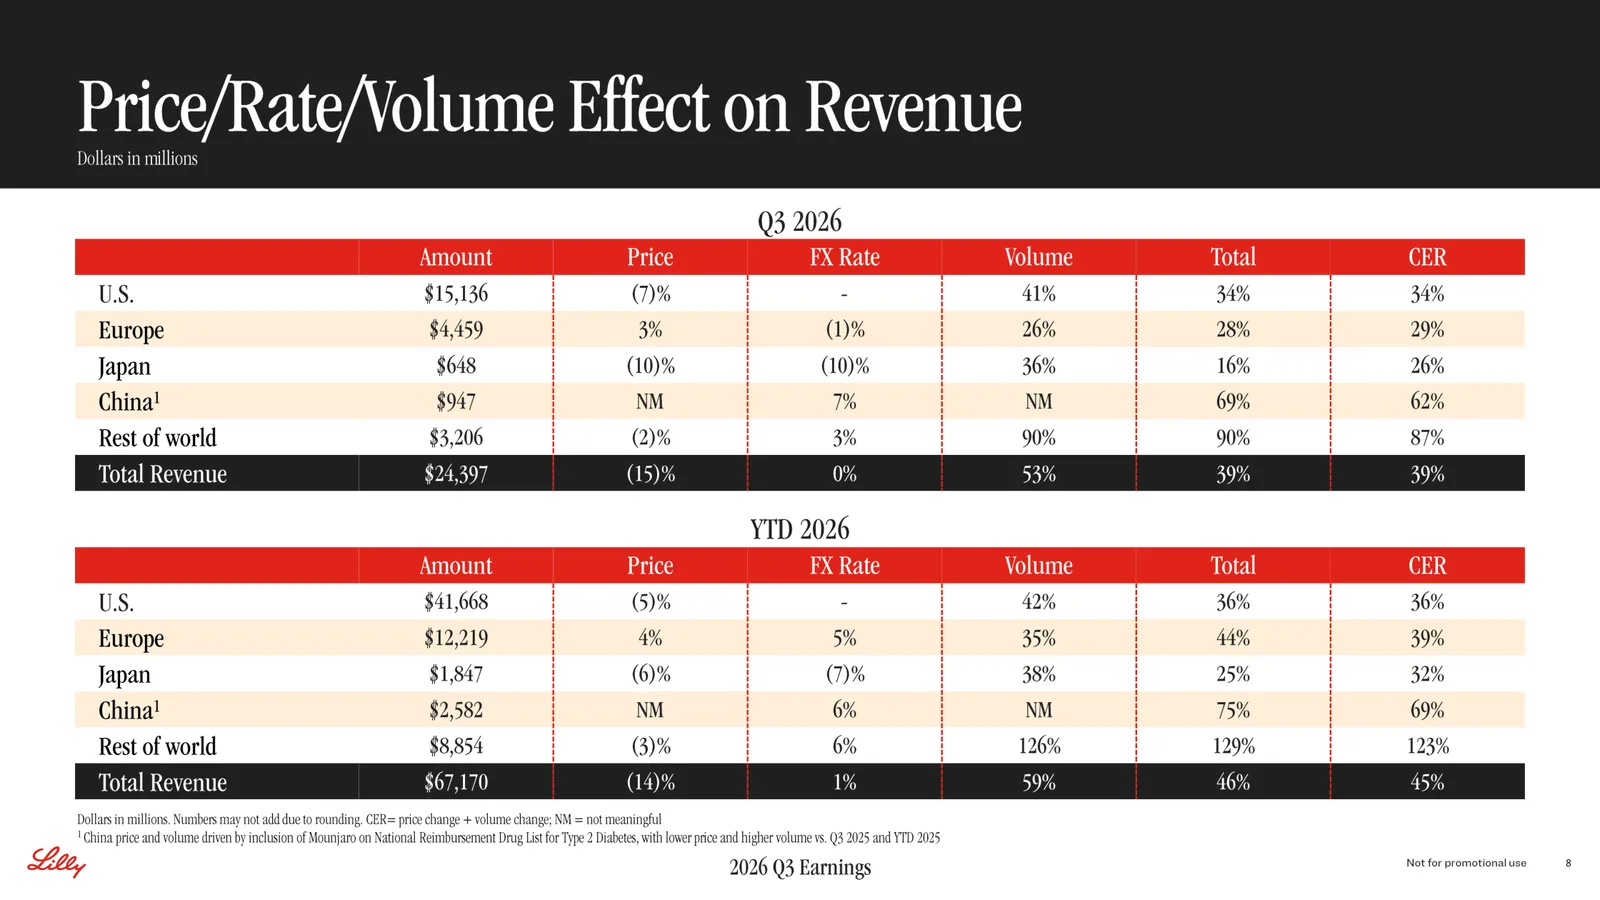
Q3 deck slide 8 with price and currency and volume effects on revenue by region
Slide 8 splits third-quarter revenue of $24.4 billion by region into price, currency and volume. In total, price took off 15%, currency was neutral and volume added 53%. US revenue of $15.1 billion came from a 7% price decline and a 41% volume gain, while Europe at $4.5 billion actually saw price rise 3%. Japan lost 10% to price and another 10% to currency, so revenue grew only 16%. In China, where Mounjaro joined the national reimbursement drug list, prices fell and volume jumped, and the company marks the split there as not meaningful. China revenue was $947 million, up 69%, and on the call management said Mounjaro was the first medicine to pass $1 billion of sales in its first year in China. Rest of world revenue of $3.2 billion rose 90% on volume. For nine months the pattern holds: price down 14%, volume up 59%.
Outside the US, revenue rose +47% to $9.3 billion on a 76% volume gain and a 29% price decline. International price contribution was -25% in the first quarter, -36% in the second and -29% in the third, three straight steep declines since the China listing. The international share of revenue rose from 35.8% to 38.0%, so the lower-priced markets now pull harder on the company average.
Own calculation (deck slide 8 and earnings releases): Applying the 53% volume contribution to last year’s third-quarter revenue of $17.601 billion adds $9.328 billion, and the 15% price contribution subtracts $2.640 billion. The actual increase of $6.796 billion came from volume filling 3.5 times the hole left by price.
Medicare GLP-1 Bridge and US Prescription Share
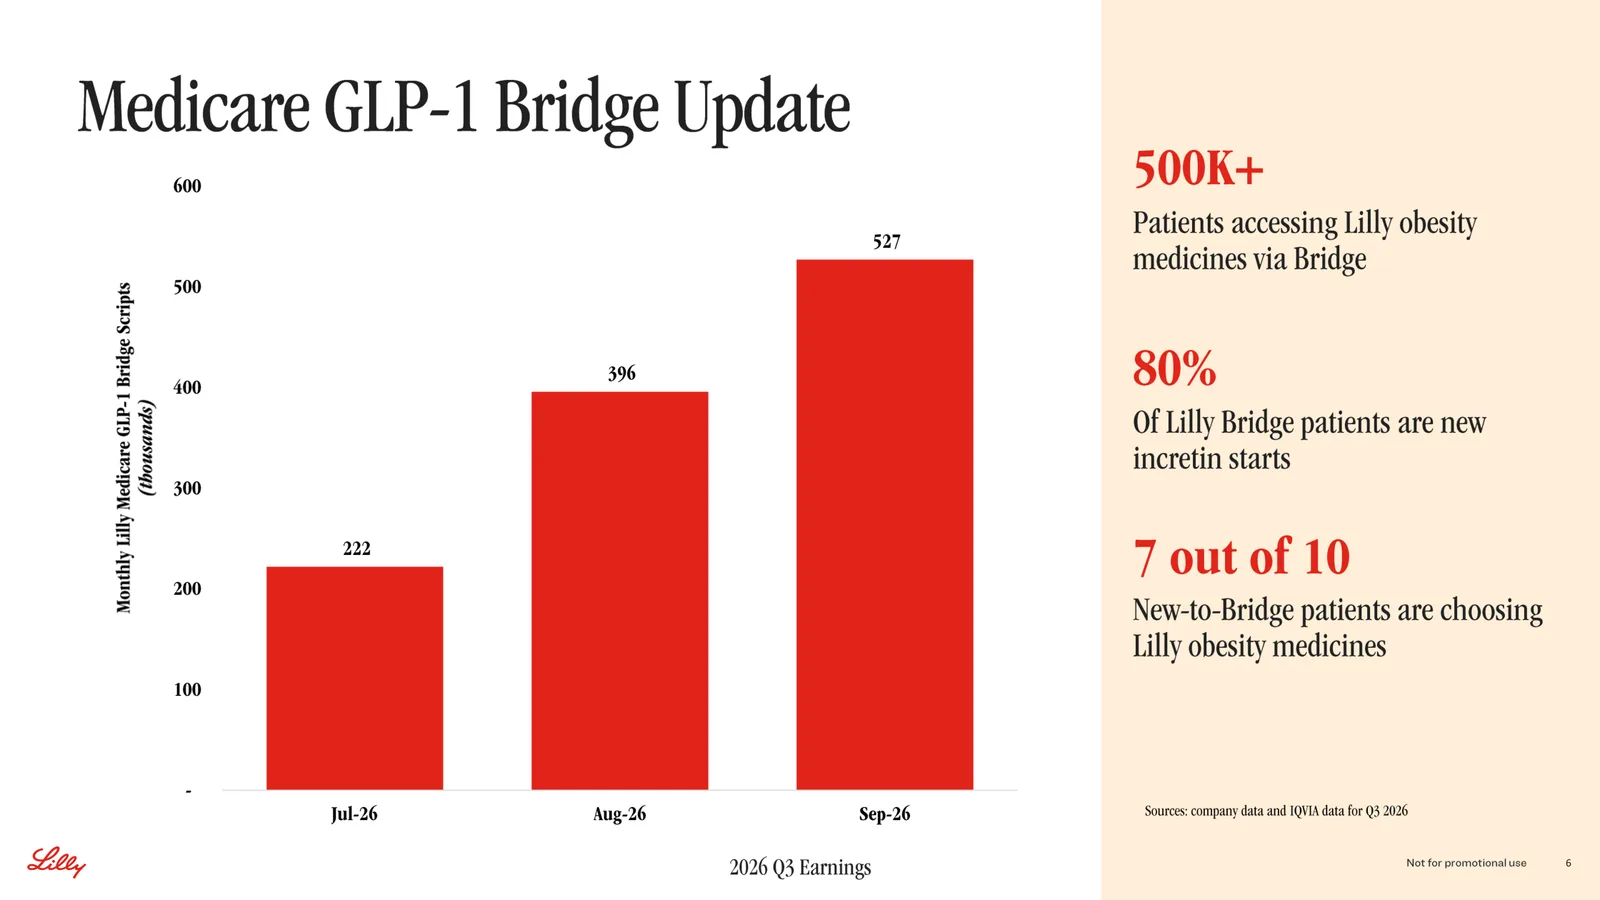
Q3 deck slide 6 with monthly Medicare GLP-1 Bridge prescriptions
Slide 6 tracks monthly Lilly prescriptions under the Medicare GLP-1 Bridge, which started on July 1: 222,000 in July, 396,000 in August and 527,000 in September. More than 500,000 patients have reached Lilly obesity medicines this way, 7 in 10 new Bridge patients chose a Lilly drug, and 80% of Lilly’s Bridge patients were starting an incretin for the first time. The 10-Q says the program gives Medicare beneficiaries access to discounted Lilly obesity medicines from July 1, 2026 through December 31, 2027. Because these are discounted scripts, Bridge adds volume and pulls down the average US price at the same time.
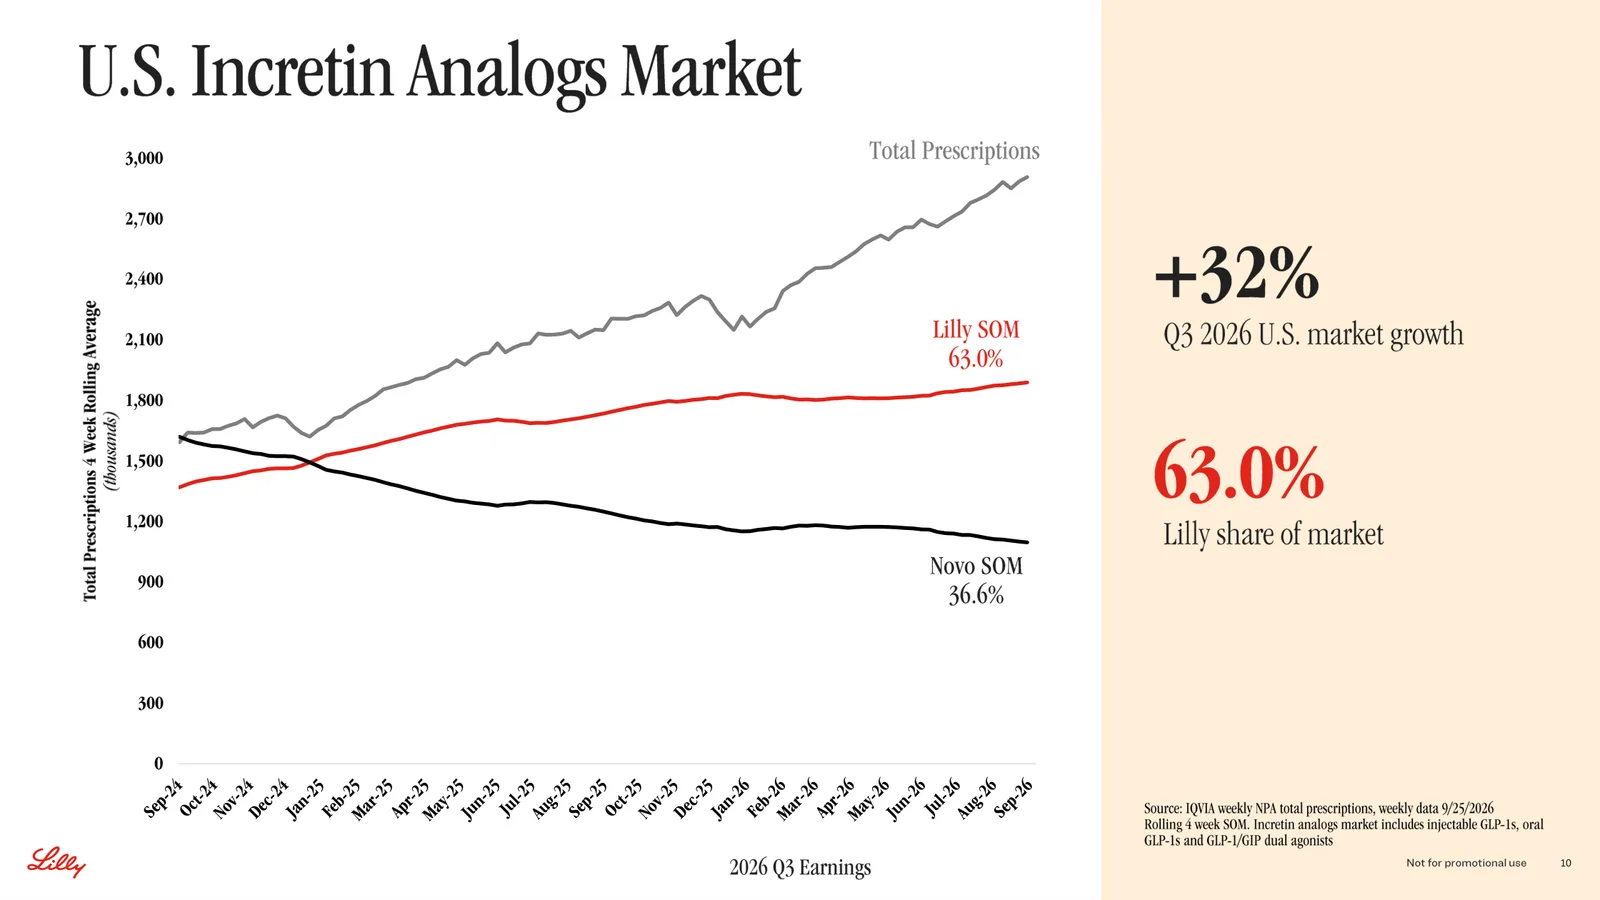
Q3 deck slide 10 with US incretin prescriptions and Lilly share of 63.0%
Slide 10 shows total US incretin prescriptions, covering injectable and oral GLP-1s and GIP/GLP-1 dual agonists, up 32% in the third quarter, with Lilly at 63.0% of the market and Novo Nordisk at 36.6%. In September 2024 Novo still wrote more prescriptions; the lines crossed around January 2025 and the gap has widened since. Outside the US, slide 11 puts Lilly at 58.4% of market revenue. By product, slide 9 gives Mounjaro a 56% US prescription share and Zepbound 58% at the end of the quarter, and slide 12 says the oral obesity drug Foundayo exited the quarter with about 40% of new patient starts and is under review in more than 40 countries.
Guidance Raises and the Implied Fourth Quarter
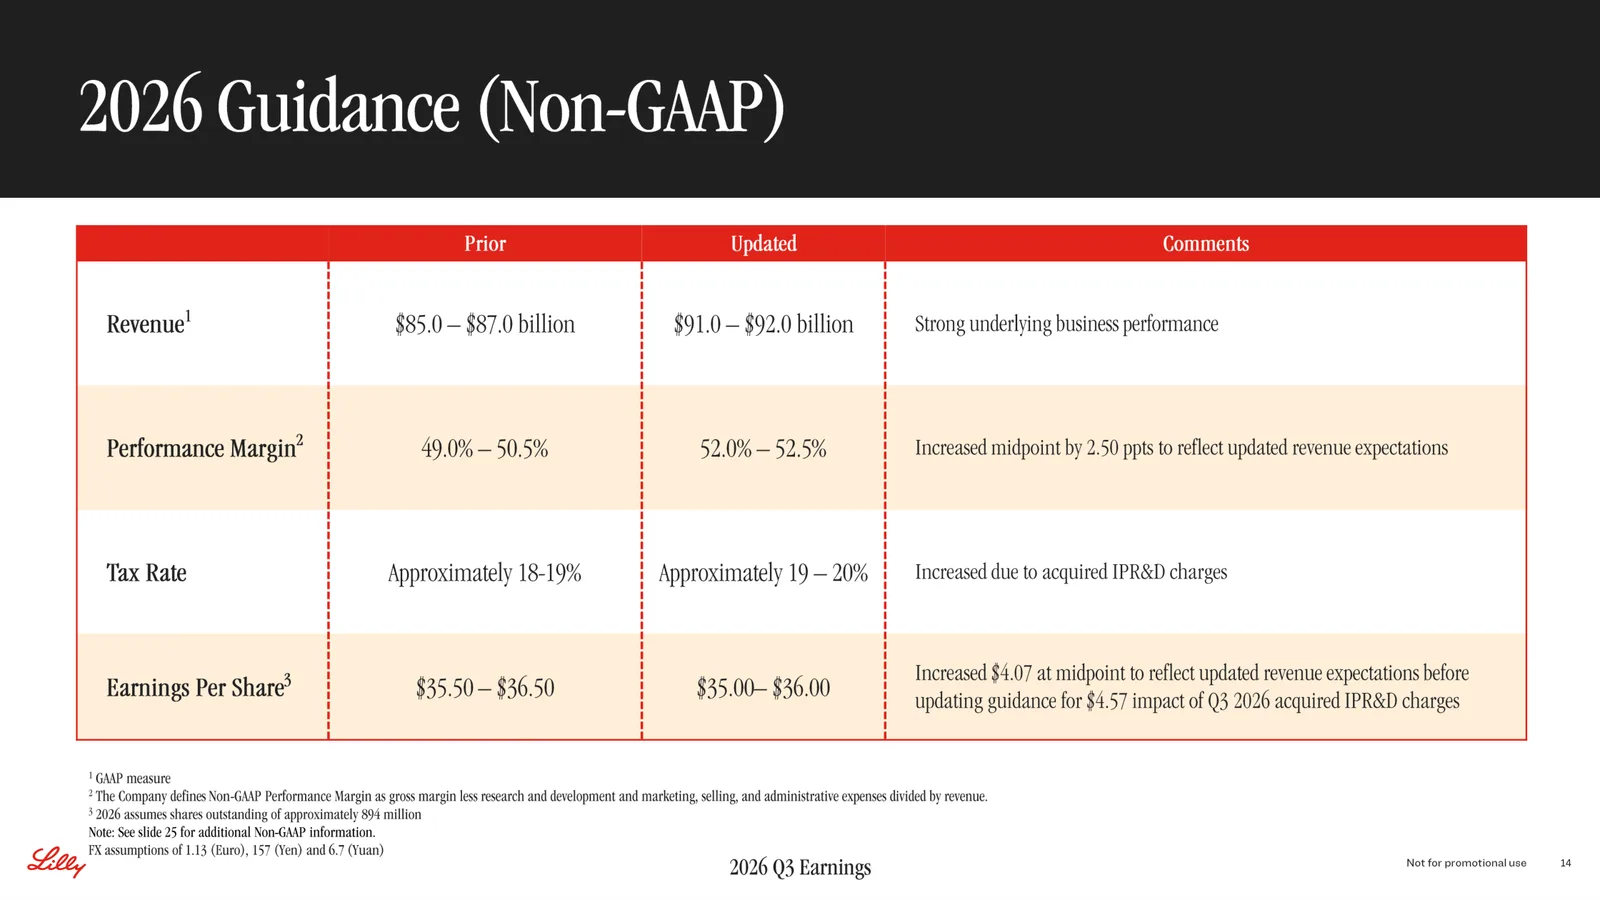
Q3 deck slide 14 with prior and updated 2026 guidance
Company disclosure (Q3 2026 deck slide 14 and the earnings release, October 29): Lilly raised 2026 revenue guidance from $85 billion to $87 billion to $91 billion to $92 billion and its non-GAAP performance margin guide from 49.0% to 50.5% to 52.0% to 52.5%. Earnings per share guidance moved from $35.50 to $36.50 to $35.00 to $36.00, which the company described as a $4.07 increase at the midpoint from higher revenue, offset by $4.57 of third-quarter acquired IPR&D charges.
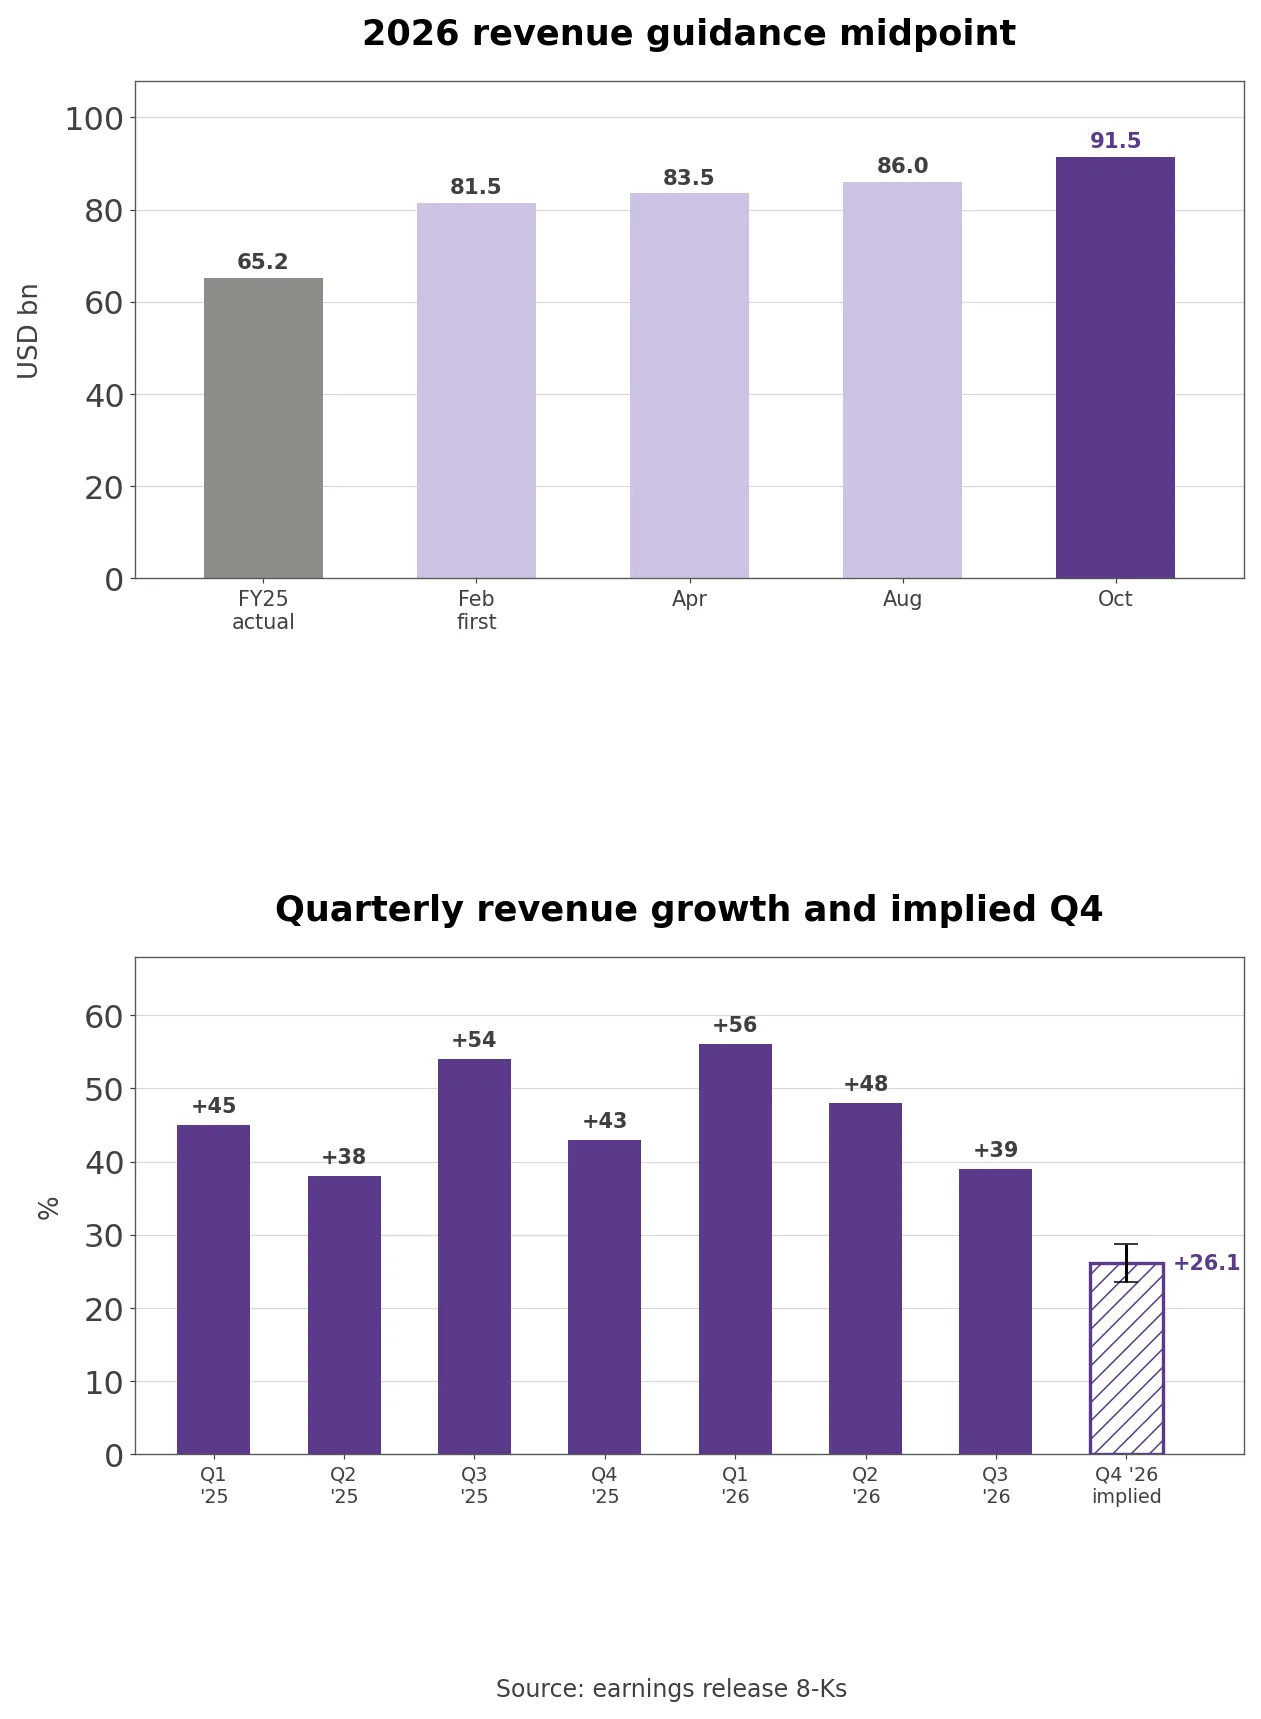
The revenue guide midpoint has gone from $81.5 billion in February to $83.5 billion in April, $86.0 billion in August and $91.5 billion in October, three raises worth +12.3%. Even the February guide was 25.0% above 2025 revenue of $65.179 billion. When an analyst on the call said Lilly’s guidance had not been a good predictor of final results, the chief financial officer answered that the outcome was about $10 billion better than the initial guide.
Own calculation (four earnings releases): Subtracting first-to-third-quarter revenue of $67.17 billion from the $91 billion to $92 billion full-year guide leaves $23.83 billion to $24.83 billion for the fourth quarter, 23.5% to 28.7% above the $19.292 billion of a year earlier. The midpoint implies growth of 26.1%, about 13 points below the third quarter, and revenue 0.3% below the third quarter.
The earnings guide also leaves out a cost. A footnote says guidance excludes acquired IPR&D incurred after September 30, and after the quarter ended Lilly completed the acquisition of Merida Biosciences, which works on autoimmune and allergic diseases. That charge will come out of fourth-quarter EPS separately.
The Bull and Bear Case for Lilly Stock
The bull case is volume. US incretin prescriptions grew 32% and Lilly holds 63.0% of them, while Medicare Bridge and the oral drug Foundayo keep adding new patients. Excluding acquired IPR&D, third-quarter non-GAAP EPS was $12.05, up +55.9% from $7.73, and nine-month operating cash flow of $27.42 billion was 2.02 times last year’s.
The bear case is price. Worldwide price contribution has been negative for eight straight quarters, and the third quarter’s -15% was the deepest. About $2 billion of 2026 revenue will not repeat, and the fourth-quarter guide implies growth of roughly 26%. Meanwhile price to sales of 14.54 is 1.3 times its 95-month median, and a forward P/E of 29.97 is 2.46 times Novo Nordisk’s 12.20.
From the Elanco Split-Off to a Tirzepatide Company
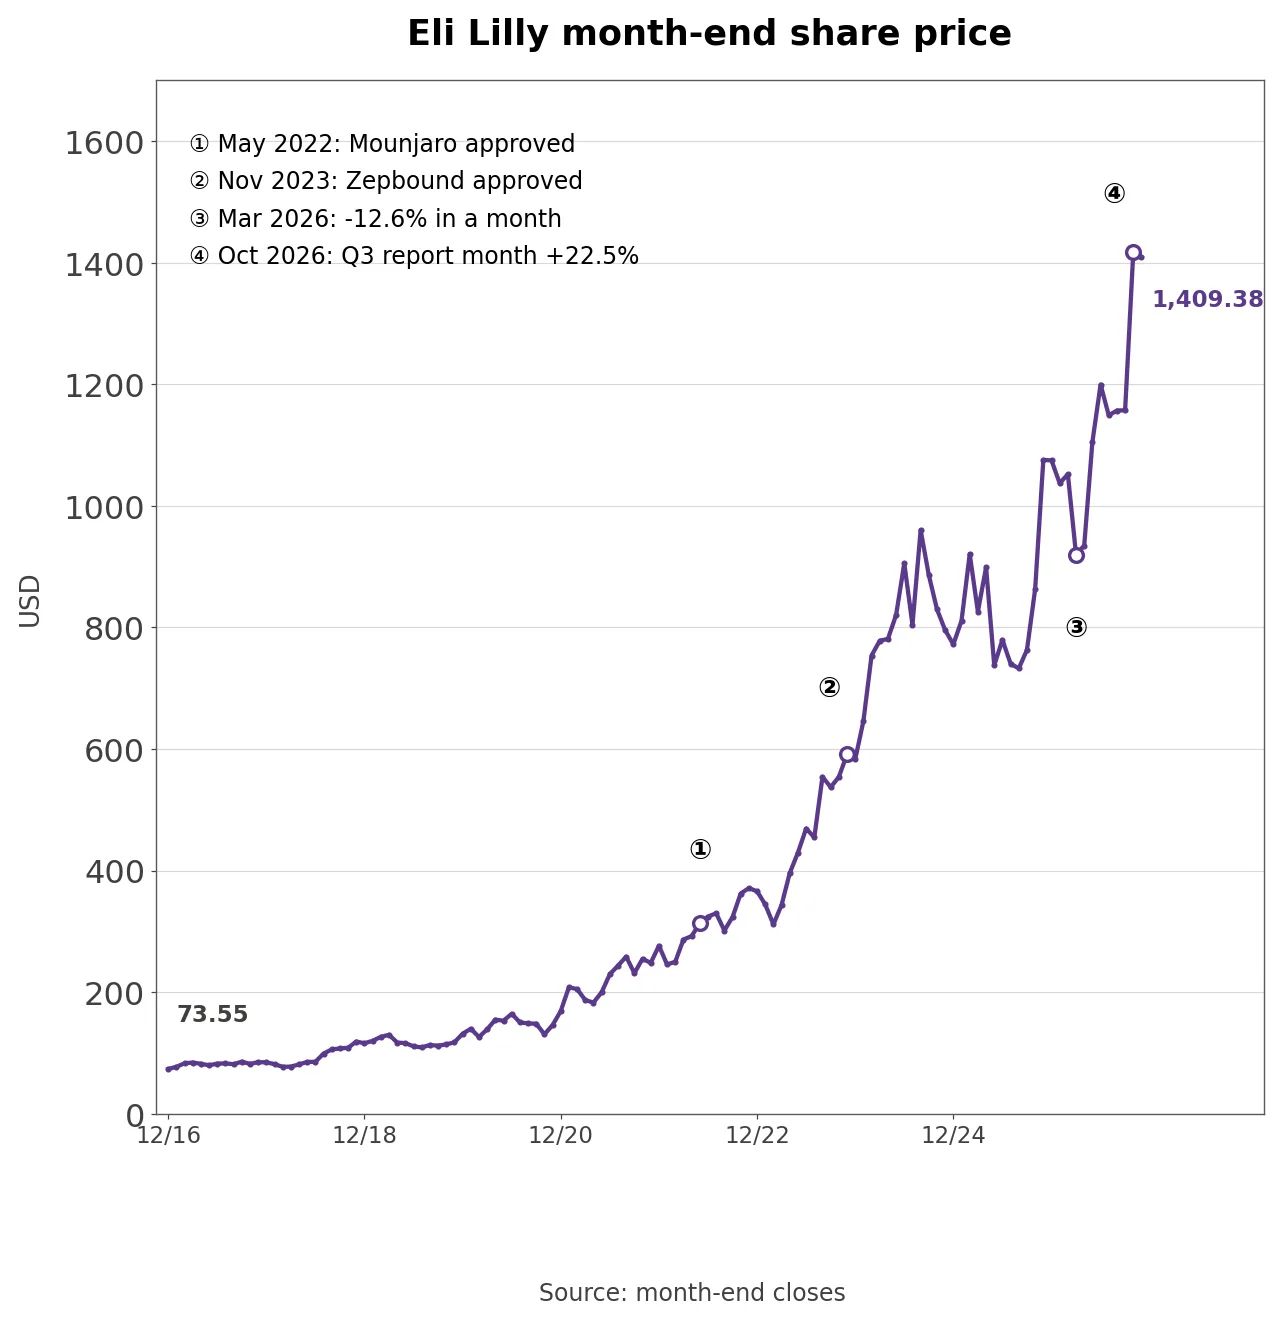
Eli Lilly month-end share price over 120 months with four dates
Lilly’s month-end share price went from $73.55 in December 2016 to $1,409.38 in November 2026, 19.2 times higher, and the stock has risen every calendar year since 2017: 14.8% in 2017, 37.0% in 2018, 13.6% in 2019, 28.5% in 2020 and +63.6% in 2021. It gained 32.4% in 2022, when Mounjaro was approved for diabetes, and 59.3% in 2023, when Zepbound was approved for obesity, then 32.4% in 2024, 39.2% in 2025 and 31.1% so far in 2026.
Revenue went from $19.974 billion in 2017 to $65.179 billion in 2025, 3.26 times larger. After splitting off the Elanco animal health business in March 2019, Lilly became a tirzepatide company through the Mounjaro approval in May 2022 and Zepbound in November 2023, and tirzepatide was 65.9% of third-quarter revenue. The past year was volatile: the stock rose 24.6% in November 2025, fell -12.6% in March 2026 and rose 22.5% in October 2026, the month third-quarter results came out, to a month-end high of $1,417.54.
How Much Revenue Growth Came From Volume?
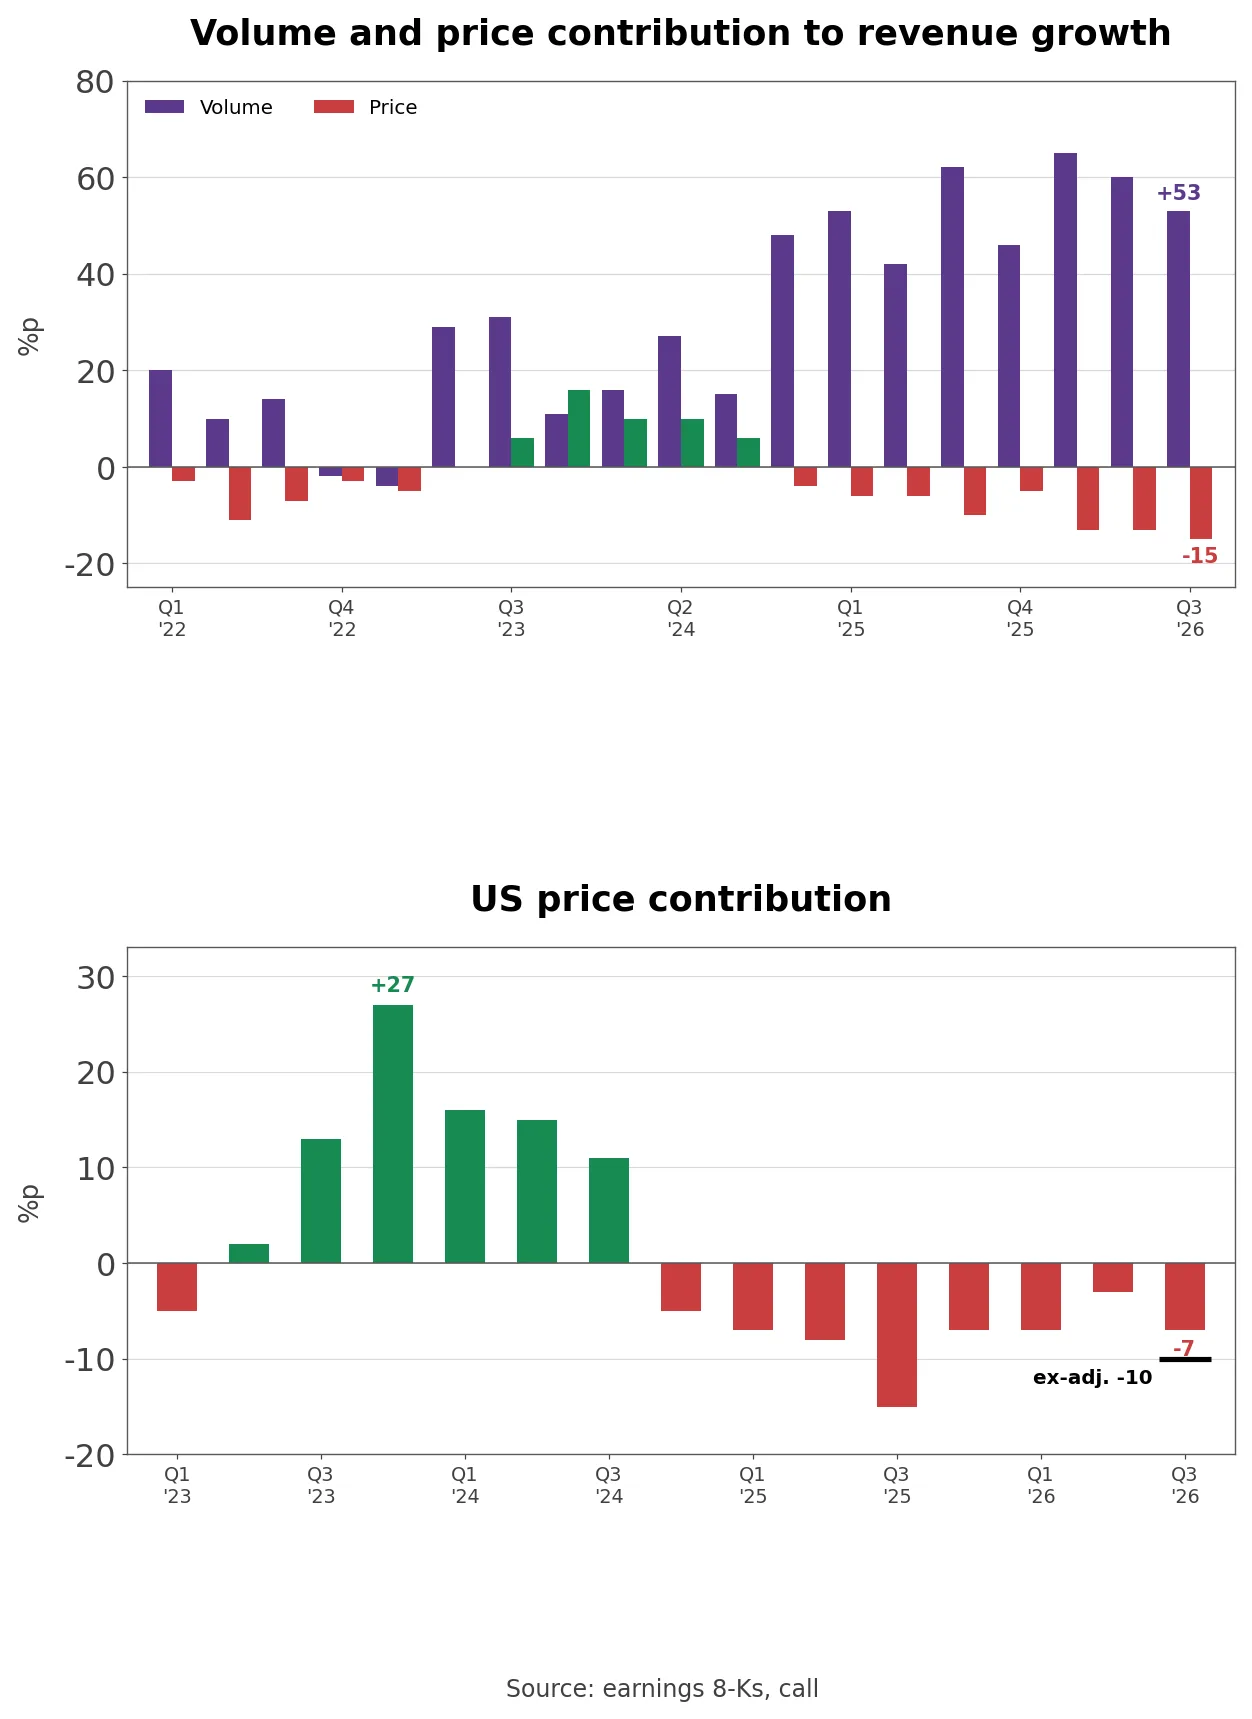
Volume and price contribution to revenue growth over 19 quarters and US price contribution
Each release splits revenue growth into volume, price and currency, and 19 quarters from the first quarter of 2022 show price changing direction twice. Price contribution was -3% to -11% through 2022 and early 2023, then +6% to +16% from the third quarter of 2023 to the third quarter of 2024, when Mounjaro and Zepbound pricing lifted revenue. It turned negative again at -4% in the fourth quarter of 2024 and has since read -6%, -6%, -10%, -5%, -13%, -13% and -15%.
Worldwide price contribution was -15% in the third quarter, the largest decline in the 19 quarters since the releases began splitting growth into volume and price in 2022. Volume contribution has ranged from +42% to +65% since the first quarter of 2025 and has covered every one of those price cuts.
Own calculation (earnings releases): Weighting by last year’s regional mix, international markets (35.8% of revenue times a 29% price decline) took 10.4 points off growth and the US (64.2% times 7%) took 4.5 points, which adds up to the reported -15%. More than two thirds of the price drag came from the China listing and lower-priced international markets, while currency had no effect.
In the US alone, price contribution peaked at +27% in the fourth quarter of 2023 and has since been -15% in the third quarter of 2025, -7% in both the fourth quarter and the first quarter of 2026, -3% in the second and -7% in the third. For the quarter the 10-Q says “the lower realized prices were primarily driven by Zepbound, partially offset by adjustments to estimates for rebates and discounts primarily driven by Mounjaro” in the US. The 3-point gap between the reported -7% and the -10% excluding the adjustment is about $340 million on last year’s $11.3 billion of US revenue.
Policy pushes the same way. The 10-Q says Lilly entered voluntary agreements with the US government in which “we agreed to lower Medicaid and certain other drug prices for U.S. patients,” and to launch new medicines with more balanced pricing across developed nations. On the call management framed 2027 pricing pressure as a shift toward lower-net-price channels rather than broad list price cuts.
One-Time Revenue From Milestones and Rebate Adjustments
2026 revenue guidance midpoint revisions and quarterly revenue growth with implied Q4
Third-quarter revenue included about $900 million of benefits. Of that, $410 million was sales-based milestones on Jardiance, the diabetes drug Lilly sells with Boehringer Ingelheim, and the release says “no further milestones remain.” The rest came from favorable changes to rebate and discount estimates. A year earlier the quarter carried a $200 million Jardiance milestone and $180 million from selling Cialis rights in some international markets.
Own calculation (earnings releases and the Q3 call): Taking $900 million out of this quarter and $380 million out of last year’s gives growth of 36.4%, 2.2 points below the reported 38.6%. Management said 2026 revenue includes about $2 billion of one-time items that are not expected to recur; removing that from the $91.5 billion guide midpoint leaves $89.5 billion, up 37.3% on 2025. That $89.5 billion is the base the first 2027 guide should be measured against.
Earnings carry the same distortion in a different form. Non-GAAP EPS of $7.48 grew only 7% because acquired IPR&D rose from $0.71 to $4.57 a share. Acquired IPR&D charges were $584 million in the first quarter, $2.8 billion in the second and $4.2 billion in the third, $7.584 billion in total, mostly for AtaiBeckley, which works on treatment-resistant depression, and Curevo in the third quarter. Lilly keeps these charges in its non-GAAP numbers, so business results and deal activity land in the same line.
How Lilly Makes Money From Tirzepatide
Lilly earns its money selling medicines. Mounjaro brought in $10.723 billion in the third quarter, up +65%, and Zepbound $5.352 billion, up 49%; together the tirzepatide brands were 65.9% of revenue, up from 57.4% a year earlier. The US contributed $15.136 billion, or 62.0% of revenue. Mounjaro now sells more outside the US ($5.7 billion, up 93%) than inside it ($5.0 billion, up 41%), while Zepbound is almost entirely American, with only $86 million abroad.
Slides 26 and 27 show the two brands moving at different speeds. Quarterly Mounjaro sales climbed from $3.8 billion in the first quarter of 2025 to $5.2, $6.5, $7.4, $8.7, $9.9 and $10.7 billion without a single decline. Zepbound went from $2.3 billion to $3.4, $3.6 and $4.3 billion, slipped to $4.2 billion in the first quarter of 2026, then reached $4.9 and $5.4 billion, which fits the 10-Q’s point that most of the price pressure sits with Zepbound.
The rest of Lilly’s key products are growing fast but are still small. Key product revenue was $17.1 billion, up 62%, and the immunology, oncology and neuroscience products doubled. Jaypirca, Ebglyss, Kisunla, Omvoh, Foundayo and Inluriyo together brought in $994 million, 6.2% of tirzepatide sales. Gross margin was 83.9% on a GAAP basis, up a point despite lower prices thanks to mix and lower production costs, research and development rose 23% to $4.2 billion and the non-GAAP performance margin reached 54.2%.
Cash generation has scaled with it. Nine-month operating cash flow of $27.42 billion less $8.437 billion of capital spending left $18.983 billion of free cash flow, 2.29 times last year’s $8.294 billion. Dividends of $4.635 billion and buybacks of $4.334 billion returned 47.2% of that, while acquisitions pushed investing outflows to $27.611 billion and long-term debt rose from $40.868 billion to $46.986 billion. Most US sales still pass through McKesson, Cencora and Cardinal Health, each a significant share of revenue according to the 10-K.
Lilly vs Novo Nordisk AbbVie and Merck
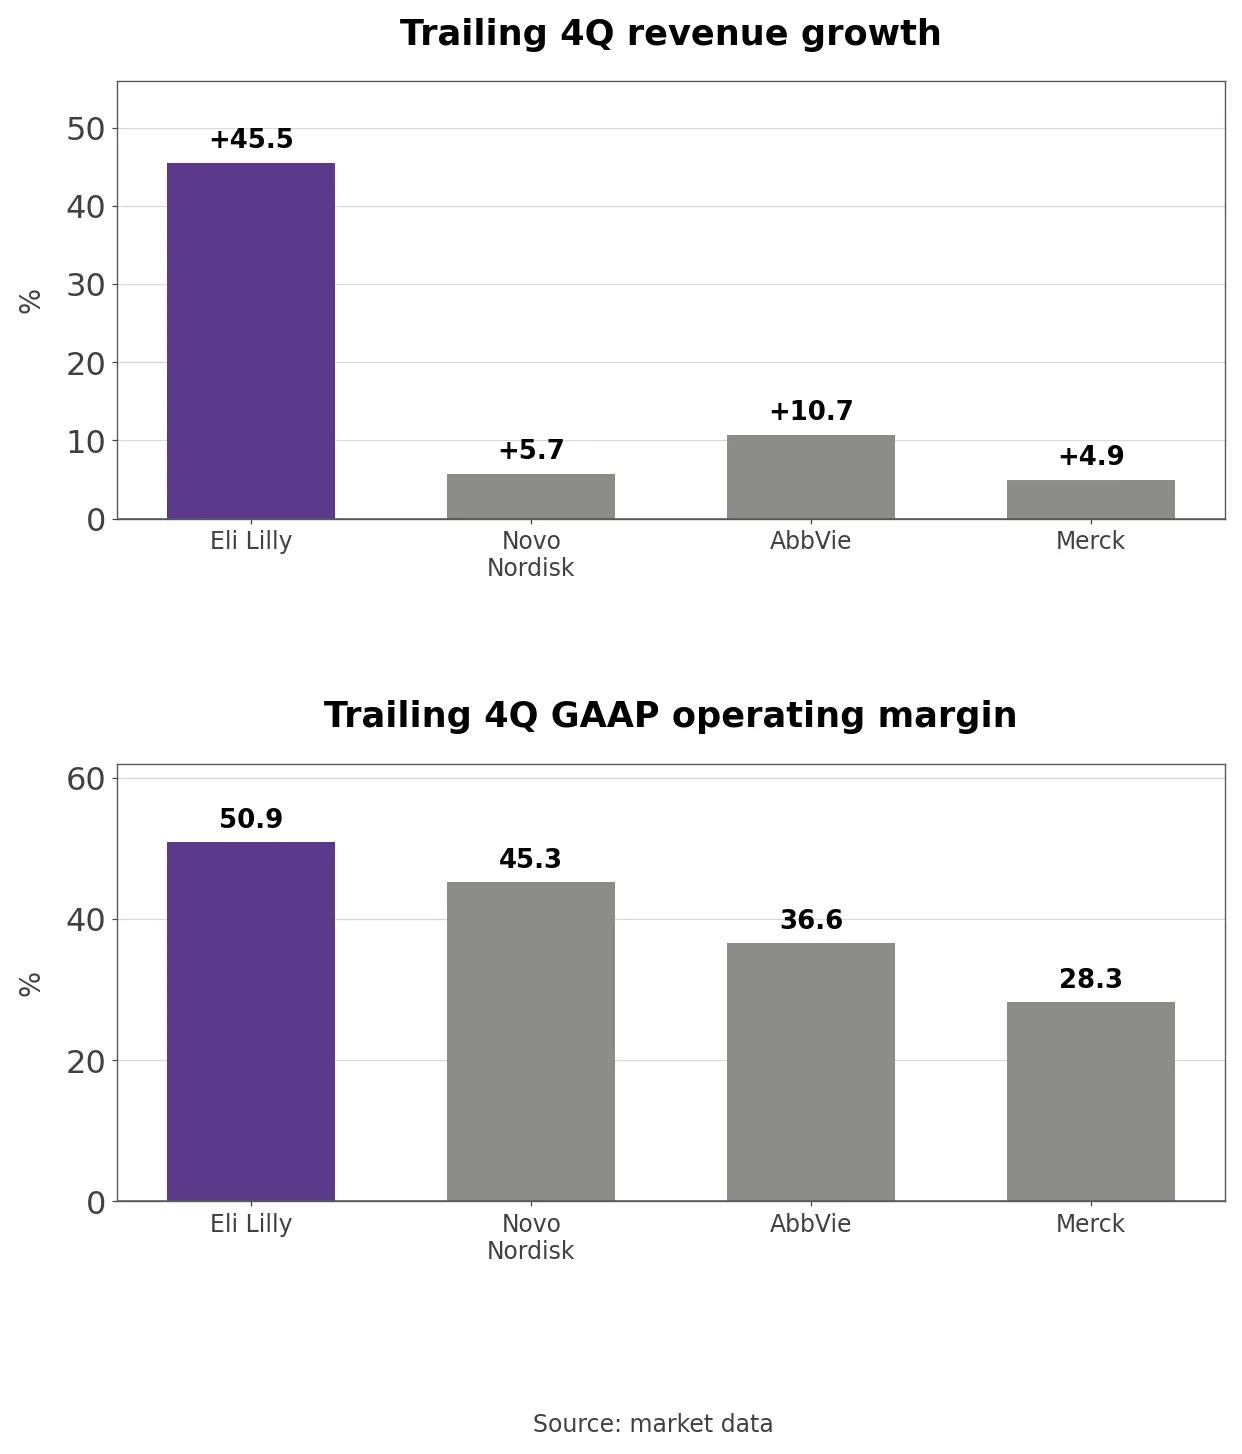
Trailing revenue growth and GAAP operating margin at Eli Lilly Novo Nordisk AbbVie and Merck
Trailing four-quarter revenue growth was +45.5% at Lilly against 5.7% at Novo Nordisk, 10.7% at AbbVie and 4.9% at Merck, and trailing GAAP operating margin was 50.9% against 45.3%, 36.6% and 28.3%. Novo reports in Danish kroner, so only its growth and margins are compared here. Lilly’s trailing revenue of $86.461 billion is now larger than Merck’s $67.378 billion and AbbVie’s $66.014 billion, and its return on invested capital is 42.68% against 36.41% at Novo and 5.88% at Merck.
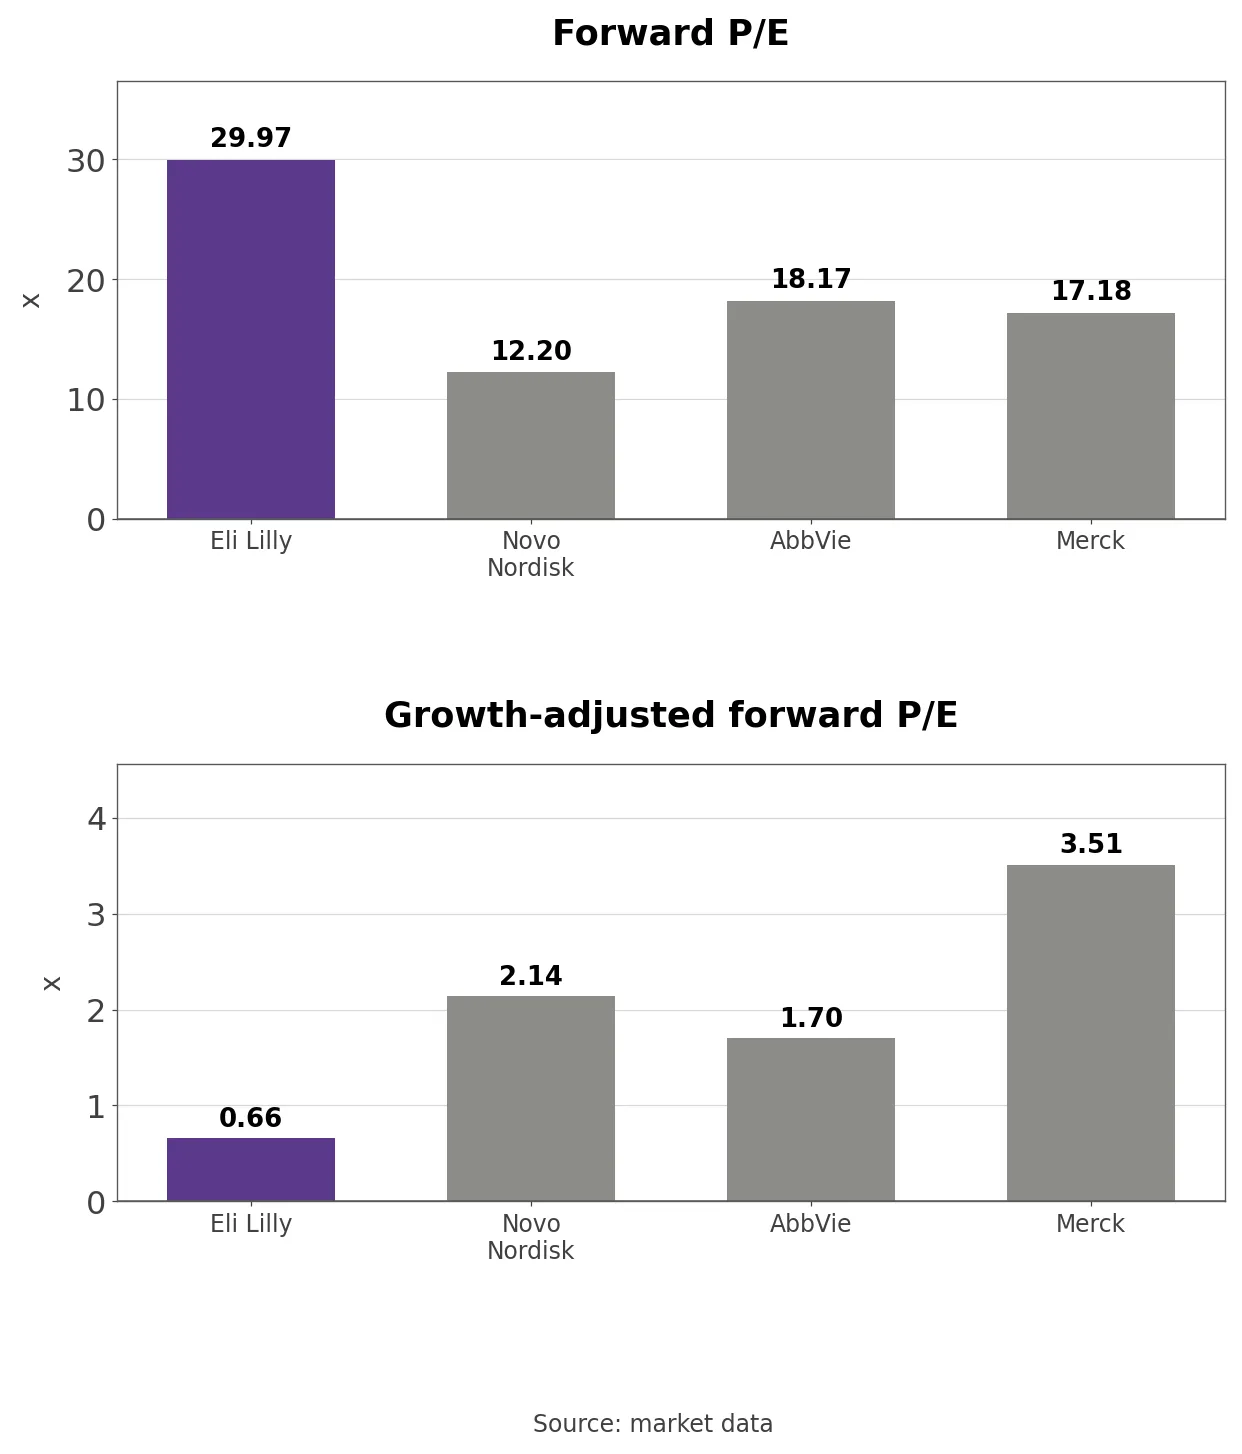
Forward P/E and growth-adjusted forward P/E at Eli Lilly Novo Nordisk AbbVie and Merck
The valuation gap is wider still. Forward P/E is 29.97 for Lilly, 12.20 for Novo Nordisk, 18.17 for AbbVie and 17.18 for Merck, and price to sales of 14.52 is two to four times the others’. Lilly’s market value is 1.21 times the three peers combined and 7.0 times Novo’s, while its shareholder yield of 1.07% trails Merck’s 4.12% and Novo’s 3.38%.
Dividing forward P/E by trailing revenue growth gives 0.66 for Lilly against 1.70 for AbbVie, 2.14 for Novo Nordisk and 3.51 for Merck. On that measure Lilly is the cheapest of the four, but only as long as 45.5% growth continues; using the 26.1% the fourth-quarter guide implies, the figure rises to 1.15.
The Price-to-Sales and P/E Band
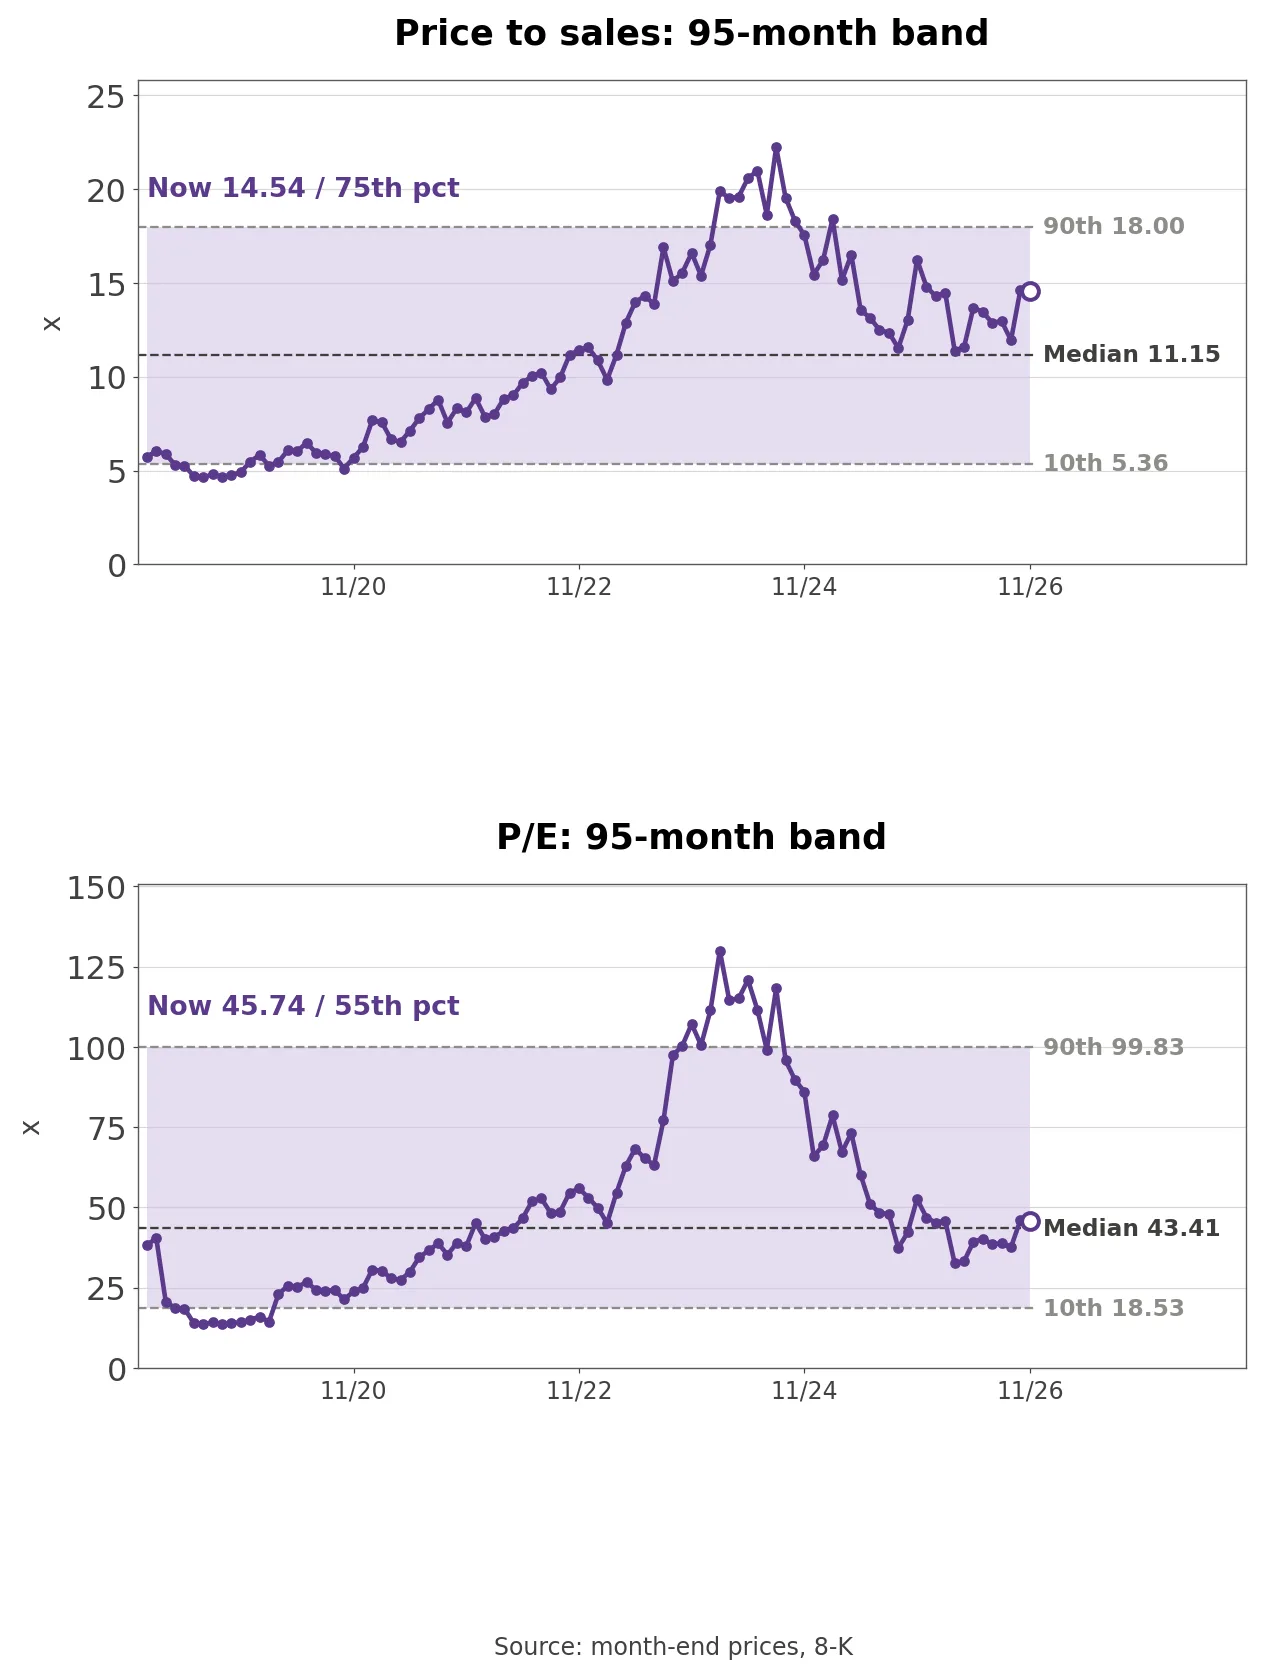
Eli Lilly price to sales and P/E over 95 months
Own calculation (month-end closes and XBRL): Market value divided by trailing revenue of $86.461 billion gives price to sales of 14.54, 1.3 times the median of 11.15 over 95 months since January 2019, with 74.7% of those months lower than now. The high was 22.22 in August 2024 and the low 4.63 in July 2019.
The trailing P/E of 45.74, based on $30.81 of trailing diluted GAAP EPS, sits near its 43.41 median, with 54.7% of months lower. The P/E peaked at 129.94 in February 2024 because the trailing four quarters still included the third quarter of 2023, when acquired IPR&D pushed GAAP EPS to -$0.06. The band starts in 2019 because the 2017 tax reform charge made trailing EPS negative or tiny in 2017 and 2018.
Three Conditions That Move the Stock
US price excluding rebate adjustments is the first. The third quarter’s -10% equals roughly $1.13 billion of price on last year’s US revenue. A smaller decline in the fourth quarter would show that Bridge and the channel shift are not cutting deeper, which would support the shares; a decline steeper than 15% would leave volume more to cover and weigh on them.
The first 2027 revenue guide is the second, measured against the $89.5 billion of 2026 revenue without one-time items. The first 2026 guide sat 25.0% above the prior year’s actual, so a first 2027 guide 20% or more above $89.5 billion would support the stock, while less than 10% would confirm the slowdown and weigh on it.
US prescription share is the third, starting from 63.0%. Holding at least 6 in 10 US incretin prescriptions as oral competitors arrive would support the stock; slipping below that would weaken the volume engine that has been covering price cuts and weigh on it.
What the Q4 Report Needs to Show
Fourth-quarter results usually arrive in early February, and management said 2027 guidance will come with them. The numbers to watch are worldwide and US price contribution, the size of rebate estimate adjustments, Medicare Bridge prescriptions, US incretin share, and where fourth-quarter revenue lands within the implied $23.83 billion to $24.83 billion. Management expects approval of Foundayo for type 2 diabetes in the fourth quarter, and the IPR&D charge for Merida Biosciences will show up in fourth-quarter EPS.
The open question is whether volume can again grow more than three times as fast as price falls in 2027, now that price contribution has reached -15%.