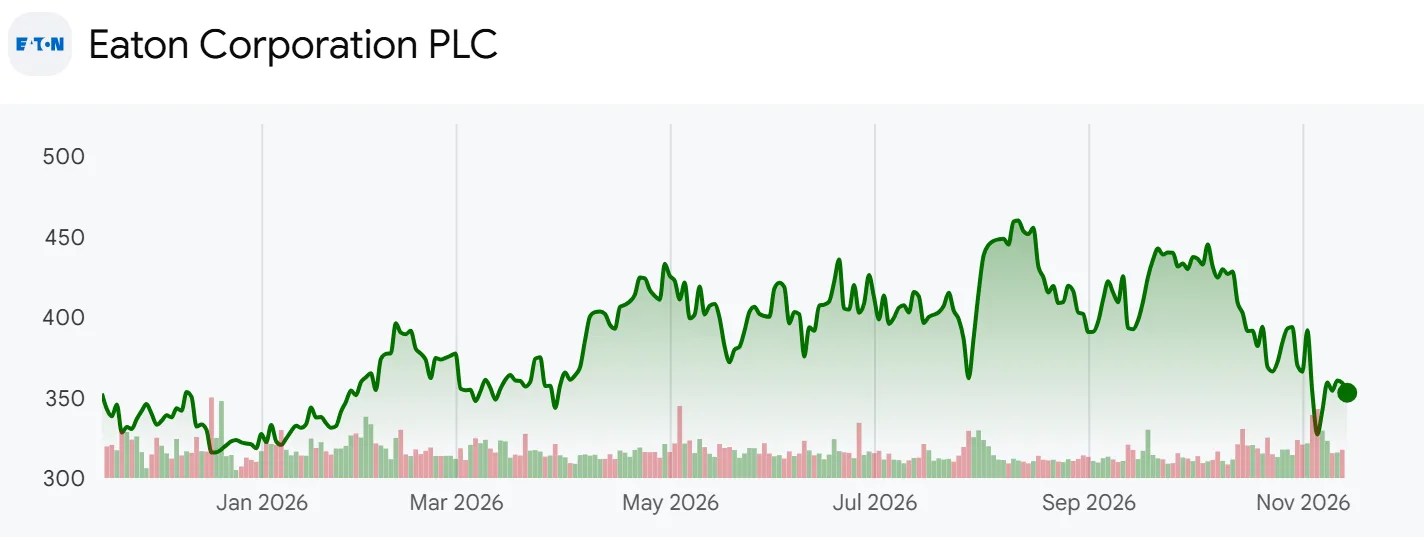
Eaton (NYSE: ETN) earned $2.263 billion of segment operating profit in the third quarter of 2026, +29.4% from a year earlier. Pretax income was $1.370 billion, up only +7.5%. Of the $514 million gain in segment profit, $419 million went to higher intangible amortization, net interest and other corporate expense, which is 81.5% of the increase. Boyd Thermal, the liquid-cooling company Eaton bought for $9.55 billion in March, added sales and segment profit, and the debt that paid for it added interest. Eaton raised guidance for the third time this year, yet the stock fell from $391.70 to $327.02 over the two sessions after results, -16.5%. At $352.97, it sits -23.3% below the 2026 high of $459.96 set on August 12.
Eaton one-year share price chart
Eaton is a power management company domiciled in Dublin. Its electrical businesses, which sell circuit breakers, switchgear and uninterruptible power supplies (UPS) to data centers, buildings and utilities, bring in more than three quarters of sales, and aerospace and vehicle parts (Mobility) make up the rest. Sales were $27.45 billion in 2025. At $352.97 and 388.5 million shares outstanding, the market value is about $137.1 billion.
I worked through the third-quarter 10-Q, the earnings release, the 19-slide earnings presentation, the call, 26 earnings releases since 2023 and the guidance slides in this year’s four decks. Demand and orders are as strong as Eaton says. The open question is how much of the extra revenue reaches shareholders, and whether the share price is set on adjusted or GAAP earnings. Two limits apply: adjusted EPS excludes amortization and deal costs, so it differs widely from GAAP EPS, and Mobility is to be separated in the first four months of 2027, which will change the base.
What Four Guidance Updates Show
Q3 2026 earnings presentation slide 14 with 2026 adjusted EPS guidance of 13.70 to 13.80
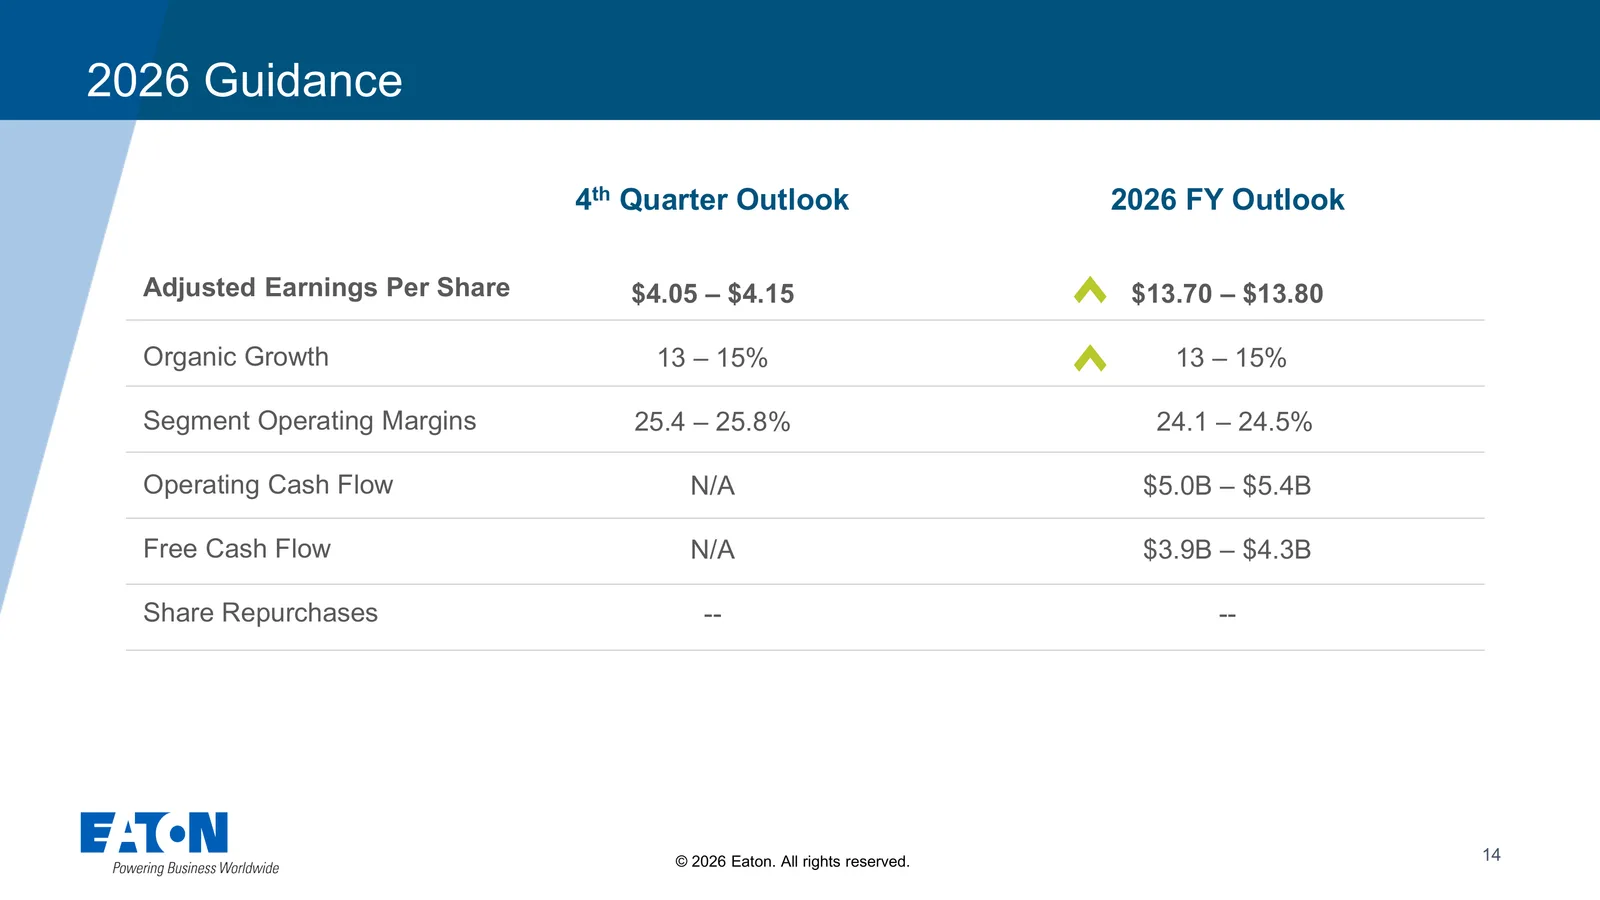
Slide 14 sets 2026 guidance at $13.70 to $13.80 of adjusted EPS, 13% to 15% organic growth and segment margins of 24.1% to 24.5%. Operating cash flow is guided at $5.0 billion to $5.4 billion, free cash flow at $3.9 billion to $4.3 billion, and the share repurchase line is blank. For the fourth quarter alone, adjusted EPS is guided at $4.05 to $4.15 with segment margins of 25.4% to 25.8%.
Four 2026 guidance updates for organic growth and adjusted EPS
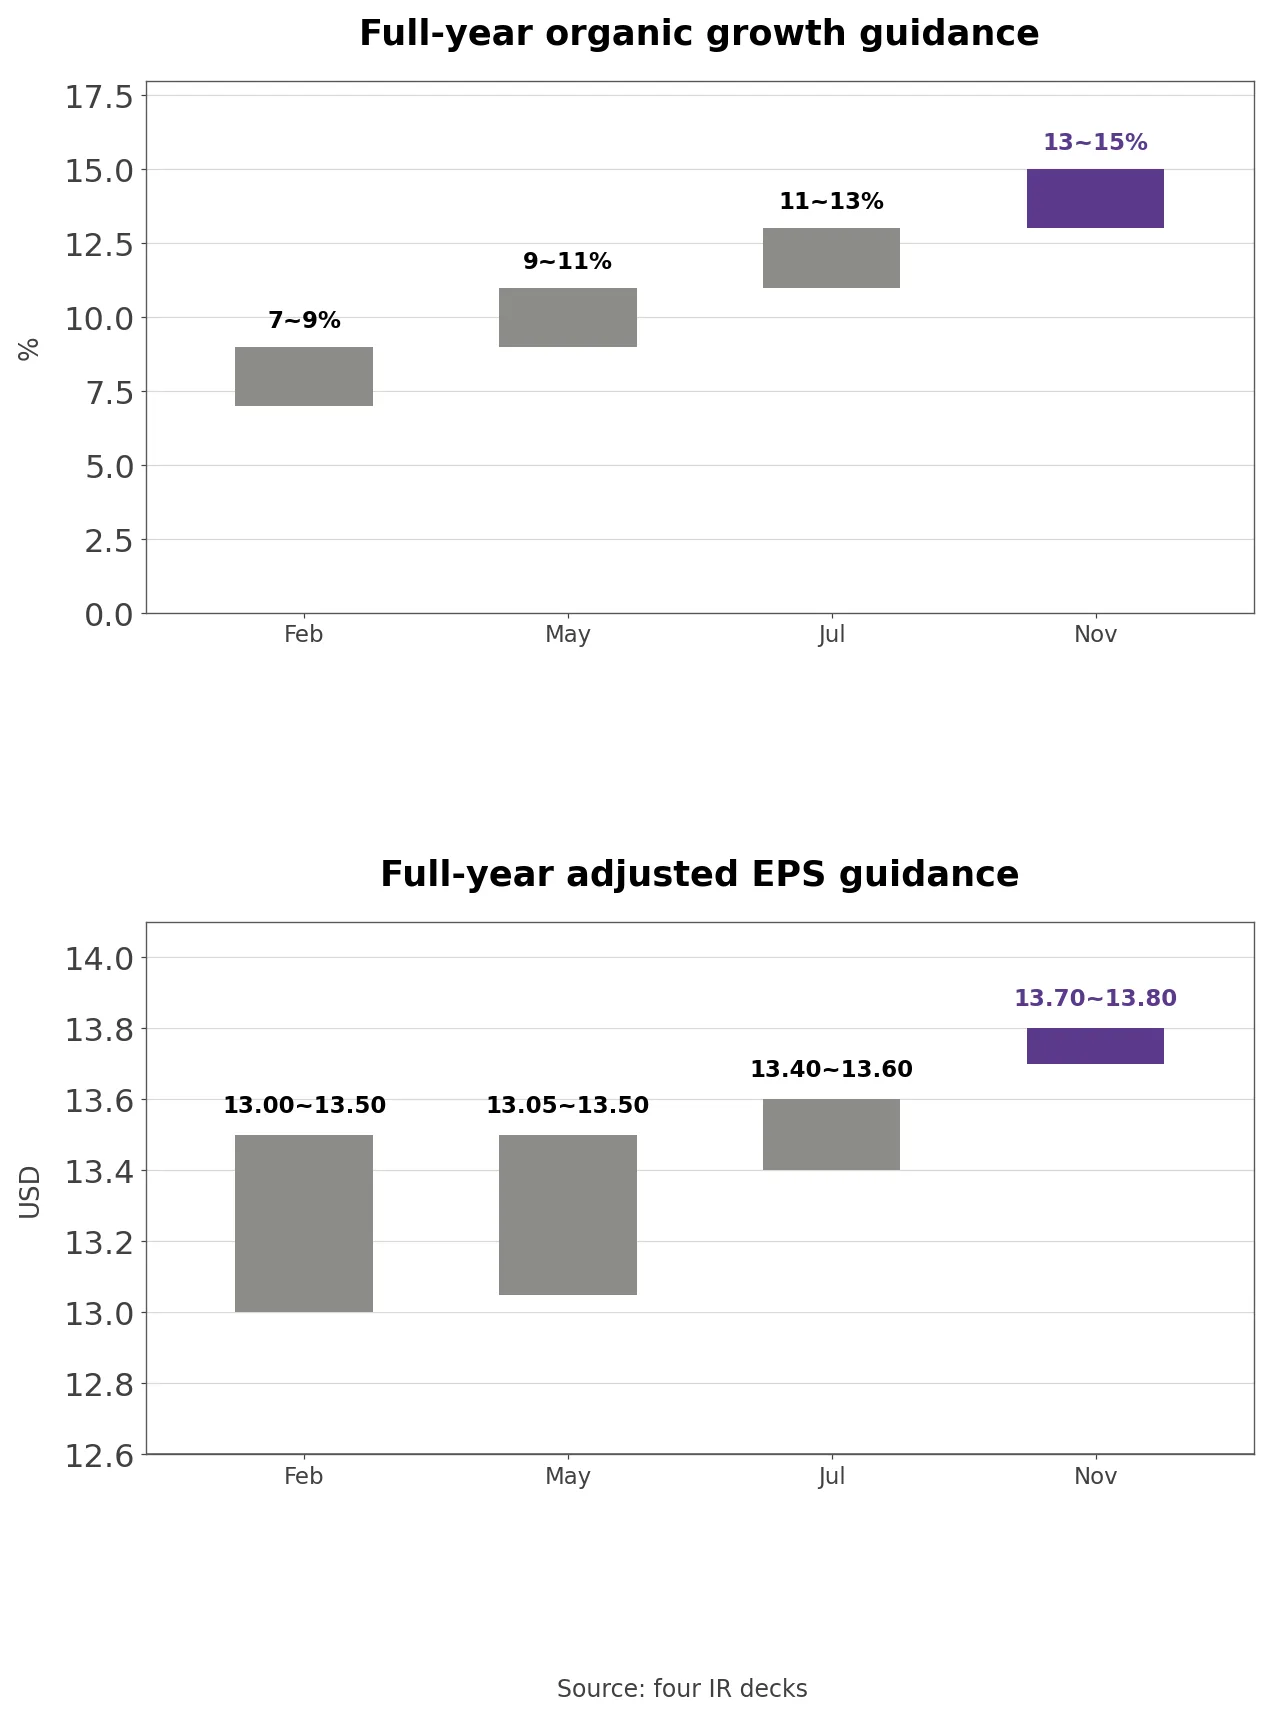
Across this year’s four decks, the lines moved differently. Organic growth guidance went from 7% to 9% in February to 9% to 11% in May, 11% to 13% in July and 13% to 15% in November. Adjusted EPS went from $13.00 to $13.50, to $13.05 to $13.50, $13.40 to $13.60 and $13.70 to $13.80. Segment margin guidance was cut in May from 24.6% to 25.0% down to 24.1% to 24.5% and has not moved since. The cash flow ranges have not changed once since February. Slide 13 now guides segment organic growth at 18% to 20% for Electrical Americas, 15% to 17% for Electrical Global, 7.5% to 9.5% for Aerospace and 2% to 4% for Mobility; Ruiz said the two electrical midpoints were each raised by 4 points.
Own calculation (four decks and the earnings release): The organic growth midpoint rose 6 points, from 8% to 14%, which on 2025 sales of $27.45 billion is about $1.65 billion of revenue. Over the same span, the adjusted EPS midpoint rose 3.8%, from $13.25 to $13.75, or about $195 million of adjusted earnings at third-quarter diluted shares. Free cash flow at the $4.1 billion midpoint is 76.5% of guided adjusted earnings.
The release’s reconciliation puts 2026 GAAP EPS at $10.39 to $10.49 and splits the gap to adjusted EPS into $1.26 of acquisition and divestiture charges, $0.19 of restructuring and $1.86 of intangible amortization, $3.31 in total. In 2025 the same three items were $0.37, $0.26 and $0.99, $1.62 in total. The gap has doubled in a year, mostly because of Boyd Thermal and Ultra PCS, a defense aerospace power business also bought this year.
Eaton attributes the slower flow-through to capacity expansion costs and commodity prices. On the call, CEO Paulo Ruiz said 18 of 25 expansion projects are complete and the steepest part of the ramp is behind the company. The fourth-quarter adjusted EPS midpoint of $4.10 matches the full-year midpoint minus nine-month adjusted EPS of $9.64.
Slide 9 and the Electrical Americas Margin
Earnings presentation slide 9 with Electrical Americas margin of 29.8 percent and 16 billion backlog
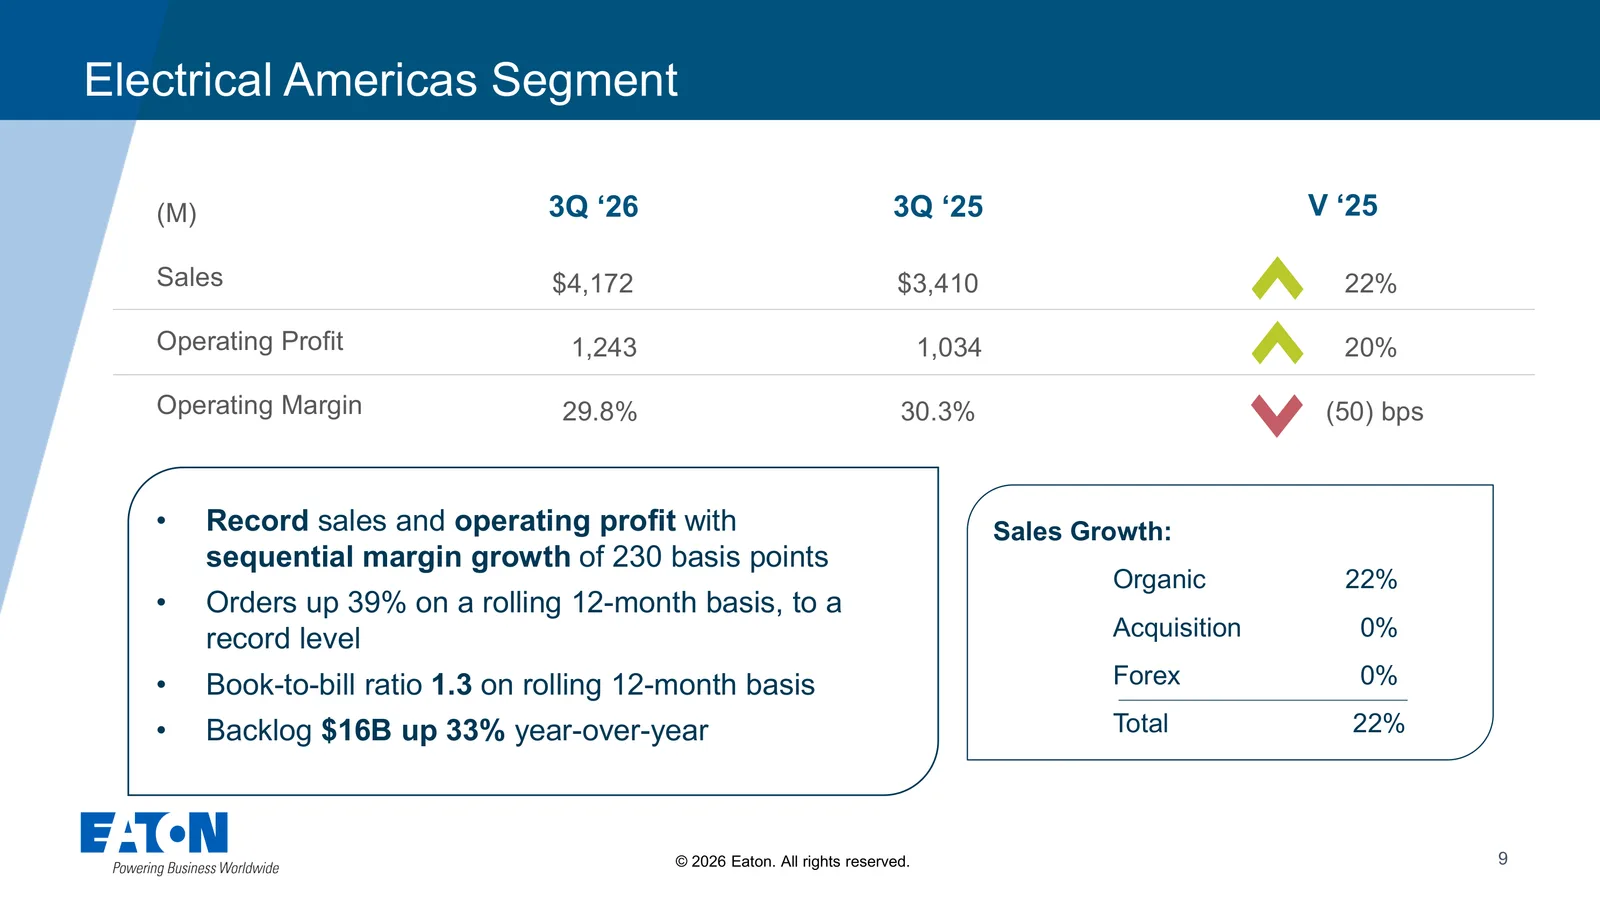
Slide 9 shows Electrical Americas third-quarter sales of $4.172 billion and operating profit of $1.243 billion, both records. Organic growth was 22% and the margin reached 29.8%, up 2.3 points from the second quarter. The year-earlier column shows 30.3%, so the margin was -0.5 points year over year. The slide lists rolling 12-month orders up 39%, a 1.3 book-to-bill and backlog of $16 billion, +33%. The release adds that “Record orders grew sequentially, backlog continued to expand.” Sales growth was all organic, because Fibrebond, bought in April 2025, now counts as organic, and operating profit grew 20%, slower than sales.
CFO Dave Foster said most of the year-over-year margin decline came from temporary commodity costs and that price actions in the second quarter and early third quarter left price ahead of cost in dollars in the third quarter. Eaton announced list price increases from January 2 and finished price talks with two large customers in October. Slide 13 guides the full-year Electrical Americas margin at 28.8% to 29.2%, Electrical Global at 19.6% to 20.0% and Aerospace at 24.3% to 24.7%. Slide 5 adds four leading indicators for the segment: backlog up 33%, 12-month orders up 39%, the negotiations pipeline up 55% and mega project announcements up 85% year to date.
Own calculation (slides 9 and 13 and the earnings releases): The nine-month Electrical Americas margin was 27.7%, 1.1 points below the bottom of the full-year range. Assuming fourth-quarter sales equal the third quarter, hitting the 29.0% midpoint needs a fourth-quarter margin of about 32.5%, 2.7 points above the third quarter. Quarterly margins in the first three quarters of 2025 were 30.0%, 29.5% and 30.3%; the same quarters of 2026 came in at 25.6%, 27.5% and 29.8%. Margins rose every quarter this year but stayed below the year before each time.
The Bull and Bear Case After the November Sell-off
The bull case rests on orders and backlog. Electrical orders are up 43% on a rolling 12-month basis, and Electrical backlog is above $20 billion, up 46%. Data center revenue grew about 65% in the third quarter and data center orders more than doubled over 12 months. Eaton expects about 11% end-market growth in 2027, above its 2026 to 2030 organic growth target of 6% to 9% a year.
The bear case rests on earnings that reach shareholders. Nine-month segment profit rose $974 million while pretax income fell $17 million. The 2026 GAAP EPS midpoint of $10.44 is essentially the 2025 figure of $10.45, or 33.8 times the share price. Debt has doubled and buybacks have stopped. The shares are 23.3% below the August high, but the GAAP multiple is still above its five-year median.
From Truck Parts to Data Center Power
Eaton weekly share price since 2021 and daily closes since July 2026
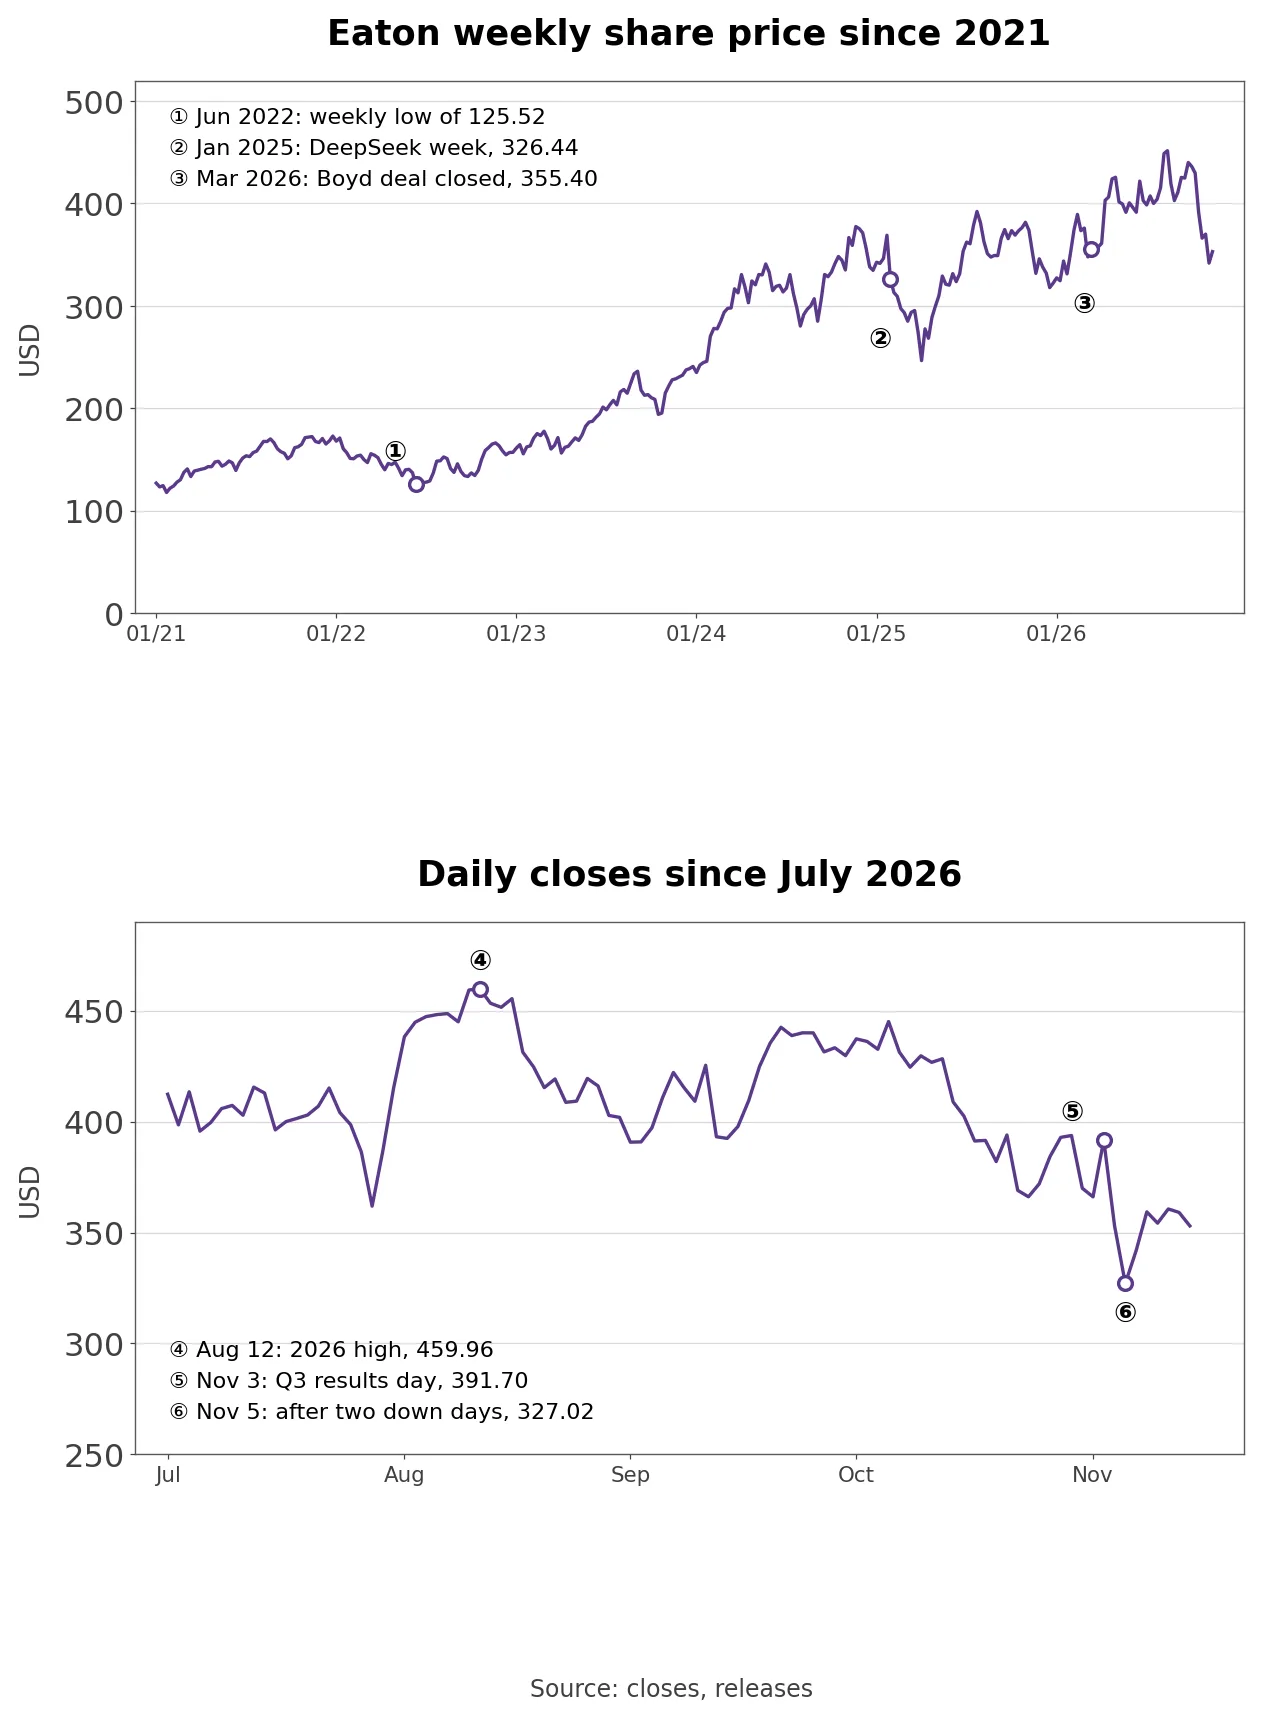
Eaton started in 1911 as a US truck parts maker. Its 2012 acquisition of Cooper Industries moved its domicile to Ireland, and it later sold its hydraulics business and shifted toward electrical and aerospace. The weekly close bottomed at $125.52 in June 2022 and climbed with generative AI data center spending from 2023, reaching $377.41 in November 2024.
On January 27, 2025, China’s DeepSeek released a low-cost AI model, data center power stocks sold off together, and Eaton fell -15.6% in a day. Eaton closed the Boyd Thermal deal on March 12, 2026, and in June agreed to separate Mobility in a Reverse Morris Trust, shrinking the vehicle side further.
The stock peaked at $459.96 on August 12 and fell -7.6% on September 14. On November 3, results day, it rose +7.0% to $391.70. It then fell -9.9% and -7.4% on the next two days to $327.02.
Market data daily closes show that over the same two sessions, from the November 3 close to the November 5 close, Vertiv fell 25.1%, GE Vernova 16.1% and Hubbell 6.8%. Eaton’s 16.5% decline moved with data center power stocks as a group. Measured from August 12, Eaton is down 23.3%, Vertiv 29.9% and GE Vernova 22.8%.
What Sits Between Segment Profit and Pretax Income
Q3 bridge from segment profit to pretax income and quarterly segment profit vs pretax income
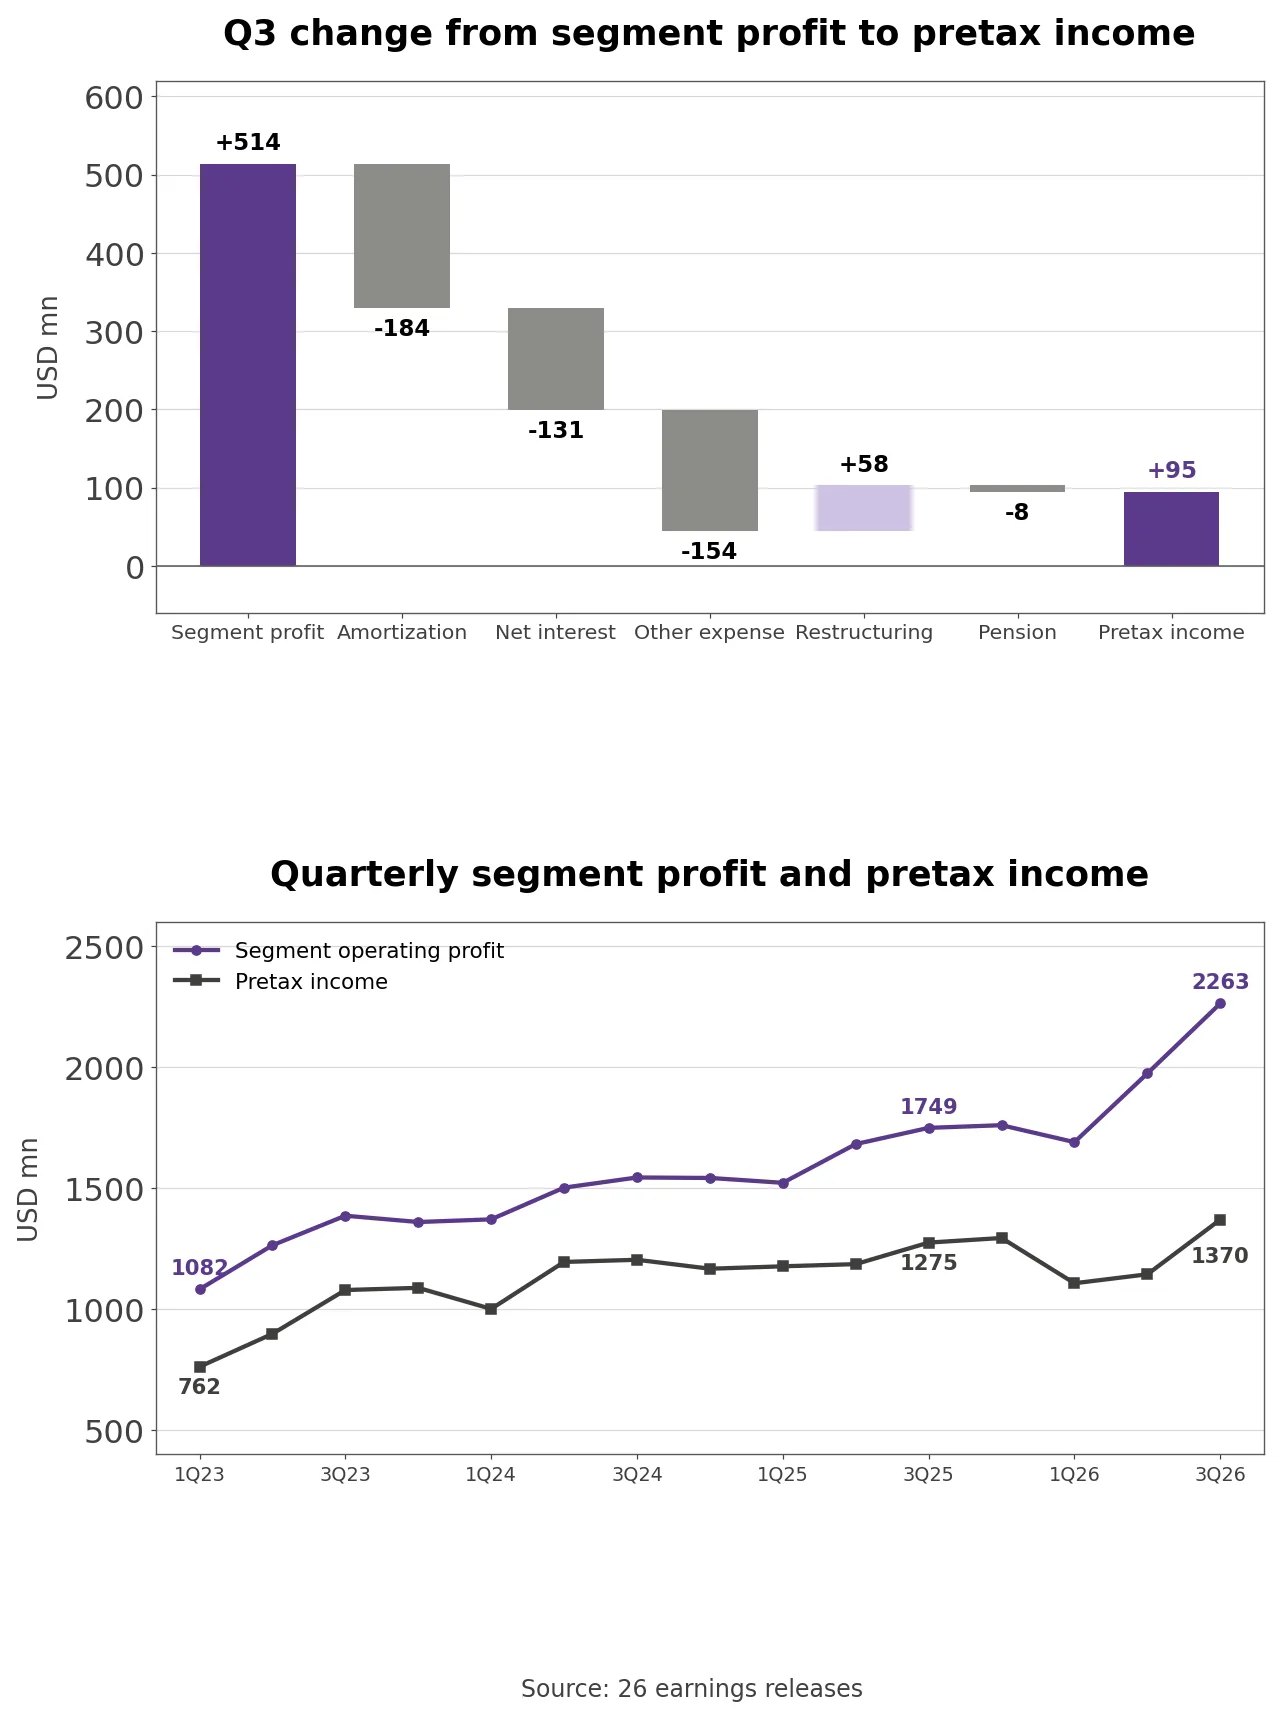
Own calculation (26 earnings releases): The segment table in each release adds up operating profit from the four businesses, then subtracts intangible amortization, net interest, pension, restructuring and other corporate expense to reach pretax income. Those corporate lines totaled $474 million in the third quarter of 2025 and $893 million in the third quarter of 2026. Segment profit rose $514 million, from $1.749 billion to $2.263 billion, while pretax income rose $95 million, from $1.275 billion to $1.370 billion.
The extra $419 million breaks into $184 million more amortization, $131 million more net interest and $154 million more other expense, partly offset by $58 million less restructuring. Net interest roughly tripled, from $67 million to $198 million. Other expense includes deal-related costs and corporate overhead.
Over nine months the gap is wider. Segment profit rose $974 million, from $4.953 billion to $5.927 billion, +19.7%. Pretax income fell $17 million, from $3.637 billion to $3.620 billion. Amortization rose $344 million, net interest $334 million and other expense $337 million.
As a share of segment profit, corporate lines were 22.2% in the third quarter of 2023, 22.0% in the third quarter of 2024 and 27.1% in the third quarter of 2025, then 34.5%, 42.0% and 39.5% in the first three quarters of 2026. GAAP EPS in those three quarters was $2.22, $2.11 and $2.77, against $2.45, $2.51 and $2.59 a year earlier: two quarters lower, one higher.
Adjusted EPS strips out amortization, deal charges and restructuring. Nine-month adjusted EPS was $9.64, +10.3%, while GAAP EPS was $7.10, -5.8%. Net interest stays in adjusted EPS, so acquisition financing reduces earnings on either measure.
The $9.55 Billion Boyd Deal and Doubled Debt
Earnings presentation slide 7 with Boyd Thermal revenue outlook of about 1.9 billion
Per the 10-Q, Eaton bought Boyd Thermal on March 12 for $9.55 billion net of cash. Boyd makes liquid-cooling systems and thermal components for data center servers and employs more than 6,000 people. Eaton booked $7.142 billion of the price as intangible assets such as customer relationships, technology and backlog, which are amortized against GAAP earnings each year.
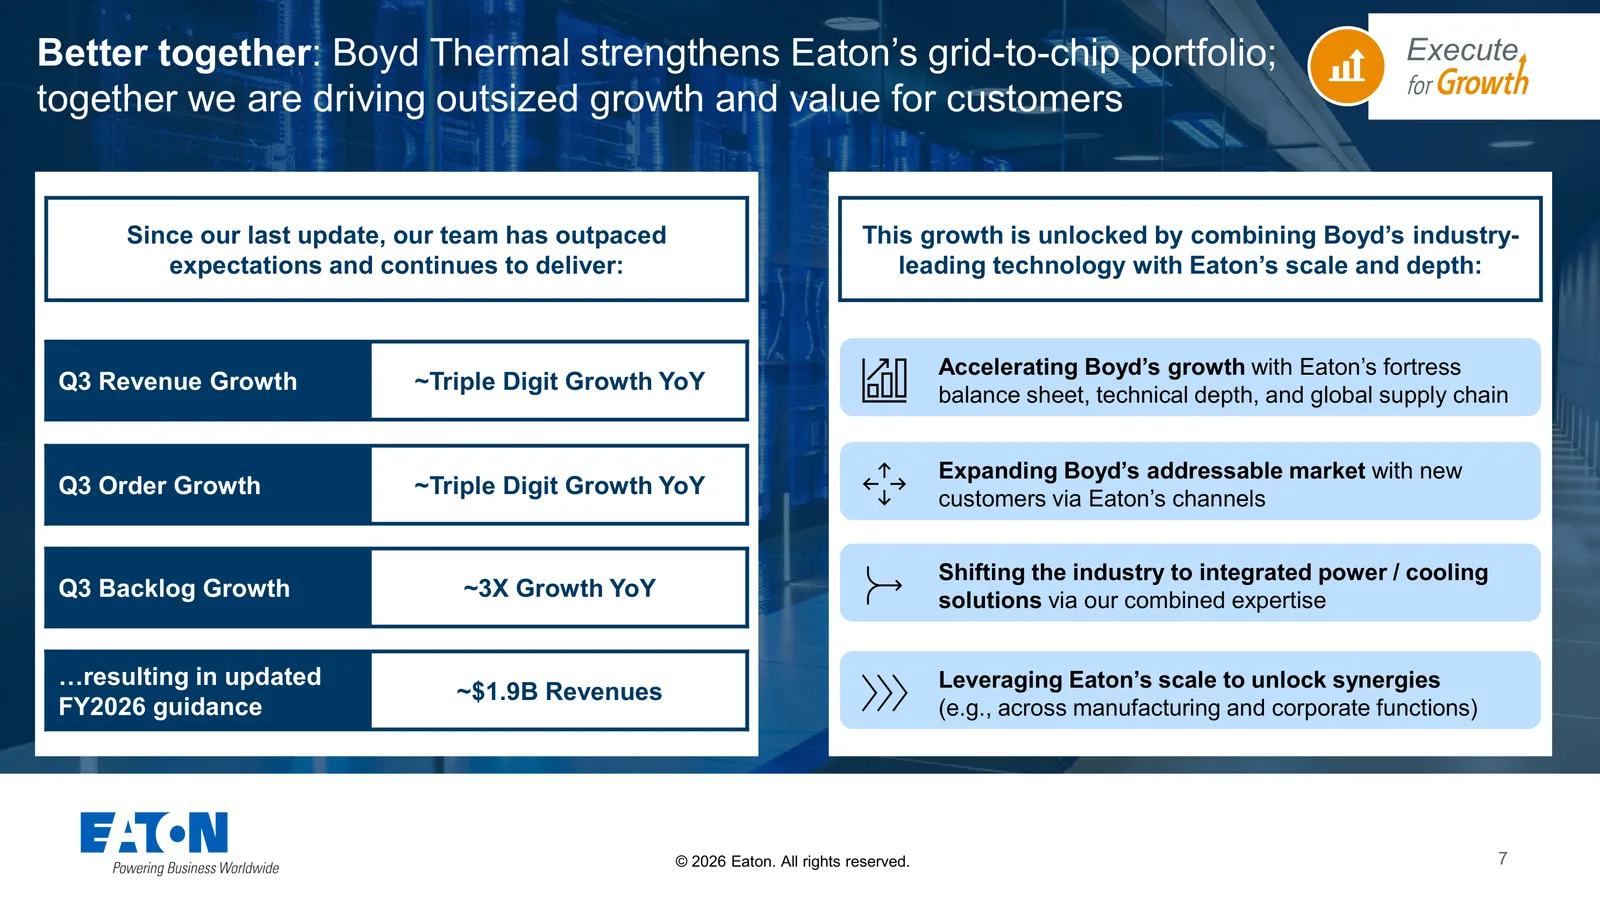
From the acquisition through September, Boyd posted $1.058 billion of sales and $257 million of segment operating profit, a 24.3% margin. Eaton raised its 2026 Boyd revenue outlook for the third time, to $1.9 billion, of which $1.6 billion lands on Eaton’s books. Slide 7 says Boyd’s third-quarter orders and revenue roughly doubled year over year and its backlog roughly tripled.
Own calculation (10-Q balance sheet and cash flow statement): Total debt rose $10.211 billion, from $9.895 billion at year-end 2025 to $20.106 billion at the end of September. Share repurchases in the first nine months were zero, against $1.669 billion a year earlier, and dividends were $1.285 billion. Boyd’s $257 million of segment profit since the deal is less than the $334 million nine-month increase in net interest.
Annualized, third-quarter net interest of $198 million is about $790 million, roughly 3.9% of September debt. Third-quarter operating cash flow was $1.310 billion and free cash flow $1.034 billion, and nine-month free cash flow of $2.222 billion beat $1.979 billion a year earlier. For now, cash goes to deals and debt before buybacks. Ultra PCS added $166 million of sales and $47 million of segment profit after its acquisition. On the call, Ruiz said Eaton has deployed $14 billion on M&A and does not expect another Boyd-sized deal in the next 12 months. In September Eaton agreed to buy Italian medium-voltage distribution company COL Group for €810 million ($921 million).
What Does Eaton Do and Where Does It Earn Money?
Eaton reports four segments. Nine-month sales growth was +41.3% in Electrical Global, +20.0% in Electrical Americas, +13.4% in Aerospace and +2.5% in Mobility. Of $24.929 billion in nine-month sales, Electrical Americas was 47.0%, Electrical Global 28.8%, Aerospace 14.3% and Mobility 9.9%. Electrical Americas earned $3.253 billion of operating profit, 54.9% of the segment total, ahead of Electrical Global at $1.449 billion, Aerospace at $881 million and Mobility at $345 million.
Third-quarter margins were 29.8% in Electrical Americas, 24.9% in Aerospace, 21.1% in Electrical Global and 17.2% in Mobility. Because the highest-margin segment earns more than half the profit, each point of Electrical Americas margin is worth about $117 million on nine-month sales.
Electrical Americas sells power distribution equipment and UPS to North American data centers, commercial buildings, factories and utilities. It includes Fibrebond, the modular power enclosure maker bought in April 2025, whose revenue Ruiz said rose from $375 million before the deal to $600 million in its first year. Electrical Global combines the electrical business in Europe and Asia with Boyd Thermal. Its third-quarter sales were $2.727 billion, +58%, with 27% organic growth plus 31% from Boyd, and its margin of 21.1% was 2.0 points higher than a year earlier. Aerospace makes fuel, hydraulic and power components for commercial and defense aircraft; its third-quarter margin was 24.9% and backlog grew 33%. Mobility, the truck transmission and car parts business, earned a 17.2% margin and is due to be separated in early 2027.
Data Centers Are 21% of Sales but Most of the Growth
Earnings presentation slide 15 with 2027 end market growth assumptions
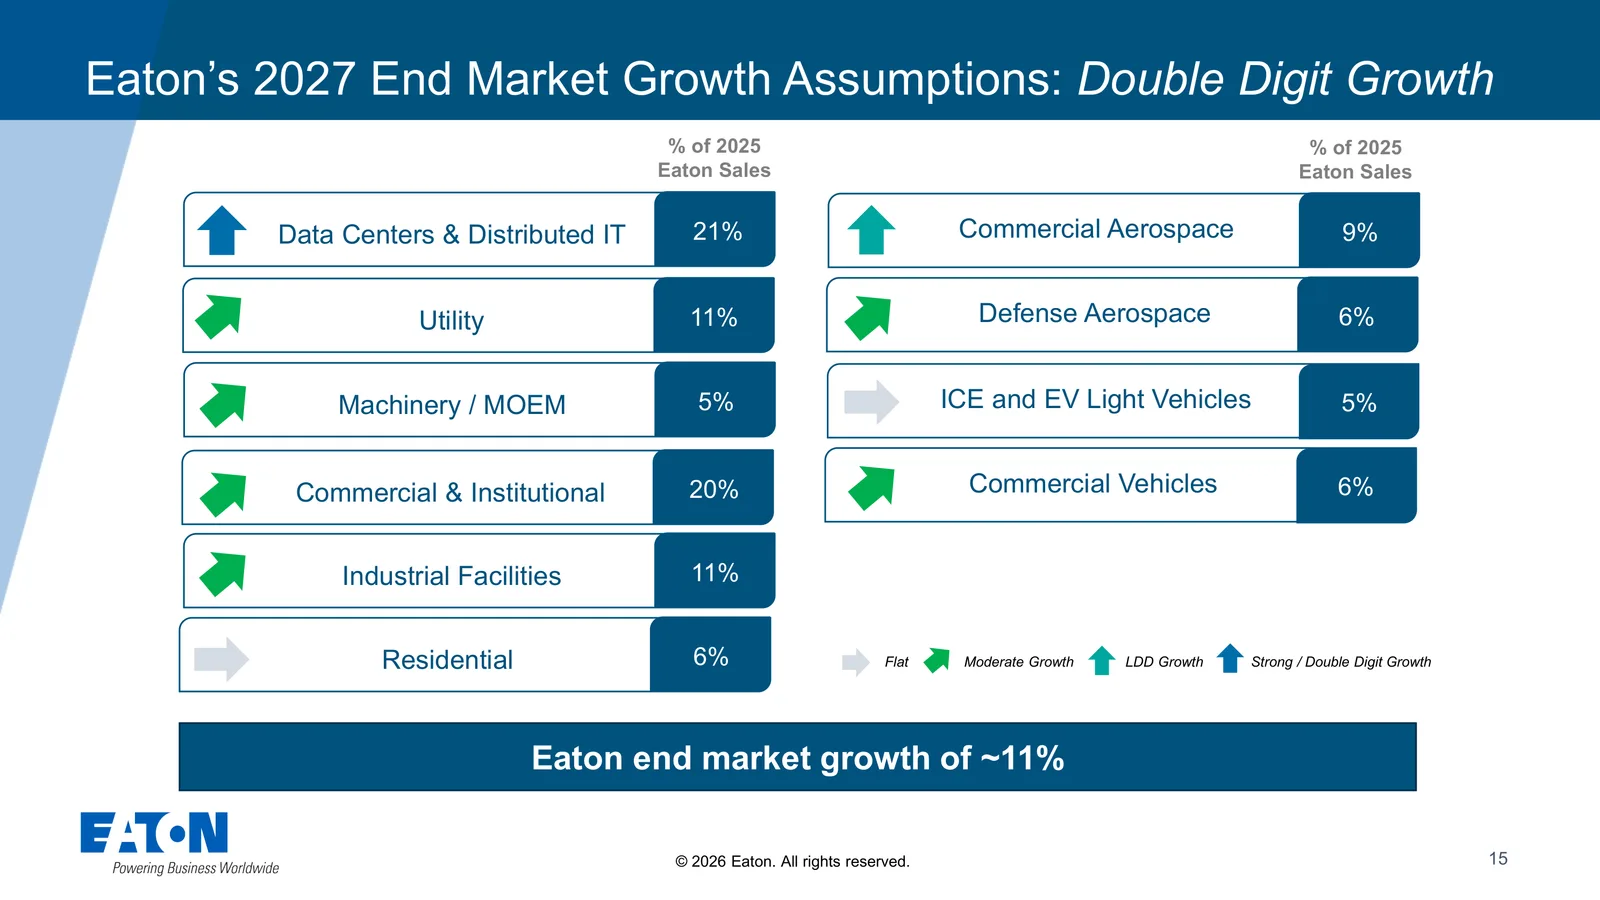
Slide 15 splits 2025 sales by end market: data centers and distributed IT 21%, commercial and institutional 20%, utility 11%, industrial facilities 11%, commercial aerospace 9%, residential 6%, defense aerospace 6%, commercial vehicles 6%, machinery 5% and light vehicles 5%. Eaton expects none of them to shrink in 2027, with data centers and commercial aerospace growing double digits and residential and light vehicles flat.
On the call, Ruiz said data center revenue has grown more than 35% for nine straight quarters, and that announced projects Eaton tracks total 366 GW, up from 307 GW a quarter earlier, against 50 GW installed. The long-term plan assumed 17% annual data center growth; this year it has been about 60%. He added that US modular power revenue, including Boyd, will reach about $1 billion in 2026, and he pointed to Eaton designing and making the transformers, switchgear, breakers and UPS inside its modules as the edge over assemblers.
Orders outside data centers are growing too. On a rolling 12-month basis, third-quarter orders were up about 20% for utilities, 25% for residential and 55% for machine builders. On the shift to 800V direct current power in next-generation data centers, Ruiz said Eaton’s medium-voltage solid-state transformer passed UL testing in October and that Eaton sells equipment for both AC and DC designs.
Eaton vs. Vertiv and Other Power Equipment Peers
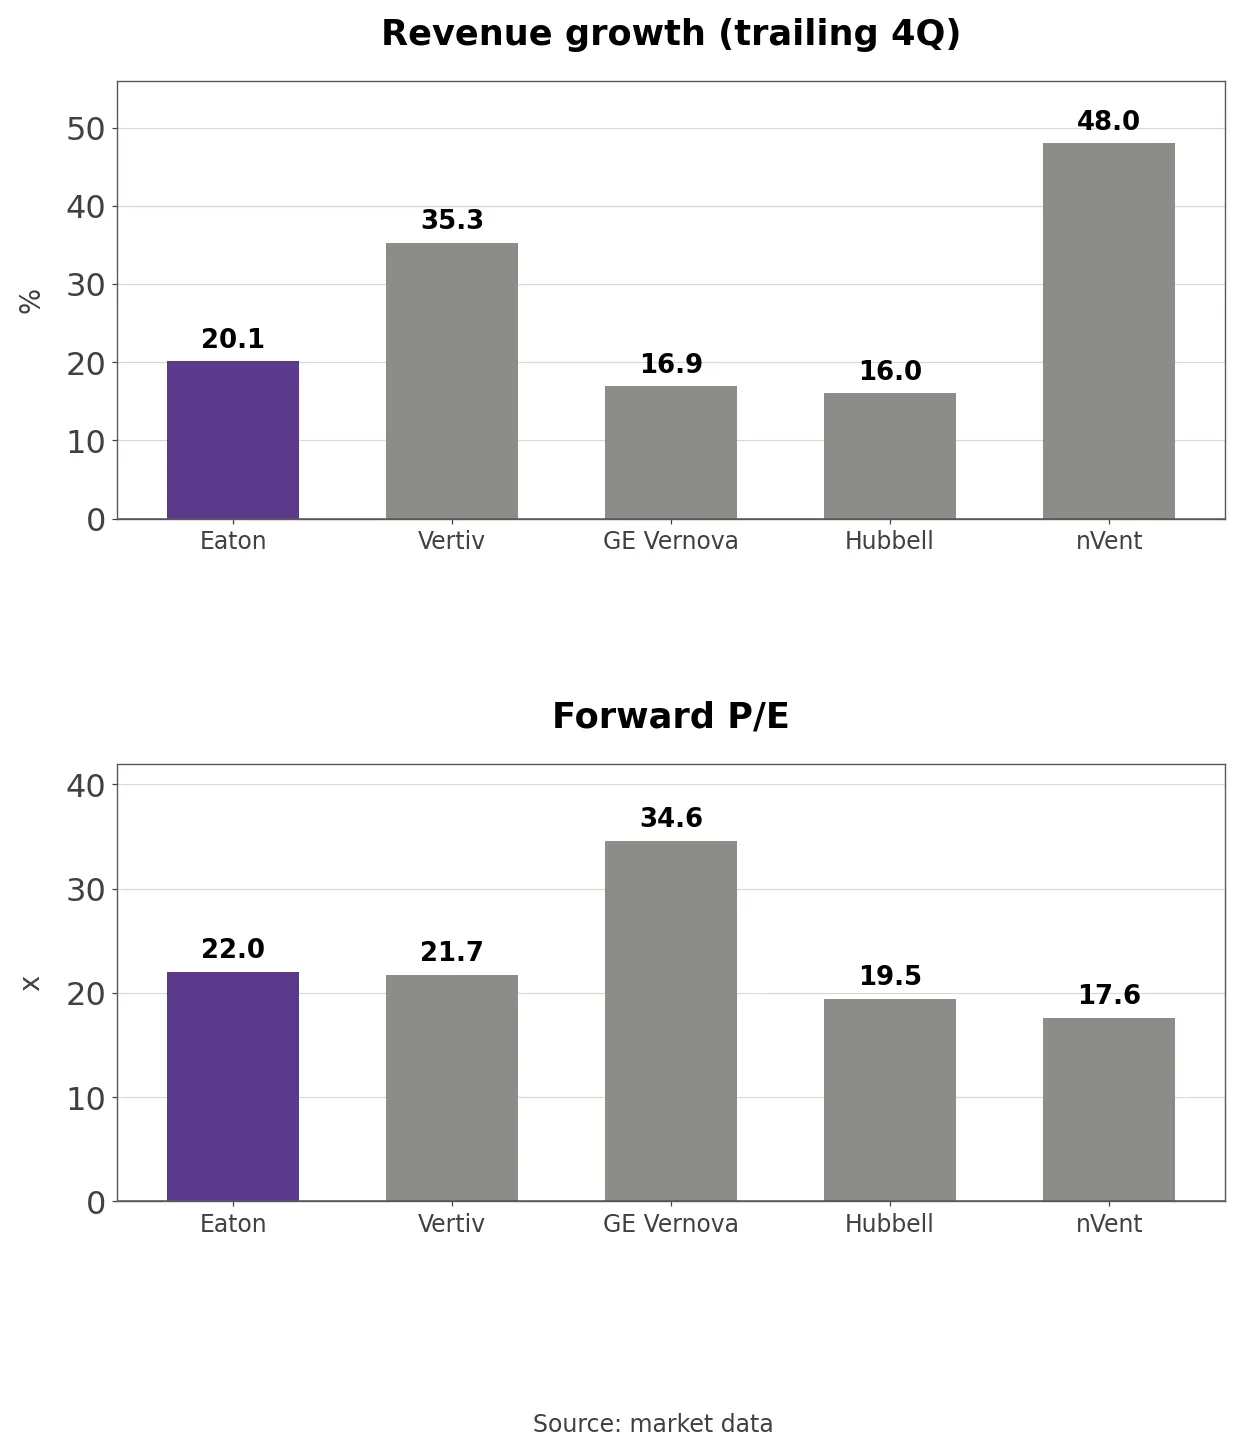
Revenue growth and forward P/E at Eaton Vertiv GE Vernova Hubbell and nVent
The peer set has four names. Vertiv, which sells both power and cooling to data centers, is the closest competitor. GE Vernova makes gas turbines and grid equipment, Hubbell makes utility distribution components and nVent makes enclosures and cooling products. Market values are $211.4 billion for GE Vernova, $137.1 billion for Eaton, $77.8 billion for Vertiv, $23.1 billion for Hubbell and $18.5 billion for nVent.
Market data show trailing revenue growth of 48.0% at nVent, 35.3% at Vertiv, 20.1% at Eaton, 16.9% at GE Vernova and 16.0% at Hubbell. Forward P/E on next-year estimates is 34.56x at GE Vernova, 22.04x at Eaton, 21.74x at Vertiv, 19.46x at Hubbell and 17.57x at nVent.
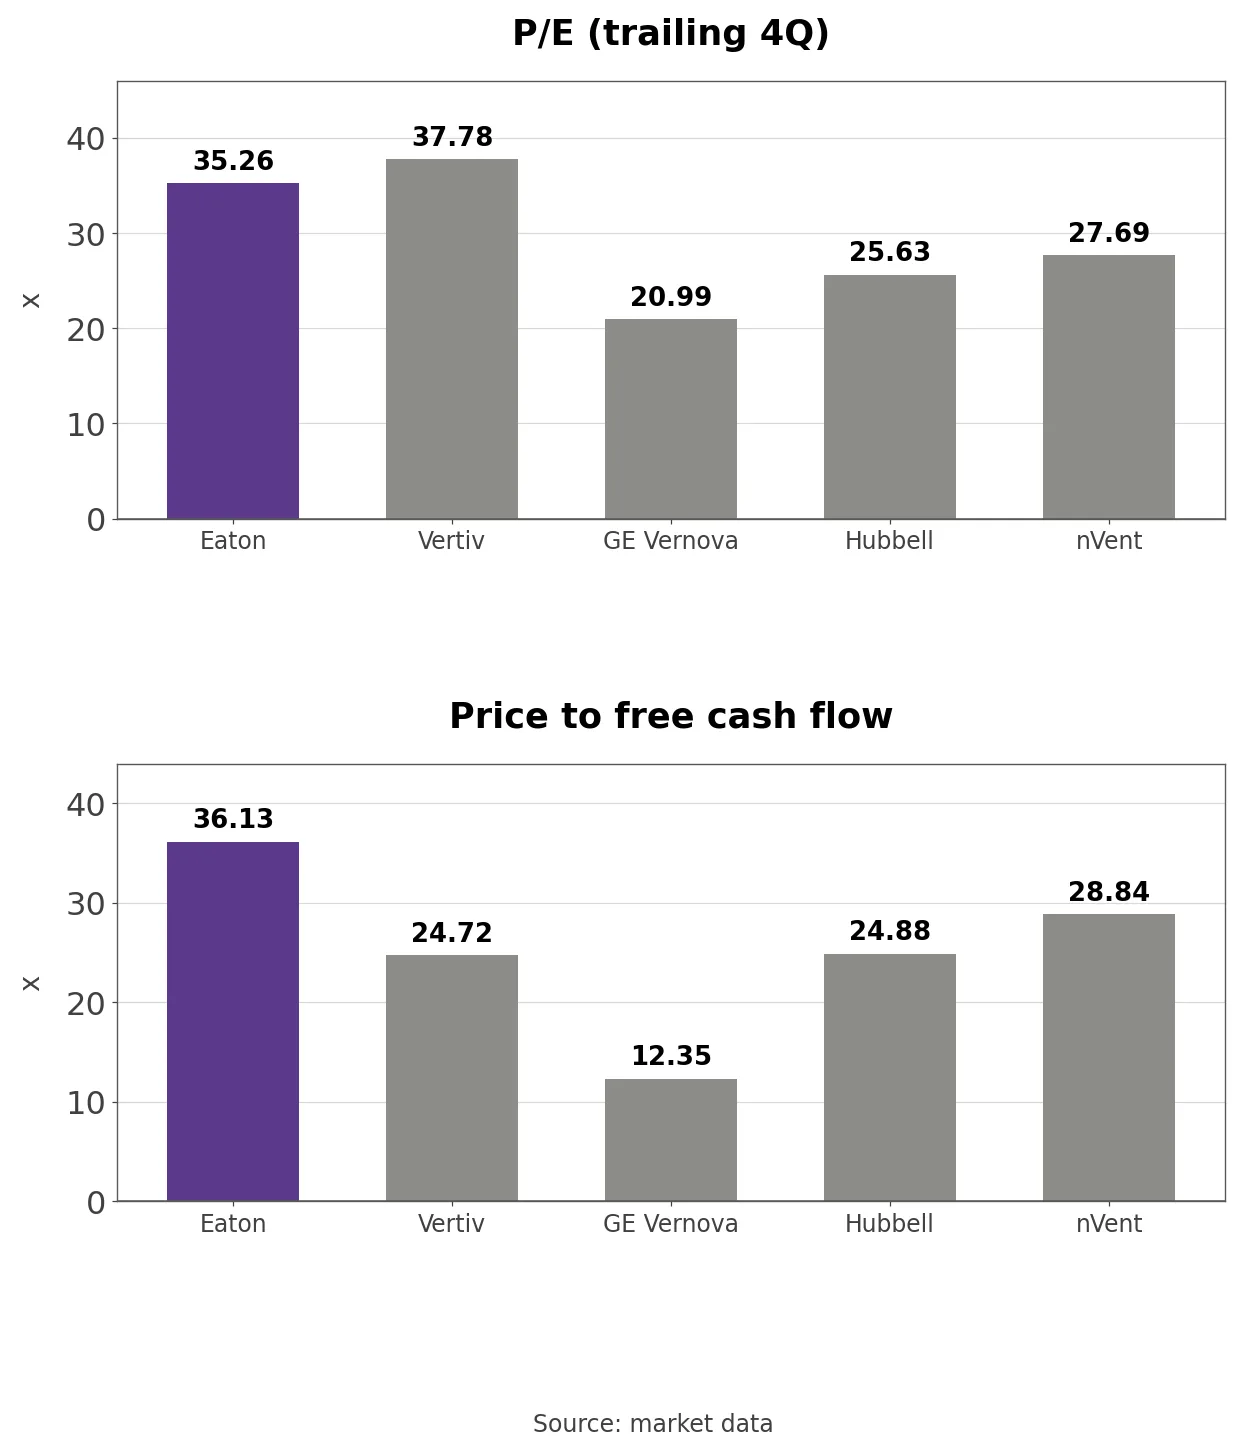
Trailing P/E and price to free cash flow at Eaton and four power equipment peers
Trailing GAAP P/E is 37.78x at Vertiv, 35.26x at Eaton, 27.69x at nVent, 25.63x at Hubbell and 20.99x at GE Vernova. Price to free cash flow is highest at Eaton at 36.13x, ahead of nVent at 28.84x, Hubbell at 24.88x, Vertiv at 24.72x and GE Vernova at 12.35x. ABB’s US depositary shares have no forward P/E, so ABB is left out of the charts, but its trailing P/E of 30.74x and price to free cash flow of 30.62x are both below Eaton’s.
By my calculation, Eaton’s trailing P/E is 1.6 times its forward P/E, close to Vertiv’s 1.7 times, but Vertiv grows 15.2 points faster. Eaton is priced like Vertiv on forward earnings and is the most expensive of the group on free cash flow. Data center exposure also explains the size of the November drop: Vertiv fell the most and Hubbell, with more utility exposure, the least.
GAAP P/E and Adjusted P/E Bands
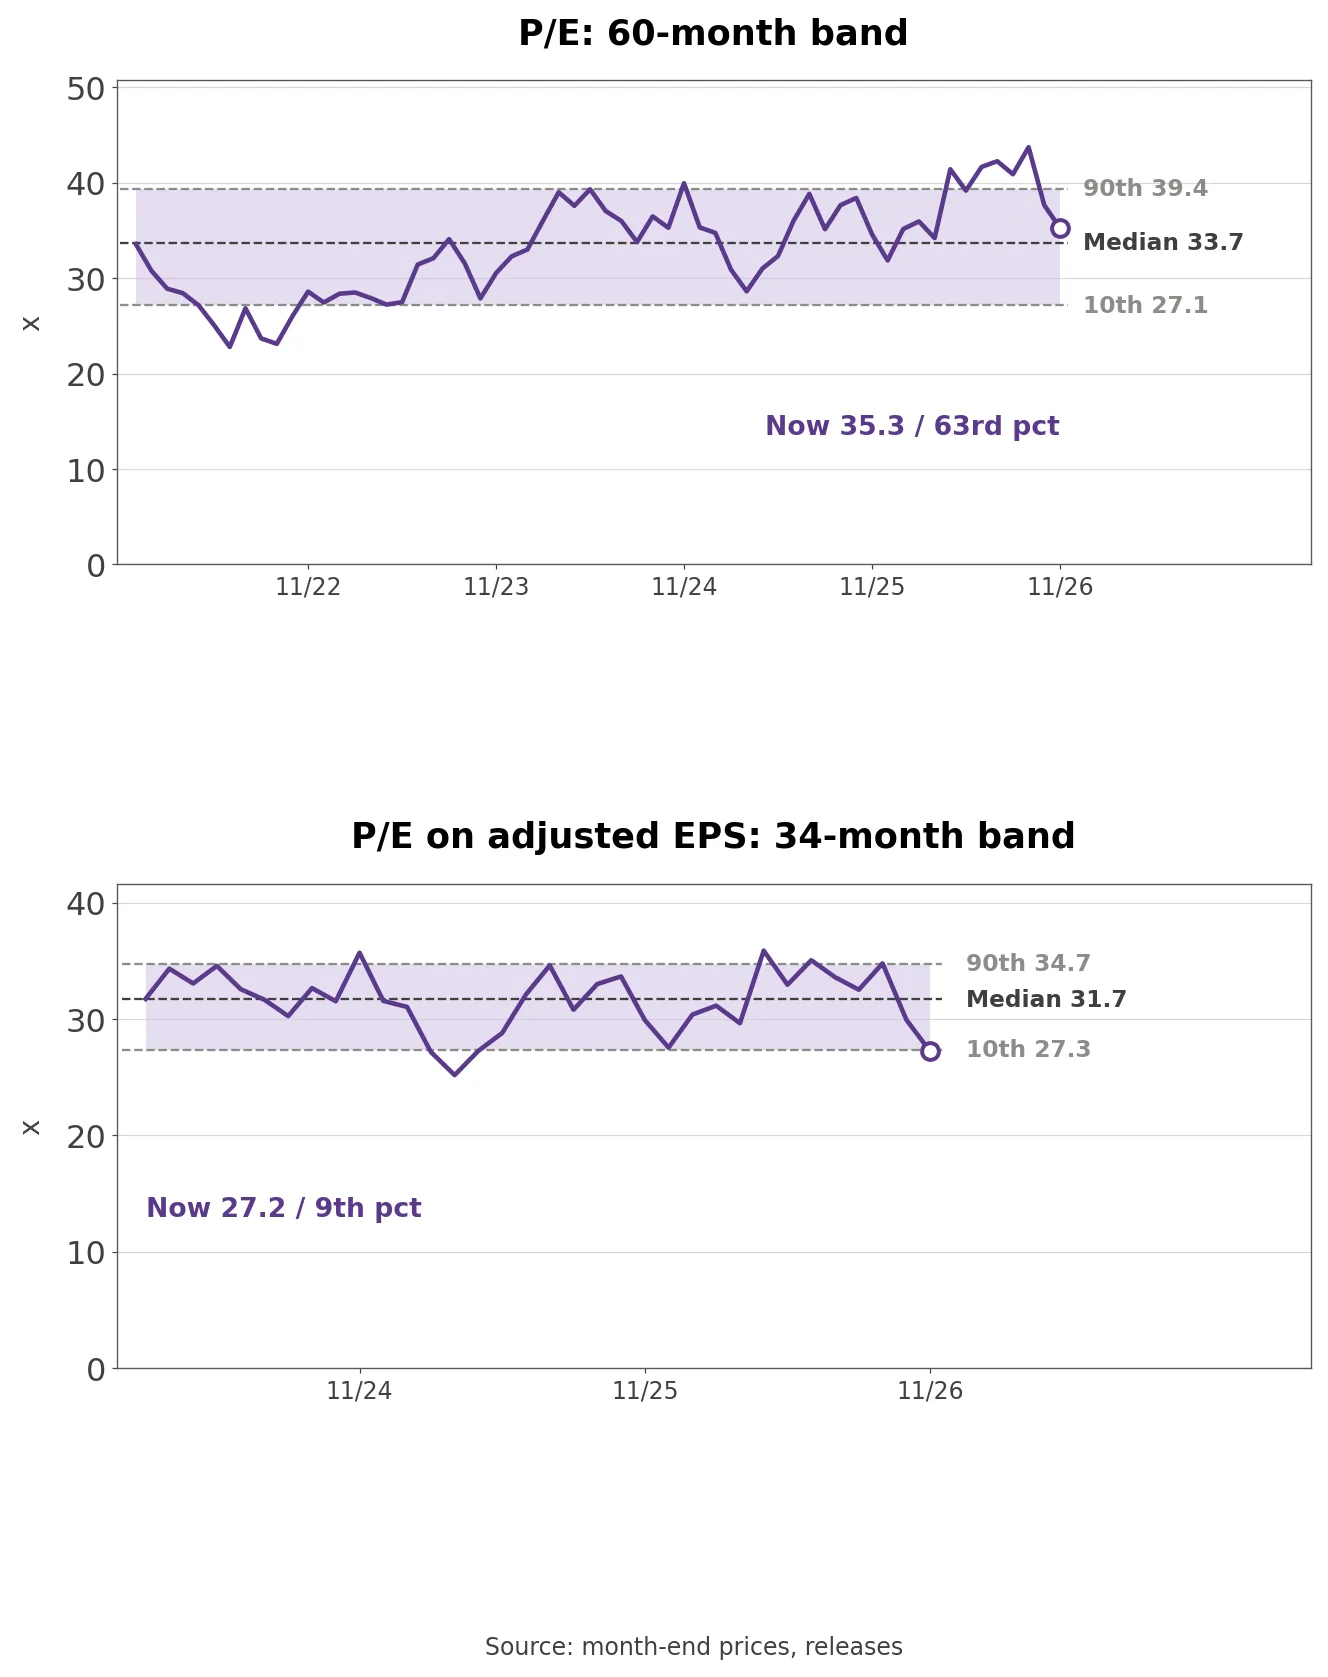
Eaton GAAP P/E over 60 months and adjusted P/E over 34 months
Own calculation (month-end prices and earnings releases): I divided each month-end price by trailing GAAP diluted EPS from the latest quarter reported that month to build a 60-month P/E band. Adjusted EPS can be chained only from the first quarter of 2023, so the adjusted P/E band covers the 34 months from February 2024.
GAAP P/E of 35.26x sits at the 63.3rd percentile of 60 months, above the 33.67x median, with a high of 43.71x in September 2026 and a low of 22.78x in June 2022. P/E on trailing adjusted EPS of $12.97 is 27.21x, in the bottom 8.8% of 34 months against a 31.68x median, with a high of 35.87x in April 2026 and a low of 25.17x in March 2025.
The two measures point in opposite directions. At the end of August, GAAP P/E was 40.88x and adjusted P/E 32.51x, and both fell with the share price. On adjusted earnings the stock is near the bottom of almost three years; on GAAP earnings it is still above the middle. The difference between the two is mostly Boyd’s amortization.
Three Conditions That Move the Stock
The Electrical Americas margin is the first condition. A fourth-quarter margin above 30%, and margins holding in the 30s in 2027 with the January price increase, would show the capacity costs are behind Eaton. If commodity costs outrun pricing again and the fourth quarter stays near the third, the segment misses the bottom of its range.
Free cash flow is the second. Meeting the $3.9 billion to $4.3 billion range needs $1.678 billion to $2.078 billion in the fourth quarter, against $1.573 billion a year earlier. Beating that would show capacity to pay down debt; falling short as working capital absorbs cash would keep interest costs high for longer.
Data center orders are the third. If 12-month order growth stays above 100% and tracked project capacity keeps rising, that supports the stock. If large customers cut spending and backlog shrinks, Eaton can fall with the group again, as it did in early November.
What 2027 Looks Like Without Mobility
Company disclosure (third-quarter call, November 3, 2026): Ruiz guided to about 11% end-market growth in 2027 and said about 90% of the portfolio sits in markets expected to grow. Boyd Thermal enters the organic base from March 2027, one year after the deal, and Eaton expects to raise Electrical Global’s long-term target of about 5% annual growth for 2026 to 2030 next year. The Mobility separation is planned to close in the first four months of 2027.
If Eaton meets guidance, 2026 adjusted EPS of $13.75 is 13.9% above the $12.07 of 2025, while GAAP EPS of $10.44 is flat. Mobility represents 9.9% of nine-month sales and 5.8% of segment profit. Proceeds from the separation could cut debt and net interest. Will the gap between GAAP and adjusted EPS in 2027 guidance be smaller than this year’s $3.31?