
- Chubb (NYSE: CB) earned $2.06 billion of property and casualty underwriting income in the third quarter, and $511 million of it came from releasing reserves set aside for claims in earlier years. That is the largest quarterly release in the 32 earnings releases since the fourth quarter of 2018. Strip it out and underwriting income was $1.55 billion, -18.3% below the $1.90 billion earned the same way a year earlier. In the same quarter North America commercial net premiums written fell -2.7%, while the third-quarter financial supplement shows the market yield on Chubb's fixed income portfolio at 6.2%, a full point above its 5.2% book yield. The question is what is holding up Chubb's earnings as commercial insurance prices soften, and whether higher reinvestment rates and cost cuts are big enough to replace an unusually large reserve release.
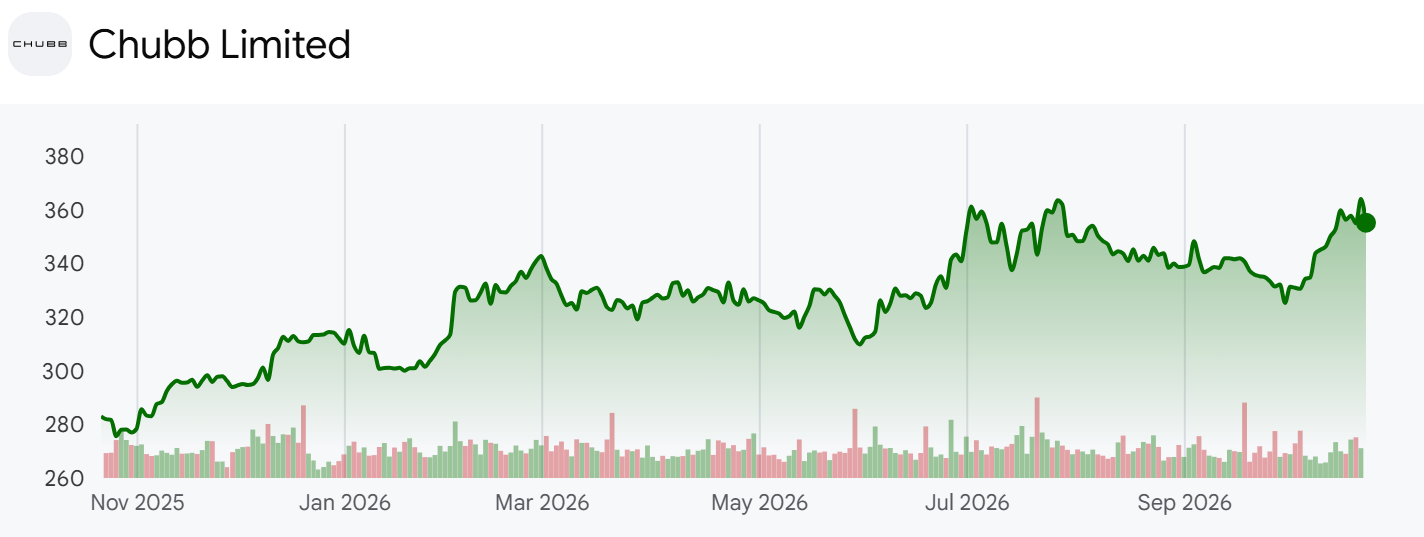
- Chubb sells commercial and personal property, casualty, accident and health, and life insurance in 54 countries and territories, and invests the premiums it collects until claims are paid. At $355.11 a share the company is worth $135.84 billion, and the stock is +28.2% over one year but -1.3% in the week of the results. The analysis parses every quarterly release since the fourth quarter of 2018 and checks the company's account against the third-quarter earnings release, the call, the December 2025 investor deck and the 2025 10-K. Reserve releases are management's own re-estimate of old claims. Core operating income is a non-GAAP measure, redefined this quarter to exclude acquired intangible amortization; the P/E band uses core operating EPS as originally reported, summed over the trailing four quarters (TTM).
The Investor Day Case for Outperforming Soft Markets
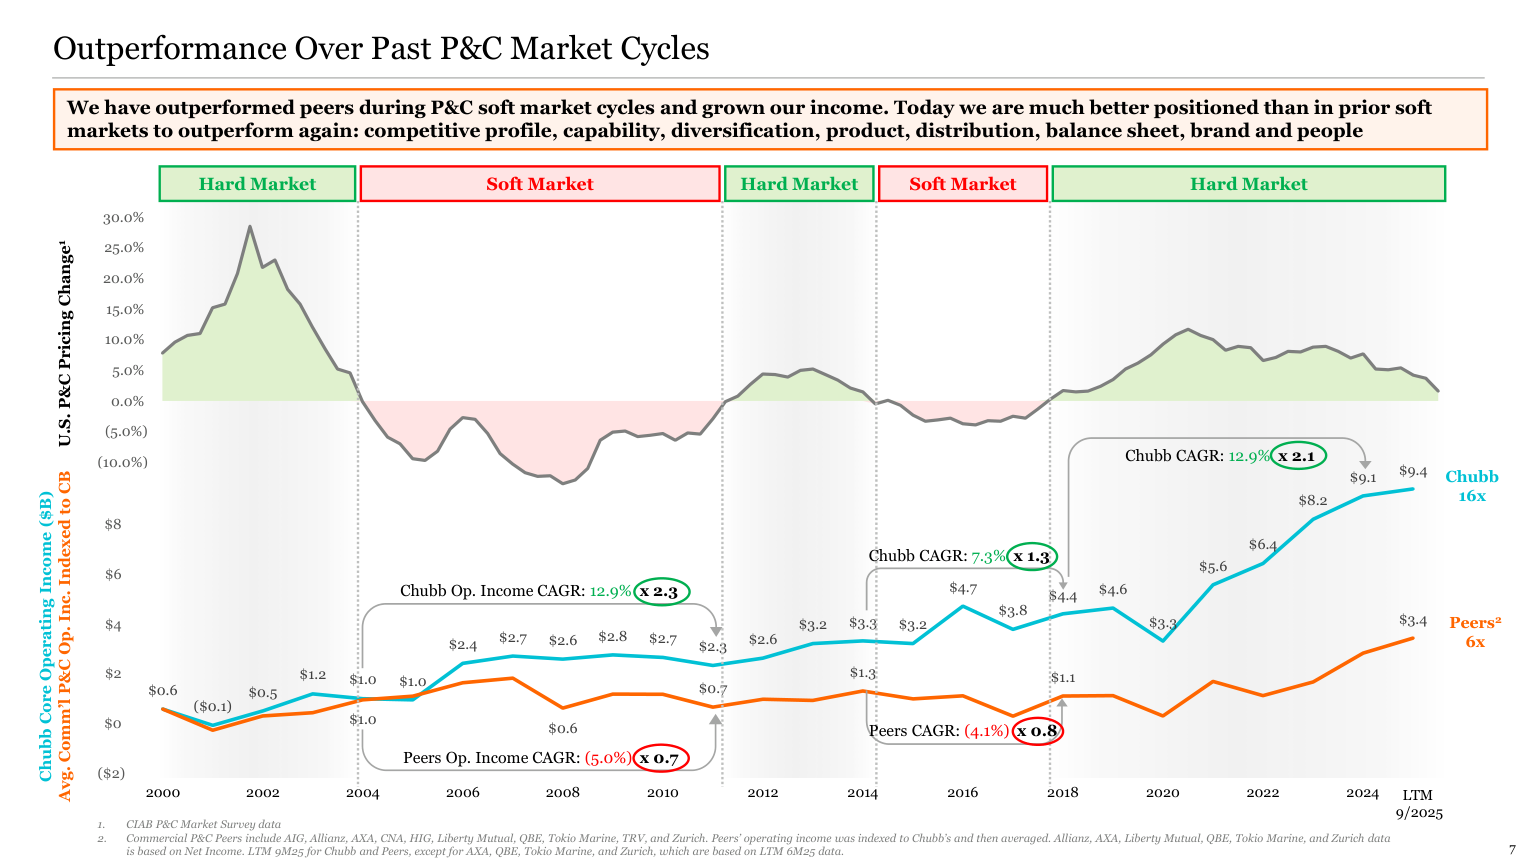
- Page 7 of the December 2025 investor presentation lays U.S. commercial P&C price changes since 2000 over shaded hard and soft markets and plots Chubb's core operating income against an average of commercial peers. In the 2004 to 2011 soft market Chubb's operating income compounded at 12.9% a year while peers shrank 5.0% a year; in the 2014 to 2018 soft market Chubb grew 7.3% a year against a 4.1% annual decline for peers. The pricing line peaks in 2021 and slides toward zero by the twelve months to September 2025. The slide's headline reads "We have outperformed peers during P&C soft market cycles and grown our income."
- Company disclosure (December 2025 investor presentation): Chubb says it is better positioned than in prior soft markets on competitive profile, capability, diversification, product, distribution, balance sheet, brand and people, and sets medium-term targets of core ROE of 14% or more, core ROTE of 20% or more, and double-digit growth in tangible book value per share.
- Third-quarter results clear two of those three bars: annualized core operating ROE was 14.9% and core operating ROTE 21.6%, but tangible book value per share grew +5.7%, short of double digits, and +15.4% only excluding accumulated other comprehensive income (AOCI). Page 5 ranks Chubb seventh among global P&C insurers by 2024 revenue but second by income and first by margin.
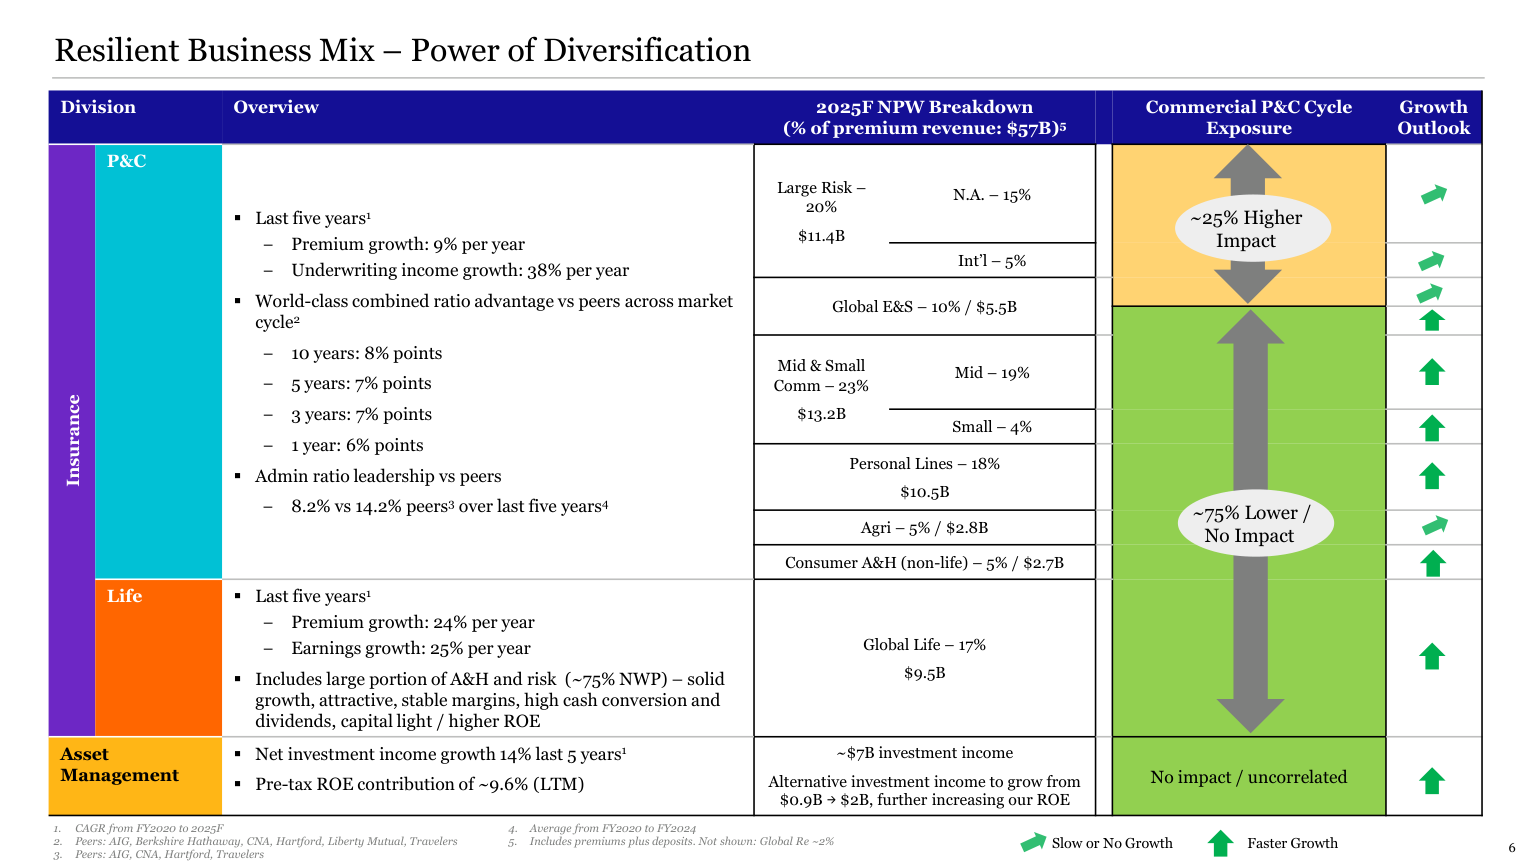
- Page 6 splits expected 2025 premiums and deposits of $57 billion by division and marks roughly 25% as highly exposed to the commercial P&C cycle and 75% as having lower or no exposure. Large risk is 20% ($11.4 billion), E&S 10%, middle market and small commercial 23% ($13.2 billion), personal lines 18%, agriculture 5%, consumer accident and health 5% and life 17% ($9.5 billion). The page also claims a combined ratio about 7 points better than peers over five years and an administrative expense ratio of 8.2% against 14.2% for peers. A digital transformation page targets, three to four years out, about 20% fewer staff and run-rate savings of about 1.5 combined ratio points.
- Own calculation (cost target in dollars): Backing P&C net premiums earned out of underwriting income and the combined ratio gives about $12.96 billion for the third quarter, so one combined ratio point is worth about $518 million a year and the 1.5-point target about $777 million. The third-quarter administrative expense ratio was 7.1% against 7.4% a year earlier, and 7.8% against 8.0% for nine months.
Book Yields Versus Reinvestment Rates
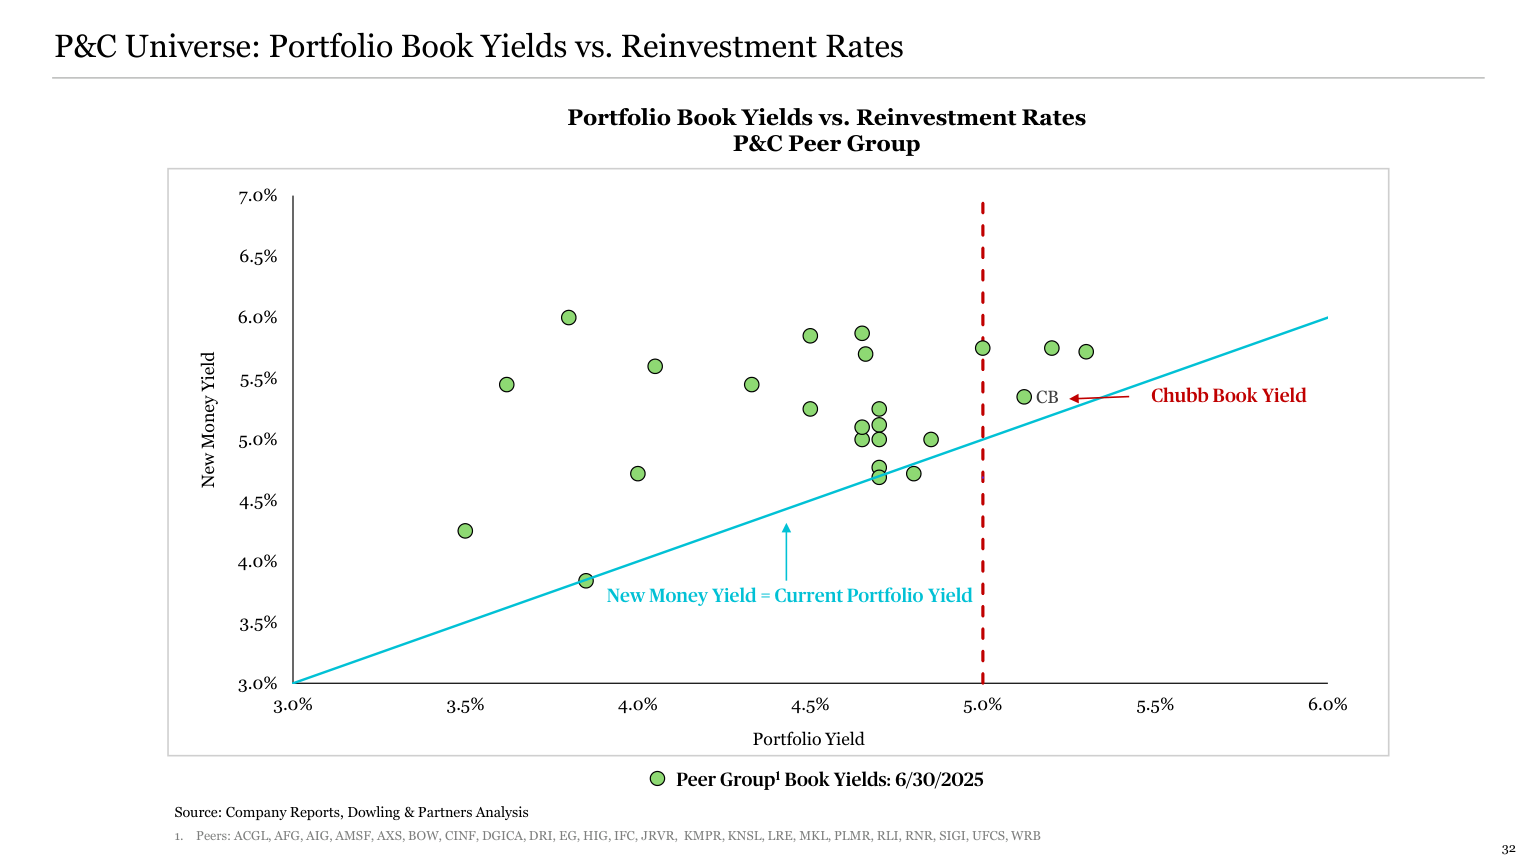
- Page 32 of the investor deck plots portfolio book yields against new money yields for 23 P&C insurers at the end of June 2025. The diagonal marks where the two are equal, and Chubb sits just above it at a book yield of roughly 5.1%. In mid-2025 Chubb could reinvest at only slightly more than its existing book. The third-quarter supplement shows how quickly that changed: the average market yield of fixed income investments went from 5.2% at the end of 2025 to 5.5% in the first and second quarters and 6.2% in the third, while the average book yield moved from 5.1% to 5.2%. Average duration lengthened from 4.7 to 5.0 years.
- Page 9 says the invested asset grew from $32 billion to $166 billion over 20 years, with a $146 billion liquid portfolio rated A on average and $20 billion in private assets that Chubb wants to lift to about 15% of the portfolio; about half of the private book is the Strategic Holdings partnership with KKR. In the third quarter that partnership agreed to sell its stake in insurance broker USI to Aon, which the release says "is expected to result in a realized gain of $460 million on an investment of $740 million."
- Company disclosure (third-quarter call): Management put the third-quarter fixed income portfolio yield at 5.2% and the average new money rate at 6.2% at September 30, with 88% of invested assets in fixed income and 12% in equity-related exposure. It described the $4.5 billion of net realized and unrealized losses caused by higher rates as temporary, saying the portfolio's maturity profile and higher reinvestment rates will amortize them fairly quickly.
- Asked whether new money yields more than 100 basis points above book yields could push the industry toward cash-flow underwriting, Chairman and CEO Evan Greenberg said only at the margin: comparing loss cost inflation with new money rates, the industry is not writing at 10% or 12% interest rates.
The Bull and Bear Case for Chubb Shares
- The bull case rests on underlying underwriting and investment income. Current accident year underwriting income excluding catastrophes rose +3.3% to $2.26 billion at a combined ratio of 82.6%. Adjusted net investment income of $1.89 billion was a quarterly record, and new money now earns a point more than the book. On core operating EPS the stock trades at 12.14 times, in the 28th percentile of the past 83 months.
- The bear case rests on pricing and earnings quality. Management said commercial P&C is getting more competitive, especially in the U.S. and London, and that in a number of areas pricing is not keeping up with loss costs; North America commercial property pricing fell -4.2%. Reserve releases made up 24.8% of underwriting income, and the stock trades at 1.86 times book value, in the 95th percentile of the same 83 months.
- Outside view (sell-side research aggregate, October 2026): Of 43 analysts, 22 rate the stock Buy and 18 Hold, with an average price target of $357 and a range of $301 to $387. After the results Mizuho raised its target from $347 to $350; earlier in October Wells Fargo, HSBC and Cantor Fitzgerald cut theirs.
- The average target sits just +0.5% above the share price.
From ACE to a Global Insurer With an Asian Life Arm
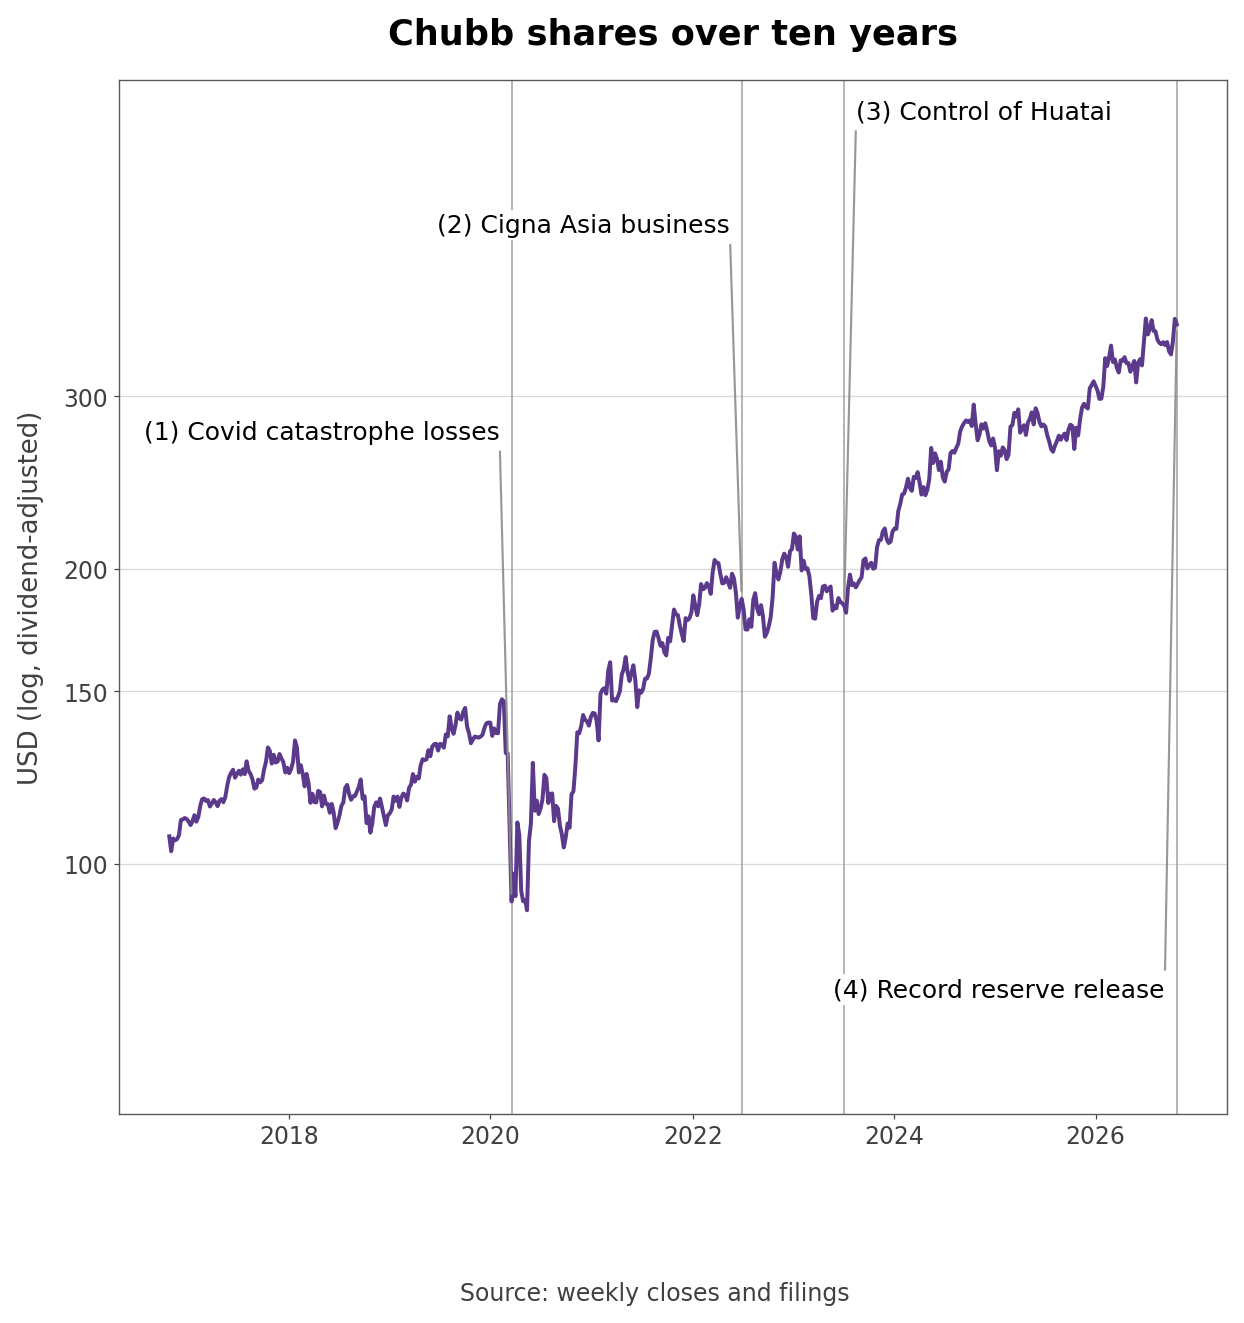
- The 10-K says Chubb "was incorporated in 1985 at which time it opened its first business office in Bermuda." That company was ACE, which bought The Chubb Corporation in 2016 and took its name. It added Cigna's Asian accident, health and life business in 2022, took control of China's Huatai Insurance Group on July 1, 2023 (about 87.2% owned at the end of 2025), and bought Liberty Mutual's P&C businesses in Thailand and Vietnam in April 2025. Life insurance reached 14% of 2025 consolidated net premiums earned.
- The deepest drawdown came with Covid: in the second quarter of 2020 pre-tax catastrophe losses reached $1.81 billion, P&C underwriting swung to a $929 million loss, and month-end price to book bottomed at 0.93 times in April. The 2022 rate shock pushed book value per share down to $114.79, and in the first quarter of 2025 catastrophe losses of $1.64 billion, including $1.47 billion from the California wildfires, cut underwriting income to $441 million.
- From the end of November 2016 at $128 the stock has risen 2.77 times. It rose 14.1% in 2022, 2.4% in 2023, +22.3% in 2024 and 13.0% in 2025, and is up 13.8% so far in 2026.
How Much of Underwriting Income Came From Reserve Releases?
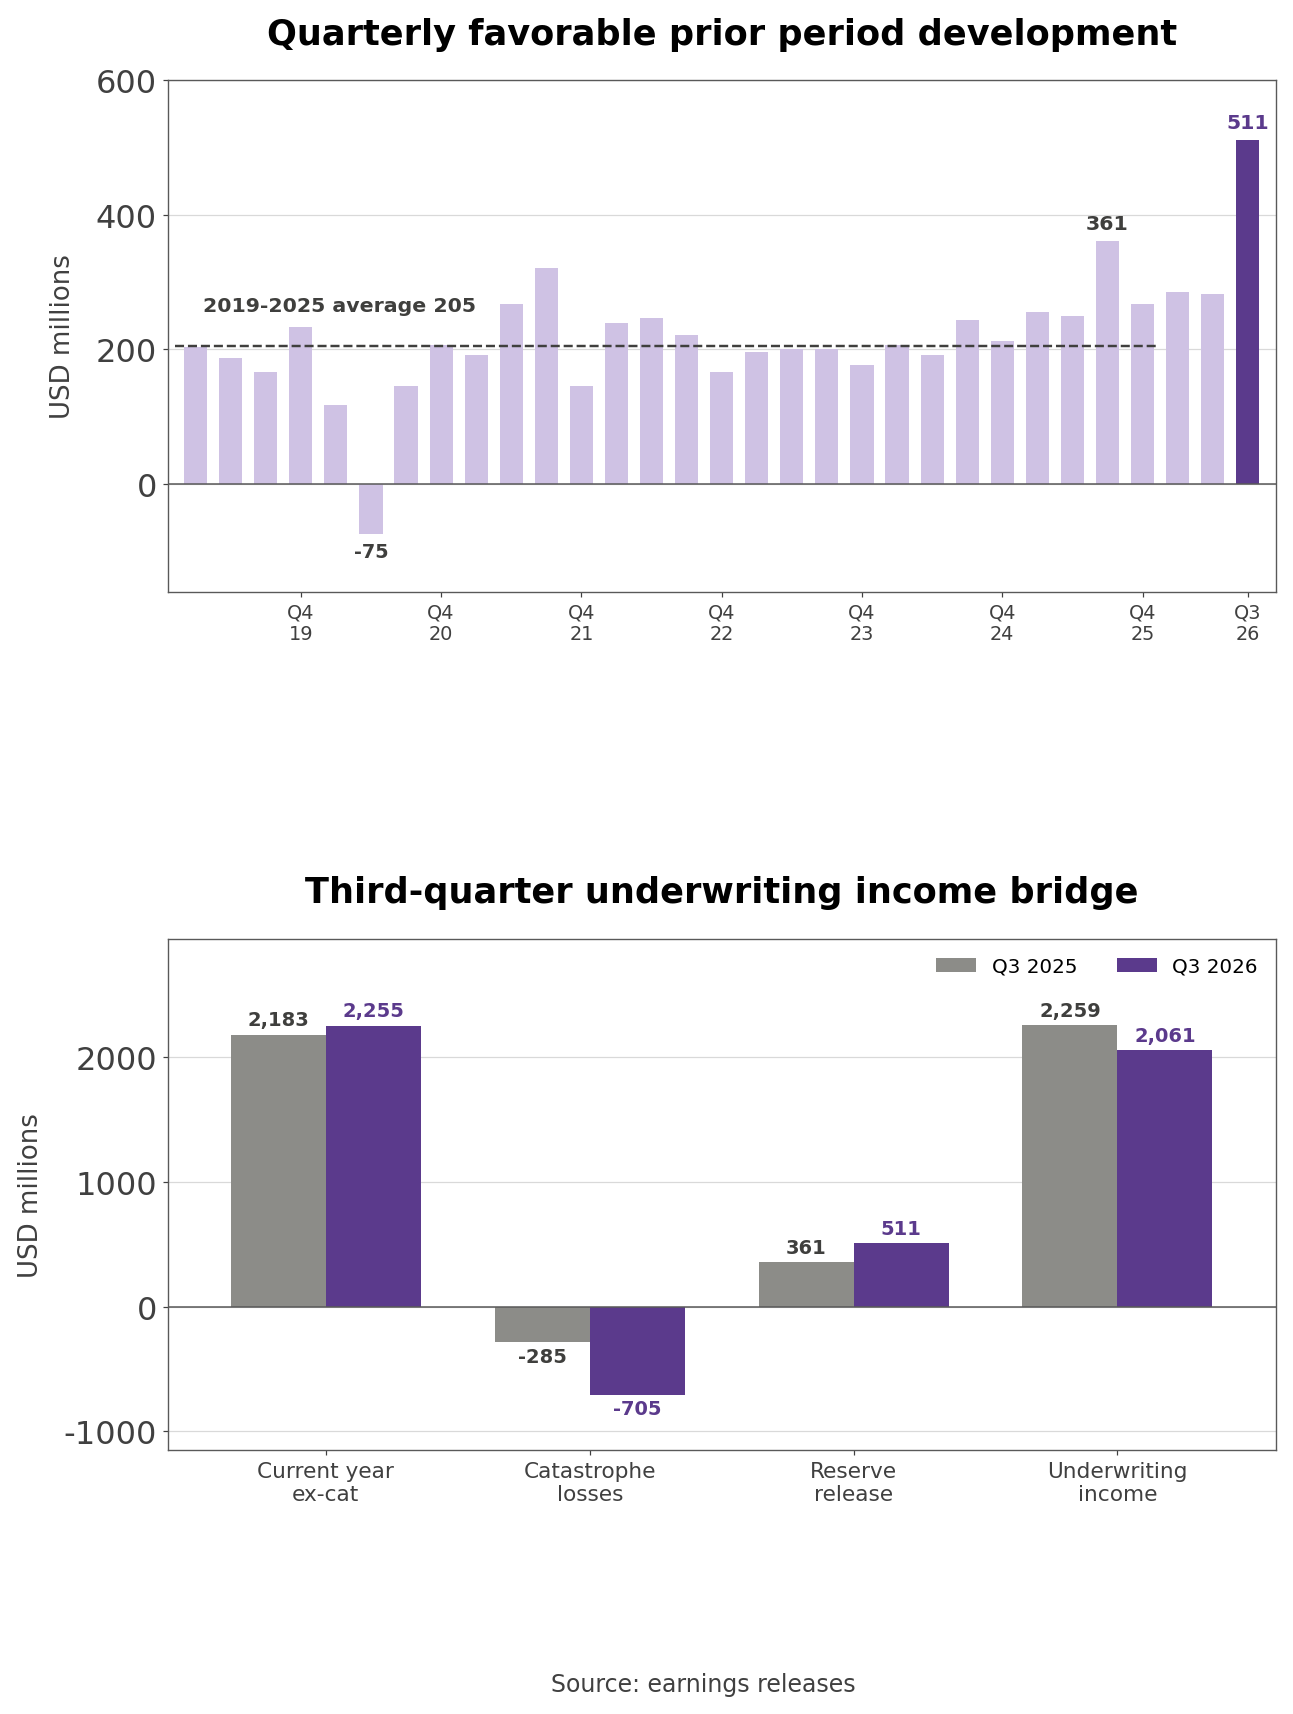
- A P&C insurer books an estimate of future claim payments as reserves in the year an accident happens. If later payments come in below that estimate, the difference flows back into earnings as favorable prior period development. Chubb's third-quarter release of $511 million is the largest in 32 quarters, $150 million above the previous high of $361 million in the third quarter of 2025, and 2.49 times the 2019 to 2025 quarterly average of $205 million.
- On the call, CFO Peter Enns said active companies released $562 million, $575 million from short-tail lines less $13 million of adverse long-tail development, while the mostly environmental corporate run-off portfolio added $51 million. Loss reserves exceed $71 billion. Greenberg repeated that Chubb is slow to recognize favorable development and quick to recognize adverse development, and said the long-tail strengthening came from the 2019 to 2022 accident years.
- Own calculation (reserve dependence): Reserve releases were 24.8% of third-quarter underwriting income against 16.0% a year earlier. Without them underwriting income fell -18.3% to $1.55 billion. Nine-month releases of $1.08 billion were +24.9% higher than the $865 million a year earlier, while nine-month catastrophe losses of $1.68 billion were lower than the prior year's $2.56 billion.
- Third-quarter catastrophe losses of $705 million were 2.5 times the prior year's $285 million. Current accident year income grew $72 million while catastrophes rose $420 million, and the $150 million increase in releases covered part of the gap, limiting the fall in underwriting income to $198 million.
North America Commercial Lines and Falling Property Rates
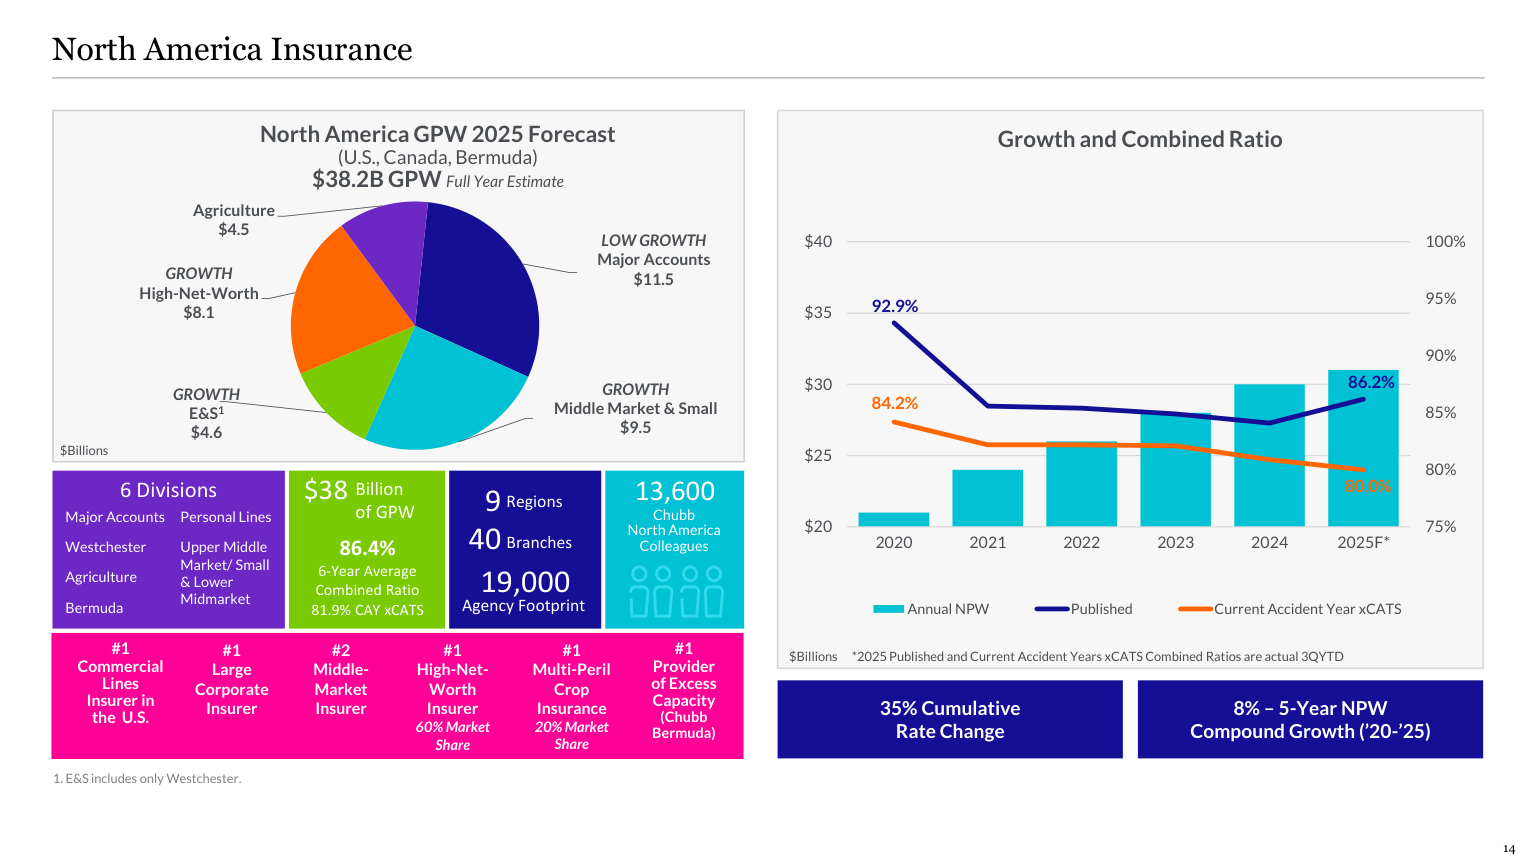
- Page 14 of the investor deck splits $38.2 billion of expected 2025 North American gross premiums into major accounts ($11.5 billion, the only piece labeled low growth), middle market and small commercial ($9.5 billion), E&S ($4.6 billion), high-net-worth personal lines ($8.1 billion, a 60% market share) and agriculture ($4.5 billion).
- Third-quarter North America commercial net premiums written fell -2.7% to $5.51 billion. Major accounts and E&S wholesale fell -5.0%, middle market and small commercial grew 0.8%, and the company says the segment grew 1.7% excluding lower large account property and financial lines exposure, including additional reinsurance, which Greenberg said cut growth by about 4.5 points. Property pricing fell 4.2%, casualty rose 5.7% and financial lines 2.1%, while shared and layered property fell -11%.
- The North America commercial combined ratio rose 4.8 points to 86.3%, including 3.1 points of catastrophes and 1.0 point of underlying loss ratio, which Greenberg attributed entirely to the lower share of property. North America personal lines grew +5.3% with a 60.3% combined ratio and Overseas General grew +6.7%, led by Latin America at 11.7%. The release adds: "I fully expect North America commercial growth to improve in future quarters."
Unrealized Bond Losses and Book Value Without AOCI
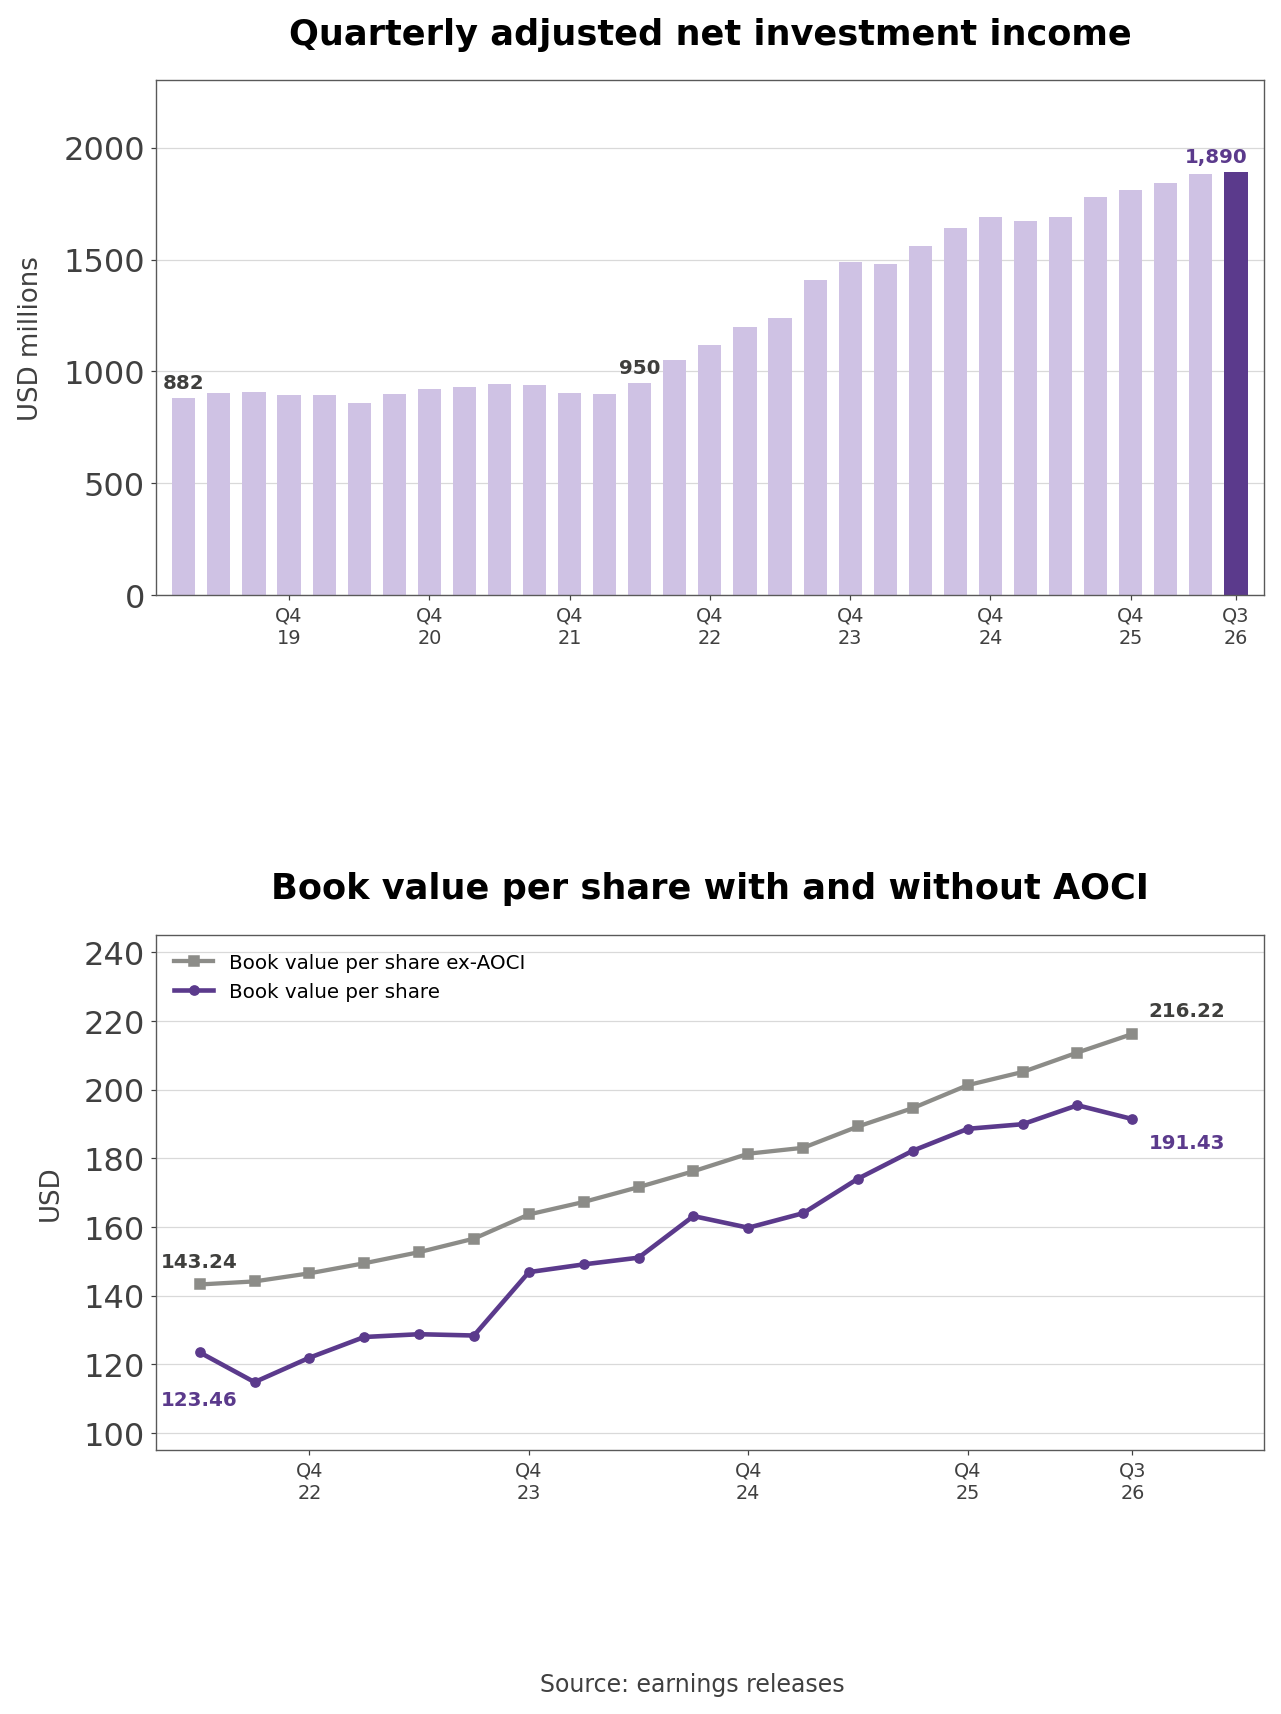
- When rates rise, bonds already owned lose value. Available-for-sale fixed maturities had a market value of $125.80 billion against an amortized cost of $134.09 billion, an unrealized loss of $8.29 billion, up from $1.99 billion at the end of 2025. After-tax realized and unrealized portfolio losses were $4.48 billion in the quarter, and AOCI widened to a $9.48 billion deficit from $4.98 billion at the start of the year.
- That opens a $24.79 gap between book value per share of $191.43 and $216.22 excluding AOCI; tangible book value per share excluding AOCI rose +15.4%. Adjusted net investment income barely moved from $882 million in the first quarter of 2019 to $950 million in the second quarter of 2022, then rose 2.1 times to $1.89 billion once rates climbed. The CFO said private equity returns were below normal and gave no investment income guidance.
- Own calculation (reinvestment uplift): If the entire $146.88 billion of fixed income at amortized cost repriced to the 6.2% market yield, pre-tax investment income would rise by about $1.47 billion a year, worth 2.84 combined ratio points. If one fifth reprices each year in line with the 5.0-year duration, the first-year gain is about $294 million, 0.57 points. Spreading the $8.29 billion unrealized loss over the same five years implies about $1.66 billion a year pulling back toward par if rates stay put.
How a Property and Casualty Insurer Makes Money
- Chubb's 2025 consolidated net premiums earned came 38% from North America commercial P&C, 27% from Overseas General, 14% from life, 13% from North America personal P&C, 5% from agriculture and 3% from global reinsurance. North America commercial runs from property, casualty and directors' and officers' cover for multinationals to small business policies and E&S lines placed through wholesale brokers. Personal lines insure homes, cars, valuables and boats for high-net-worth families, Rain and Hail sells federal crop insurance, Overseas General sells commercial and consumer cover, life combines Huatai Life, Chubb Life and Chubb Benefits, and Chubb Tempest Re writes reinsurance.
- The second-quarter 2026 corporate presentation describes Chubb as "The largest commercial lines insurer in the U.S. and one of the largest financial lines writers globally." Some 46% of the business is written outside the U.S., and 2025 gross premiums were $41.0 billion in North America, $12.1 billion in Asia, $8.8 billion in Europe, the Middle East and Africa, and $4.0 billion in Latin America. Distribution runs through brokers, agents, banks, mobile carriers and direct marketing, and Greenberg said Chubb is Mexico's third-largest auto insurer and the largest direct marketer of consumer accident and health insurance in Asia and Latin America.
- Chubb earns money two ways. Underwriting income comes from collecting more in premiums than it pays in claims and expenses, measured by the combined ratio: the third-quarter P&C ratio of 84.1% was a 58.7% loss ratio, an 18.3% acquisition cost ratio and a 7.1% administrative expense ratio, so Chubb spent $84.10 for every $100 of premium. Investment income comes from the money held between collecting premiums and paying claims, which for casualty lines can mean years. The balance sheet carried $91.83 billion of unpaid losses and $28.61 billion of unearned premiums, operating cash flow was a quarterly record of $6.07 billion, and the $180.80 billion portfolio holds $138.59 billion of fixed income, 31% rated AA and 26% A.
- Consolidated net premiums written rose +1.9% to $15.14 billion, and life segment income rose +11.4% to $369 million, mostly from mainland China, Hong Kong, Korea and Taiwan. The roughly $8.5 billion high-net-worth business grew about 5.5%. Over nine months Chubb returned $4.47 billion, 52.0% of core operating income, through $3.30 billion of buybacks at an average $332.33 and $1.17 billion of dividends, and diluted shares fell -2.9%. The CFO called the roughly 50% payout an outcome rather than a rule.
How Chubb Compares With Four U.S. Insurers
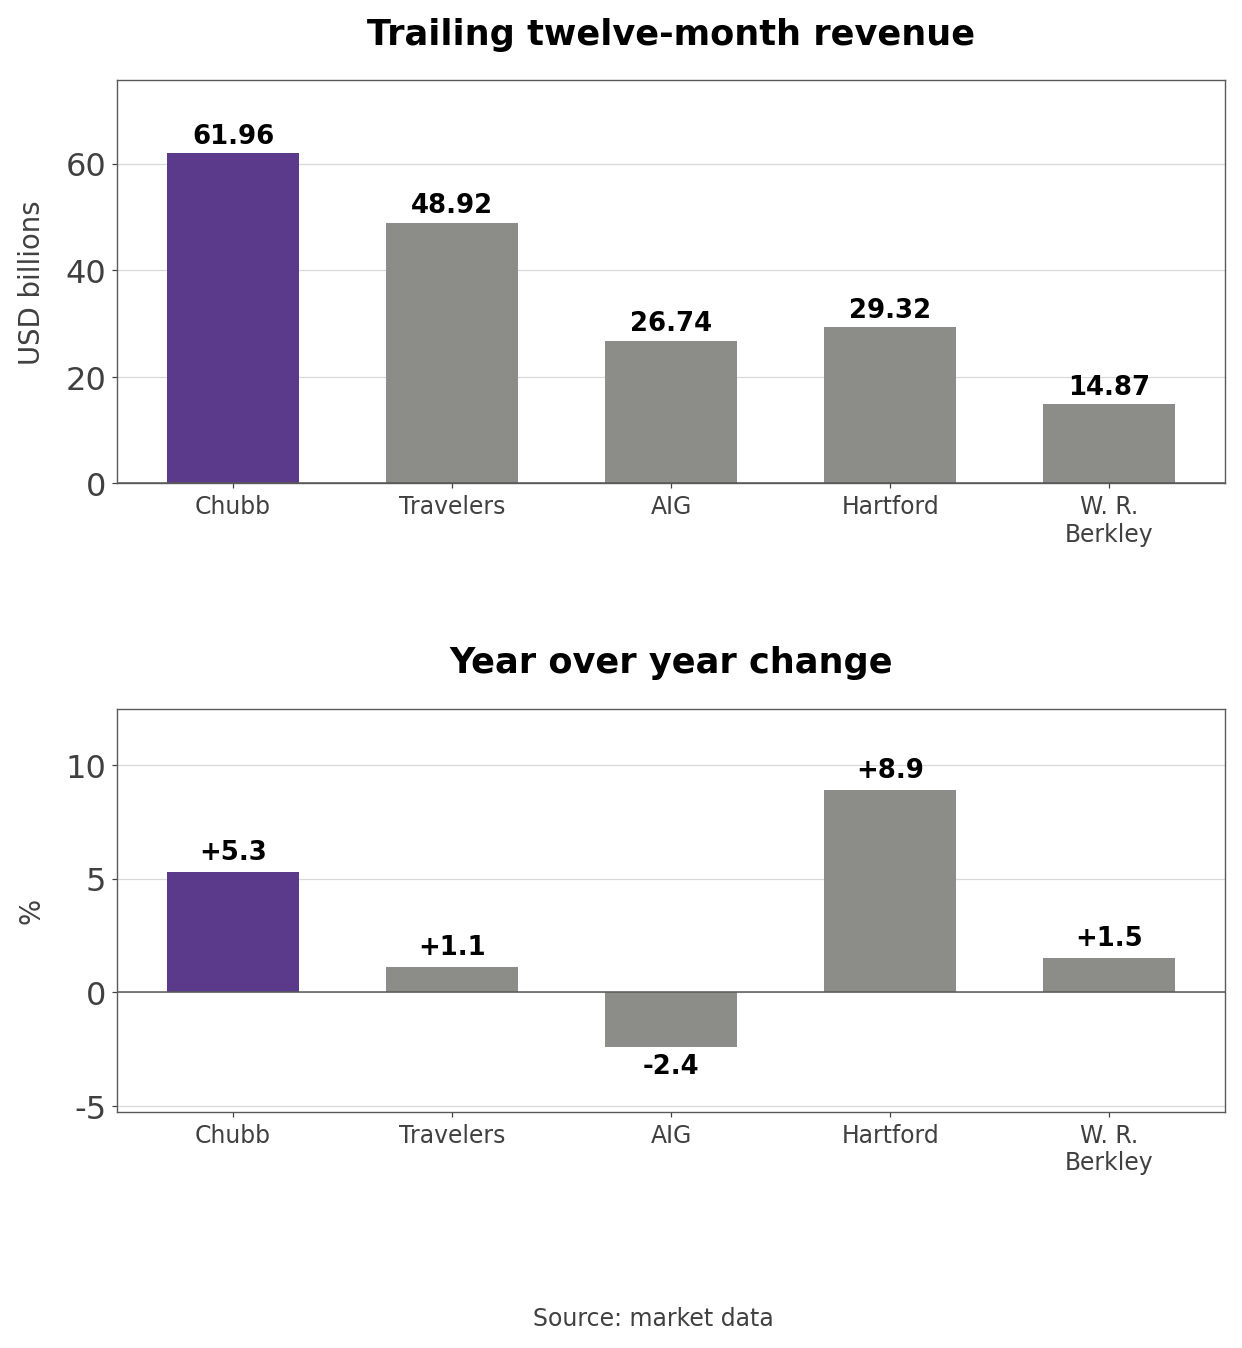
- Trailing twelve-month revenue is $61.96 billion at Chubb, $48.92 billion at Travelers, $29.32 billion at Hartford, $26.74 billion at AIG and $14.87 billion at W. R. Berkley, with growth from Hartford at +8.9% and Chubb at +5.3% to AIG at -2.4%. Travelers writes U.S. commercial and personal lines, AIG commercial and personal insurance at home and abroad, Hartford small business and group benefits, and W. R. Berkley specialty and E&S lines. All four face the same commercial pricing cycle, so forward P/E and price to book are the yardsticks.
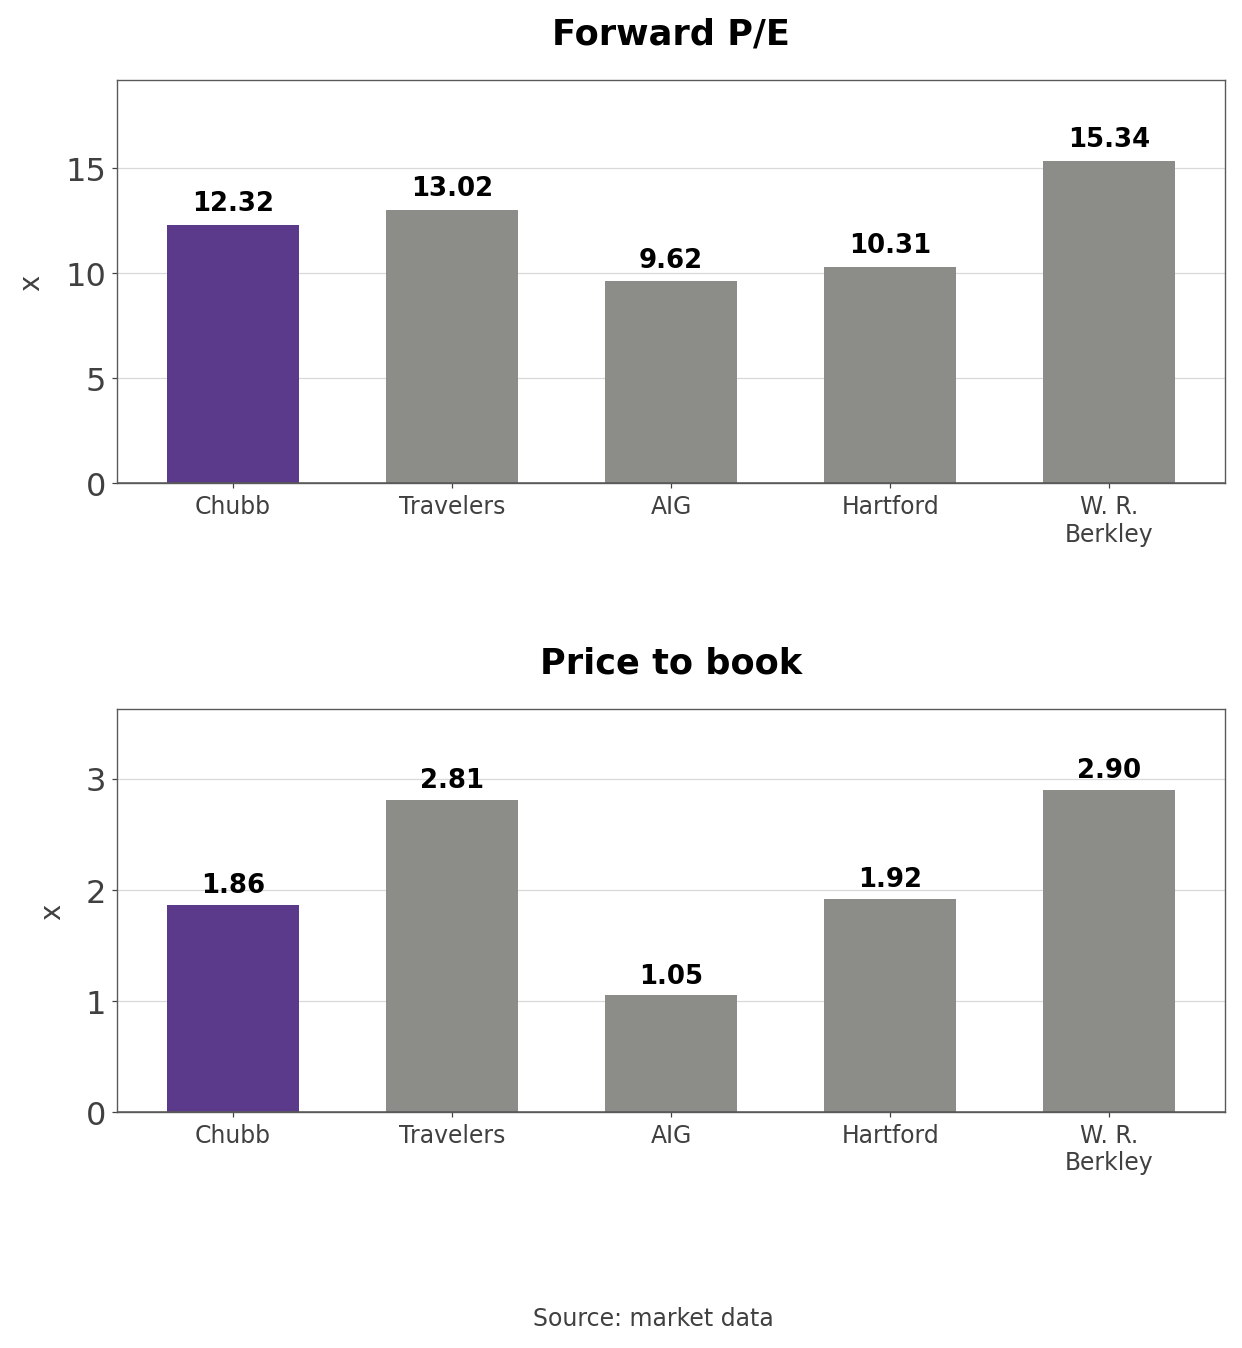
- Forward P/E is 15.34 times at W. R. Berkley, 13.02 at Travelers, 12.32 at Chubb, 10.31 at Hartford and 9.62 at AIG. Price to book is 2.90 times at W. R. Berkley, 2.81 at Travelers, 1.92 at Hartford, 1.86 at Chubb and 1.05 at AIG. Over one year Travelers shares rose +48.3%, Chubb 28.2%, Hartford 10.1%, AIG 2.9% and W. R. Berkley 2.8%.
- Own calculation (relative size and book): Chubb's market value of $135.84 billion is 1.66 times Travelers' $81.63 billion. On reported book value Chubb ranks fourth of the five on price to book; on book value excluding AOCI it trades at 1.64 times, and on tangible book value at 2.80 times.
P/E on Core Operating EPS and Price to Book Over 83 Months
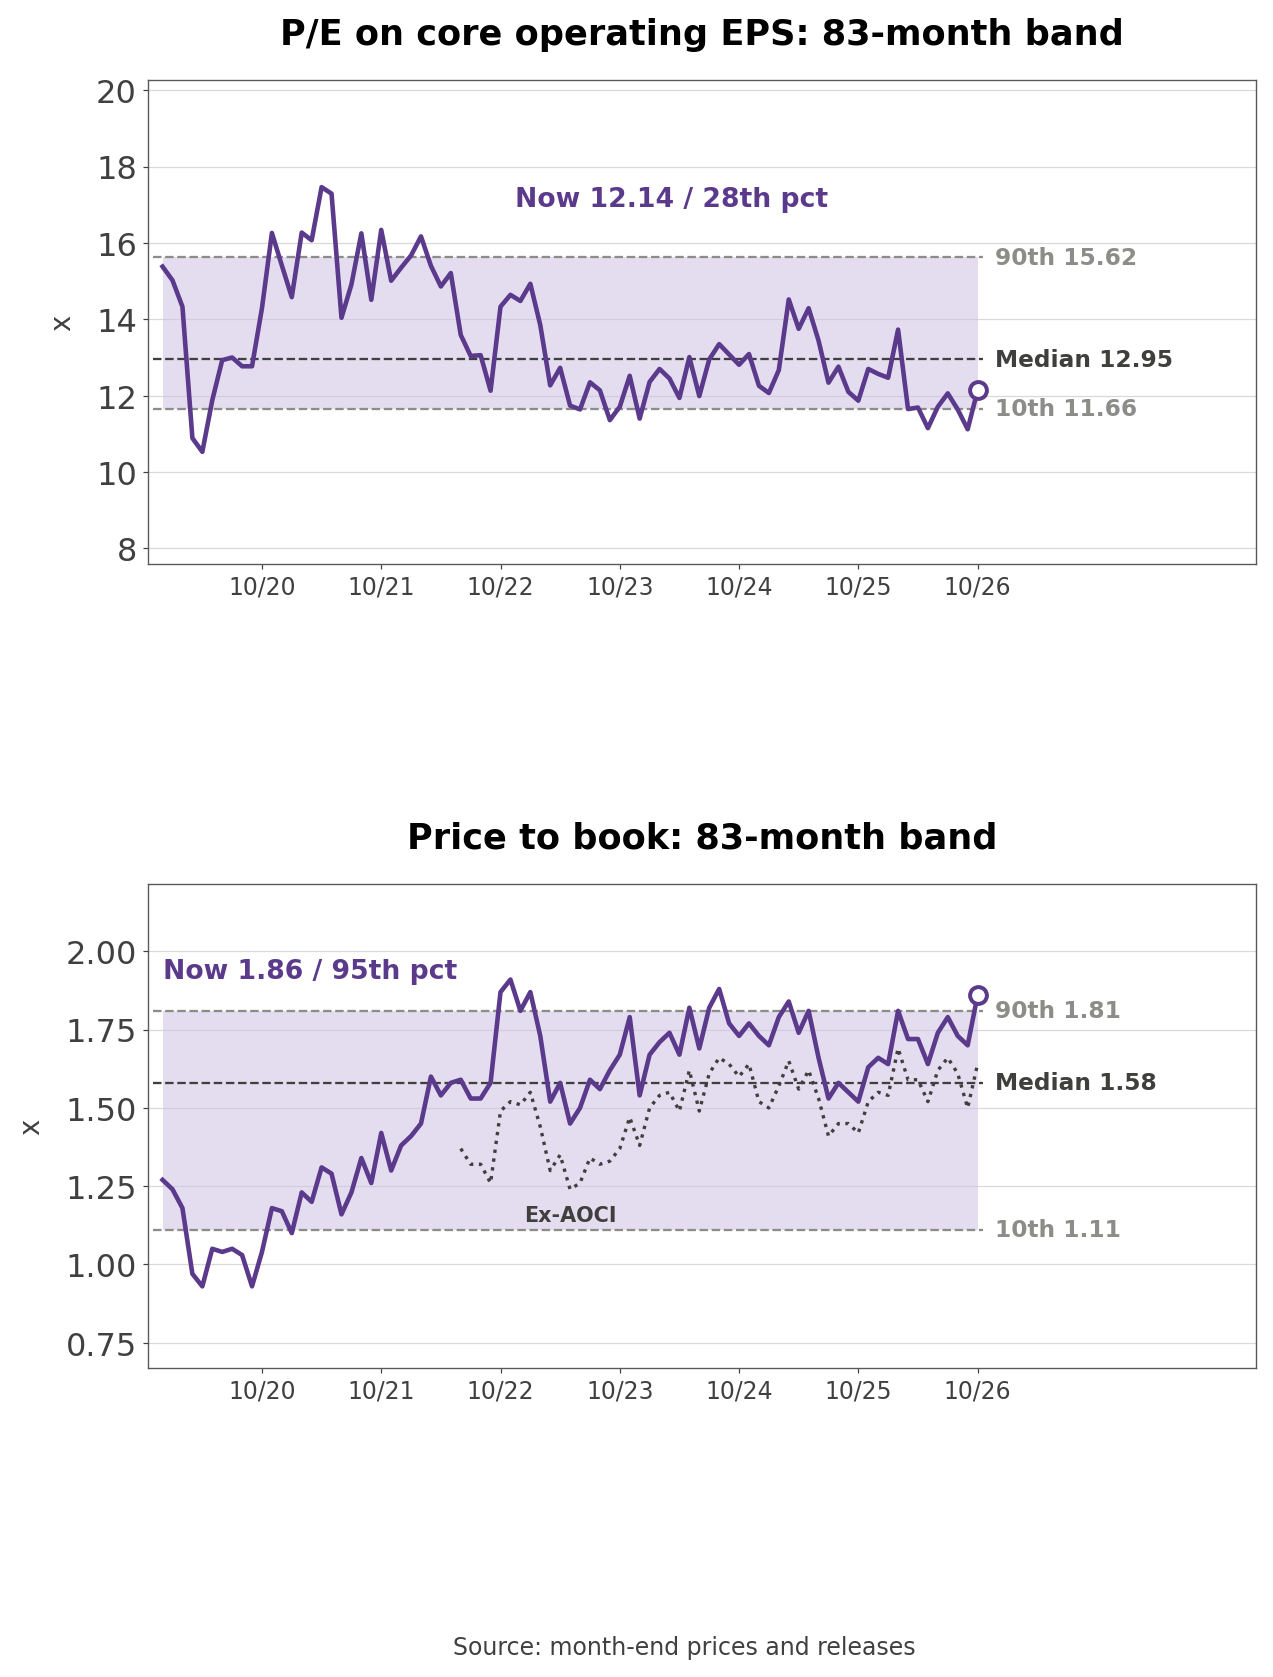
- On trailing core operating EPS of $29.26 the stock trades at 12.14 times, in the 28th percentile of the 83 months since December 2019, against a median of 12.95. The low was 10.53 times in April 2020 and the high 17.46 times in April 2021. Fourth-quarter 2023 core operating EPS of $8.30 included a one-time $2.76 per share deferred tax benefit from Bermuda's new corporate income tax, so the band uses the $5.54 the company reported excluding that benefit.
- Price to book of 1.86 times sits in the 95th percentile against a median of 1.58, near the 1.91 peak of November 2022. On book value excluding AOCI the multiple is 1.64 times, in the 93rd percentile of 53 months, so unrealized bond losses add about 0.22 to the headline multiple. The share price is 6.9% above the $332.33 average nine-month buyback price.
Three Conditions That Move the Stock
- The current accident year combined ratio excluding catastrophes was 82.6% in the third quarter. Holding the low 82s while commercial property prices fall would support management's explanation that mix, not price, moved the North America loss ratio; a move above 83% would mean the pricing gap management described is reaching earnings.
- Favorable prior period development was $511 million. If releases drift back toward the 2019 to 2025 average of about $200 million a quarter and underwriting income still holds near $2 billion, current year business is carrying the result; if earnings fall in step with releases, a quarter of this quarter's underwriting income was borrowed from reserves.
- The market yield on fixed income was 6.2% against a 5.2% book yield. If that gap persists and adjusted net investment income climbs past $1.9 billion a quarter, investment income can offset slower underwriting; if rates fall and the gap closes, investment income growth slows, but unrealized losses shrink and book value recovers.
What to Watch in the Fourth Quarter
- The next numbers are fourth-quarter North America commercial premium growth and its underlying loss ratio, whether cheaper catastrophe reinsurance spreads into broader price competition, which quarter books the $460 million USI gain, and whether reserve releases stay near third-quarter levels.
- One question remains open. In the two soft markets on Chubb's investor day slide its operating income kept growing; this time a 6.2% reinvestment yield is helping as well. How long can that investment income cover a shrinking North American commercial book?
Related Analysis
- American Express (AXP) Stock Analysis: Credit Metrics Reset: another financial company whose reported credit measures shifted over 85 months of filings, useful next to Chubb's reliance on its own reserve estimates.
- Shopify (SHOP) Stock Analysis: Net Income vs. Equity Gains: earnings lifted by items outside the core business, a parallel to separating reserve releases from Chubb's current year underwriting.
- Lennar (LEN) Stock: 12.9% Incentives and a 0.89x P/B: a company cutting effective prices in a softening market and valued on book, a contrast with Chubb's 1.86 times book multiple.
#Chubb #CBStock #InsuranceStocks #PropertyAndCasualty #ReserveRelease #InterestRates #USStocks #StockAnalysis #EquityResearch #GlobalStockBrief
'US Stock Analysis' 카테고리의 다른 글
| United Airlines (UAL) Stock: Fuel Recapture Stalls at 72% (0) | 2026.10.26 |
|---|---|
| Philip Morris (PM) Stock: Cigarette Pricing Carries ZYN (0) | 2026.10.26 |
| Intuitive Surgical (ISRG) Stock: The 3% to 5% Instrument Cut (0) | 2026.10.25 |
| Netflix (NFLX) Stock: A $2.8B Warner Fee and Record Buybacks (0) | 2026.10.25 |
| General Motors (GM) Stock: EV Add-Backs and a $20B Buyback (0) | 2026.10.25 |


