- United Airlines (NASDAQ: UAL) set a quarterly revenue record of $17.88 billion in the third quarter, but fuel expense rose $1.85 billion and operating income excluding special items fell from $1.32 billion to $1.23 billion. Management said on the call that United recovered 72% of the fuel cost increase, short of the 80% to 90% it had projected in July for the quarter. Fourth-quarter guidance of $0.50 to $1.50 in adjusted EPS assumes fuel at about $4.80 a gallon. When United laid out its United Next plan in June 2021, the 2026 target was an adjusted pre-tax margin of about 14% on fuel at $2.20. The question is how much of a fuel bill running far above plan United can pass through in fares, and whether that pace gets it to the double-digit pre-tax margin management wants in 2027.
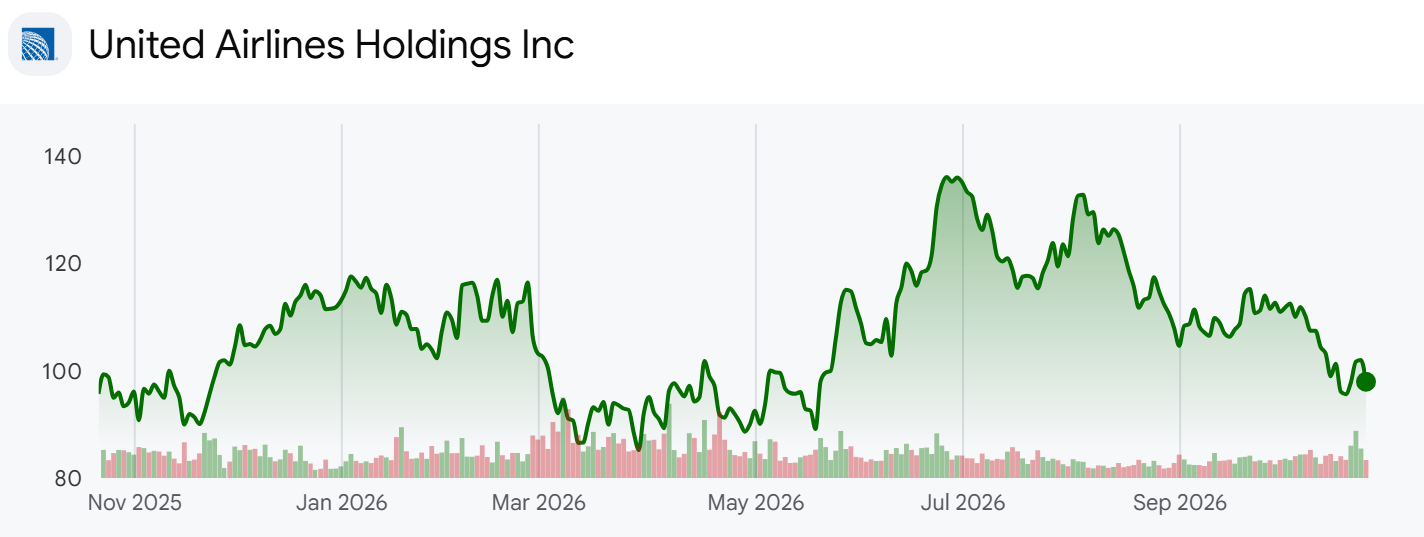
- United flies from seven hubs: Chicago, Denver, Houston, Los Angeles, New York/Newark, San Francisco and Washington. At $97.93 a share the company is worth $31.82 billion, and the stock is -28.1% below its weekly high of $136.11 at the end of June and -12.4% for 2026. It fell -10.6% the week before the results and rose +1.9% in results week. The analysis parses 31 quarterly releases since 2019 and checks them against the third-quarter earnings release, the 10-Q, the call, the 2025 10-K and investor updates. Fuel recapture is a management figure with no published formula. Adjusted EPS, adjusted pre-tax margin and CASM-ex (operating cost per available seat mile excluding fuel and special items) are non-GAAP measures, and the P/E band uses adjusted EPS summed over the trailing four quarters (TTM).
The 2021 Investor Day Plan Built on Lower Costs
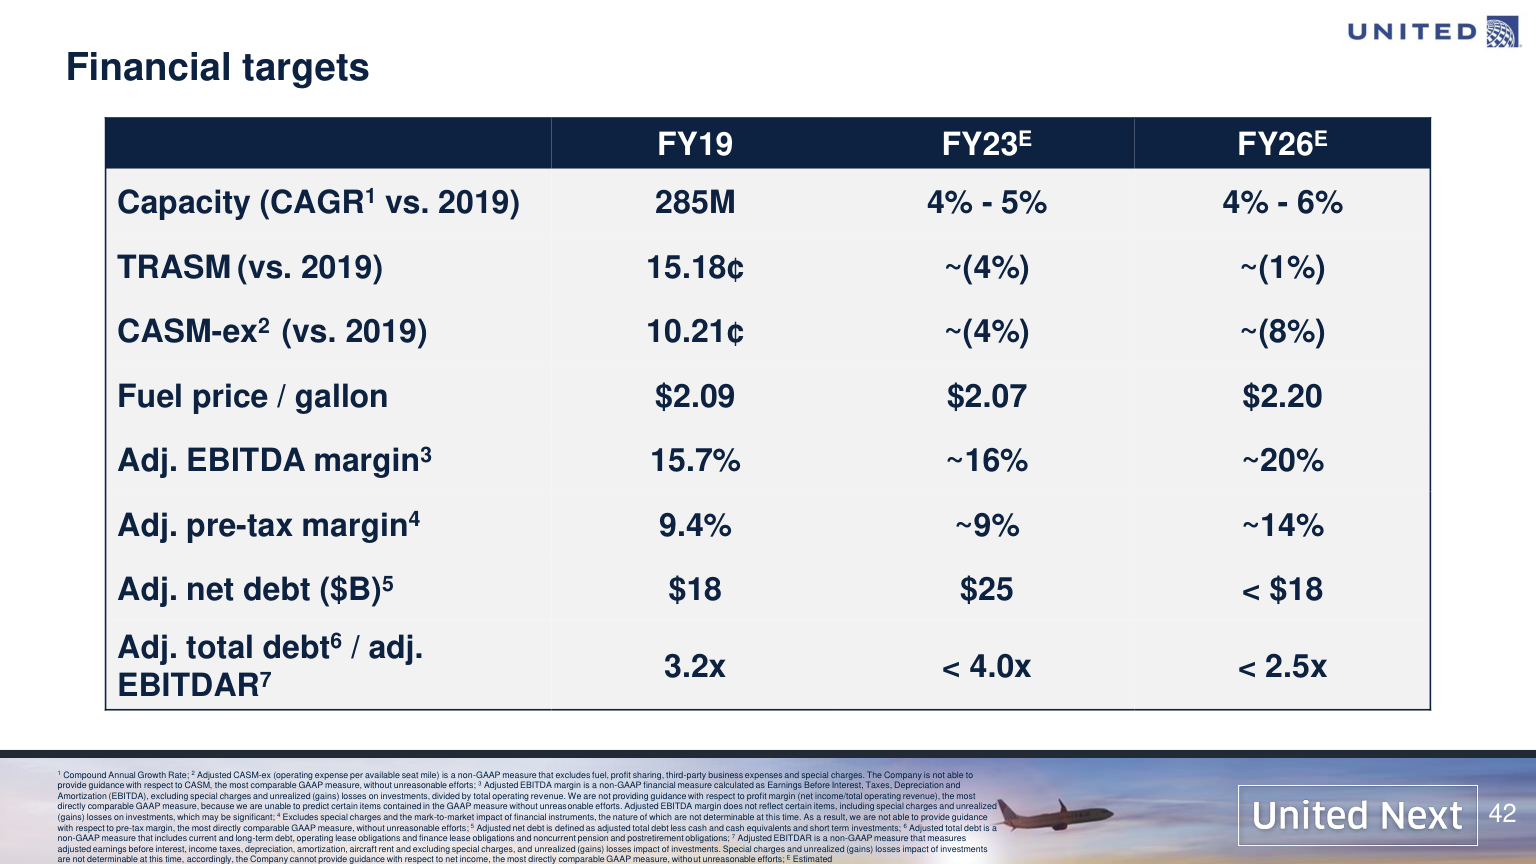
- Page 42 of the deck United presented at its June 29, 2021 investor event set 2023 and 2026 targets against 2019. For 2026 it called for capacity growth of 4% to 6% a year, TRASM (total revenue per available seat mile) about 1% below 2019, CASM-ex about 8% below, fuel at $2.20 a gallon, an adjusted EBITDA margin near 20%, an adjusted pre-tax margin near 14%, adjusted net debt under $18 billion and adjusted total debt under 2.5 times adjusted EBITDAR. The 2019 baseline was 15.18 cents of TRASM, 10.21 cents of CASM-ex, $2.09 fuel and a 9.4% margin. Page 37 says it plainly: "Expect margin growth even if TRASM is down ~(4%) in 2023 and down ~(1%) in 2026, versus 2019."
- Company disclosure (June 2021 investor deck): United Next would retire more than 200 single-cabin regional jets by 2026 and lift North American seats per departure from 104 in 2019 to about 134. Alongside larger aircraft, the deck promised "over $2B of structural cost savings independent of gauge increase" and targeted free cash flow conversion of at least 80% from 2026.
- The gap opened early. The 2023 targets were TRASM and CASM-ex both about 4% below 2019, a pre-tax margin near 9% and adjusted net debt of $25 billion. Actual 2023 TRASM was 18.44 cents, +21.5% above 2019, CASM-ex was 12.03 cents, +17.8%, and the adjusted pre-tax margin was 8.0%. Fares moved more than 20% the opposite way from plan, non-fuel costs followed them up, and the margin landed a point short.
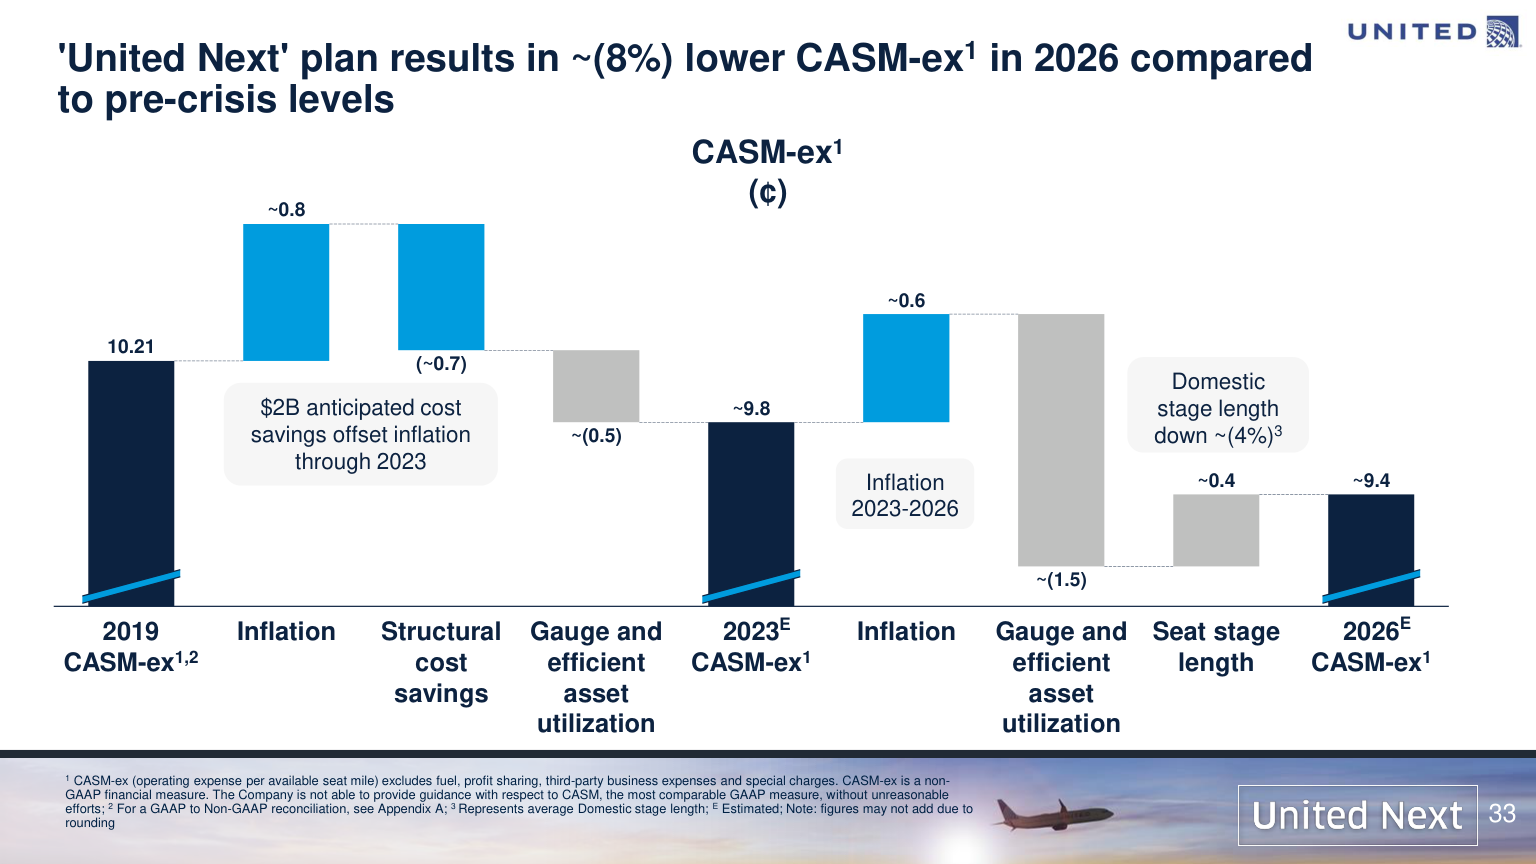
- Page 33's cost bridge takes CASM-ex from 10.21 cents in 2019 to about 9.8 cents in 2023, with roughly 0.8 cents of inflation offset by about 0.7 cents of cost savings and 0.5 cents from bigger aircraft, and then to about 9.4 cents in 2026, as about 1.5 cents from gauge and asset utilization outweighs about 0.6 cents of inflation and 0.4 cents from shorter domestic stage length. Page 14 has the Boeing 737 MAX 10 and Airbus A321neo joining the fleet in 2023. The plan leaned on costs, not fares.
- Nine months into 2026, TRASM is 19.78 cents, +30.3% above 2019, and CASM-ex is 13.36 cents, +30.9%. Fuel averaged $3.65, 65.9% above the $2.20 plan, and the nine-month adjusted pre-tax margin was 4.9%. Converted to an annual rate, seat miles grew 2.45% a year from the first nine months of 2019, below the 4% to 6% target.
Bigger Aircraft and More Premium Seats
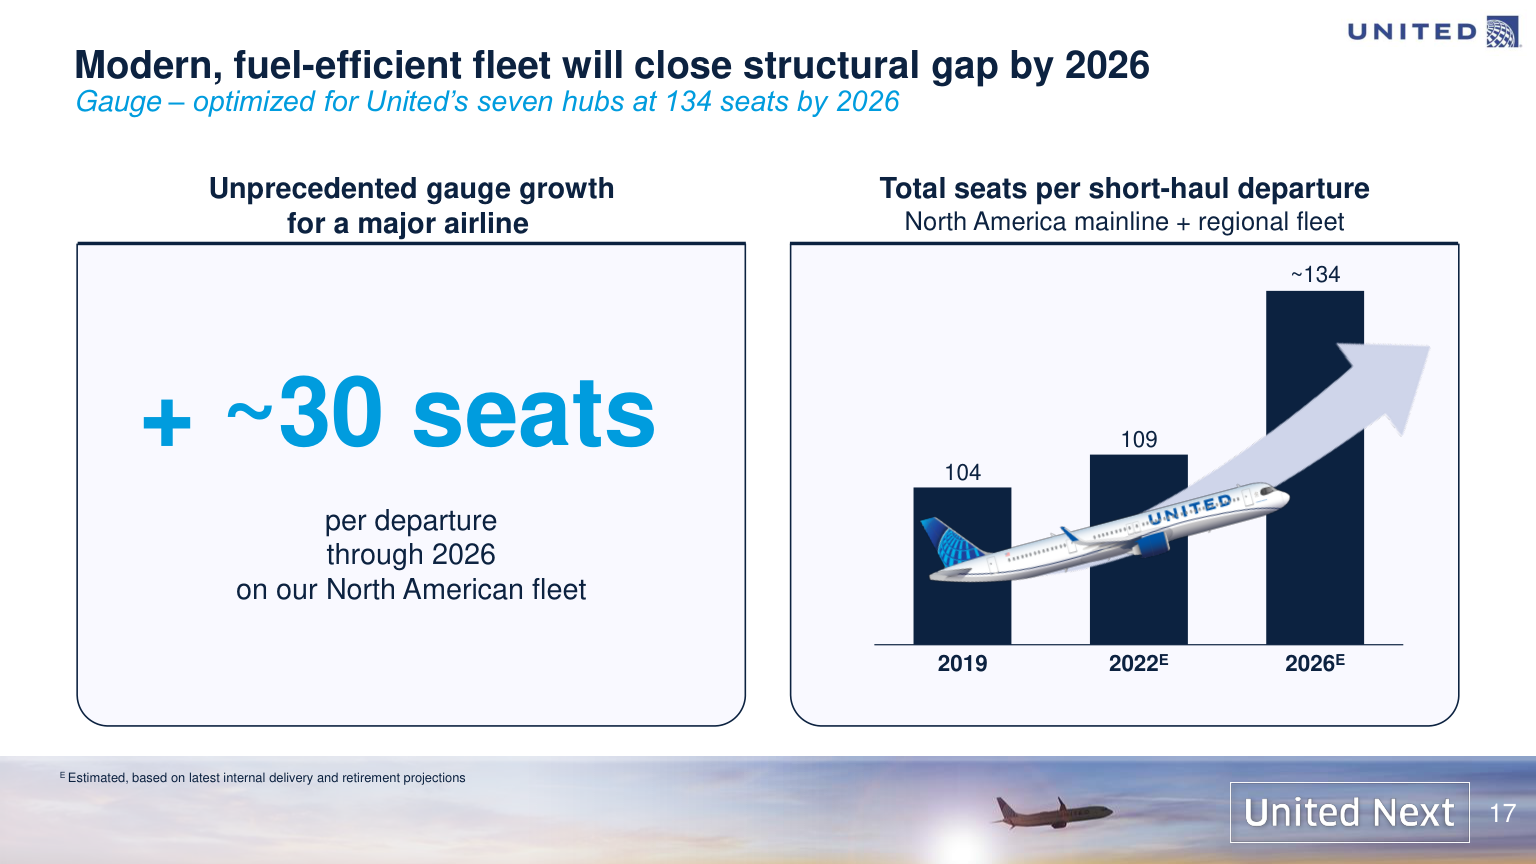
- Page 17 shows total seats per short-haul departure on the North American mainline and regional fleet rising from 104 in 2019 and 109 in 2022 to about 134 in 2026, about 30 more seats per departure. Page 18 puts premium seats per short-haul departure at 31 in 2019, 39 in 2022 and 53 in 2026, an increase of about 75%. On the third-quarter call CEO Scott Kirby congratulated Boeing on certifying the MAX 10 and said United looks forward to its first delivery next year, four years later than the deck planned. The 2025 10-K says United expects to "take delivery of over 630 new narrow- and widebody aircraft by the end of 2034."
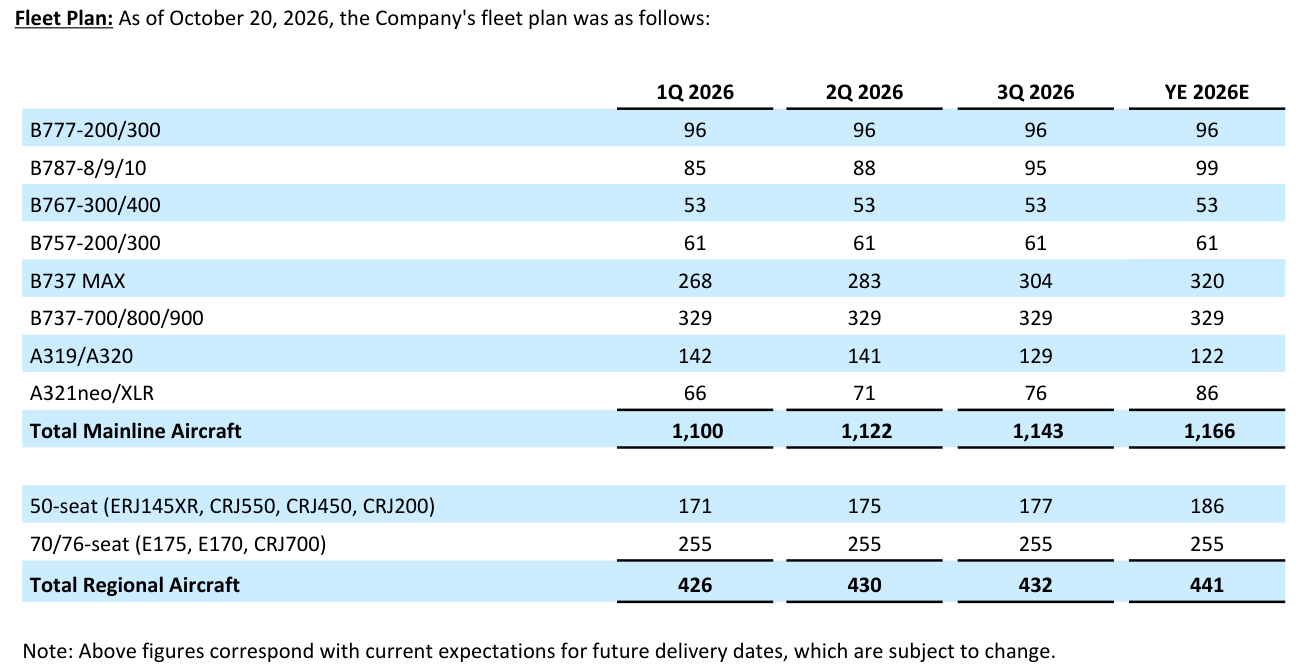
- The fleet plan in the third-quarter investor update shows mainline aircraft rising from 1,100 at the end of the first quarter to 1,143 at the end of the third and 1,166 by year-end. Boeing 737 MAX aircraft went from 268 to 304 and A321neo/XLR from 66 to 76, while smaller A319/A320s fell from 142 to 129 and are planned at 122 by year-end; 787s rose from 85 to 95. The 50-seat regional fleet, which includes the dual-class CRJ550, grew from 171 to 177 with 186 planned by year-end. The update does not break out single-cabin jets, so it cannot confirm the 2021 retirement promise.
- Company disclosure (third-quarter investor update): United expects 2026 adjusted capital expenditures of about $7.5 billion and a fourth-quarter profit sharing accrual of $50 million to $140 million.
- Nine-month adjusted capital expenditures were $5.36 billion against $4.35 billion a year earlier, and third-quarter operating cash flow fell to $465 million from $1.22 billion. Third-quarter free cash flow was -$1.84 billion, and TTM free cash flow was $802 million.
The Bull and Bear Case for United Shares
- The bull case rests on fares and customer mix. Third-quarter TRASM rose +15.9%, premium revenue 17% and loyalty revenue 17%, and "Contracted business revenue was up 26% during the quarter." United expects fourth-quarter revenue growth to accelerate and "set another record with an over 20% year-over-year increase," and it is targeting CASM-ex growth of 2% to 3% in 2027.
- The bear case rests on fuel and debt. The fourth-quarter fuel assumption of $4.80 is above the third quarter's $3.90, and each cent per gallon is worth about 2.5 cents of quarterly EPS. Adjusted net debt of $20.47 billion is $1.5 billion higher than a year earlier, net leverage is 2.4 times, and the P/E on TTM adjusted EPS of 11.10 times sits in the 91st percentile of 44 months.
- Outside view (sell-side research aggregate, October 2026): Of 47 analysts, 31 rate the stock Buy and 16 Hold, with an average price target of $159 and a range of $140 to $190. Between October 20 and 22, Evercore ISI raised its target from $135 to $160 and Bernstein from $153 to $160, while Jefferies cut from $155 to $142, BMO from $140 to $135 and Argus from $135 to $125.
- The average target is +62.4% above the share price.
From Covid to United Next and the Newark Disruption
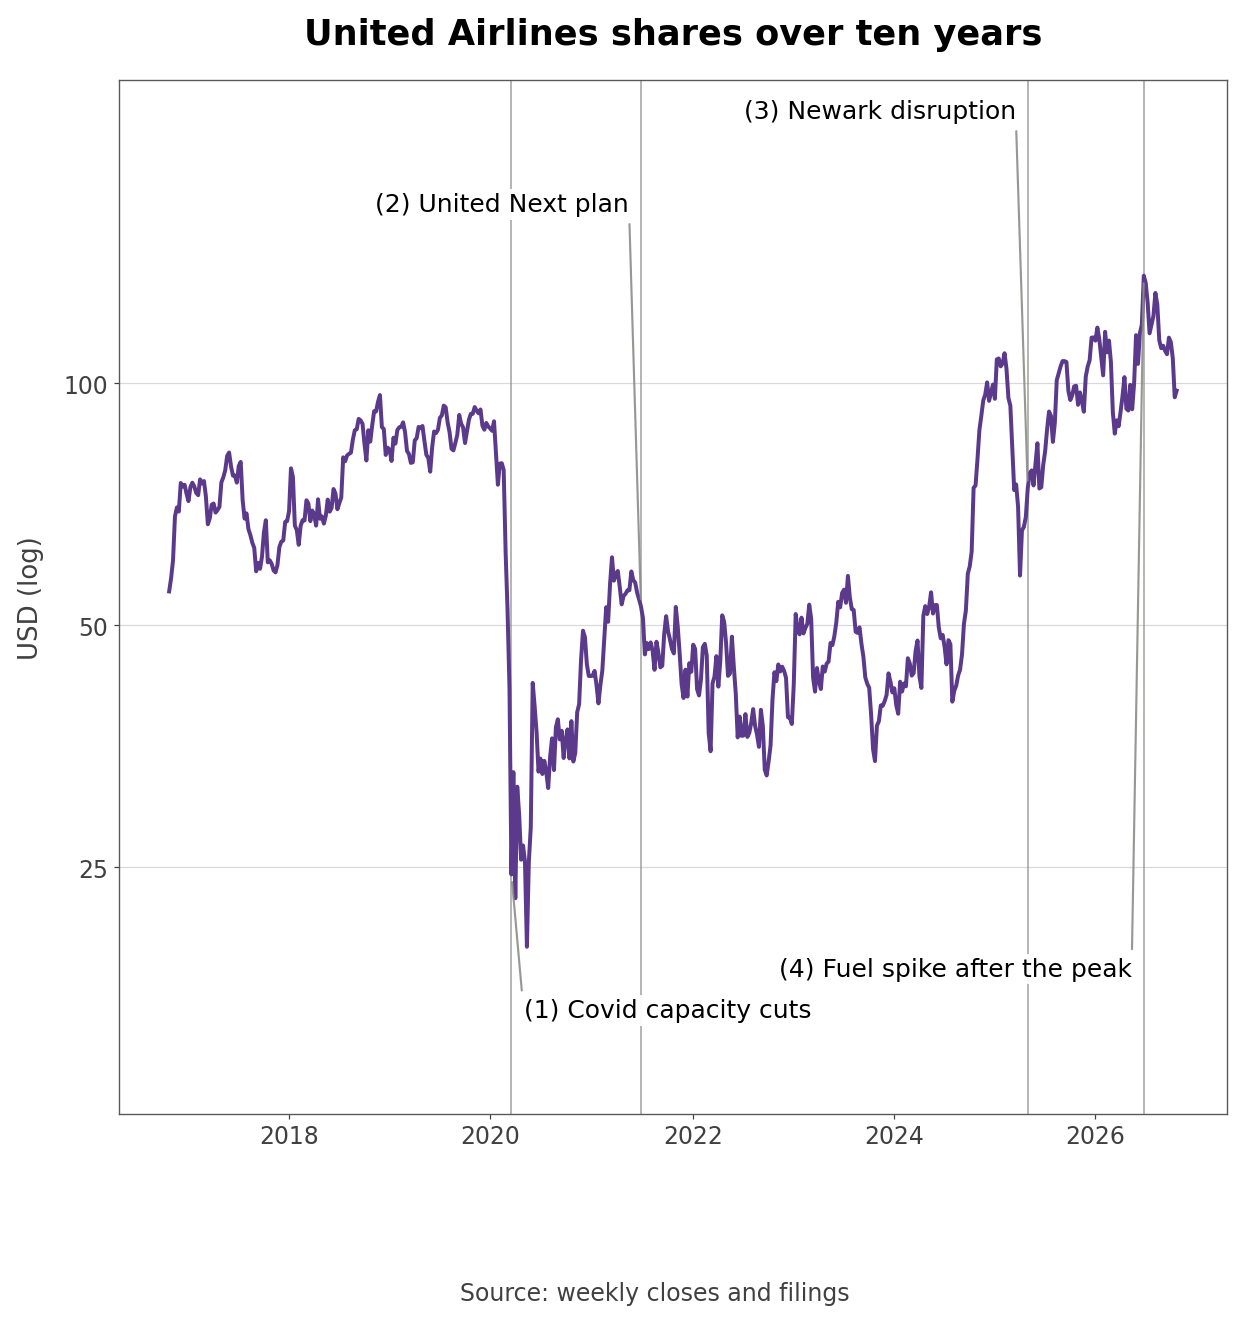
- Covid produced the deepest trough. Second-quarter 2020 revenue was $1.48 billion, 13% of the $11.40 billion a year earlier, and capacity fell to 12% of the prior-year level. The adjusted pre-tax margin was -219.0%, and the stock fell -50.9% in 2020.
- United Next followed in June 2021. The stock rose 1.2% in 2021, fell 13.9% in 2022 and rose 9.4% in 2023 before gaining +135.3% in 2024. The month-end P/E bottomed at 3.33 times in October 2023.
- In May 2025 an event at Newark "drove extensive negative news coverage that drove customer bookaway," according to the second-quarter 2025 investor update, which noted that Newark accounted for more than 20% of capacity measured in available seat miles. The stock still rose 15.2% in 2025 to $111.82. In 2026 fuel took over. The average price rose from $2.78 a gallon in the first quarter to $4.19 in the second, the stock fell to $86.60 in the week of March 13, and in April United cut its full-year guidance. Shares peaked at $136.11 in the last week of June and fell again after jet fuel spiked late in the third quarter.
How Much of a $1.85 Billion Fuel Bill Did Fares Recover?
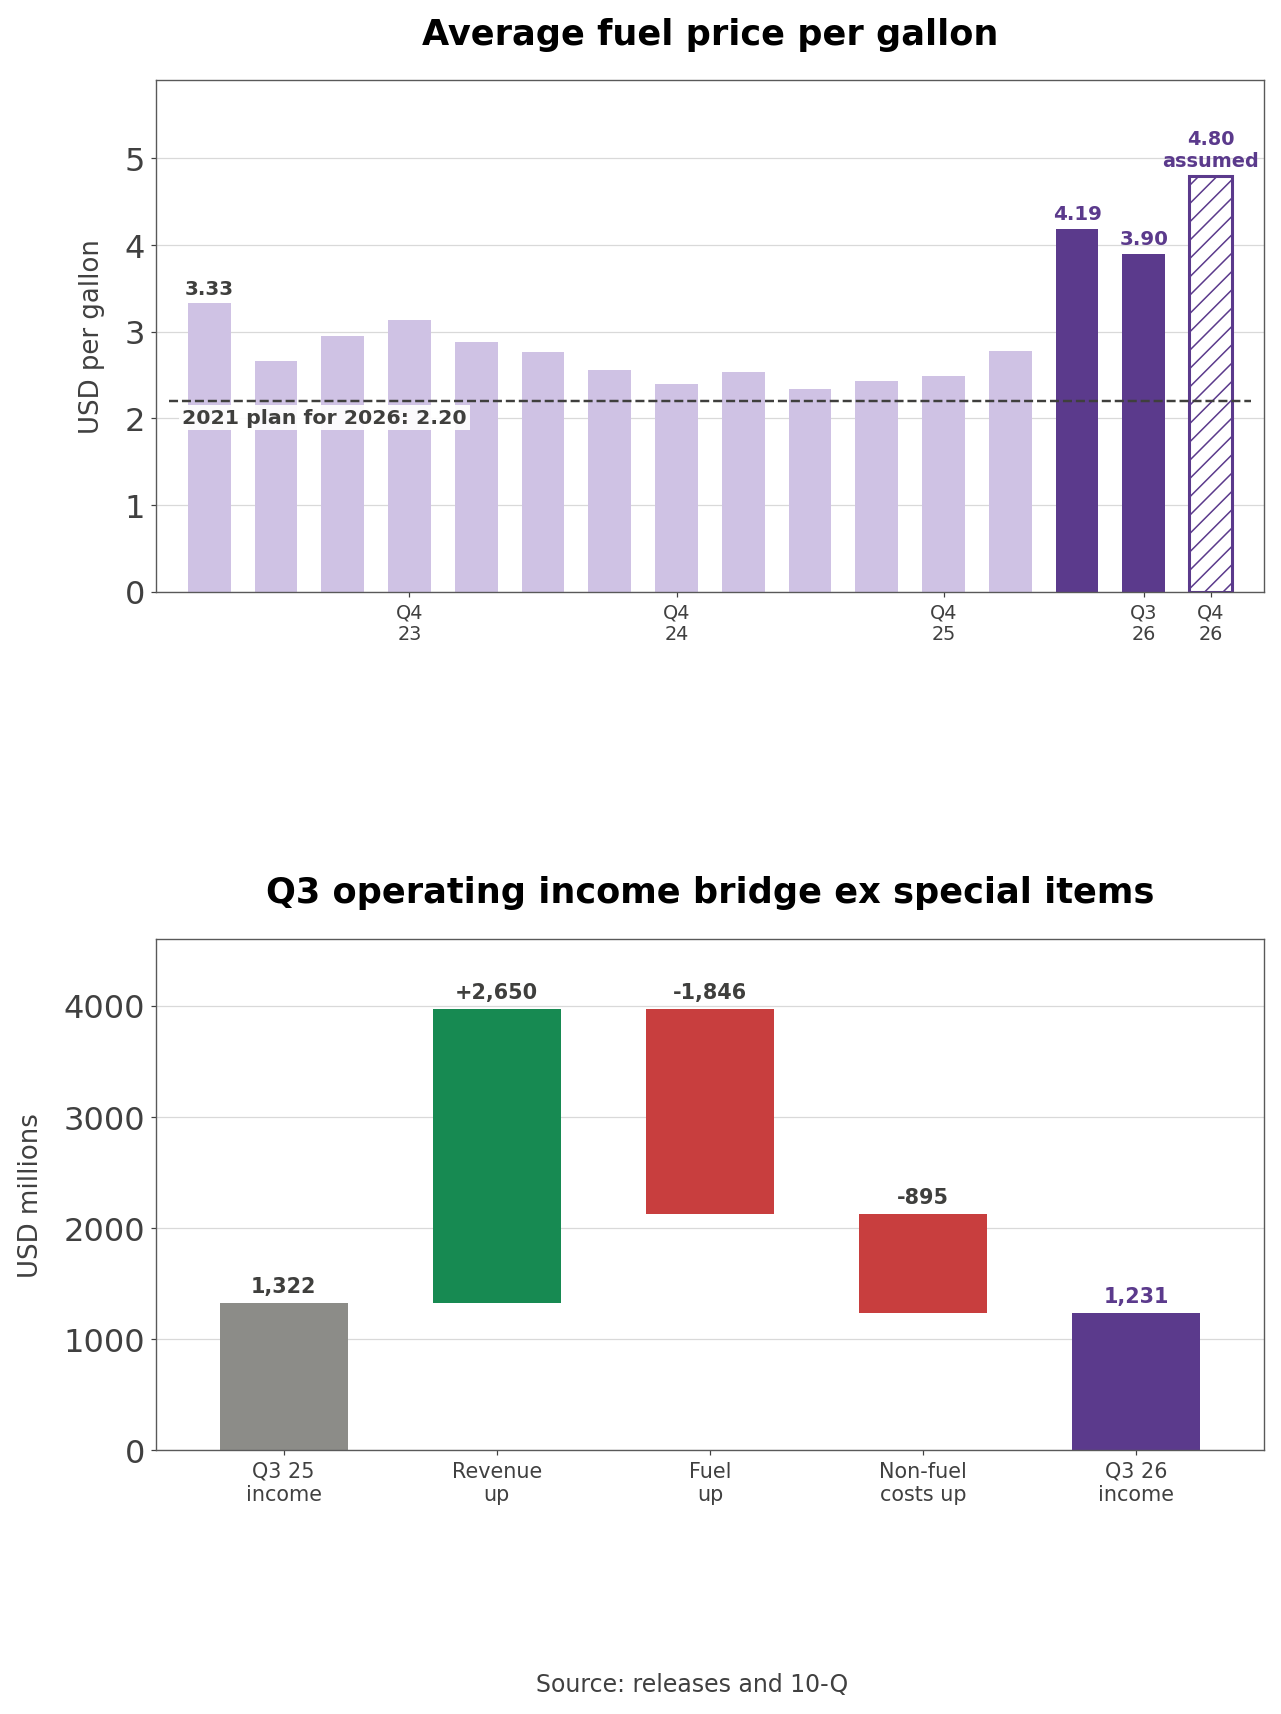
- The average fuel price was $3.90 a gallon in the third quarter, +60.3% above $2.43 a year earlier, while consumption rose 0.8% to 1.243 billion gallons. Fuel expense climbed $1.85 billion, or +61.6%, to $4.84 billion. CFO Michael Leskinen said on the call that United recovered 72% of the increase, explaining that much of the unexpected rise came within the quarter while most revenue was already booked. He expects fourth-quarter recapture to be similar to the third quarter, below the 100% United had expected, because jet fuel spiked at the end of the third quarter.
- Own calculation (operating income bridge): Using the 10-Q income statement and excluding special items, third-quarter operating income went from $1.32 billion a year earlier to $1.23 billion as revenue rose $2.65 billion, fuel $1.85 billion and non-fuel costs $895 million. The revenue gain covered the fuel increase 1.44 times but not the non-fuel increase on top of it. At the 2021 plan price of $2.20, third-quarter fuel would have cost $2.11 billion less, 11.8% of revenue.
- Within non-fuel costs, salaries and related costs rose $406 million, or 8.9%. The 10-Q puts the increase "primarily due to increased pay as a result of the increase in flying activity, a 5.4% increase in headcount" along with raises under the flight attendant contract. The CFO said third-quarter CASM-ex growth of +7.8% now carries the full run-rate of that contract and the effect of near-term capacity cuts, and called the third quarter the peak.
Guidance Cuts and the $4.80 Fuel Assumption
- United's 2026 adjusted EPS guidance went from $12.00 to $14.00 in January to $7.00 to $11.00 in April and $9.00 to $11.00 in July, and the October update dropped the full-year range. In April the company assumed revenue would recover 40% to 50% of fuel increases in the second quarter, 70% to 80% in the third and 85% to 100% in the fourth. In July it raised the bar: "The Company expects to recover 80% to 90% of the fuel price increase in the third quarter and 100% of the fuel price increase by the fourth quarter of 2026." The third quarter came in at 72%.
- Set against results, quarterly guidance was $1.00 to $1.50 in the first quarter against $1.19, $1.00 to $2.00 in the second against $1.99, and $2.50 to $3.50 in the third against $2.54. The third-quarter range assumed fuel at $3.69 a gallon; the actual was $3.90.
- Company disclosure (third-quarter investor update): Fourth-quarter adjusted EPS of $0.50 to $1.50 assumes an all-in fuel price of about $4.80 a gallon, based on the Gulf Coast jet forward curve on October 16. In the short term each $0.01 change in fuel price equals about 2.5 cents of quarterly EPS, and consensus assumes about $4.35 fuel, about $0.45 below the company's assumption and worth about $1.00 of quarterly EPS.
- Own calculation (2026 EPS): First- to third-quarter adjusted EPS totals $5.72, so the fourth-quarter range implies $6.22 to $7.22 for 2026, -41.4% to -32.0% below 2025's $10.62. The fourth-quarter range is -83.9% to -51.6% below last year's $3.10, and its $1.00 width equals about 40 cents of fuel on the company's own sensitivity.
United Next Targets Against 2026 Fares and Costs
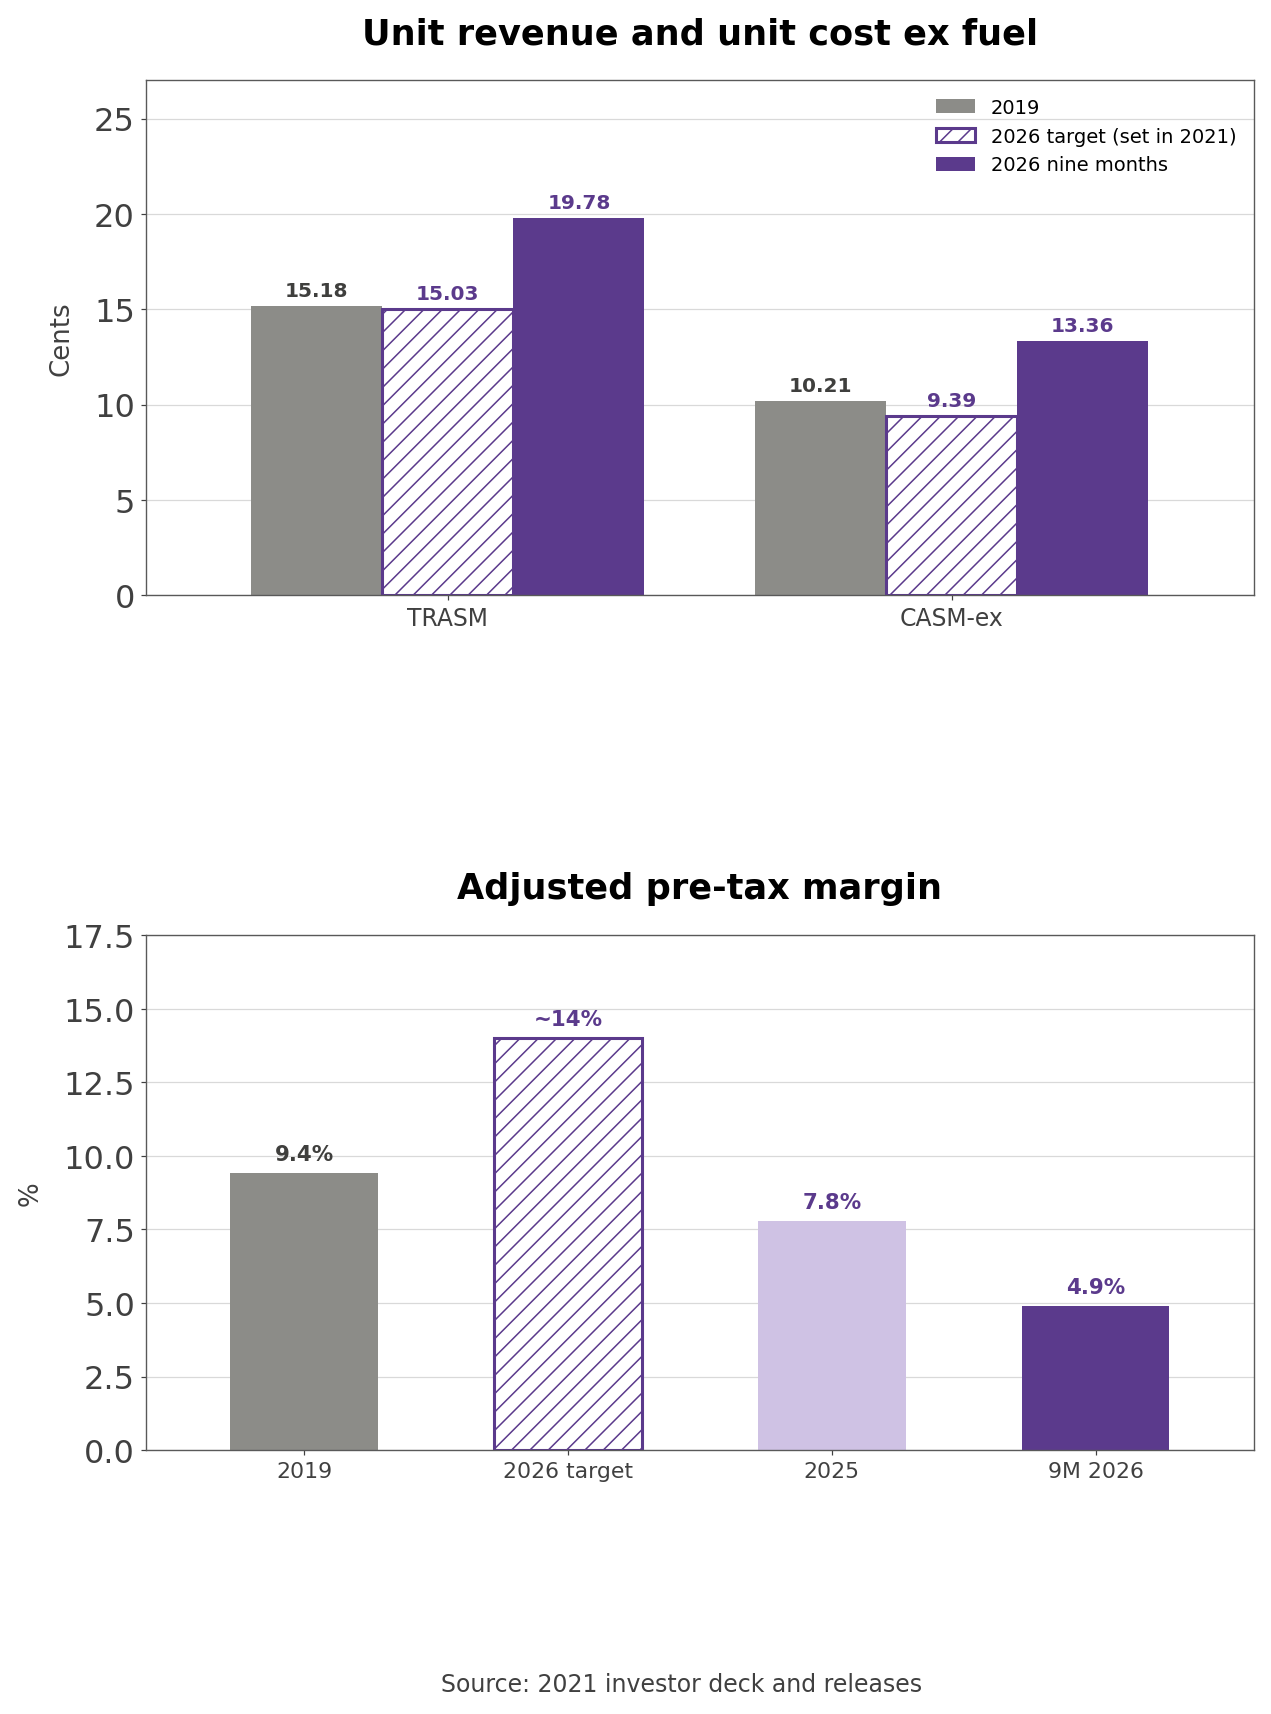
- Nine-month TRASM of 19.78 cents is 4.75 cents above the roughly 15.03 cents the 2021 deck implied for 2026. CASM-ex of 13.36 cents is 3.97 cents above the roughly 9.39-cent target, and fuel at $3.65 is $1.45 above plan. Fares and non-fuel costs have both risen about 30% from 2019 while fuel runs 66% above plan, and the adjusted pre-tax margin of 7.8% in 2025 and 4.9% for nine months of 2026 is far from 14%.
- Debt targets have moved the same way. Adjusted net debt of $20.47 billion is above the under-$18 billion goal, and adjusted total debt of $35.12 billion divided by TTM adjusted EBITDAR of $8.38 billion gives 4.19 times, against a target below 2.5 times and above the 3.2 times the deck showed for 2019. United's own net leverage measure, adjusted net debt over adjusted EBITDAR, is 2.4 times; the CFO repeated a goal below 2 times and said United remains determined to reach investment grade metrics and ratings next year.
How a Hub Airline Makes Money
- United earns money from passengers, cargo and other revenue. In 2025 passenger revenue was $53.44 billion, cargo $1.78 billion and other revenue, which includes MileagePlus partner income, $3.85 billion, with other revenue growing +10.4% against 3.1% for passengers. In the third quarter domestic passenger revenue of $10.73 billion, 60.0% of the total, rose +19.3%, Atlantic revenue of $3.85 billion rose 10.5%, Pacific revenue of $1.84 billion rose 17.6% and Latin America revenue of $1.45 billion rose +23.1%. Cargo revenue rose 22.7% and other revenue 13.0%.
- Fares have reversed direction. In 2025 passenger revenue rose in all four regions, but average fare per passenger fell 1.9% domestically, 0.8% across the Atlantic, -3.5% across the Pacific and 2.1% in Latin America. If 2025 was a year of adding seats at lower fares, the third quarter of 2026 held capacity to +1.3% and raised prices.
- The unit of sale is the seat. United sells premium cabins (United First, Polaris and Economy Plus), standard economy and Basic Economy separately on the same aircraft and uses the price gaps to lift unit revenue. Premium cabin revenue rose 17% on 2.5% more capacity, non-premium revenue 18.4% on 0.5 points of capacity growth, and Basic Economy revenue 16%. Business revenue rose 22% and leisure revenue 16%, while leisure load factor fell 1.3 points, a sign of some resistance to higher fares.
- The second engine is MileagePlus. Chase pays United for miles earned on co-branded cards; third-quarter compensation from Chase rose 15% and co-brand card spending 13%, and United expects one million new card accounts in 2026. In 2025 about 10.9 million award tickets were used on United and United Express, and "These awards represented approximately 10.3% of United's total revenue passenger miles."
- The third engine is the hub network. United's seven hubs sit in the largest U.S. metro areas, and in the third quarter it served 241 airports in the U.S. and Canada on its largest domestic schedule ever. From the second quarter of 2027, FAA limits at Chicago O'Hare will cap United at 600 daily flights. United belongs to Star Alliance and runs four joint business arrangements, including Air Canada and the Lufthansa Group across the Atlantic and ANA across the Pacific.
- Regional flying under the United Express brand is operated by CommuteAir, GoJet, Mesa, Republic and SkyWest under capacity purchase agreements. United pays them fees and bears fuel and landing fees itself, so regional fuel costs land on United's income statement.
- On top of the network sits Starlink Wi-Fi, installed on more than 640 aircraft and free for MileagePlus members in every cabin. More than 5.4 million customers used it in September, and the release says "Starlink is now available on about half of all United flights, including regional flights," with the whole fleet covered by the end of 2027.
How United Compares With Four U.S. Airlines
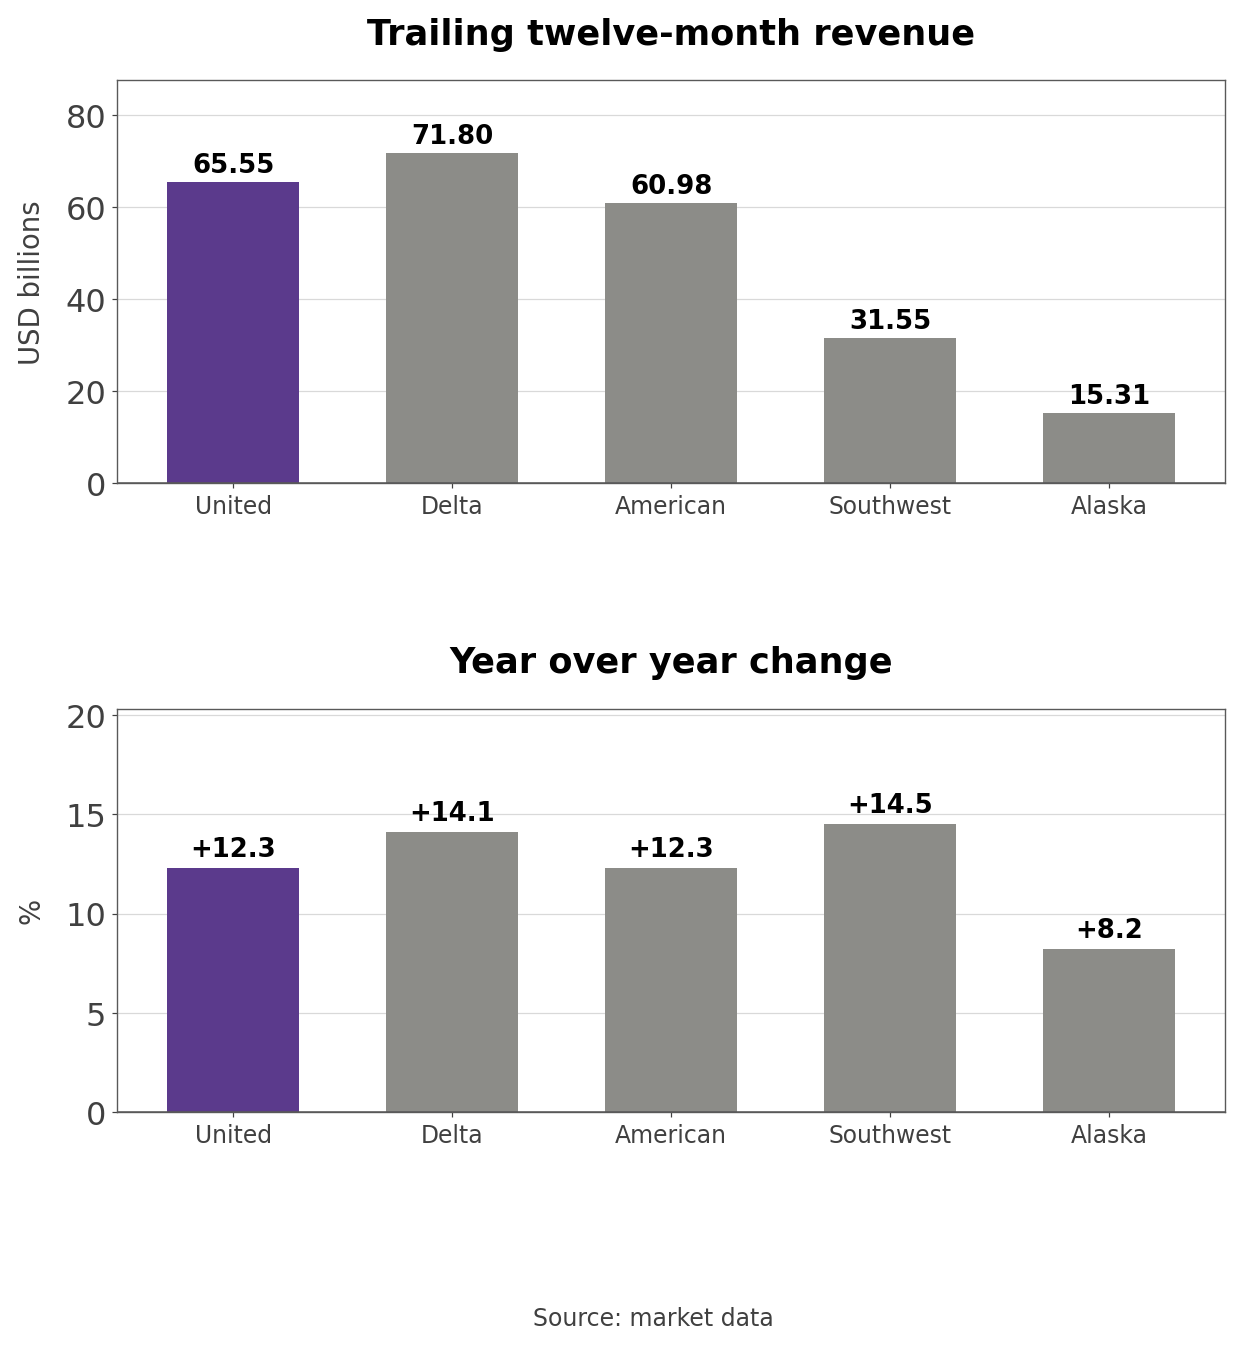
- TTM revenue is $71.80 billion at Delta, $65.55 billion at United, $60.98 billion at American, $31.55 billion at Southwest and $15.31 billion at Alaska. Growth runs from Southwest at +14.5% and Delta at +14.1% to United and American at +12.3% and Alaska at 8.2%. Delta and American are network carriers with hubs and long-haul flying like United, Southwest is mostly domestic and Alaska is West Coast focused. All five swing with fuel and industry capacity, and American and Alaska are loss-making on a TTM basis, so price to sales and EV/EBITDA are the yardsticks.
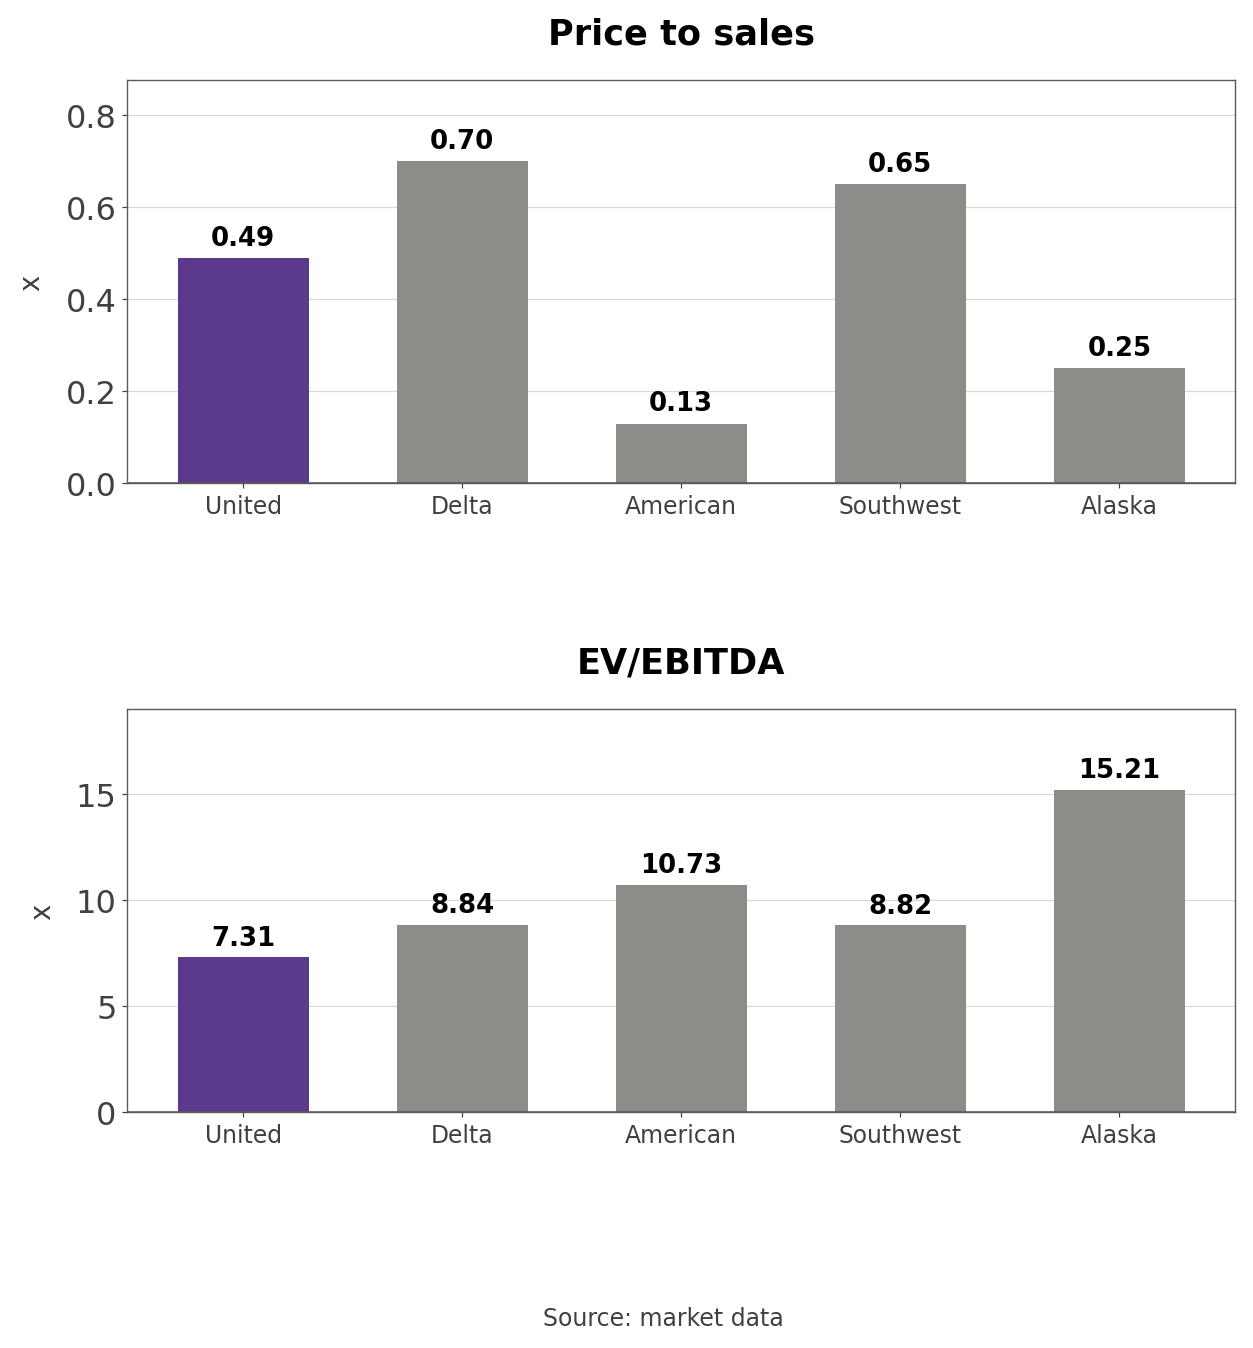
- Price to sales is 0.70 times at Delta, 0.65 at Southwest, 0.49 at United, 0.25 at Alaska and 0.13 at American. EV/EBITDA is 7.31 times at United, 8.82 at Southwest, 8.84 at Delta, 10.73 at American and 15.21 at Alaska. Over one year Southwest shares rose +37.8%, Delta 33.8% and United 4.1%, while American fell 7.8% and Alaska -17.6%. United's $31.82 billion market value is 0.63 times Delta's $50.24 billion on 0.91 times its revenue, and its EV/EBITDA is the lowest of the five.
P/E on Adjusted EPS and Price to Sales Over 44 Months
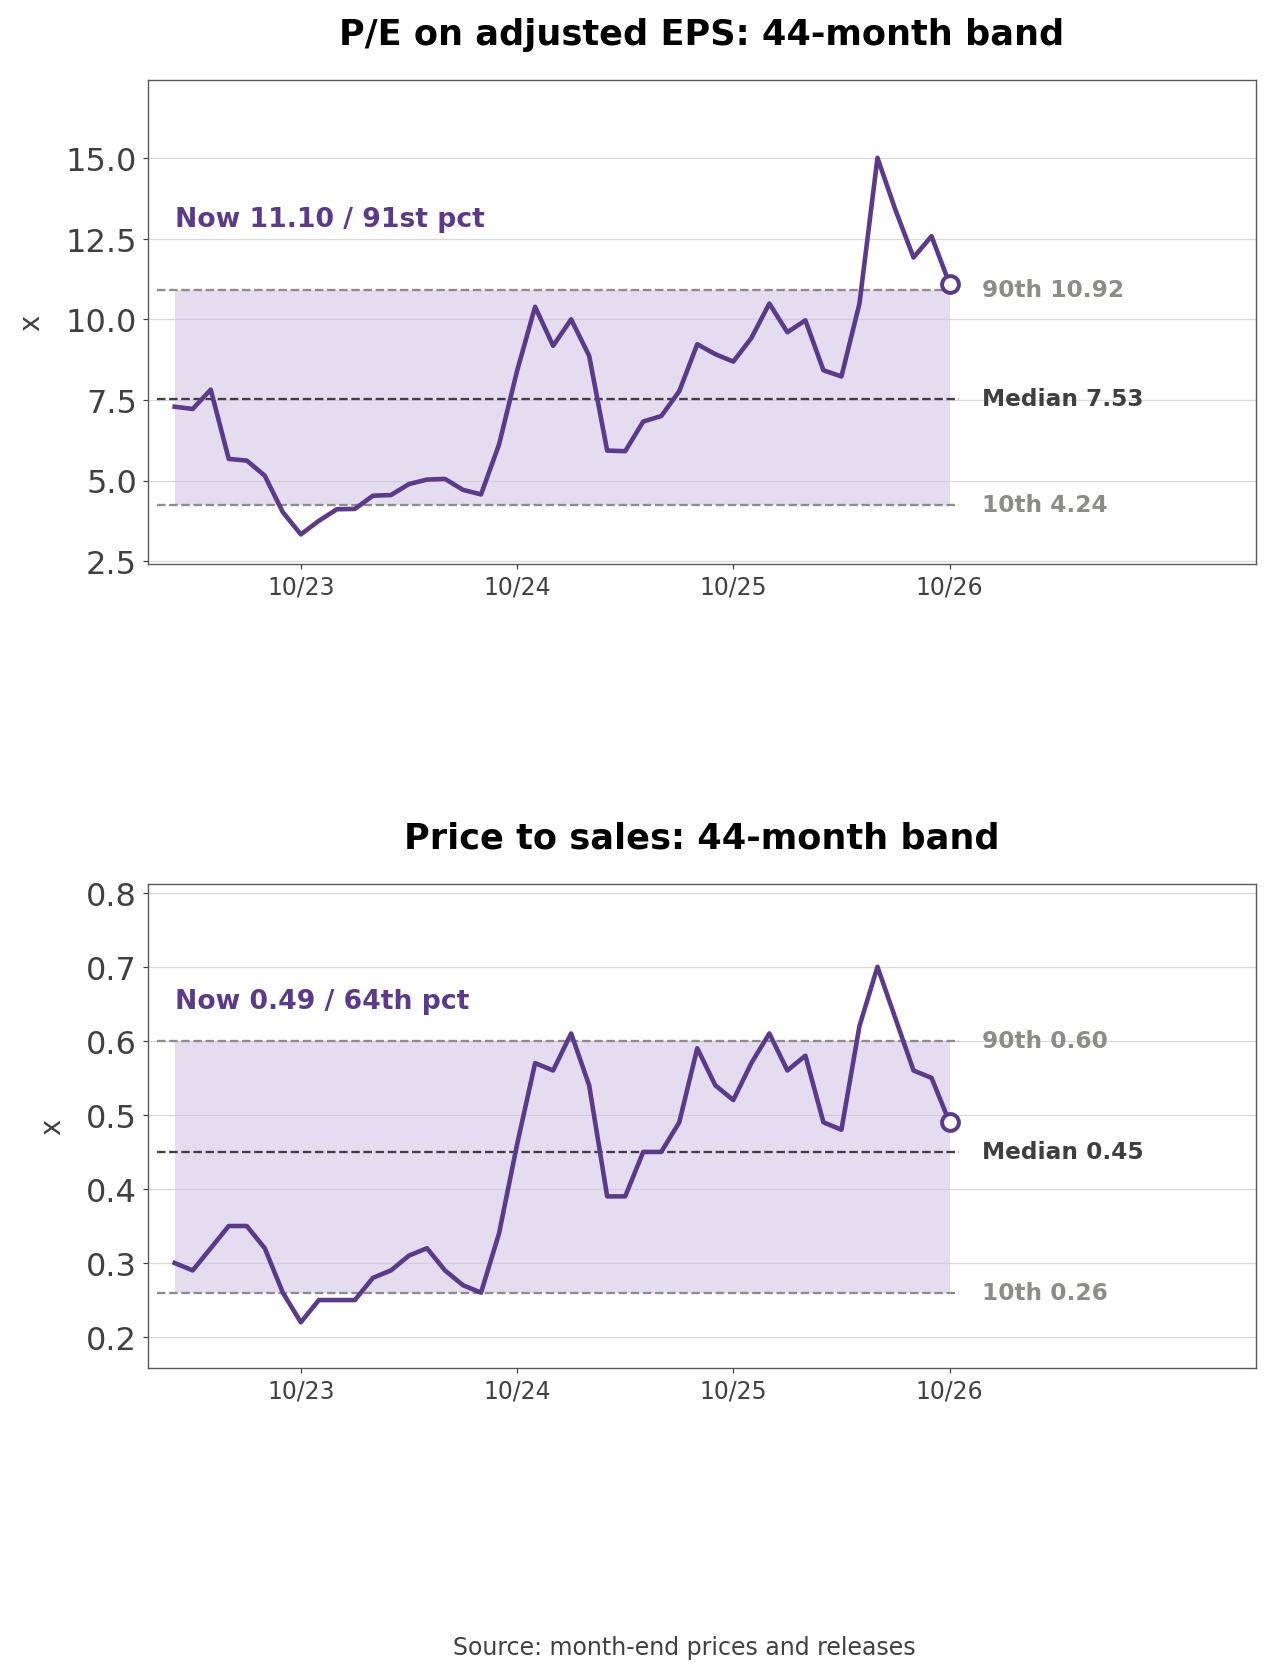
- On TTM adjusted EPS of $8.82 the stock trades at 11.10 times, in the 91st percentile of the 44 months since March 2023, against a median of 7.53. The low was 3.33 times in October 2023 and the high 15.01 times in June 2026. The band starts in March 2023, the first month the trailing four quarters no longer included pandemic losses. Price to sales of 0.49 times is in the 64th percentile against a median of 0.45.
- A shrinking denominator explains much of the high P/E. On the $6.72 midpoint of implied 2026 adjusted EPS the P/E is 14.57 times; on 2025's $10.62 it is 9.22 times, closer to the band median.
Three Conditions That Move the Stock
- Fuel recapture was 72% in the third quarter. A fourth quarter above that pace and a path toward the 100% target for 2027 would let margins recover even with fuel high; recapture stuck near 72% means every rise in fuel prices comes straight out of earnings.
- The fuel price per gallon is assumed at $4.80 for the fourth quarter. If prices follow the 2027 forward curve the CFO cited, about $4.50 in the first quarter falling to $3.70 by the fourth, each cent saved is worth 2.5 cents of quarterly EPS; fuel holding above $4.80 removes one of the conditions for a double-digit pre-tax margin in 2027.
- CASM-ex growth was 7.8% in the third quarter. Slowing to the 2% to 3% United plans for 2027 would let fare increases reach earnings; growth above 5% from labor and airport costs would keep margins flat even if recapture improves.
What Has to Go Right for a Double-Digit Margin
- The next numbers are fourth-quarter recapture and 2027 guidance. Kirby said a double-digit pre-tax margin in 2027 needs at least one of lower fuel prices, lower industry capacity, or an industry willing to trade load factor for yield, and that Starlink's unit revenue lift alone will not be enough. One analyst on the call pointed out that fourth-quarter domestic capacity is up roughly 8% to 9% at both United and American.
- One question remains open. The 2021 plan aimed for a 14% margin with fares 1% below 2019 and costs 8% lower; fares are now 30% higher and costs 31% higher. With fuel at 1.7 times the plan price, will demand keep absorbing the fare increases needed to recover all of it?
Related Analysis
- Delta Air Lines (DAL) Stock: 23.6% EPS Guidance Cut on Fuel: the closest network peer cut guidance on higher fuel, a direct comparison with United's 72% recapture.
- Casey's (CASY) Stock Analysis: Fuel Margin Drove Q4 Profit: a fuel seller whose margin rose with fuel prices, the other side of the trade.
- Trip.com (TCOM) Stock Analysis: Antitrust Fine and Guidance: a travel booker, for comparing how demand holds up as fares rise.
#UnitedAirlines #UALStock #AirlineStocks #JetFuel #OilPrices #Airlines #USStocks #StockAnalysis #EquityResearch #GlobalStockBrief
'US Stock Analysis' 카테고리의 다른 글
| Philip Morris (PM) Stock: Cigarette Pricing Carries ZYN (0) | 2026.10.26 |
|---|---|
| Intuitive Surgical (ISRG) Stock: The 3% to 5% Instrument Cut (0) | 2026.10.25 |
| Netflix (NFLX) Stock: A $2.8B Warner Fee and Record Buybacks (0) | 2026.10.25 |
| General Motors (GM) Stock: EV Add-Backs and a $20B Buyback (0) | 2026.10.25 |
| SpaceX (SPCX) Stock: One Customer and a 90-Day Exit Clause (0) | 2026.10.24 |


