- General Motors (NYSE: GM) grew third-quarter EBIT-adjusted +21.6% to $4.11 billion, raised its 2026 adjusted automotive free cash flow guidance to $11.5 billion to $12.5 billion, and approved a new $20 billion buyback. The shares still fell -9.6% in the week of the results. The third-quarter 10-Q and the earnings release show why the cash story is thinner than the headline: $4.24 billion of the $12.18 billion of nine-month adjusted free cash flow is cash spent unwinding electric vehicle (EV) capacity that the company adds back, and the raised full-year range leaves the fourth quarter with roughly zero.
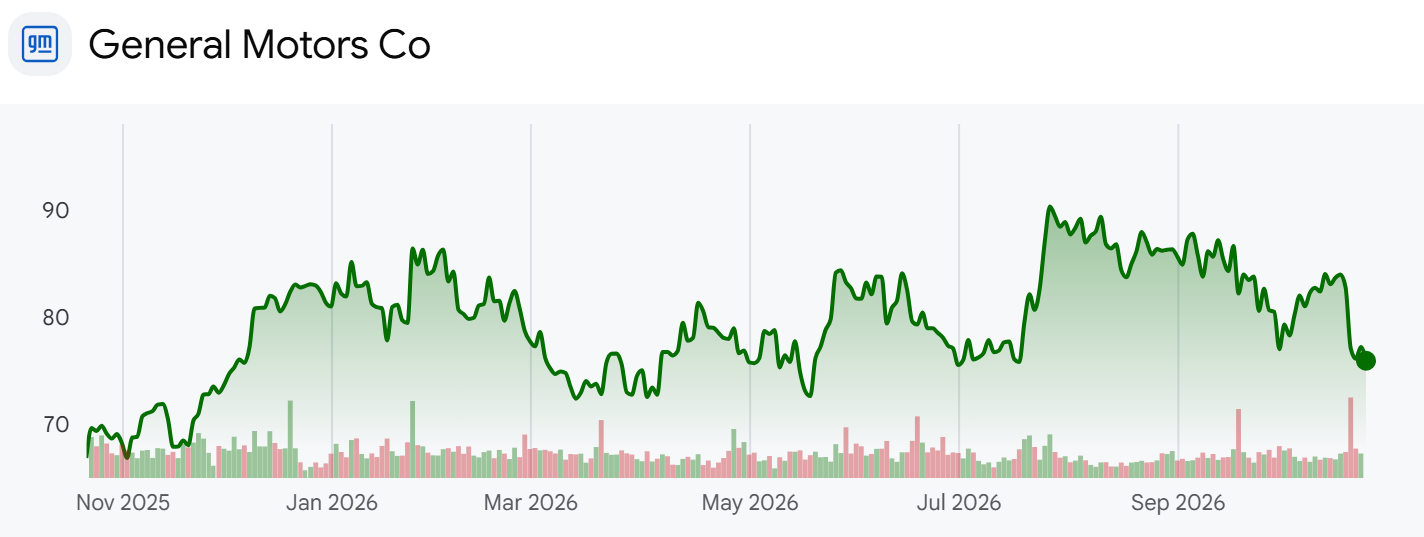
- GM sells Chevrolet, GMC, Buick, and Cadillac vehicles, earns most of its profit on North American pickups and large SUVs, and finances buyers and dealers through GM Financial. The shares trade at $75.92 for a market value of $64.04 billion on the 843.55 million shares listed on the 10-Q cover, -14.4% below the weekly high of $88.68 set in the week of July 31, 2026. EBIT-adjusted and adjusted automotive free cash flow are company non-GAAP measures; third-quarter GAAP net income was $3.34 billion. Free cash flow before add-backs, as used here, is automotive operating cash flow less capital spending, a calculation GM does not report as a headline figure.
Cash and Buybacks in the Q3 Earnings Deck
- Page 4 of the third-quarter deck lines up EBIT-adjusted of $4.1 billion, adjusted automotive free cash flow of $5.9 billion, and adjusted EPS of $3.70, then lists $2.5 billion of buybacks that retired 29 million shares and $0.2 billion of dividends. Page 15 calls the free cash flow "a four-year high." Page 17 gives the reason in a single line, "Increase driven by higher auto EBIT and tariff timing," and on the same page shows deliveries down 11% and global market share down 40 basis points to 7.8%.
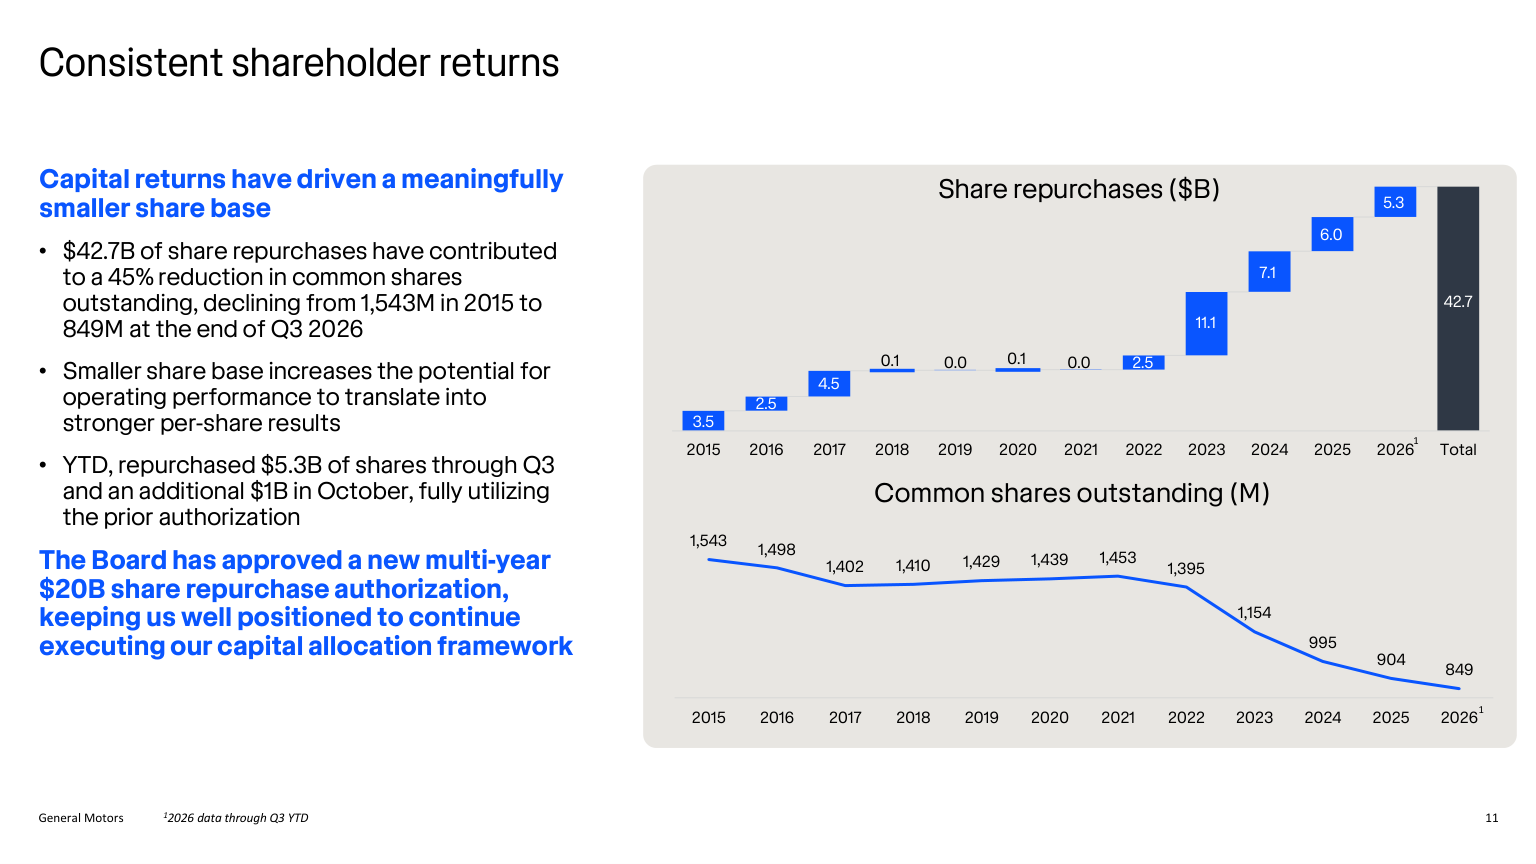
- Page 11 is the capital return chart. It credits $42.7 billion of repurchases since 2015 with a 45% cut in common shares, from 1,543 million to 849 million, and says GM bought $5.3 billion through the third quarter and another $1 billion in October, "fully utilizing the prior authorization." The board approved a new $20 billion authorization with no expiration date the same day.
- Chair and chief executive Mary Barra wrote in the third-quarter shareholder letter that the company's products and services make it "confident in the consistent, long-term growth of our earnings and cash generation, as well as our ability to return capital to shareholders." On the call, chief financial officer Paul Jacobson attributed the $1.7 billion year-over-year increase in quarterly free cash flow to higher earnings and the timing of tariff payments. Barra told analysts the path ahead is harder, with some external headwinds intensifying, while repeating that 2027 should be better than 2026 if demand holds and commodity and logistics pressure eases.
- Own calculation (buybacks against cash): Nine-month buybacks of $5.30 billion equal 67.1% of the $7.90 billion of automotive operating cash flow less capital spending, and 43.5% of the company's $12.18 billion adjusted figure. The new $20 billion authorization is 31.2% of the market value, and the third-quarter purchases averaged $86.21 a share.
EV Cash Payments and the Implied Fourth Quarter

- Page 12 carries the headline "EV charges substantially completed." Since the second half of 2025 GM has recorded $11.2 billion of EV-related charges, $7.4 billion of them with a cash impact; it had paid $4.6 billion by the end of September, expects about $1 billion more in the fourth quarter, and will pay the rest in 2027. The third-quarter cash charges went mostly to right-sizing the battery supply chain with joint venture partners, and the finance chief said lower supplier EV payments next year should leave more free cash flow for shareholders.
- Company disclosure (Q3 deck page 13, 2026 guidance): EBIT-adjusted narrows from $14.0 billion to $16.0 billion to $14.5 billion to $15.5 billion, adjusted EPS from $12.00 to $14.00 to $12.75 to $13.75, and adjusted automotive free cash flow rises from $9.5 billion to $11.5 billion to $11.5 billion to $12.5 billion.
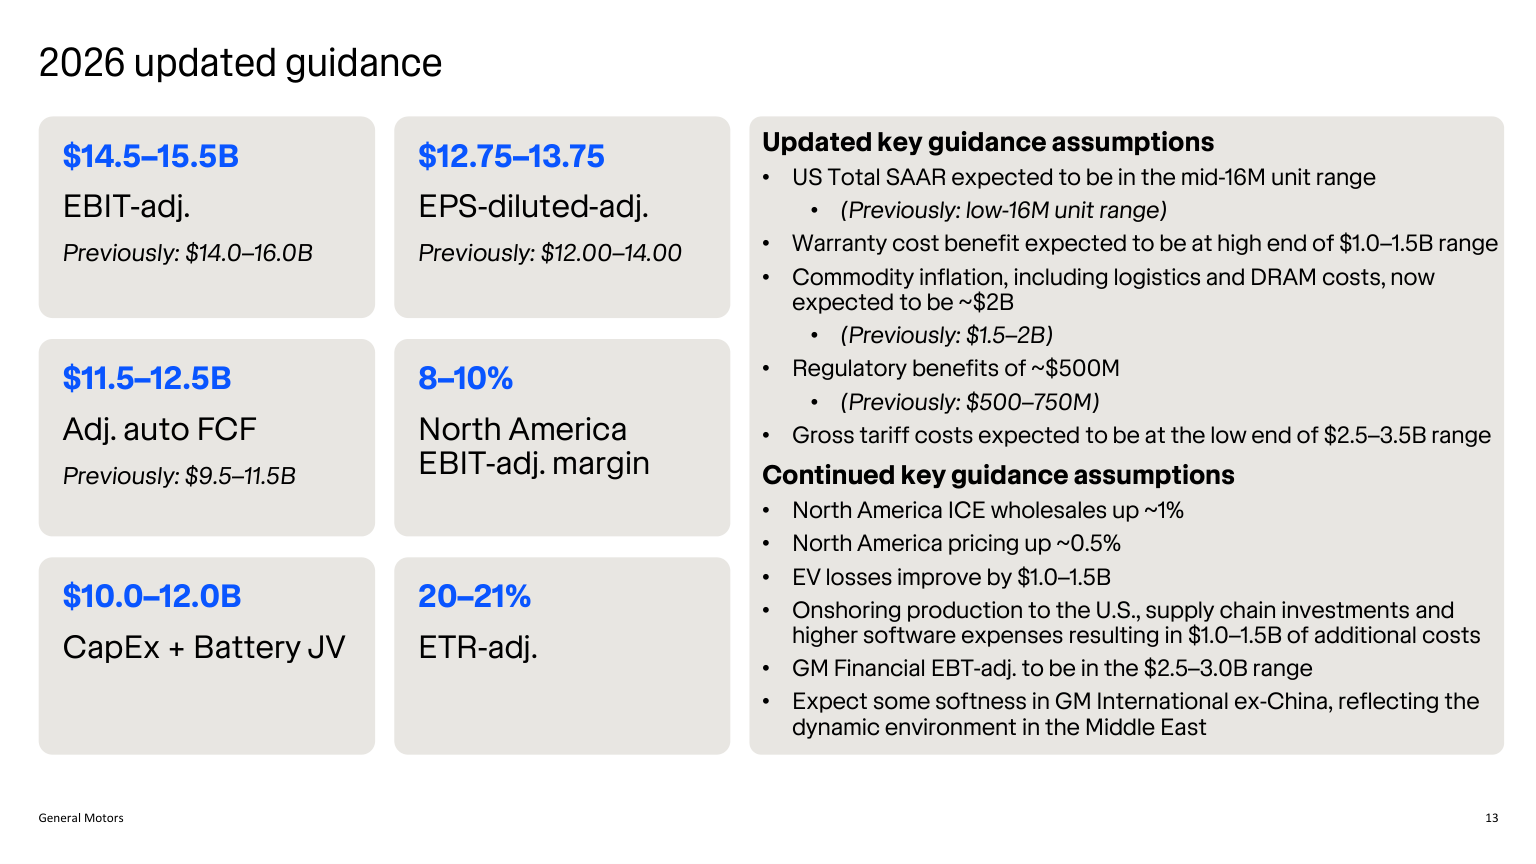
- The assumptions moved both ways. Commodity inflation including logistics and DRAM is now about $2 billion instead of $1.5 billion to $2 billion, and regulatory benefits about $500 million instead of $500 million to $750 million. U.S. industry sales moved up to the mid-16 million range, the warranty benefit to the high end of $1.0 billion to $1.5 billion, and gross tariff costs to the low end of $2.5 billion to $3.5 billion.
- Page 24 of the deck walks from nine-month automotive EBIT-adjusted of $10.3 billion through $5.2 billion of depreciation, working capital, accrued liabilities, interest, and taxes to $13.7 billion of operating cash flow. The release reconciles adjusted automotive free cash flow by starting from automotive operating cash flow, subtracting capital spending, and adding back "EV strategic realignment." That add-back was $2.23 billion in the first quarter, $1.87 billion in the second, and $139 million in the third. The full-year reconciliation shows $4.2 billion of adjustments, about what the first nine months already used, so on the guidance table the roughly $1 billion of fourth-quarter EV cash is not added back.
- Own calculation (fourth-quarter math): Subtracting nine-month results from the full-year ranges implies fourth-quarter EBIT-adjusted of $2.20 billion to $3.20 billion, against $2.84 billion a year earlier, adjusted EPS of $1.78 to $2.78 against $2.51, and adjusted automotive free cash flow of negative $0.68 billion to positive $0.32 billion, against $2.76 billion in the fourth quarter of 2025.
The Bull and Bear Case for GM Shares
- The bullish case rests on margins and the share count. North American EBIT-adjusted margin is 8.7%, inside the company's 8% to 10% target, the share base is 45% smaller than in 2015 so adjusted EPS grew faster than EBIT, the company says the material EV cash charges are nearly done, and the stock trades at 5.63 times adjusted earnings.
- The bearish case is about cash quality and the fourth quarter. A third of nine-month adjusted free cash flow is an EV add-back, the raised guidance implies near-zero adjusted free cash flow in the fourth quarter, GM Financial delinquencies rose from 3.2% to 3.7%, and U.S. share slipped from 16.8% to 16.1%.
- Outside view (sell-side research aggregate, October 2026): Of 51 analysts, 32 rate the stock Buy and 13 Hold, with an average price target of $93, 22.5% above the share price, and a range from $33 to $130. The day after the results Goldman Sachs cut its target from $112 to $96, Morgan Stanley from $101 to $95, and Barclays from $110 to $105; none of the changes listed that day was an increase.
From Bankruptcy to a 45% Smaller Share Count
- GM came out of its 2009 bankruptcy as a new company, and Mary Barra became chief executive in 2014. The stock fell to $17.29 in the week of April 3, 2020, recovered +40.8% in 2021, and then fell 42.4% in 2022. On November 29, 2023, GM announced a $10 billion accelerated share repurchase: it paid the banks $10 billion up front and immediately received and retired $6.8 billion worth of shares.
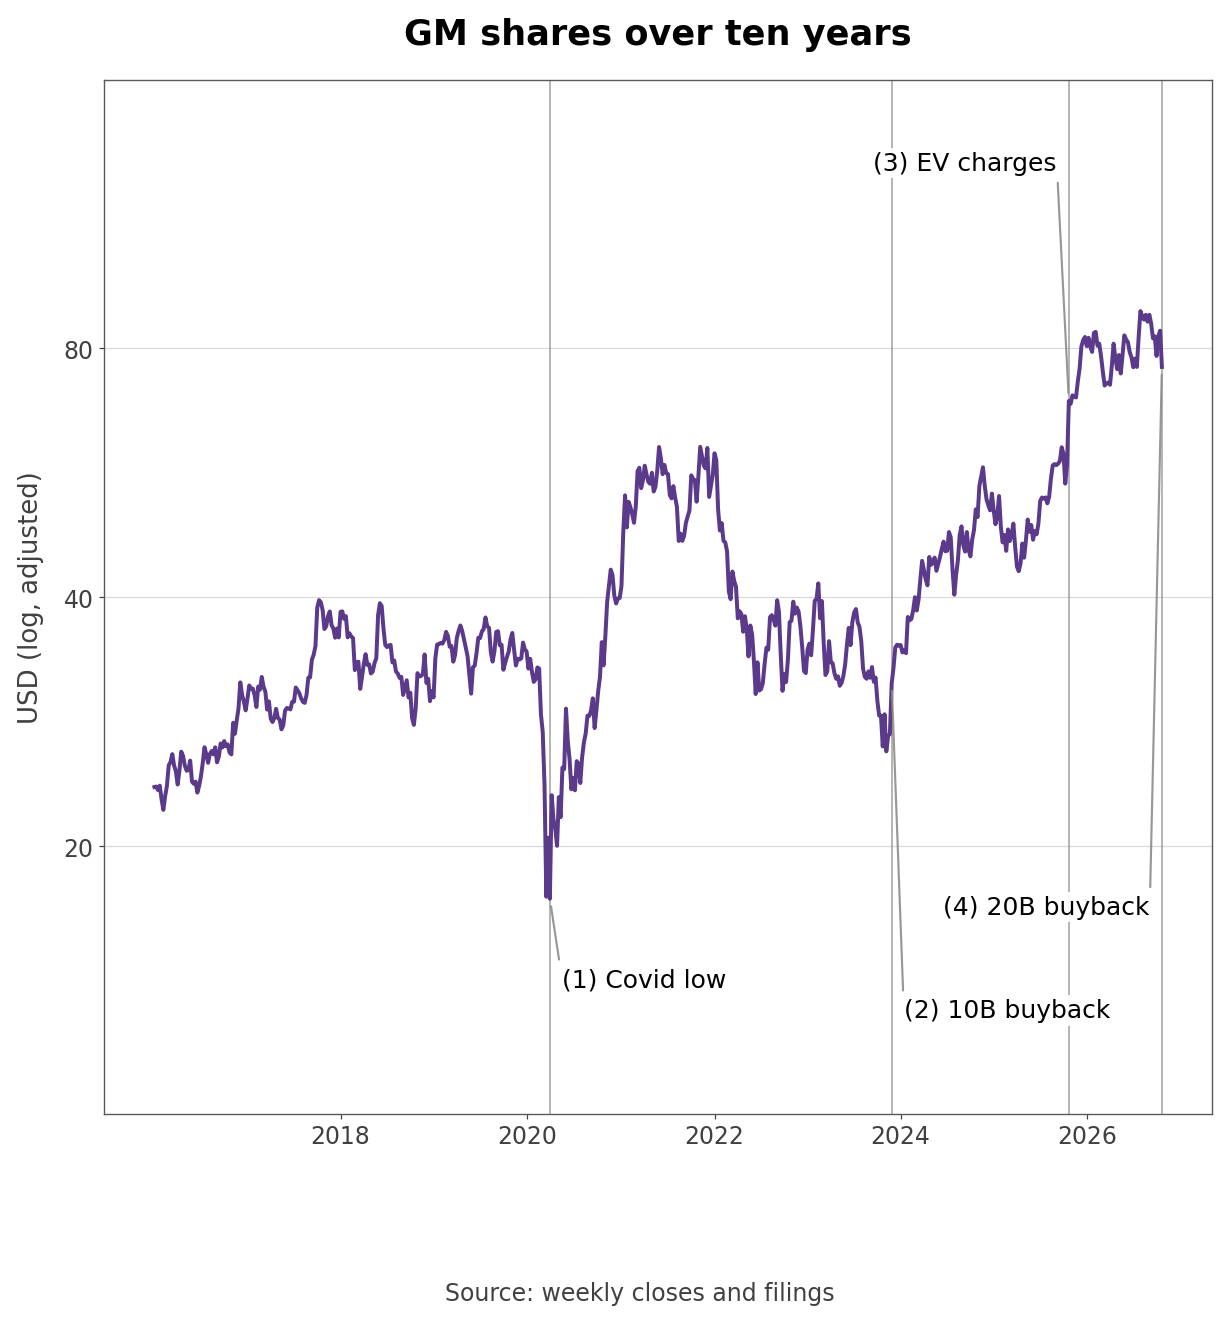
- Buybacks then ran at $11.1 billion in 2023, $7.1 billion in 2024, and $6.0 billion in 2025, taking the share count from 1,395 million in 2022 to 1,154 million, 995 million, and 904 million. The shares gained 52.7% in 2024 and 54.6% in 2025. Along the way GM took a $4.06 billion China joint venture equity loss in the fourth quarter of 2024 and began booking EV capacity charges in the second half of 2025, including $1.59 billion in the third quarter of 2025. On October 20, 2026 it announced the $20 billion authorization, and the stock is down 8.0% for 2026.
How Much of the Cash Flow Is an EV Add-Back?
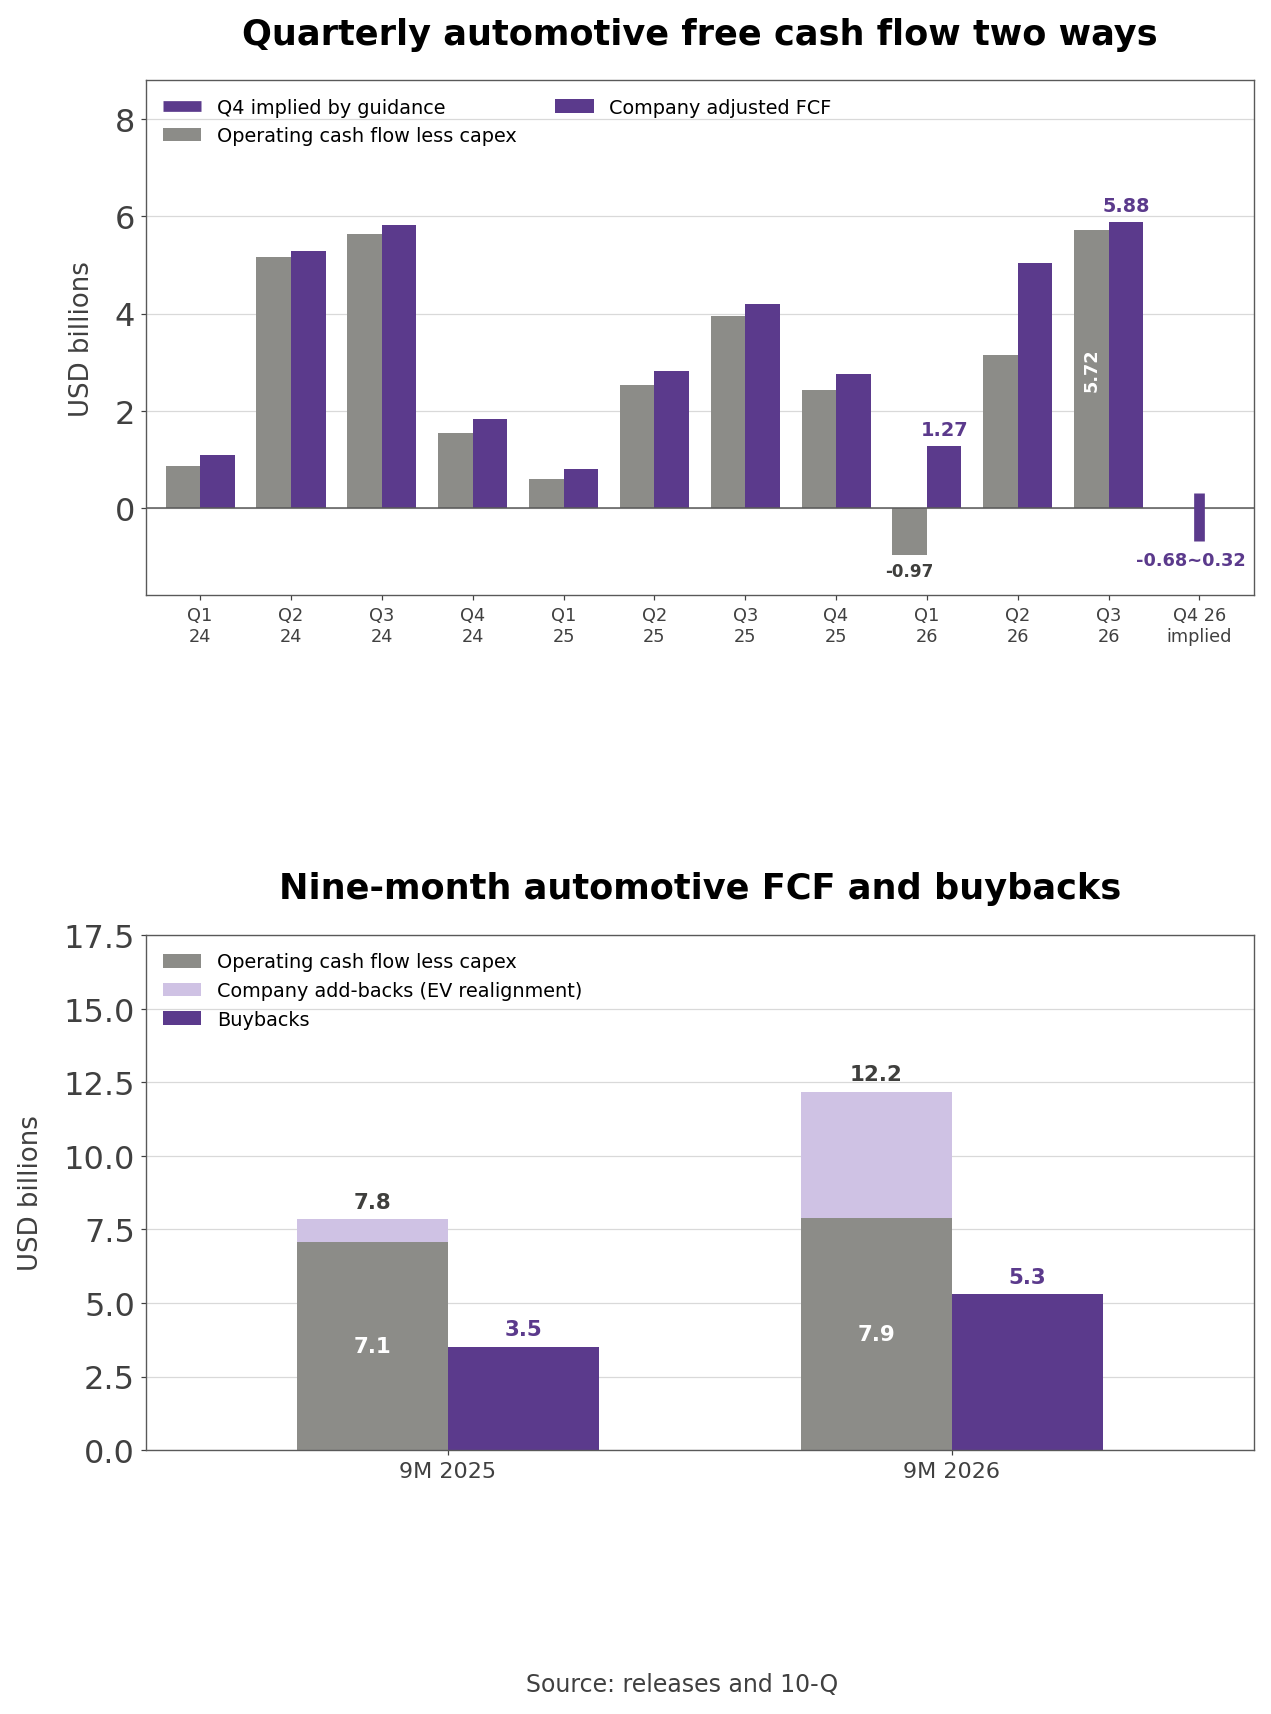
- Automotive operating cash flow less capital spending was negative $0.97 billion in the first quarter of 2026, $3.15 billion in the second, and $5.72 billion in the third, while the company's adjusted figure was $1.27 billion, $5.03 billion, and $5.88 billion. In the first quarter, operating cash flow was only $533 million; the $2.23 billion EV add-back is what turned adjusted free cash flow positive.
- Own calculation (two ways to count nine months): Free cash flow before add-backs totaled $7.90 billion over nine months, up 11.6% from $7.07 billion, while the adjusted figure reached $12.18 billion, up 55.4% from $7.84 billion. Of the $4.29 billion gap between them, $4.24 billion is the EV strategic realignment add-back.
- The deck's cash bridge on page 24 shows the same thing from another angle: accrued and other liabilities consumed $1.7 billion over nine months after adding $1.3 billion a year earlier, while working capital contributed $1.0 billion in the third quarter. For all of 2025, adjusted free cash flow of $10.60 billion was only $1.10 billion above operating cash flow less capital spending of $9.49 billion; in nine months of 2026 that gap grew 3.9 times as large.
Warranty Savings and Tariff Refunds in North America
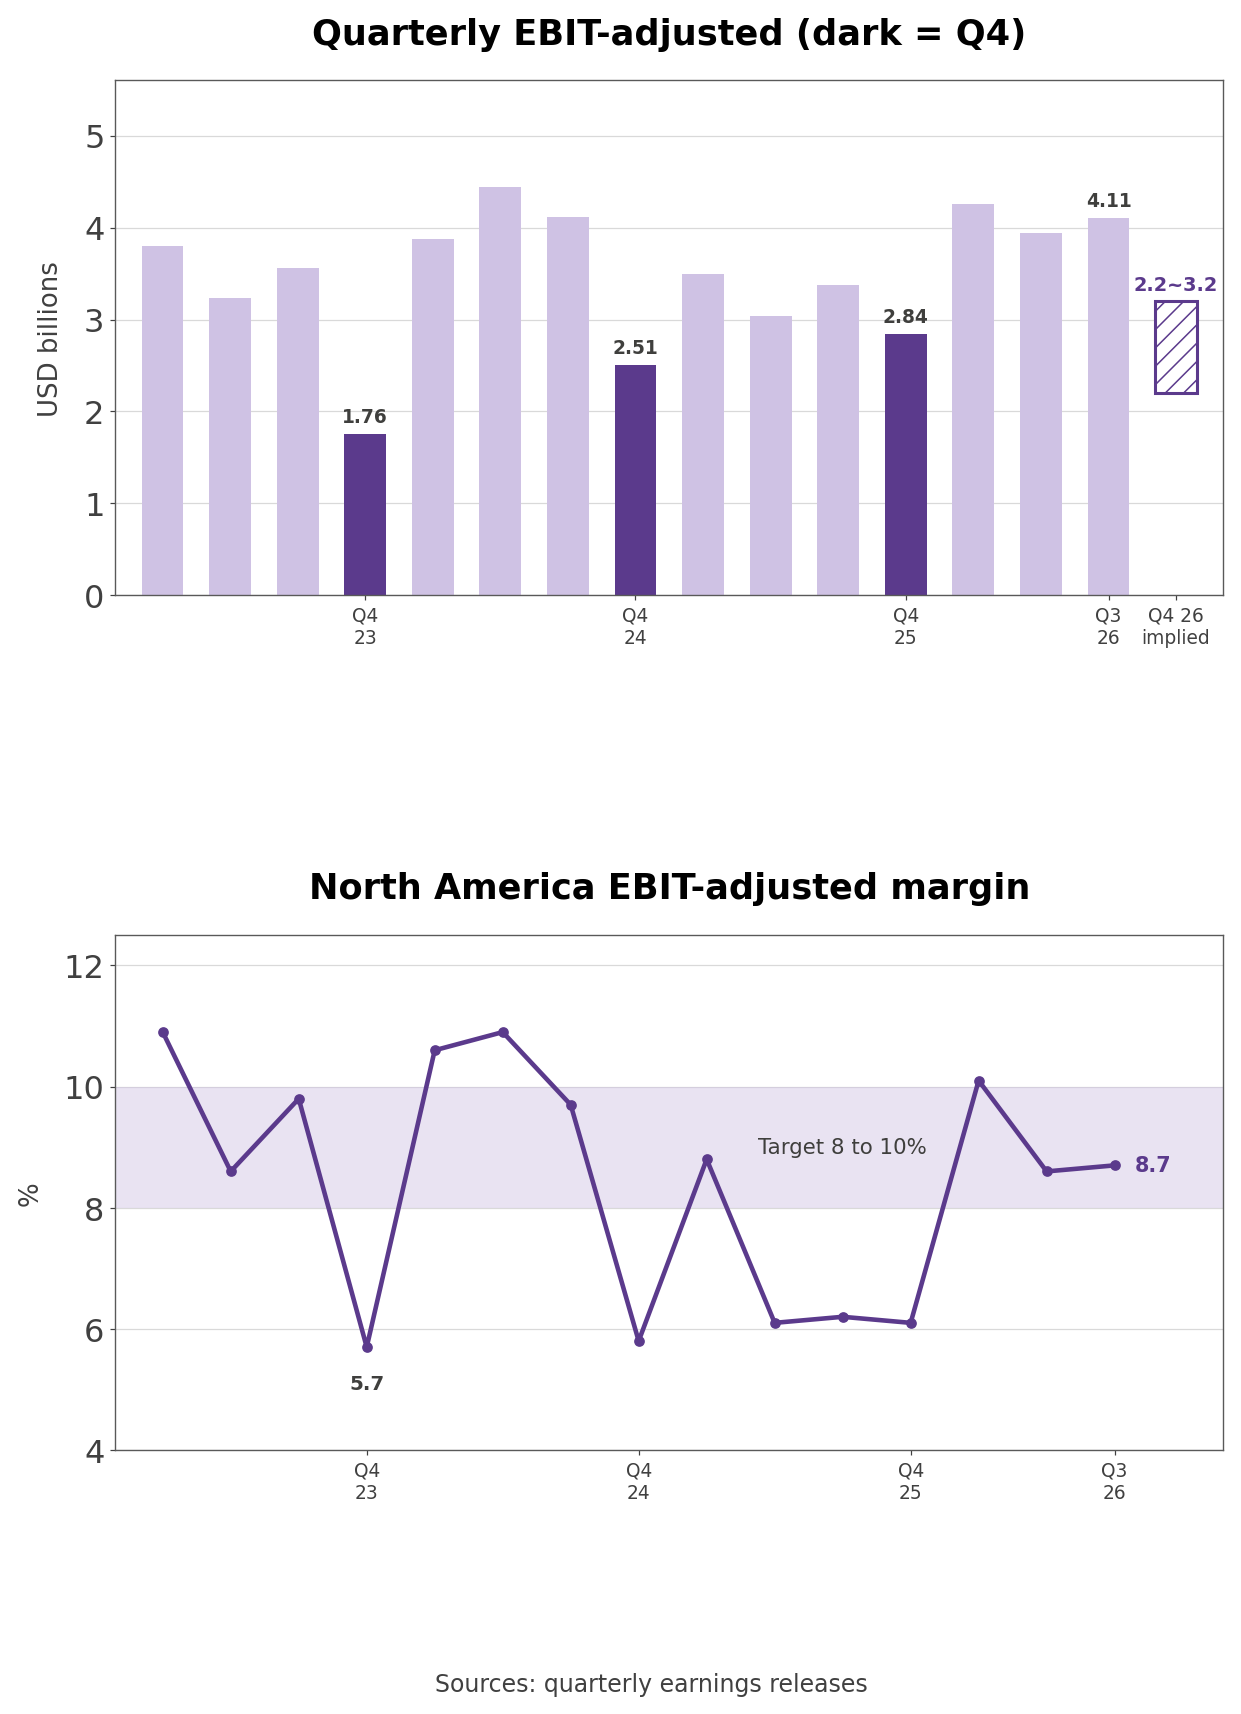
- North American EBIT-adjusted rose +43.4% to $3.59 billion, and the margin rose 2.5 points to 8.7%. Pages 18 and 19 credit warranty improvement, EV inventory adjustments, higher wholesale volume (53,000 more combustion vehicles, 23,000 fewer EVs), and full-size pickup mix, offset by commodity and logistics costs, onshoring, and the next-generation pickup launch. The finance chief put the third-quarter warranty improvement at $0.6 billion and the year-to-date figure at about $1.1 billion.
- The first-quarter North American margin of 10.1% included a 1.5-point benefit from a tariff adjustment, according to the first-quarter deck, and the 10-Q says GM "recorded net favorable adjustments of $0.7 billion primarily due to previously charged IEEPA tariffs that are refundable" over nine months. Neither the tariff refund nor this year's warranty step-down repeats at the same size in 2027.
- The fourth quarter is seasonally the weakest. EBIT-adjusted was $1.76 billion in the fourth quarter of 2023, $2.51 billion in 2024, and $2.84 billion in 2025. This year the Silao plant in Mexico has finished a four-week shutdown, Fort Wayne in Indiana goes down for four weeks from mid-December, and management expects higher pricing, including the new trucks, to offset most of a 35,000-unit full-size pickup volume headwind.
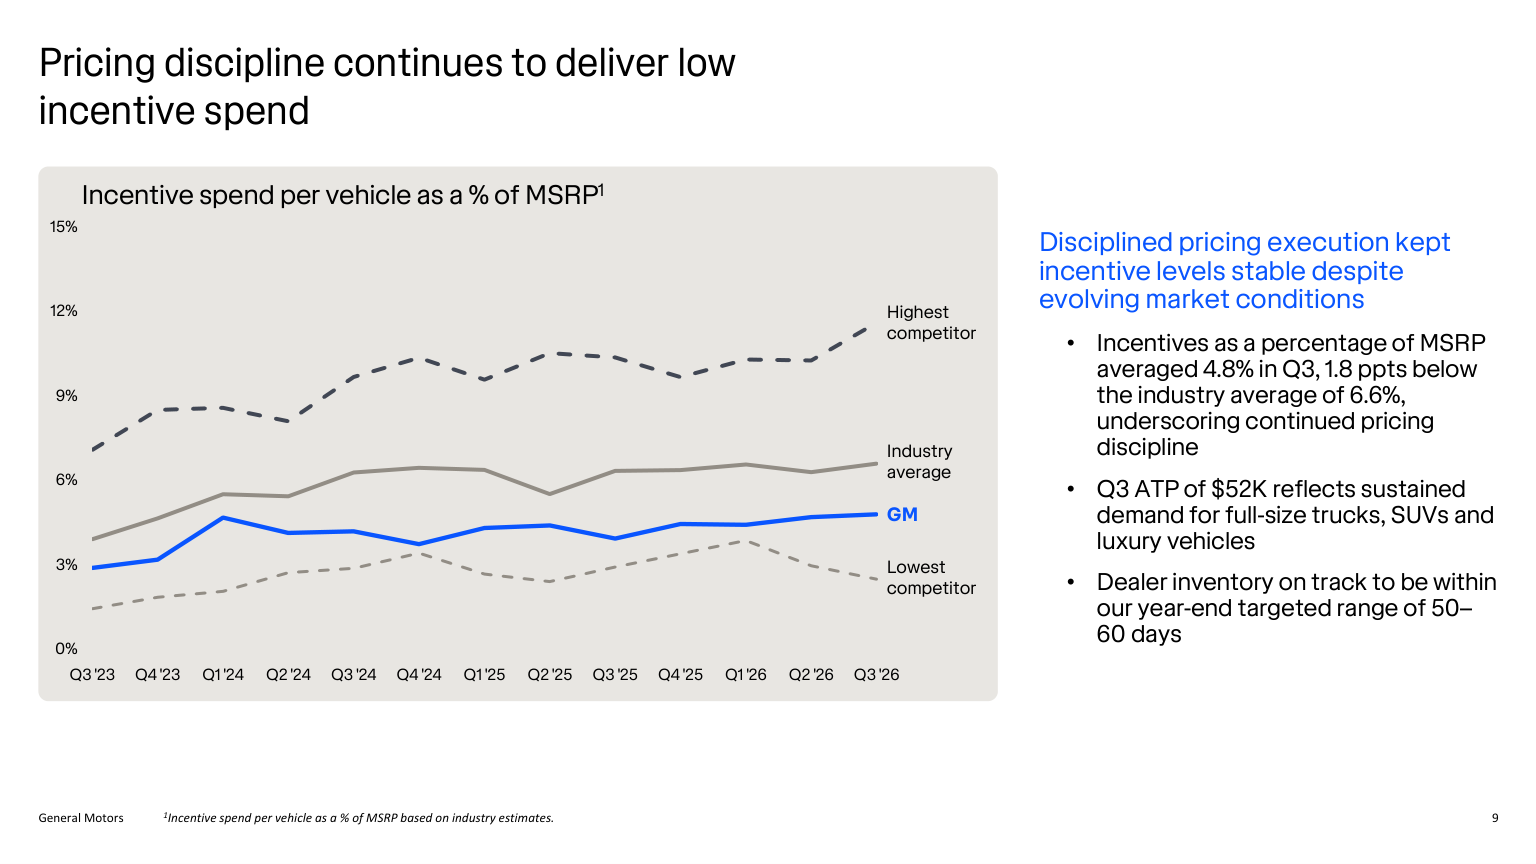
- Page 9 puts numbers on pricing: GM's incentives averaged 4.8% of the sticker price in the third quarter, 1.8 points below the industry average of 6.6%, and the average transaction price was $52,000.
GM Financial Delinquencies and U.S. Market Share
- GM Financial earned EBT-adjusted of $668 million in the third quarter, down -16.9%. Page 23 says lower interest expense and higher retail yield were offset by higher provisions for loan losses and lease depreciation, and the key metrics on page 36 show retail delinquencies over 30 days rising from 3.2% to 3.7% and annualized net charge-offs from 1.2% to 1.6%. Nine-month retail originations fell from $43.2 billion to $40.1 billion.
- GM Financial paid GM a $250 million dividend in the quarter, down from $350 million, and $1.15 billion over nine months; the deck describes "Sufficient capital and ample liquidity to support portfolio growth and navigate economic cycles." The automotive business held $23.1 billion of cash, above its $18 billion average target, against $15.8 billion of automotive debt.
- U.S. market share fell from 16.8% to 16.1%. Global deliveries dropped from 1.563 million to 1.390 million, with China falling from 469,000 to 358,000, and GM International earned just $28 million after a $0.1 billion mark-to-market loss on its Momenta investment. China joint venture equity income was $32 million, an eighth straight profitable quarter.
How Pickups and Auto Loans Make Money
- Most GM revenue is booked when it ships vehicles to dealers and fleet customers; third-quarter wholesale volume was 1.028 million units. Profit is concentrated in North America: of $12.30 billion of nine-month EBIT-adjusted, North America contributed $10.70 billion, GM Financial $1.96 billion, and GM International $342 million, with corporate costs of $700 million. GM International builds and sells vehicles in Korea, South America, and the Middle East, while China shows up only as equity income from the joint ventures with SAIC.
- Full-size pickups and SUVs carry the earnings. Page 5 says GM's full-size pickups have led U.S. sales for 19 straight quarters, light-duty pickup sales rose 9% in the third quarter, and small SUVs led by the Chevrolet Trax and Buick Envista had their best quarter ever, up +27%. The next-generation Chevrolet Silverado and GMC Sierra light-duty pickups start reaching customers at the end of the fourth quarter, followed by heavy-duty pickups and the next full-size SUVs.
- Software and services build deferred revenue. Page 10 says OnStar ended the quarter with $6.8 billion of deferred revenue, up about 40%, and recognized more than $800 million of revenue, up 15%. GM expects to add about 1 million subscribers in 2026 and pass 850,000 paid Super Cruise subscribers by year end, Super Cruise revenue rose about 60% in the quarter, and 30% to 40% of owners keep paying after the three-year prepaid period ends.
- GM Financial earns the spread between loan and lease income and its funding cost, and on leases it carries the risk that used-vehicle prices at lease end fall short. Its earning assets include loans to GM dealers for inventory, so the group funds vehicles from the dealer lot to the driveway. Trailing four-quarter net income to common was $1.8 billion, and the adjusted return on tangible common equity slipped to 13.8% from 16.2%.
How Four Rival Automakers Compare
- Trailing twelve-month revenue is $319.65 billion at Toyota, $187.97 billion at Ford, $186.95 billion at GM, $183.78 billion at Stellantis, and $138.53 billion at Honda. Growth runs from Stellantis at 10.1%, Toyota at 7.2%, Honda at 4.1%, and Ford at 1.5% to GM at -0.3%.
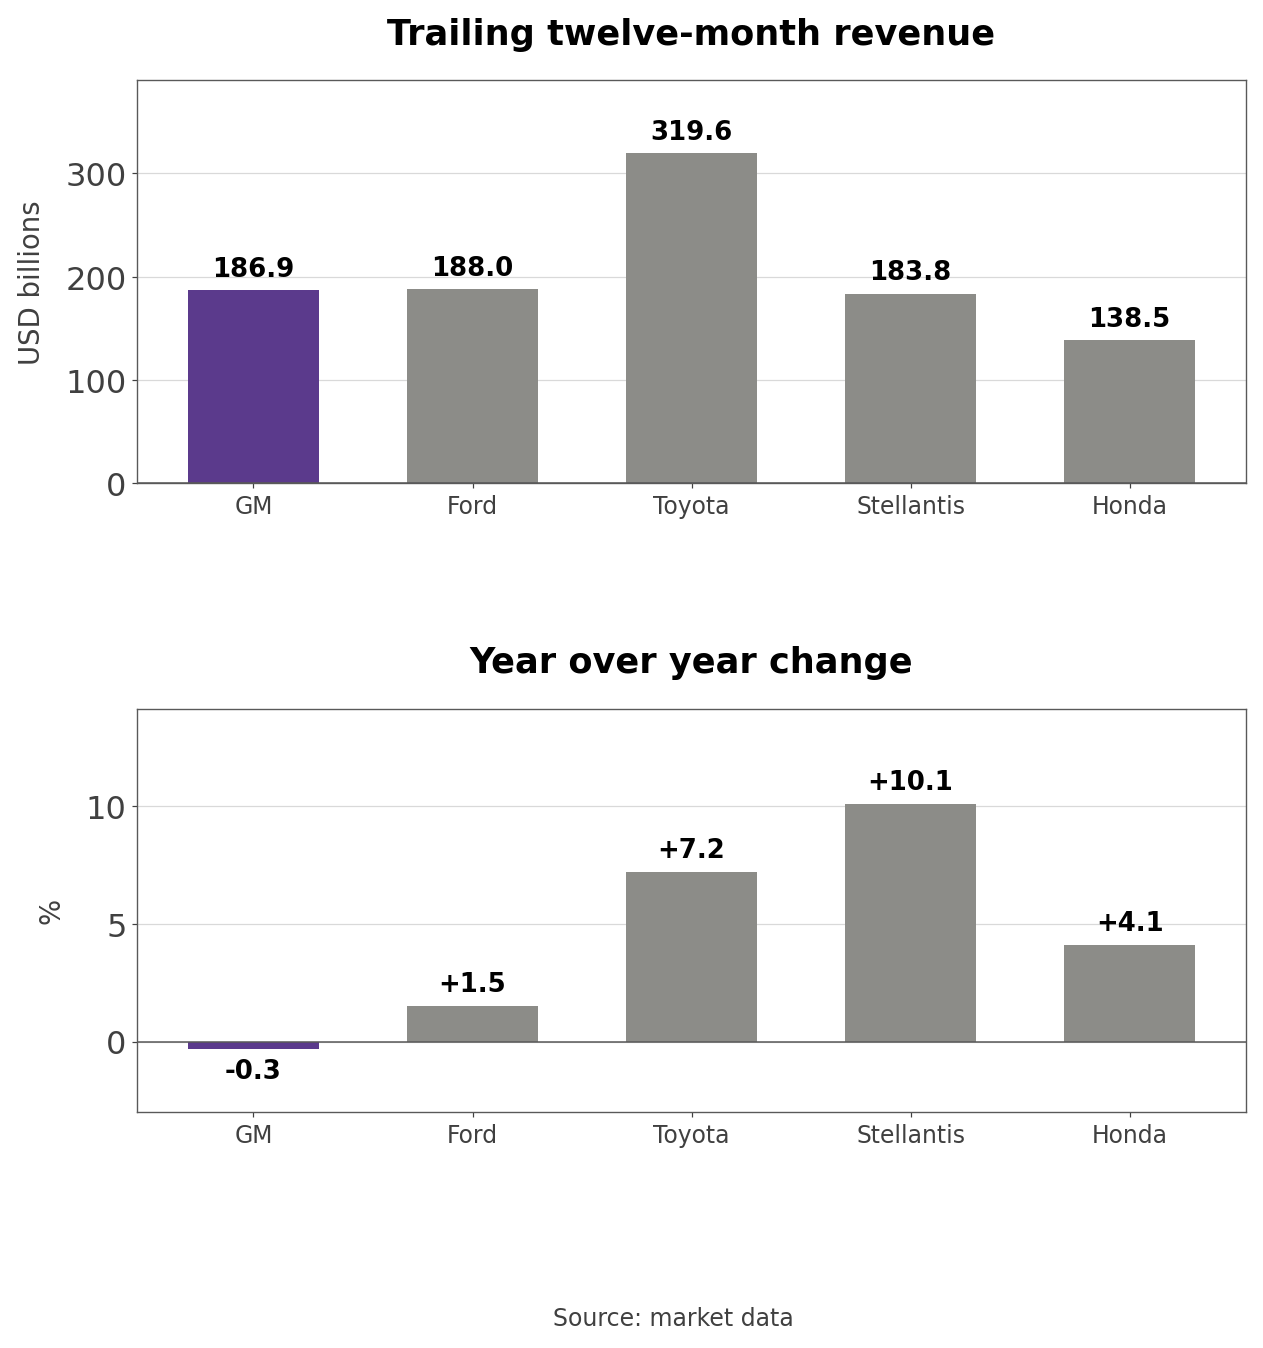
- Ford competes head-on in U.S. pickups with the F-Series and also owns a captive lender, yet with $1 billion more revenue than GM it is worth 72.2% of GM's market value. Toyota and Honda lean on hybrids, and Stellantis overlaps in North America through Ram and Jeep. Because captive finance distorts consolidated free cash flow, this comparison uses forward P/E and price to book.
- Forward P/E is 14.38 at Toyota, 10.91 at Honda, 6.62 at Ford, 5.42 at GM, and 4.04 at Stellantis. Price to book is 1.33 at Ford, 1.04 at GM, 0.99 at Toyota, 0.57 at Honda, and 0.16 at Stellantis. Over the past year Honda shares gained 12.0% and GM 9.9%, while Ford fell 11.7% and Stellantis -60.0%.
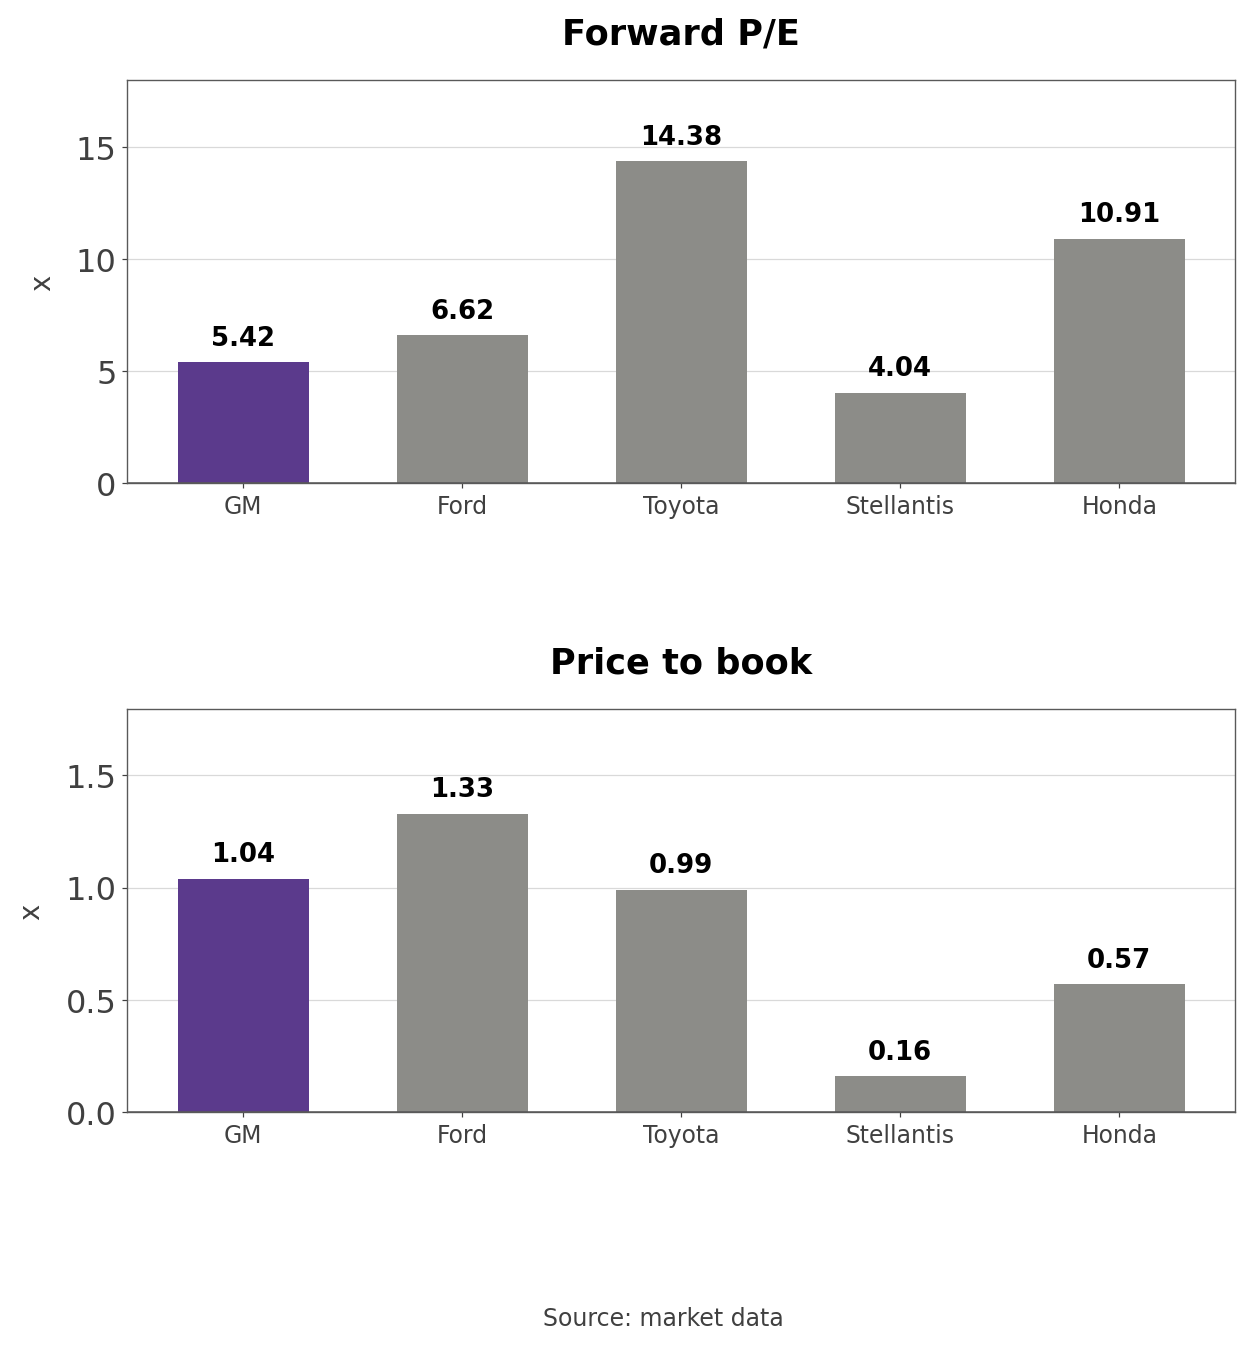
- Own calculation (relative multiples): GM's forward P/E is 0.38 times Toyota's, yet its price to book is 1.05 times Toyota's. Among the five, GM is the second cheapest on earnings and the second most expensive on book value.
P/E on Adjusted EPS Over 38 Months
- On trailing adjusted EPS of $13.48, GM trades at 5.63 times, the 63rd percentile of the 38 months since September 2023, against a median of 5.47. The low was 3.31 in October 2023 and the high 7.91 in January 2026. On book value of $74.45 a share, price to book is 1.02, the 71st percentile, against a median of 0.79.
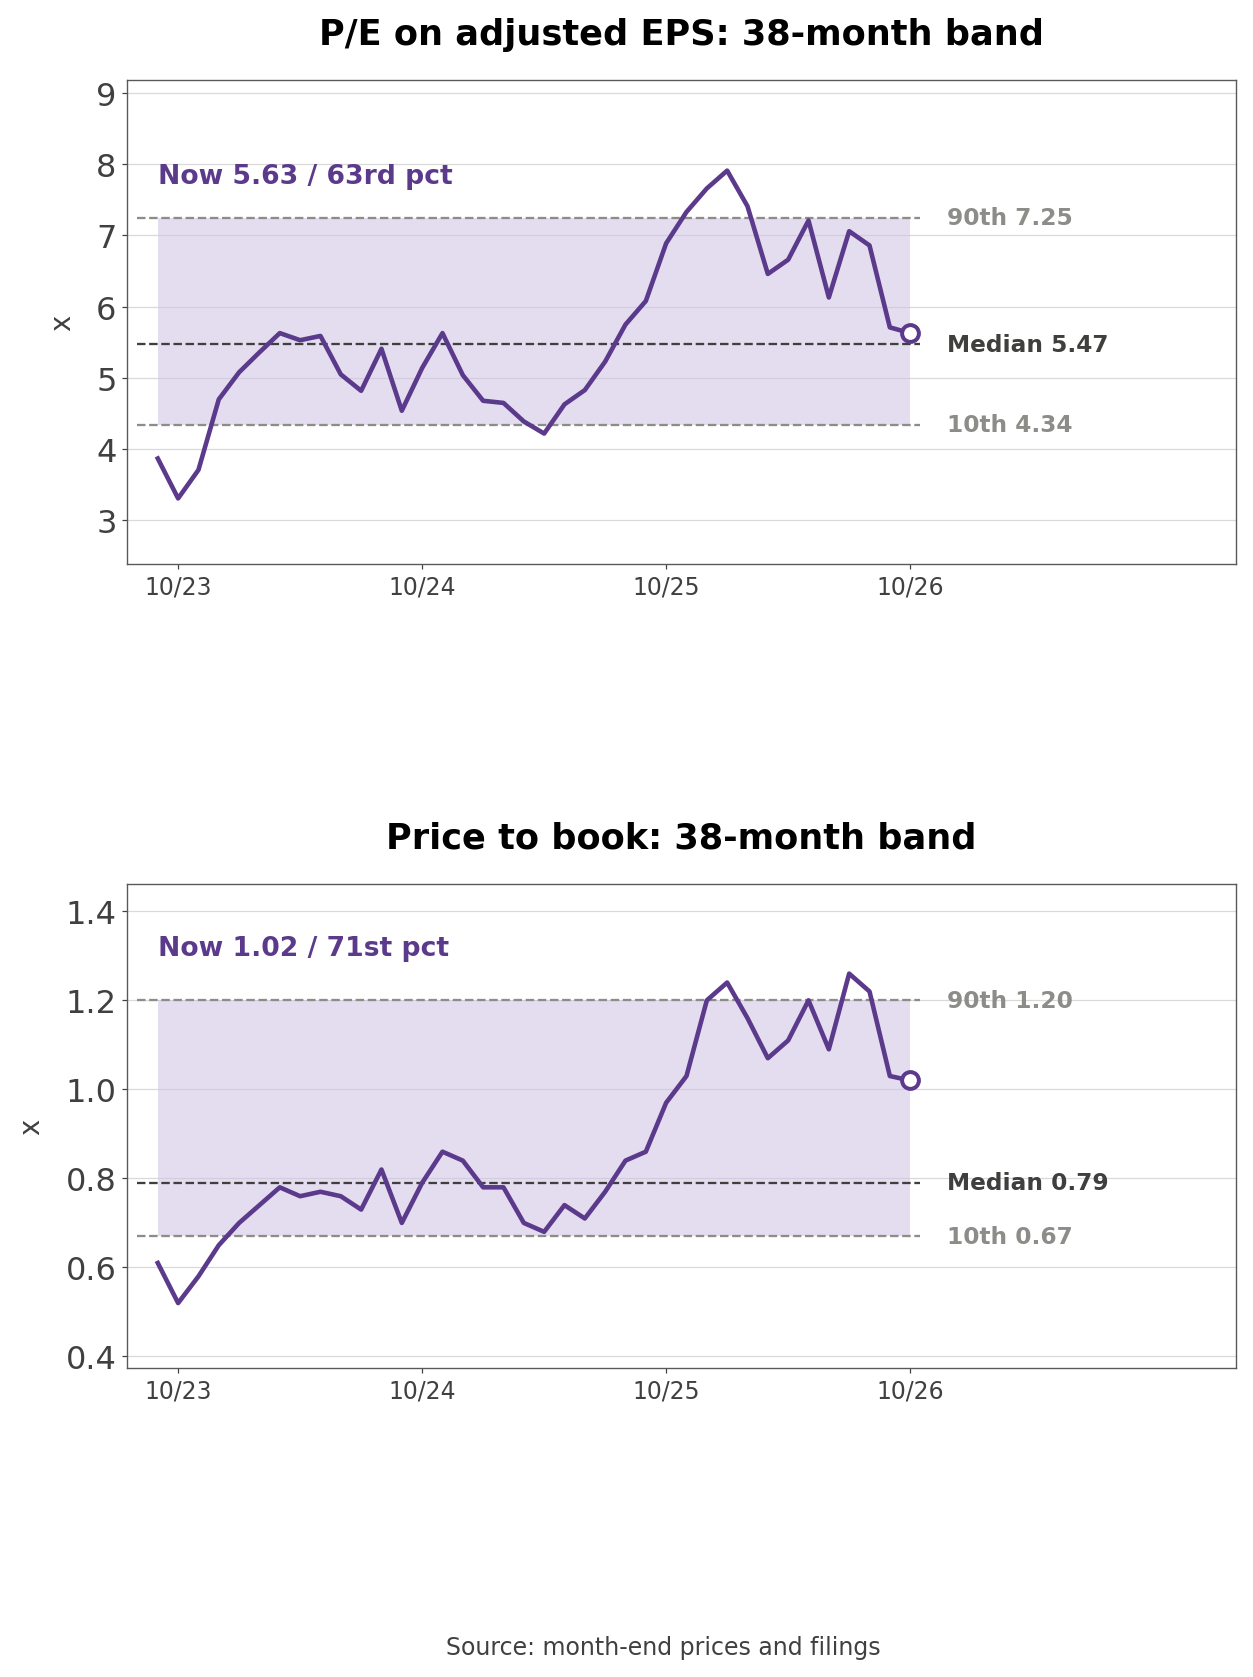
- At the $13.25 midpoint of 2026 guidance the multiple is 5.73, and on the 2027 consensus EPS of $15.11 it is 5.02. The quarterly dividend of $0.18 yields 0.95%. Price to book rose from 0.52 in October 2023 to a peak of 1.26 in July 2026 before settling at 1.02.
Three Conditions That Move the Stock
- The gap between adjusted free cash flow and free cash flow before add-backs was $4.29 billion over nine months. If GM pays the remaining roughly $1.8 billion of EV cash in 2027 and the gap still narrows back toward 2025's $1.1 billion, with pre-add-back free cash flow covering buybacks, the $20 billion authorization has a funding source; if the gap persists, buybacks run ahead of cash.
- North American EBIT-adjusted margin was 8.7% in the third quarter. Holding 8% to 10% in the first half of 2027, as the new Silverado and Sierra ramp without this year's warranty step-down and tariff refunds, would show a higher earnings floor; slipping below 8% under commodity, DRAM, and onshoring costs would make the low end of the implied fourth-quarter range the better guide.
- GM Financial's retail delinquency rate was 3.7%, half a point higher than a year earlier. A move above 4% with rising provisions would pressure the $2.5 billion to $3.0 billion EBT guidance and the dividend to GM; stabilizing in the mid-3% range would keep captive lending supporting North American sales.
The 2027 Outlook and the New Pickup Launch
- The numbers to watch in the fourth-quarter report are 2027 EBIT-adjusted and adjusted free cash flow guidance, actual fourth-quarter free cash flow, GM Financial delinquencies, and the pace of new pickup deliveries after Fort Wayne restarts in January. GM has not announced the report date; in recent years it came in late January.
- One question this piece cannot settle: once EV payments fall to around $1.8 billion in 2027, will North American profit without tariff refunds and this year's warranty gains leave enough cash after capital spending to keep pace with a $20 billion buyback authorization?
Related Analysis
- Tesla (TSLA) Stock: 62% of Q3 Operating Income Was a Refund: the EV leader GM is retreating from, and another automaker whose third-quarter profit leaned on tariff refunds.
- Raytheon (RTX) Stock: EPS Growth Is 18% Without the Refund: an industrial whose IEEPA refund flattered EPS growth, a frame for how much of GM's margin gain repeats.
- Booking Holdings (BKNG) Stock: Buybacks Beyond Cash Flow: a company returning more than its free cash flow, useful for judging GM's buybacks at 67% of pre-add-back cash.
#GeneralMotors #GMStock #AutoStocks #Pickups #ShareBuybacks #EVs #USStocks #StockAnalysis #EquityResearch #GlobalStockBrief
'US Stock Analysis' 카테고리의 다른 글
| Intuitive Surgical (ISRG) Stock: The 3% to 5% Instrument Cut (0) | 2026.10.25 |
|---|---|
| Netflix (NFLX) Stock: A $2.8B Warner Fee and Record Buybacks (0) | 2026.10.25 |
| SpaceX (SPCX) Stock: One Customer and a 90-Day Exit Clause (0) | 2026.10.24 |
| IBM (IBM) Stock: Organic Software Growth Is Just Over 4% (0) | 2026.10.24 |
| GE Aerospace (GE) Stock: Allowances Behind the Cash Flow (0) | 2026.10.24 |


