- Booking Holdings Inc. (NASDAQ: BKNG) grew second-quarter 2026 revenue +8.1% to $7.35 billion and adjusted EPS +15% to $2.54, which is exactly the shape of its own long-term algorithm. About 41% of that EPS gain came from a smaller share count, and from 2022 through 2025 the company returned 107.3% of its free cash flow to shareholders. The shares are down -23.7% this year, and the open question is how long buybacks can carry the gap now that third-quarter revenue guidance sits at 4% to 6%.
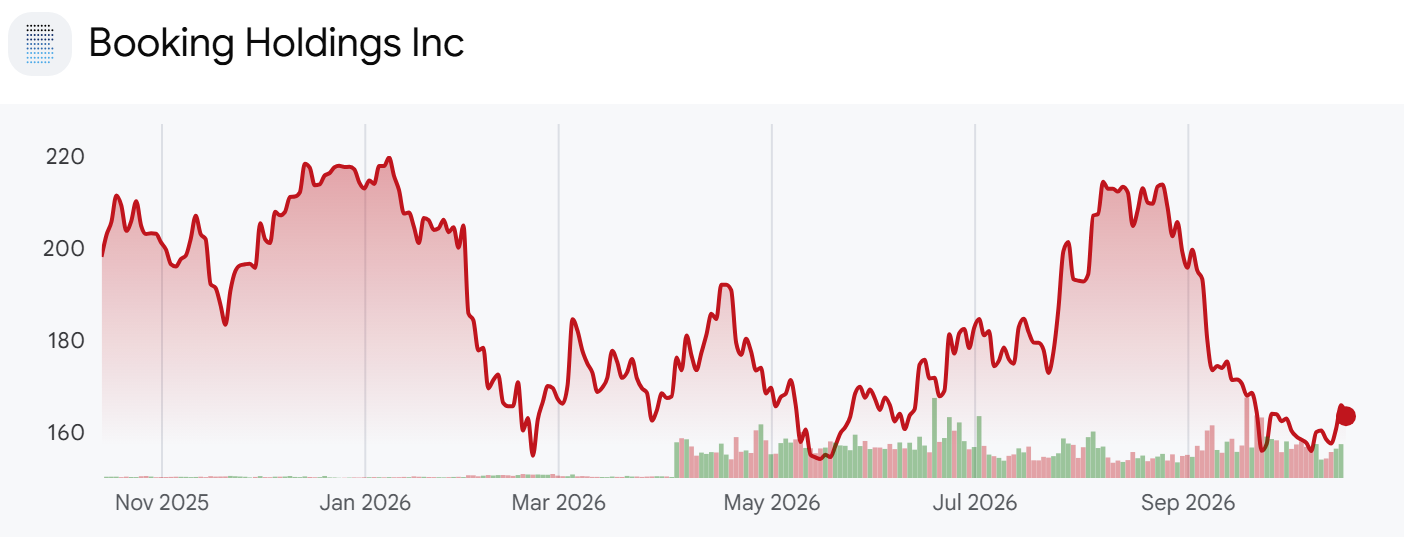
- Booking owns Booking.com, Priceline, Agoda, KAYAK, and OpenTable, and it is the largest online travel company by revenue. About 90% of second-quarter revenue came from accommodation reservations. Nothing in its filings explains the -18.0% drop in September, so this piece sticks to what the company reported and what its own slides claim.
Booking Holdings Long-Term Growth Algorithm
- Page 6 of the August 2026 investor presentation fits the company's long-term targets on one slide. Three numbers sit in the circle at the center.
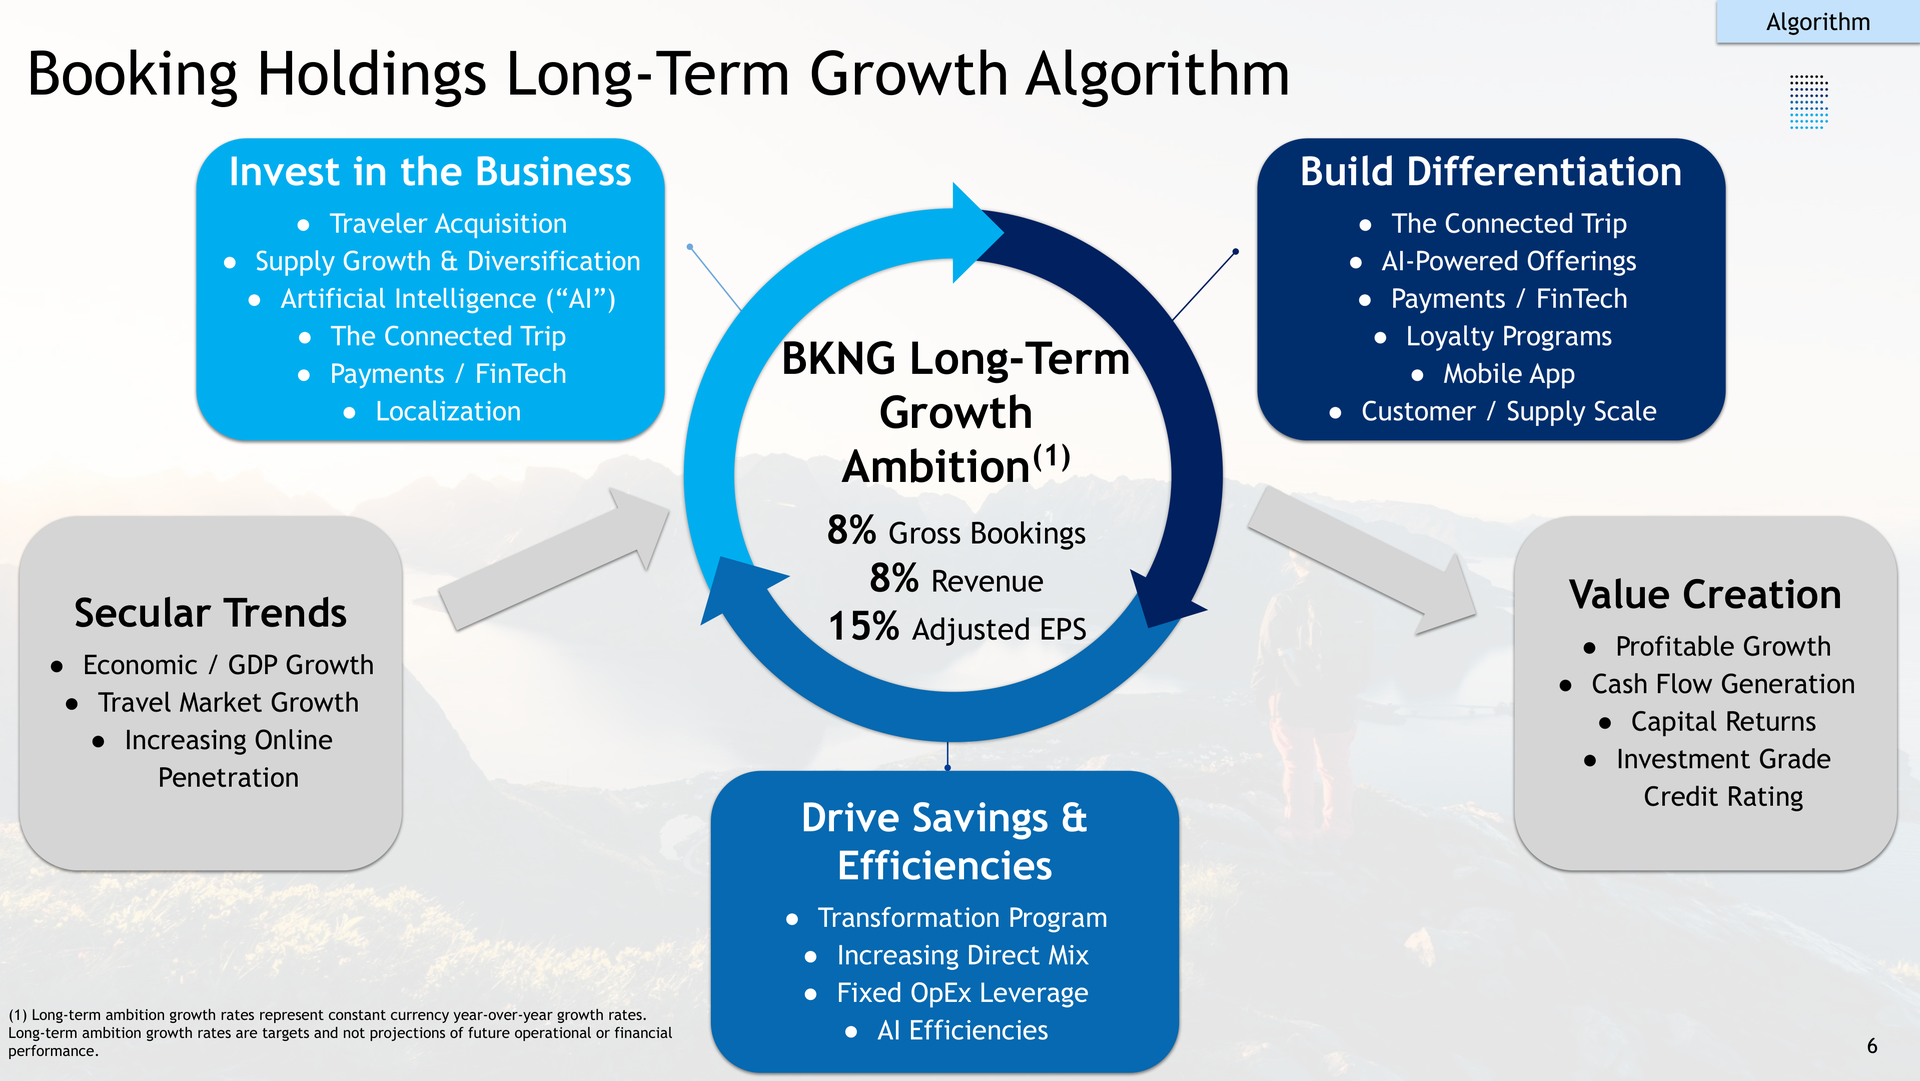
- Company disclosure (August 2026 investor presentation, page 6): The long-term growth ambition is 8% gross bookings growth, 8% revenue growth, and 15% adjusted EPS growth, in constant currency. In the company's words, "Long-term ambition growth rates are targets and not projections of future operational or financial performance."
- Turning 8% revenue growth into 15% EPS growth requires seven points from somewhere. The slide names two sources. The box at the bottom lists savings and efficiencies, led by the Transformation Program, whose expected annual run-rate savings the company raised in the second quarter from about $550 million to about $650 million, to be reached by the end of 2027. The box on the right lists capital returns.
- The upper-left box is a list of where the savings get reinvested: traveler acquisition, supply diversification, artificial intelligence, payments, and localization. Savings and reinvestment are designed to offset each other, which leaves capital returns as the one lever that can deliver the seven points every year.
- Page 5 of the same deck argues that the formula has held for a decade: a 12% compound annual growth rate in revenue and 16% in adjusted EPS. In 2025 revenue grew 13% and adjusted EBITDA grew 20%, so last year ran ahead of the algorithm.
- The 10-K cash flow statements show the same mechanism behind that decade. Share repurchases were $5.97 billion in 2018, 122.0% of that year's free cash flow, and $8.19 billion in 2019, 182.1% of free cash flow. The algorithm is a written version of how the company has operated for years.
- The 2026 outlook runs slightly behind it: high-single-digit revenue growth and low-to-mid-teens adjusted EPS growth. The second quarter matched the algorithm, and the prepared remarks spell out how: "Adjusted EPS of $2.54 per share increased 15% year over year, faster than adjusted EBITDA growth, helped by a 6% reduction in average share count."
- Own calculation (Q2 2026 earnings release reconciliation): Adjusted net income rose 8.4%, from $1.807 billion to $1.958 billion, while diluted weighted shares fell 5.5%, from 815 million to 770 million. Together they produce +14.7% in adjusted EPS, and the share count accounts for 41% of that gain.
- Share figures for 2025 are restated for the 25-for-1 stock split that took effect on April 2, 2026.
A Record $4.1 Billion Quarter of Capital Return
- Page 12 of the second-quarter earnings presentation puts quarterly free cash flow on the left and quarterly capital return on the right.
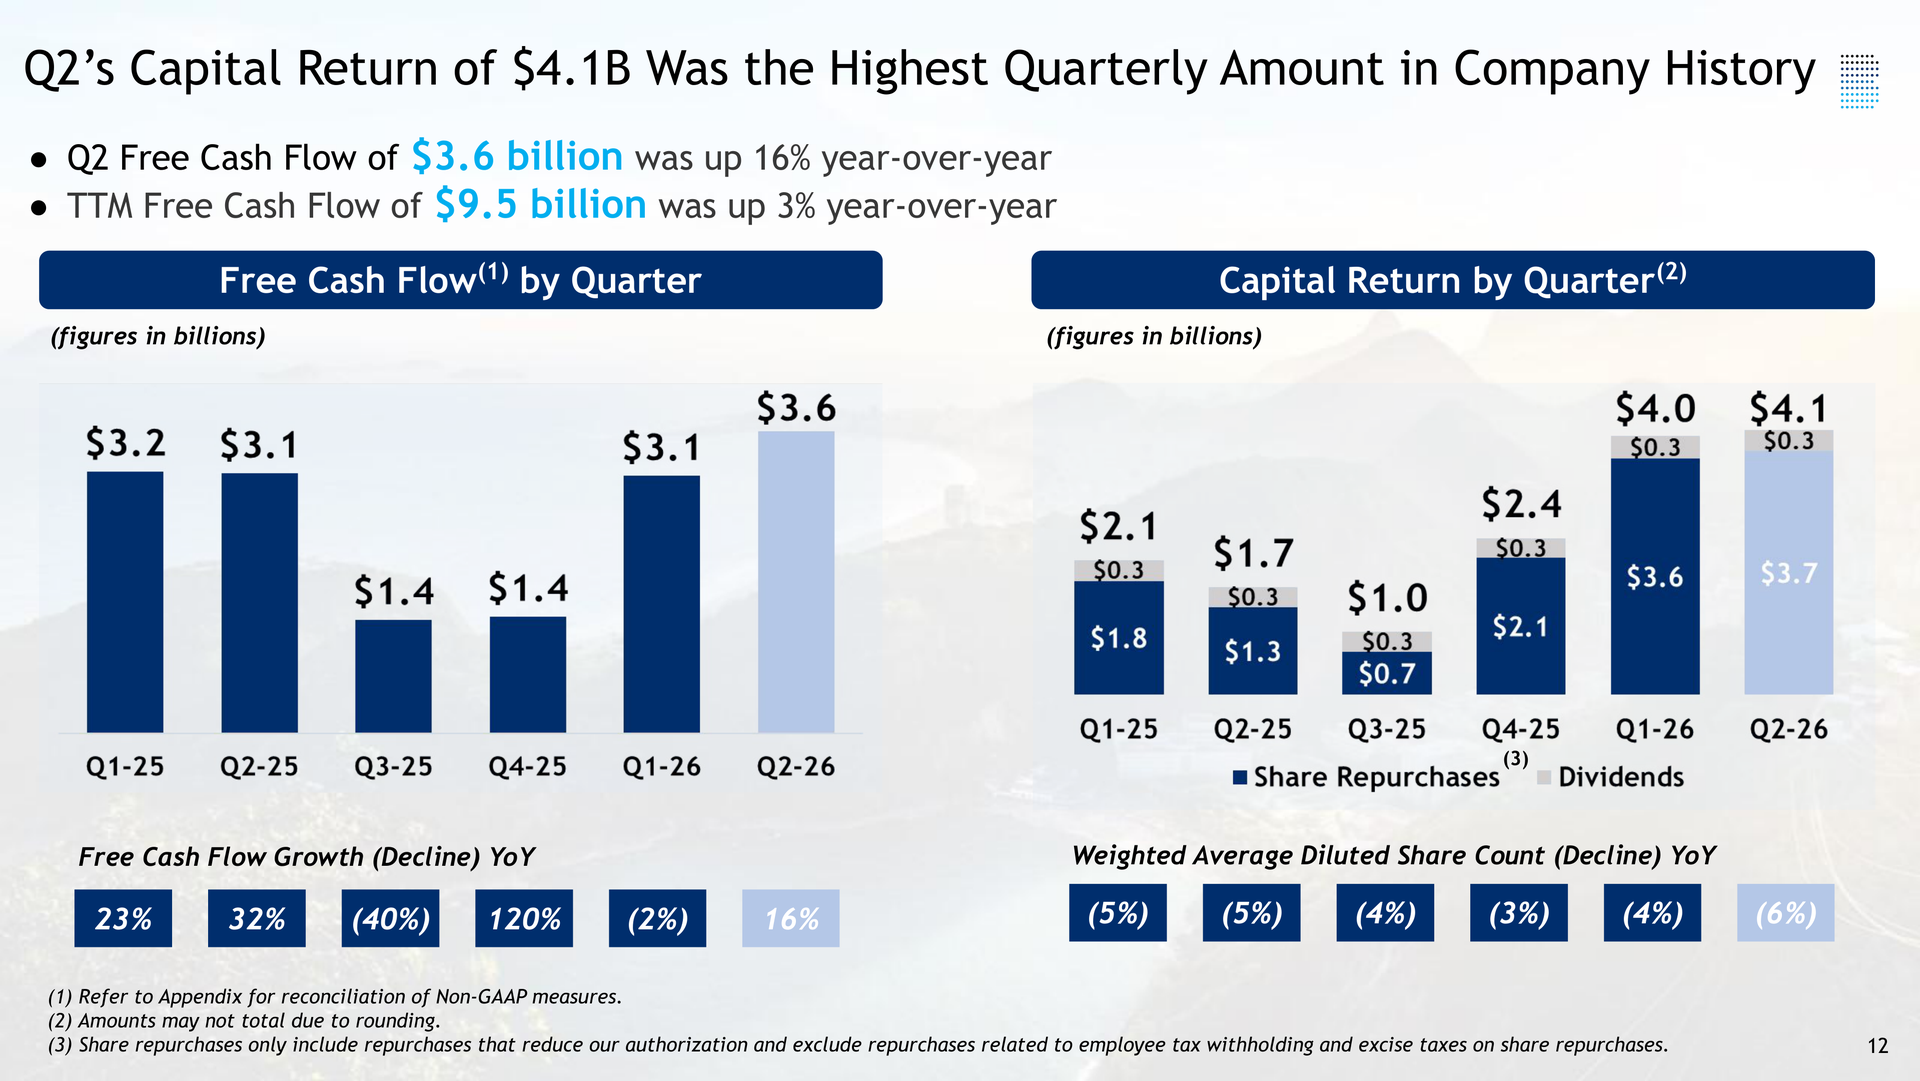
- The slide title calls the second quarter's $4.1 billion of capital return "the Highest Quarterly Amount in Company History." Just below, the company notes that trailing twelve-month free cash flow was $9.5 billion, up +3%.
- The bars show a seasonal company. Free cash flow comes in at $3.1 billion to $3.6 billion in the first and second quarters and drops to $1.4 billion in the third and fourth. Capital return went from $2.1 billion in the first quarter of 2025 to $4.0 billion and $4.1 billion in the first two quarters of 2026.
- The growth rates under the bars show the shift. Free cash flow in the third quarter of 2025 was -40% year over year, and capital return that quarter was $1.0 billion, the smallest of the six quarters shown. In the first quarter of 2026 free cash flow was $3.1 billion, -2% year over year, yet capital return reached $4.0 billion.
- The prepared remarks add the funding detail: the company generated $3.6 billion of free cash flow in the quarter, "raised $3.0 billion of debt, paid down $1.0 billion of debt, and returned $4.1 billion to shareholders." They also state: "During the first half of 2026, we repurchased $7.4 billion of our common stock at an average price of approximately $173 per share." The shares now trade at $163.45, below that average.
- The Q2 2026 10-Q cash flow statement covers the whole half. Free cash flow was $6.751 billion. Buybacks took $7.758 billion and dividends $664 million. The $1.671 billion shortfall was covered by $1.975 billion of net new borrowing.
How Much of EPS Growth Comes From Buybacks?
- The market case for Booking has been simple: accommodation demand grows in the high single digits, and the company spends most of what it earns on its own stock, which lifts EPS into the double digits.
- The filings confirm the second half of that case. Diluted share count has been 3% to 6% lower year over year in each of the last six quarters, and that decline produced 41% of second-quarter adjusted EPS growth.
- The first half is softening. Third-quarter guidance calls for room night growth of 3% to 5% and revenue growth of 4% to 6%, both below the second quarter. If revenue growth settles there instead of at 8%, more of the 15% EPS target falls on buybacks.
From Priceline to a Merchant Platform
- Booking used to be The Priceline Group. The auditor's report in the 2017 annual report, filed in February 2018, refers to "Booking Holdings Inc. (formerly known as The Priceline Group Inc.)". The bigger change since then is in how the company collects money.
- Under the agency model a traveler pays the property, and the property sends Booking a commission after the stay. Under the merchant model the traveler pays Booking at the time of booking, and Booking holds that cash until it pays the property.
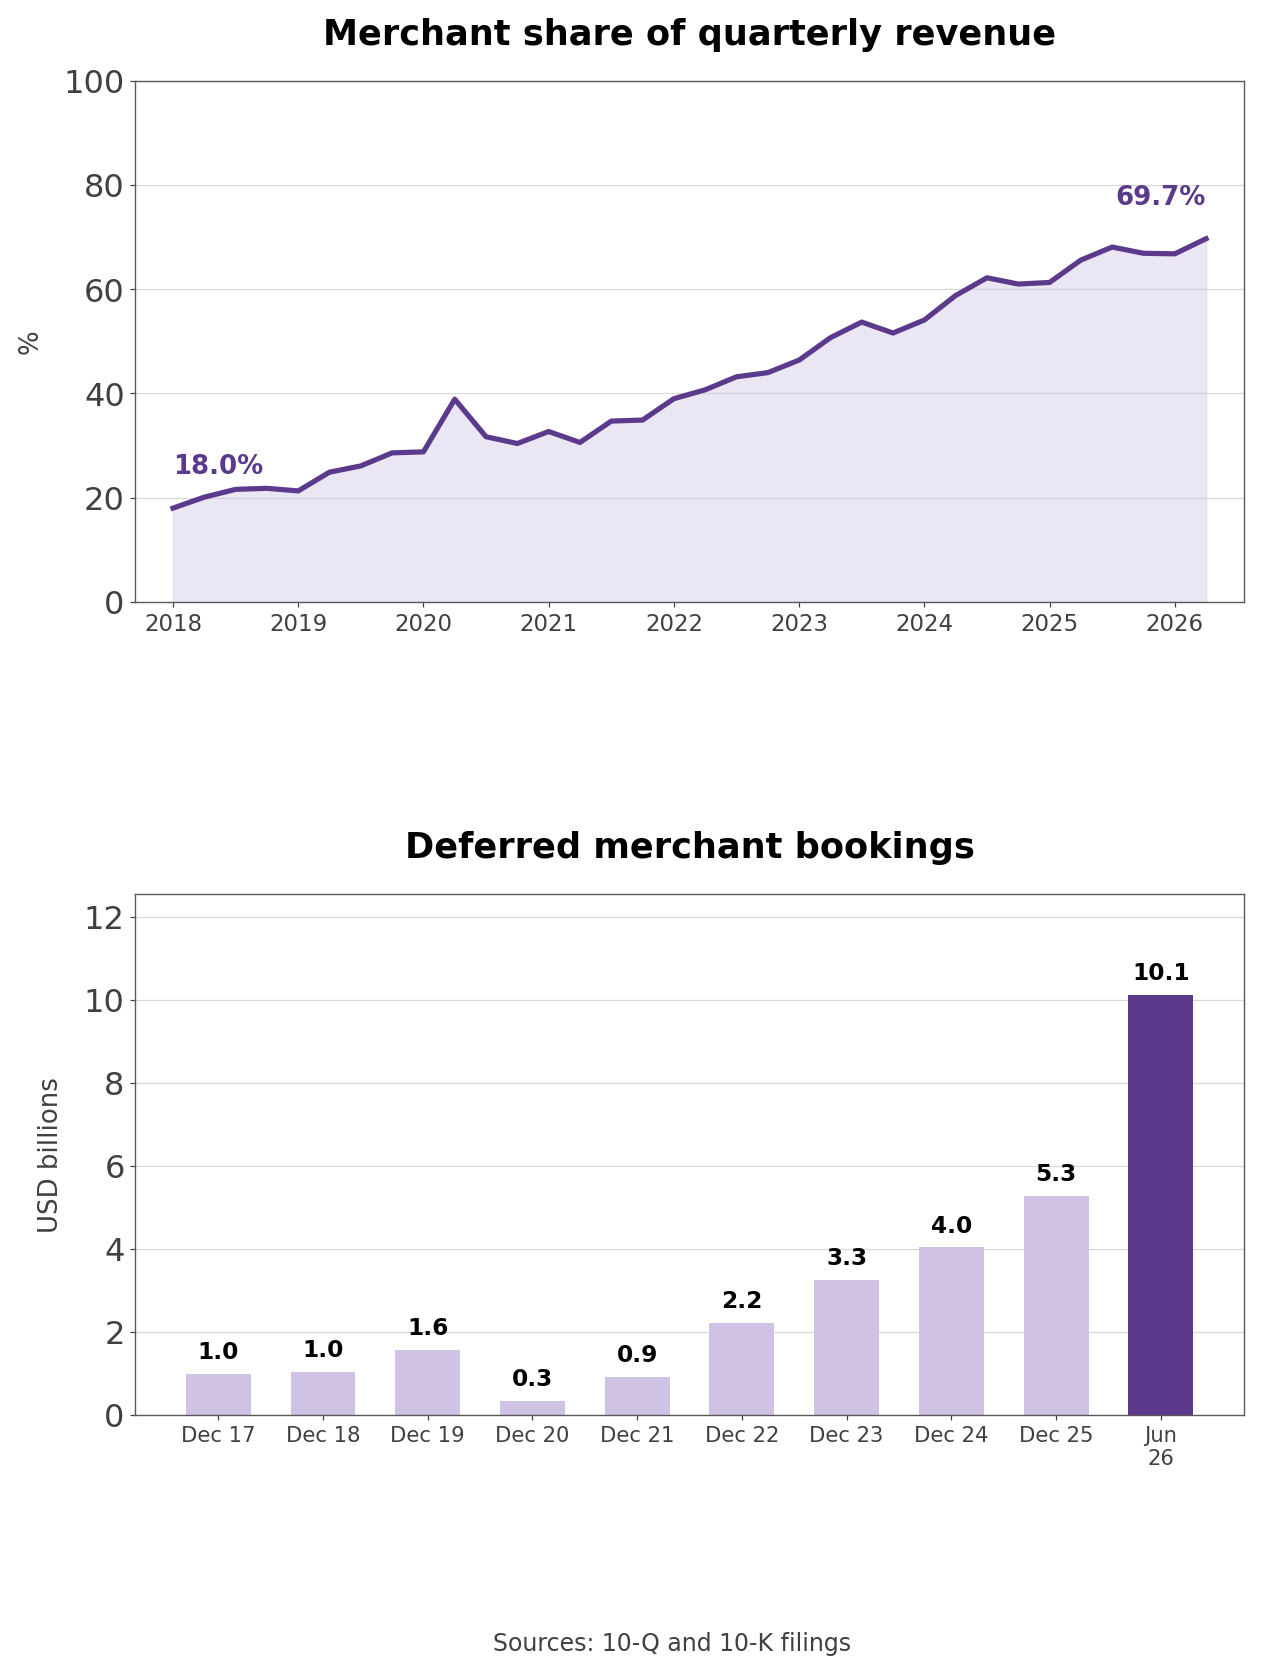
- I rebuilt quarterly revenue by type from 35 10-Q and 10-K filings. Merchant revenue went from 18.0% of revenue in the first quarter of 2018 to 69.7% in the second quarter of 2026. On an annual basis the share was 20.6% in 2018, 42.1% in 2022, and 66.0% in 2025. In the second quarter merchant revenue grew +15.0% while agency revenue fell -6.9%.
- The shift shows up on the balance sheet as deferred merchant bookings.
- Filing footnote (Q2 2026 10-Q, note 2): "Cash payments received from travelers in advance of the Company completing its performance obligations are included in 'Deferred merchant bookings' … The amounts are mostly subject to refunds for cancellations."
- The year-end balance grew 5.4 times, from $980 million in 2017 to $5.27 billion in 2025, while revenue grew 2.1 times. The June 30 balance was $10.12 billion, higher than any year-end because summer bookings peak at that point.
- The flow has also run the other way. In 2020 revenue fell -54.9% to $6.80 billion, the year-end balance dropped from $1.56 billion to $323 million, and the cash flow line for deferred merchant bookings and other current liabilities was negative $2.27 billion. Operating cash flow for the year was $85 million.
Ten Years of BKNG Stock in Four Moments
- On a split-adjusted basis the shares started 2016 around $44 and reached a ten-year high near $226 in August 2025. At $163.45 they are -27.8% below that high.
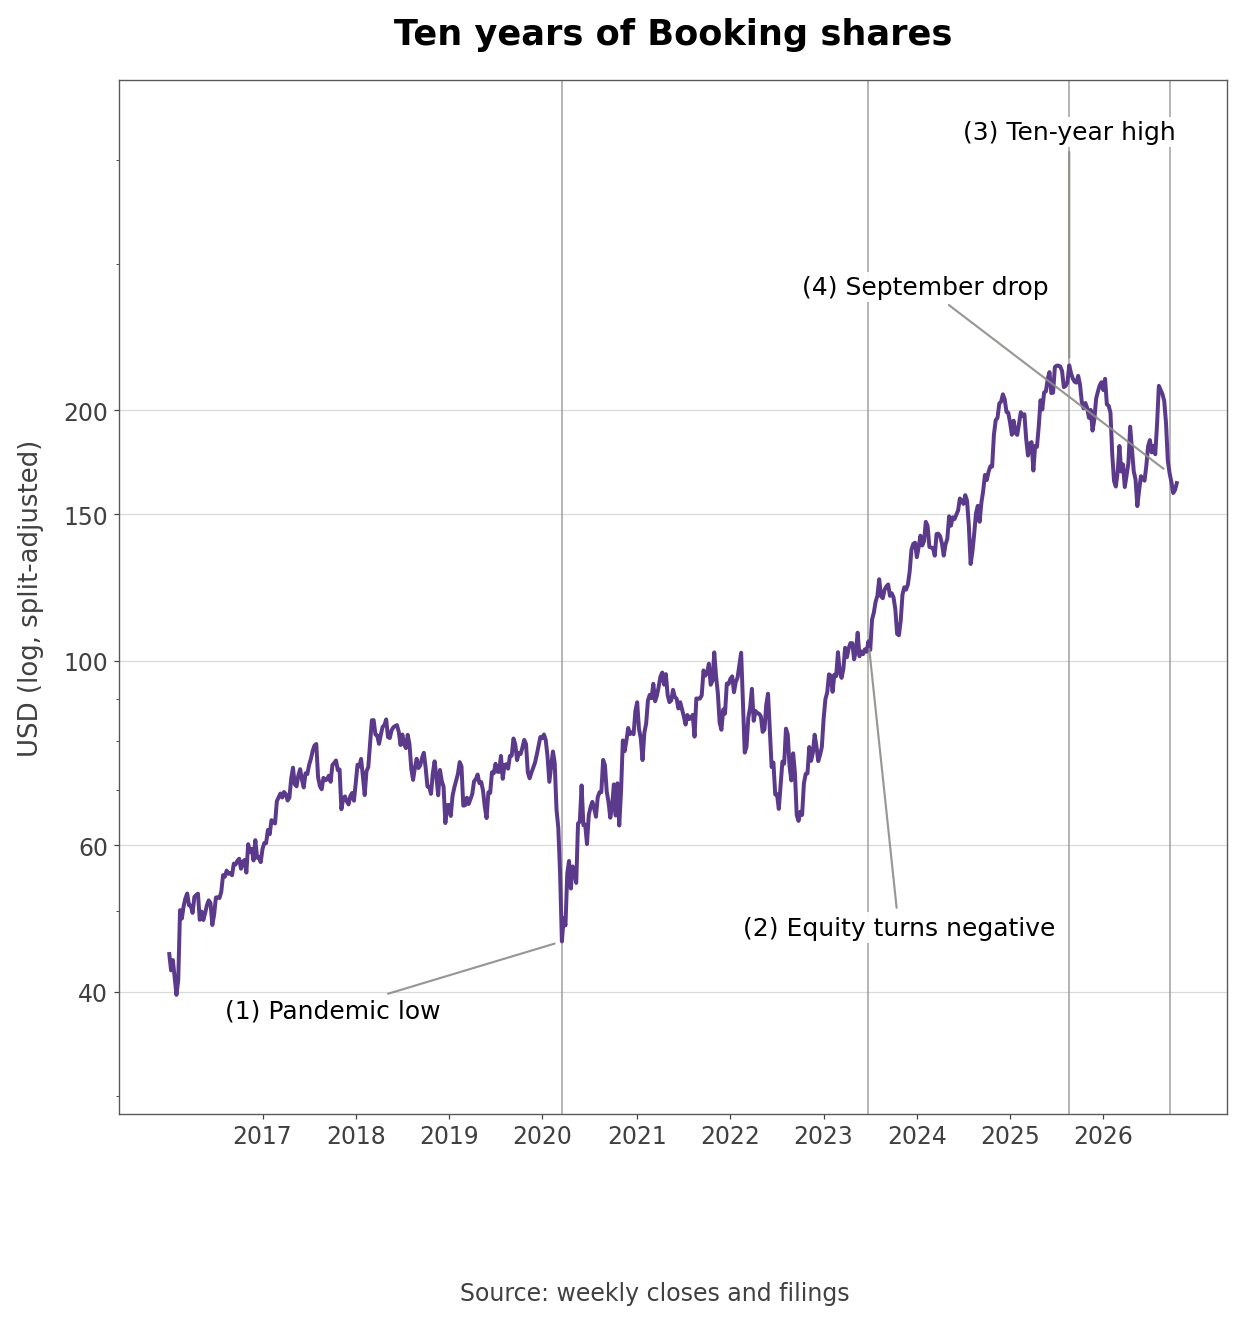
- The first marker is the March 2020 pandemic low. The company sold $862.5 million of convertible senior notes on April 14, 2020 and announced restructuring at Booking.com that August. The second marker is June 2023, the first quarter-end with negative shareholders' equity. The shares more than doubled over the next two years.
- The third marker is the August 2025 high and the fourth is this September's drop. In September Booking fell -18.0%, Expedia -16.9%, Airbnb -12.3%, and Trip.com -12.4%. Booking filed no 8-K after the August 4 earnings release, so there was no new company number behind the move.
- October split the group. Expedia rose +9.7% and Airbnb +8.1% while Booking gained +0.3%.
Where the Money for Buybacks Came From
- Returning more than the company earns requires other sources of cash. Four years of 10-K cash flow statements identify them.
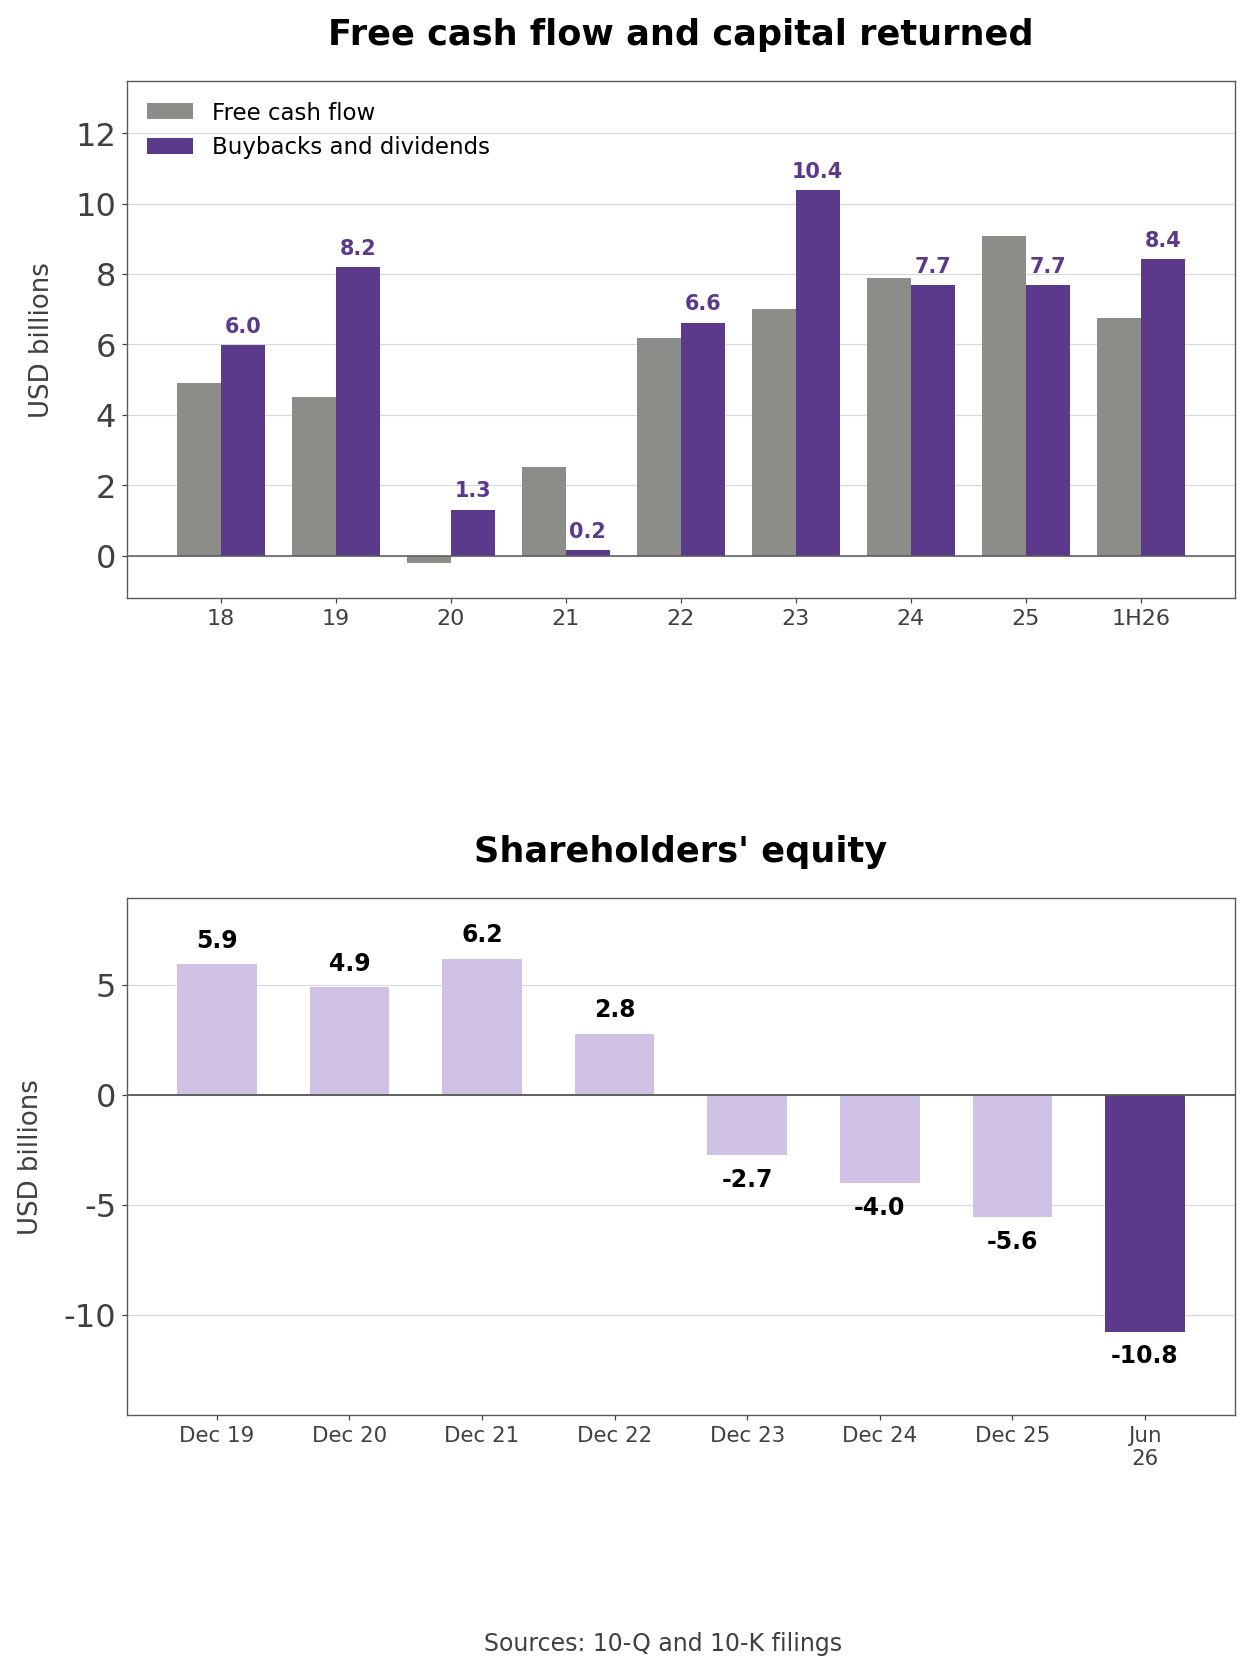
- Own calculation (10-K cash flow statements, 2022 to 2025): Buybacks and dividends totaled $32.369 billion, 107.3% of the $30.166 billion of free cash flow over the same four years.
- The yearly pattern is uneven. In 2023 buybacks alone were $10.38 billion, 148.3% of free cash flow of $7.00 billion. In 2025 buybacks and dividends together were 84.6% of free cash flow of $9.09 billion. Dividends started only in 2024, at $1.17 billion that year and $1.25 billion in 2025, and the third-quarter dividend of $0.42 per share was 9.4% above the $0.38 paid a year earlier.
- Borrowing filled part of the gap. Over the same four years, new long-term debt exceeded repayments by $5.37 billion. Debt at June 30 was $20.18 billion, $2.0 billion short-term and $18.18 billion long-term. Page 32 of the August deck states the policy: "We expect to maintain around 2x gross leverage through the cycle." As adjusted EBITDA grows, the debt that fits under that ratio grows with it.
- Traveler prepayments filled another part. Over the four years, the increase in deferred merchant bookings and other current liabilities added $8.62 billion to operating cash flow. In the first half of 2026 the same line contributed $4.21 billion, or 60.7% of operating cash flow of $6.93 billion. Without it, first-half free cash flow would have been $2.54 billion.
- That cash belongs to properties once the stay is over. In 2025 the balance fell from $9.15 billion at June 30 to $6.28 billion at September 30, a $2.87 billion outflow in the same quarter that free cash flow dropped to $1.4 billion.
- Equity tells the cumulative story. Shareholders' equity was $6.18 billion at the end of 2021, turned negative in June 2023, and stood at -$10.78 billion at June 30. Treasury stock of $62.13 billion is 144.3% of the $43.05 billion in retained earnings the company has built up.
Why GAAP Net Income More Than Doubled
- GAAP net income was $1.95 billion in the second quarter, up +118%, and GAAP diluted EPS was $2.53, up +131%. The gap against the +15% adjusted figure comes from the year-ago quarter.
- Other income was negative $962 million in the second quarter of 2025 and positive $159 million this quarter. Booking carries euro-denominated debt, so a stronger euro raises the dollar value of that debt and the difference runs through earnings. In the first-half cash flow statement, unrealized foreign currency results on euro-denominated debt swung from a $1.398 billion loss a year ago to a $528 million gain.
- No cash changes hands on that line, and adjusted net income excludes it. Anyone reading Booking on GAAP P/E should expect it to move earnings from quarter to quarter.
How Booking Holdings Makes Money
- Second-quarter revenue of $7.35 billion has three lines: merchant revenues of $5.13 billion, agency revenues of $1.90 billion, and advertising and other revenues of $322 million.
- Merchant revenues come from bookings where Booking collects payment from the traveler. Room charges and fees flow through Booking, and the company records only its commission or margin as revenue. The 10-K says the majority of merchant revenue comes from Booking.com accommodation reservations. Because Booking processes the payment, it also carries the card fees and payment costs.
- Agency revenues come from bookings where the property collects payment and sends Booking a commission after the stay. There is no payment cost, but the cash arrives after the trip. Advertising and other revenues come mainly from KAYAK referrals and ad placements and from OpenTable reservation fees and restaurant management subscriptions.
- Timing differs between revenue and cost. The 10-K says the company would "generally recognize revenue from these bookings when the travel begins (at 'check-in')," that check-ins in Europe and North America peak in the third quarter, and that marketing expense is recognized in the quarter the bookings are made. In the first half the cost lands first, and the revenue follows in the third quarter. The company also traced slower second-quarter revenue growth to elevated cancellations in March.
- The five brands play different roles. The 10-K describes Booking.com as the world's leading brand for online accommodation reservations based on room nights, headquartered in Amsterdam. Priceline focuses on discount travel, primarily in North America. Agoda serves mainly the Asia-Pacific region from Singapore. KAYAK is a metasearch brand and OpenTable handles restaurant reservations. Across the group, travelers booked 1.2 billion room nights in 2025.
- Marketing is the largest cost line. It was $2.37 billion in the second quarter, 32% of revenue, and grew +10.8%, faster than revenue at +8.1%.
Direct Bookings and the Marketing Bill
- Booking.com had about 33 million reported listings at June 30, including 9.1 million alternative accommodation listings such as apartments and homes.
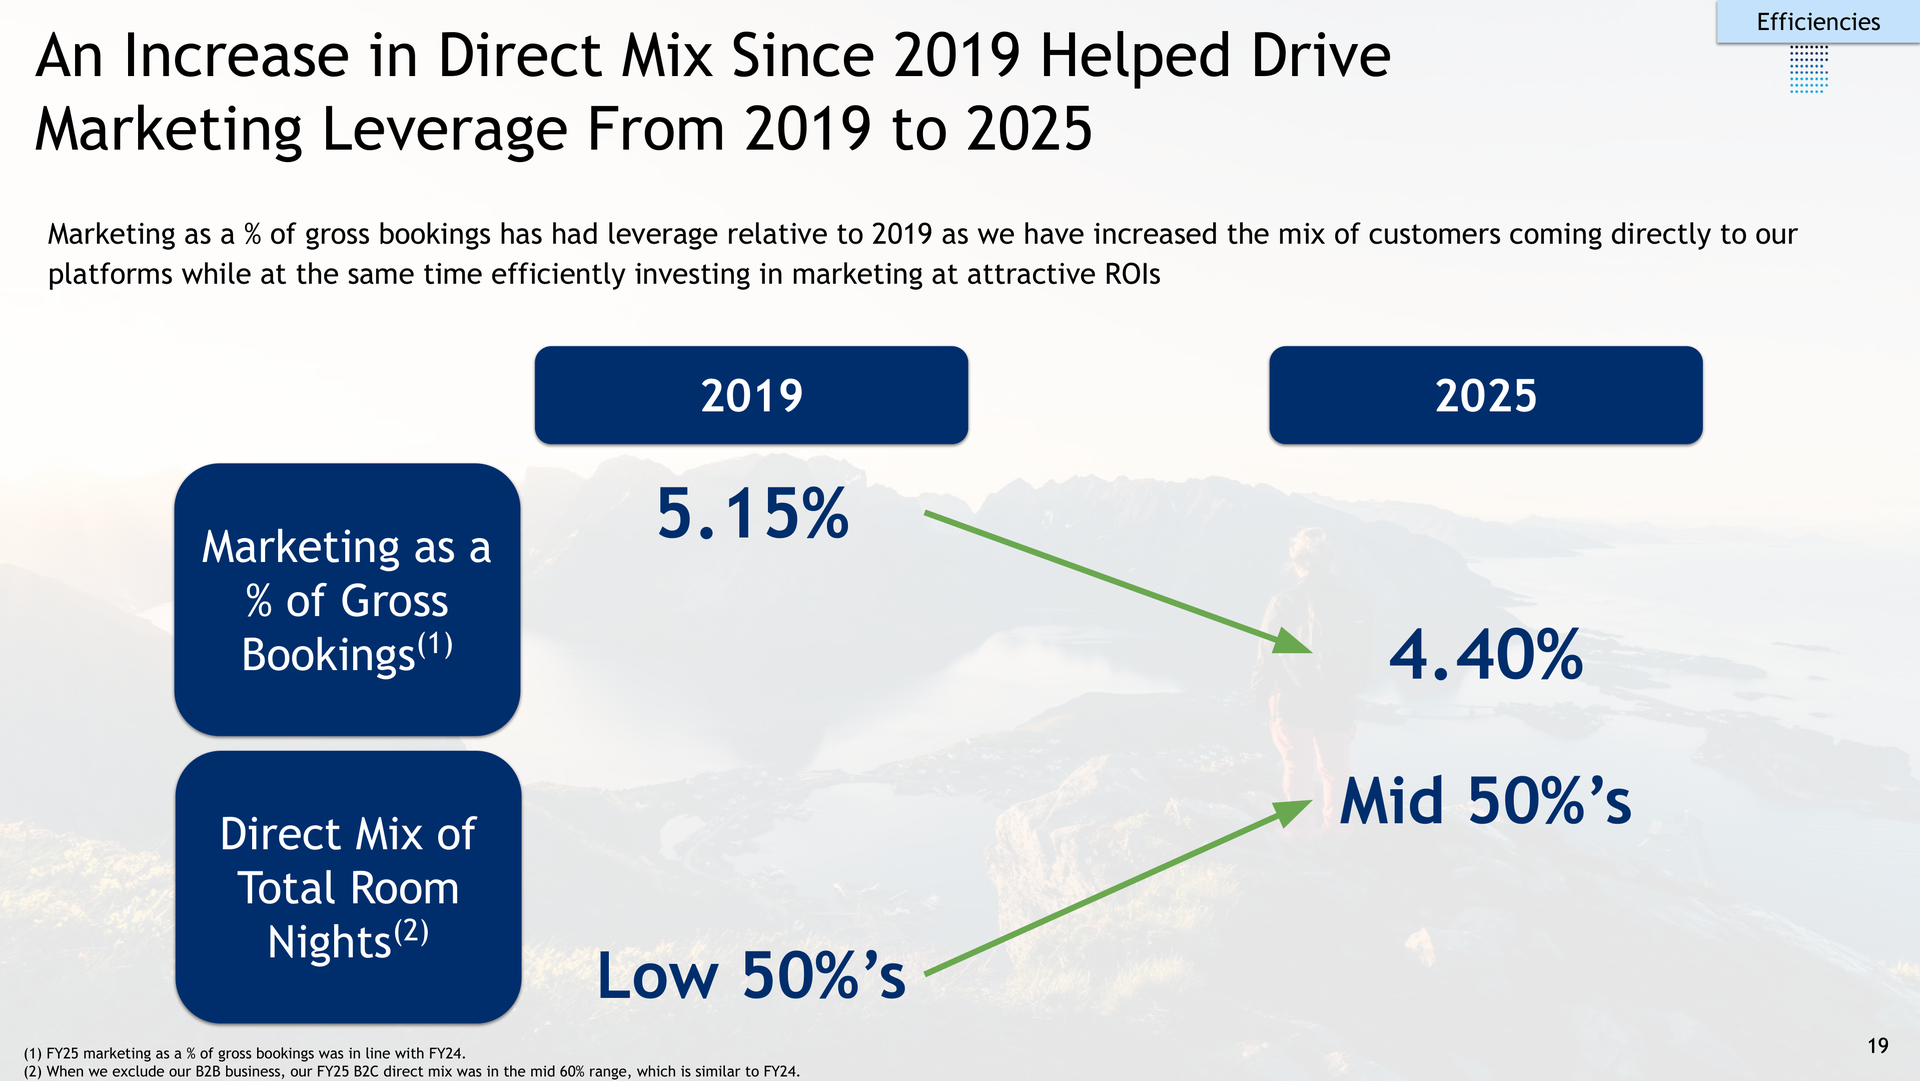
- Direct bookings are how the company holds down marketing. A traveler who arrives through the app or the website instead of a search ad carries no advertising cost.
- Company disclosure (August 2026 investor presentation, page 19): Marketing as a percentage of gross bookings fell from 5.15% in 2019 to 4.40% in 2025, while the direct mix of total room nights rose from the low 50% range to the mid 50% range. Excluding the B2B business, the 2025 B2C direct mix was in the mid 60% range.
- The second quarter did not continue that trend. Marketing was 4.7% of gross bookings against 4.6% a year earlier, and the trailing four-quarter direct mix stayed in the mid-fifties, similar to last year.
- The app and the Genius loyalty program drive the direct mix. The trailing four-quarter mobile app mix rose from the low 50% range in mid-2024 to the high 50% range in mid-2026, according to page 7 of the earnings presentation. Travelers in the two upper Genius loyalty tiers booked a share of Booking.com room nights in the high 50% range over the last four quarters.
- The connected trip points the same way. Connected transactions, which pair a stay with flights, cars, or attractions, grew in the high 20% range in 2025 and make up a low-double-digit share of Booking.com transactions.
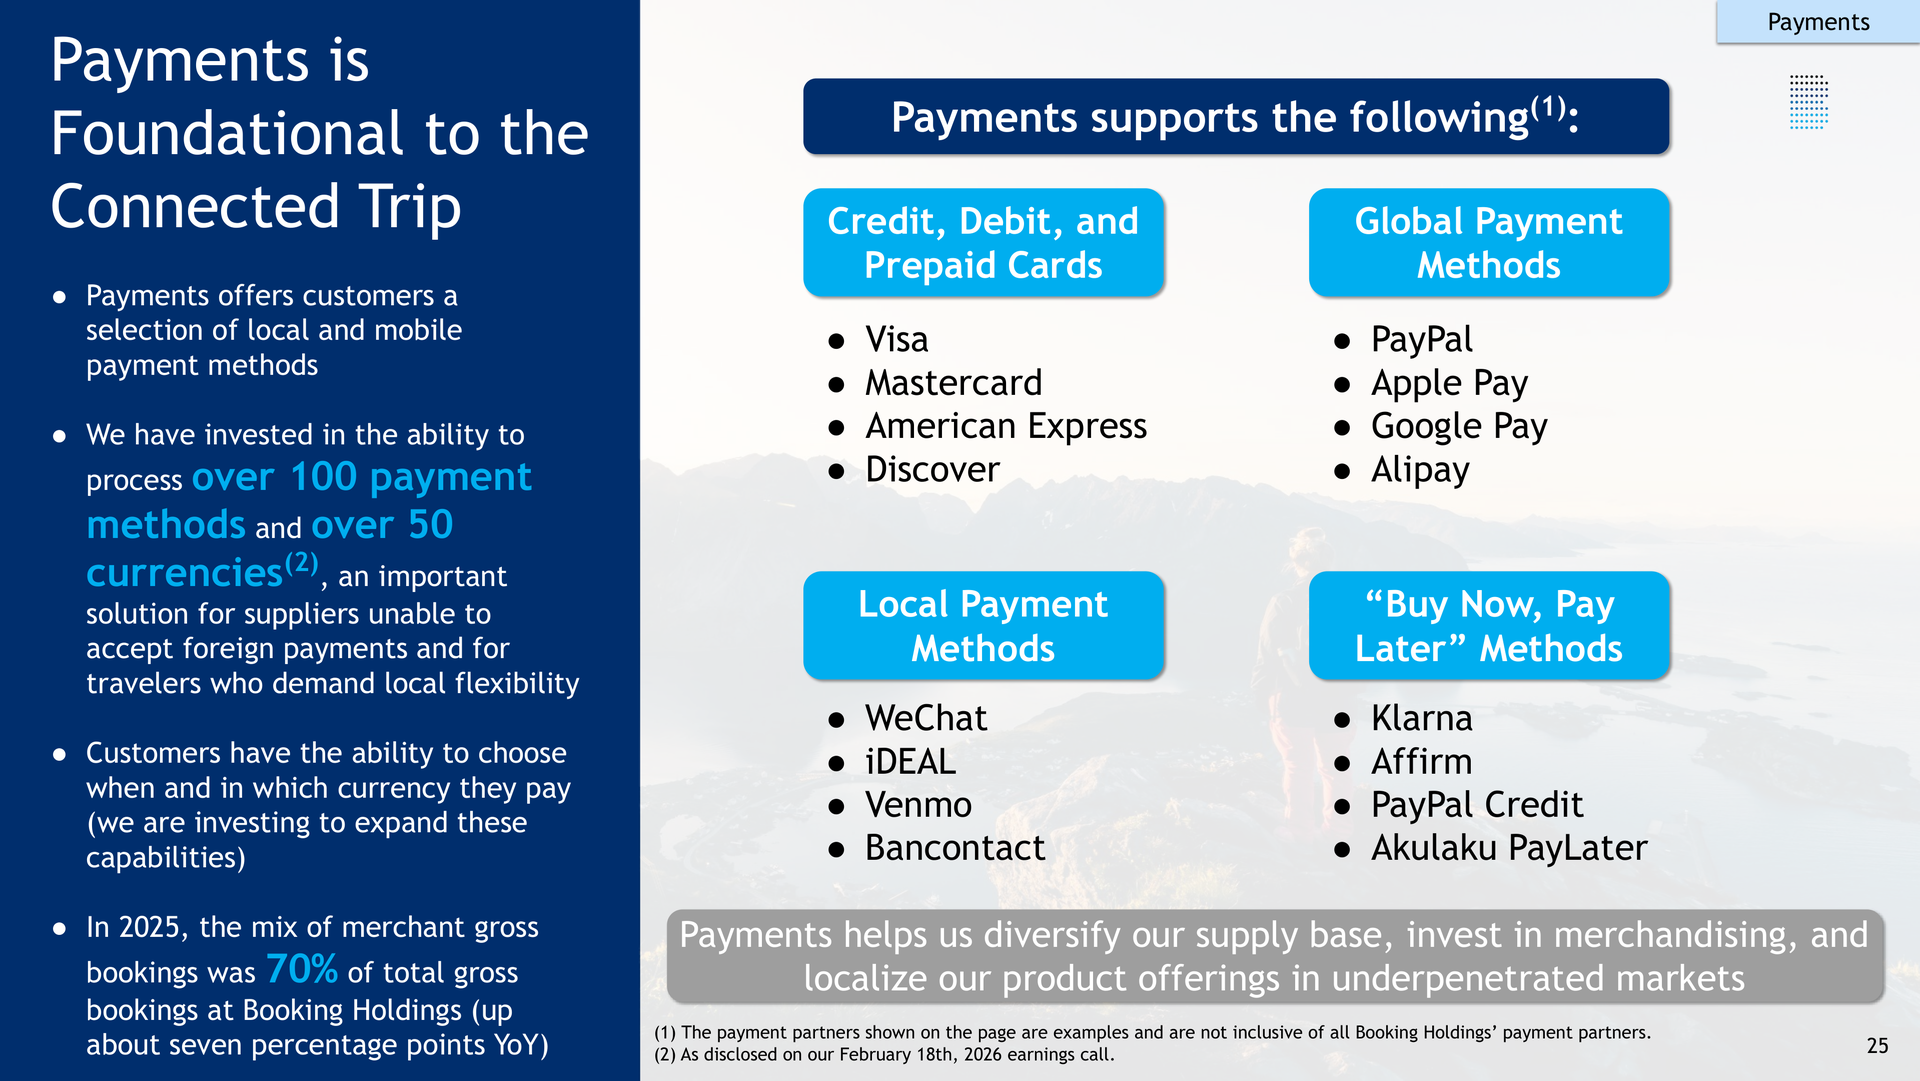
- Payments sit underneath all of it. Booking processes more than 100 payment methods and more than 50 currencies. Merchant gross bookings were 70% of the total in 2025, up about seven percentage points, and about 73% in the second quarter. More merchant volume raises payment costs, but the company said adjusted sales and other expenses were 1.9% of gross bookings and still provided leverage because customer service efficiencies outweighed higher payment expenses.
- The 10-K names "the largest global technology companies" as competitors and notes that they have "significantly more consumers, consumer data, and resources than we do."
How Booking Stacks Up Against Three Travel Peers
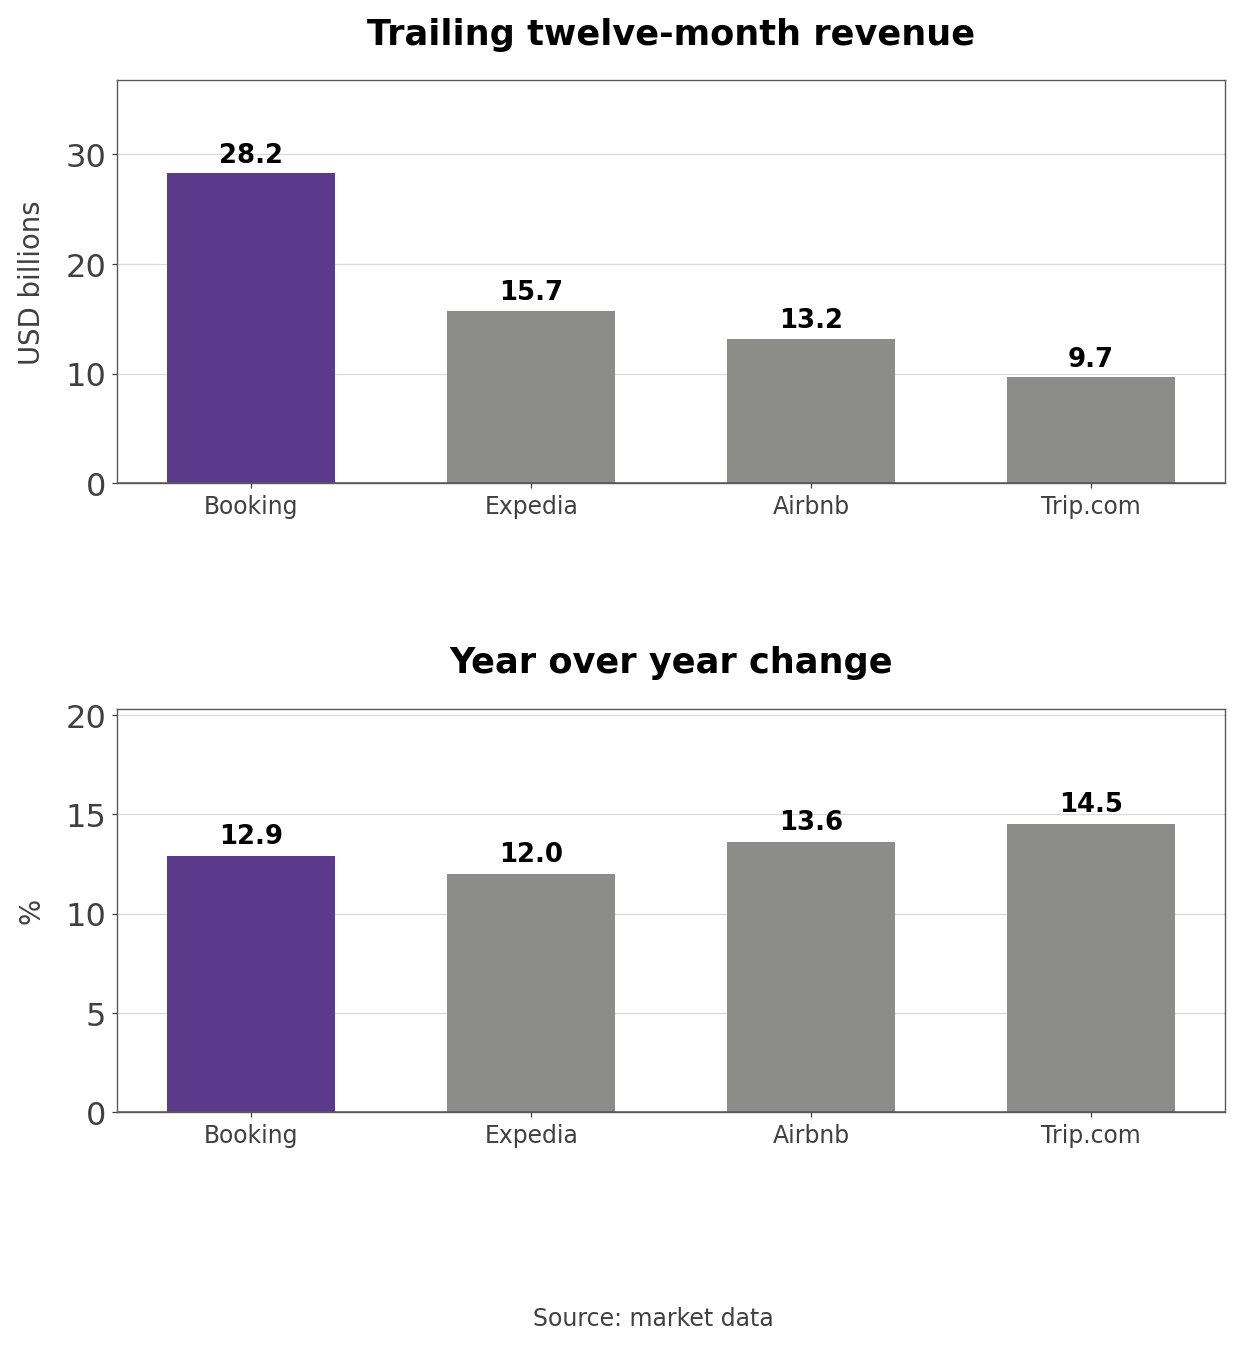
- Trailing twelve-month revenue is $28.24 billion at Booking, $15.70 billion at Expedia, $13.16 billion at Airbnb, and $9.66 billion at Trip.com. Growth rates sit in a narrow band of 12.0% to 14.5%.
- From the same market data source, P/E is 18.32x for Booking, 18.14x for Expedia, 39.43x for Airbnb, and 7.50x for Trip.com. Booking's price-to-sales ratio of 4.35x sits between Airbnb at 7.78x and Expedia at 2.21x.
- One-year returns split the group. Expedia is up +32.3% and Airbnb +37.3%, while Booking is down -18.8% and Trip.com -43.4%. Trip.com also carries a Chinese antitrust penalty.
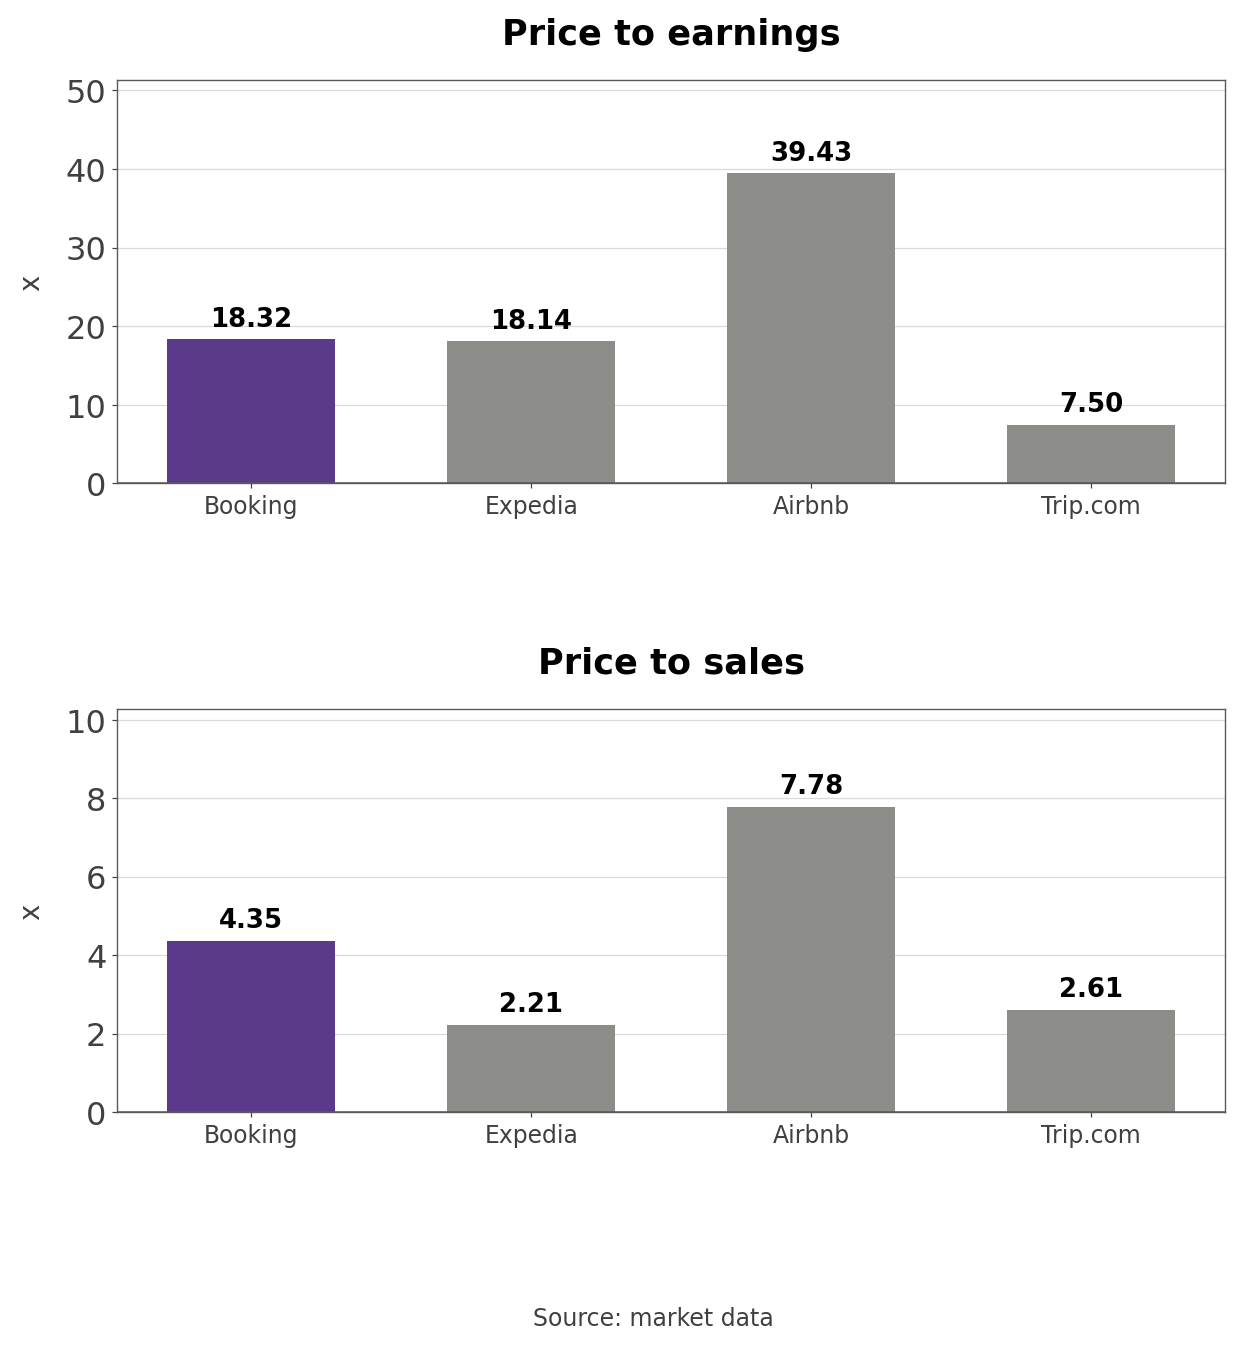
- Expedia makes the cleanest comparison because its P/E is almost the same. Booking has 1.8 times the revenue and nearly twice the price-to-sales ratio. Dividing price-to-sales by P/E gives net margin: 23.7% for Booking and 12.2% for Expedia. The same earnings multiple on a higher sales multiple reflects more profit kept from each dollar of revenue.
BKNG P/E and P/S Bands Over 50 Months
- A P/E of 17.46x is the lowest of the 50 months since September 2022. The median over that window is 26.89x, and the high was 37.74x in July 2025.
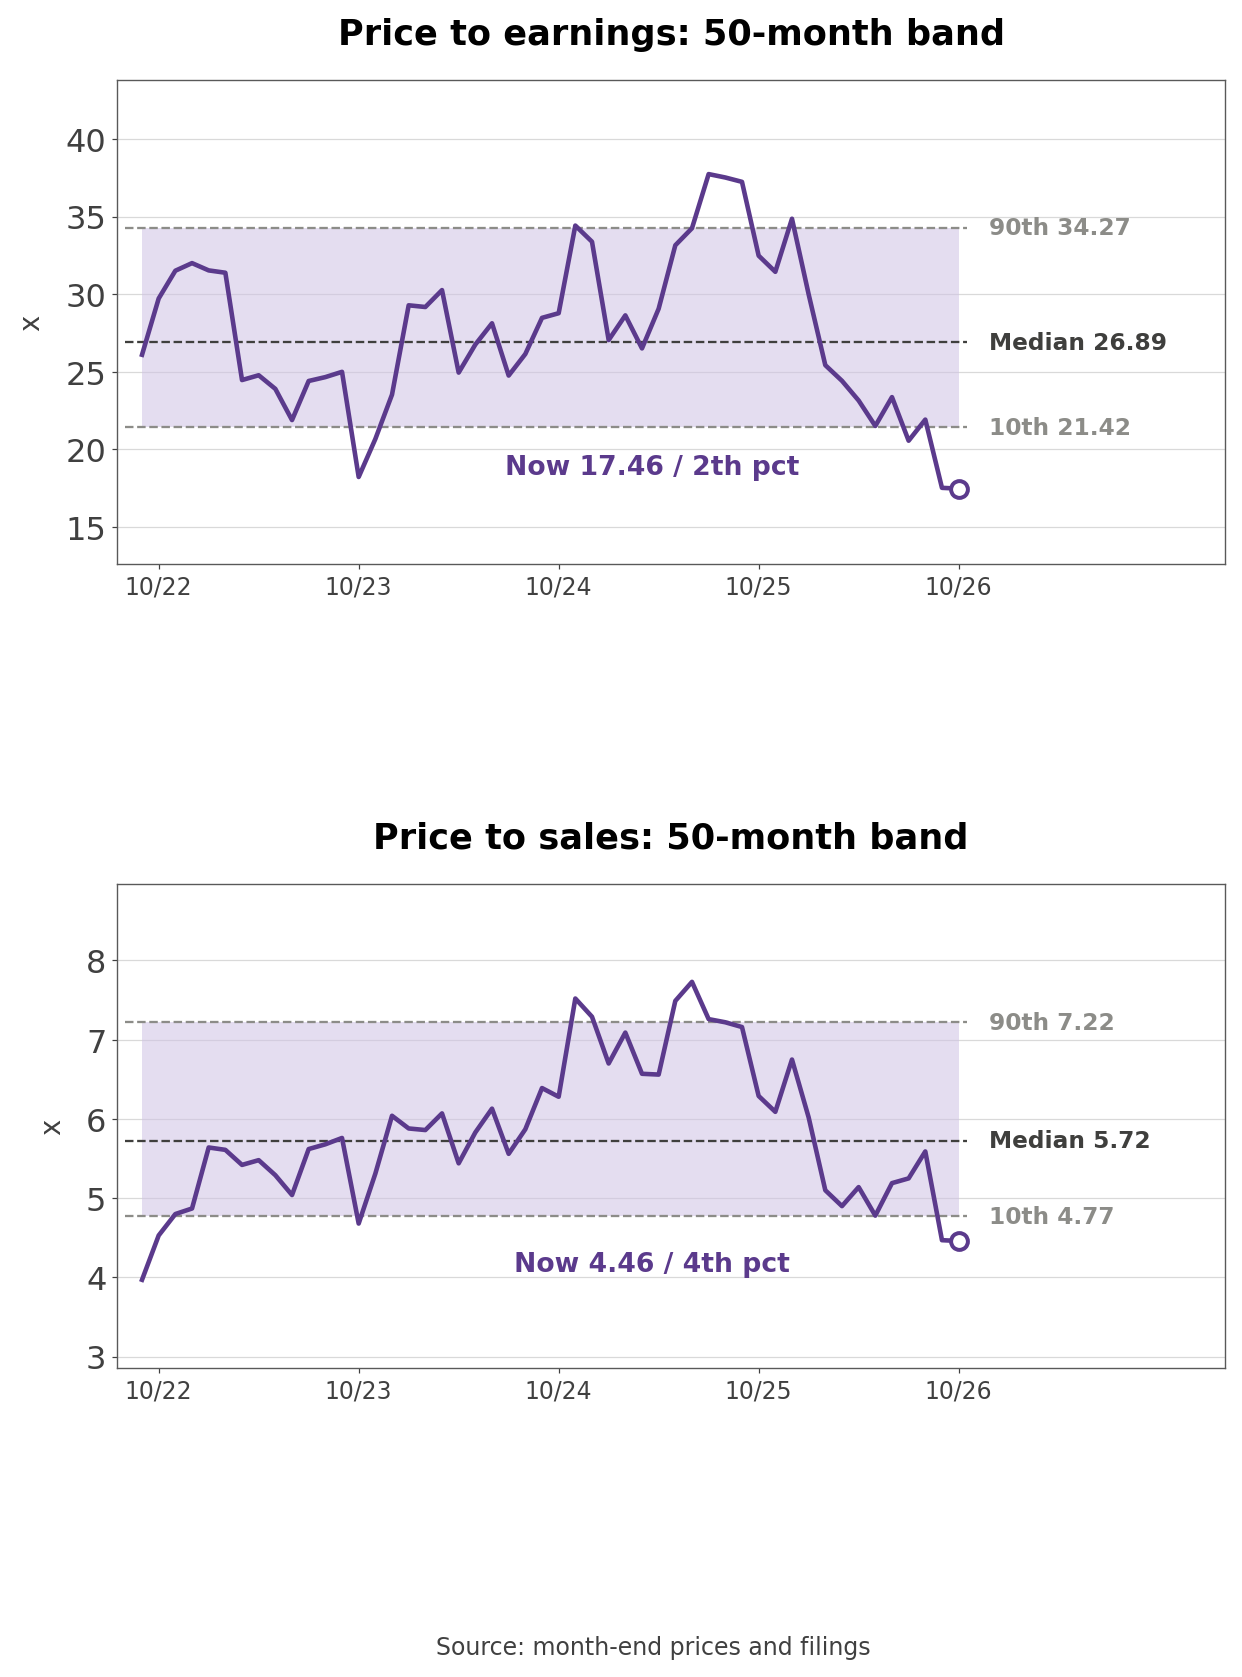
- The band starts in September 2022 for a reason. Before that, pandemic-depressed earnings sat in the denominator and pushed P/E as high as 255x, which would turn the band into a picture of the pandemic rather than the business.
- Price-to-sales of 4.46x sits at the 4.0th percentile of the same 50 months. The only lower reading was 3.97x in September 2022. Price-to-book is not meaningful with negative equity.
- Own calculation (cover page share count): At $163.45 and 751.4 million shares outstanding as of July 27, market capitalization is $122.81 billion. Divided by trailing twelve-month GAAP net income of $7.21 billion, that is a P/E of 17.04x.
- The band's 17.46x uses quarterly diluted weighted shares, which runs slightly higher. Another aggregator shows 16.72x, and the peer source above shows 18.32x. On every definition the multiple is at the bottom of its 50-month range.
Three Conditions That Move the Stock
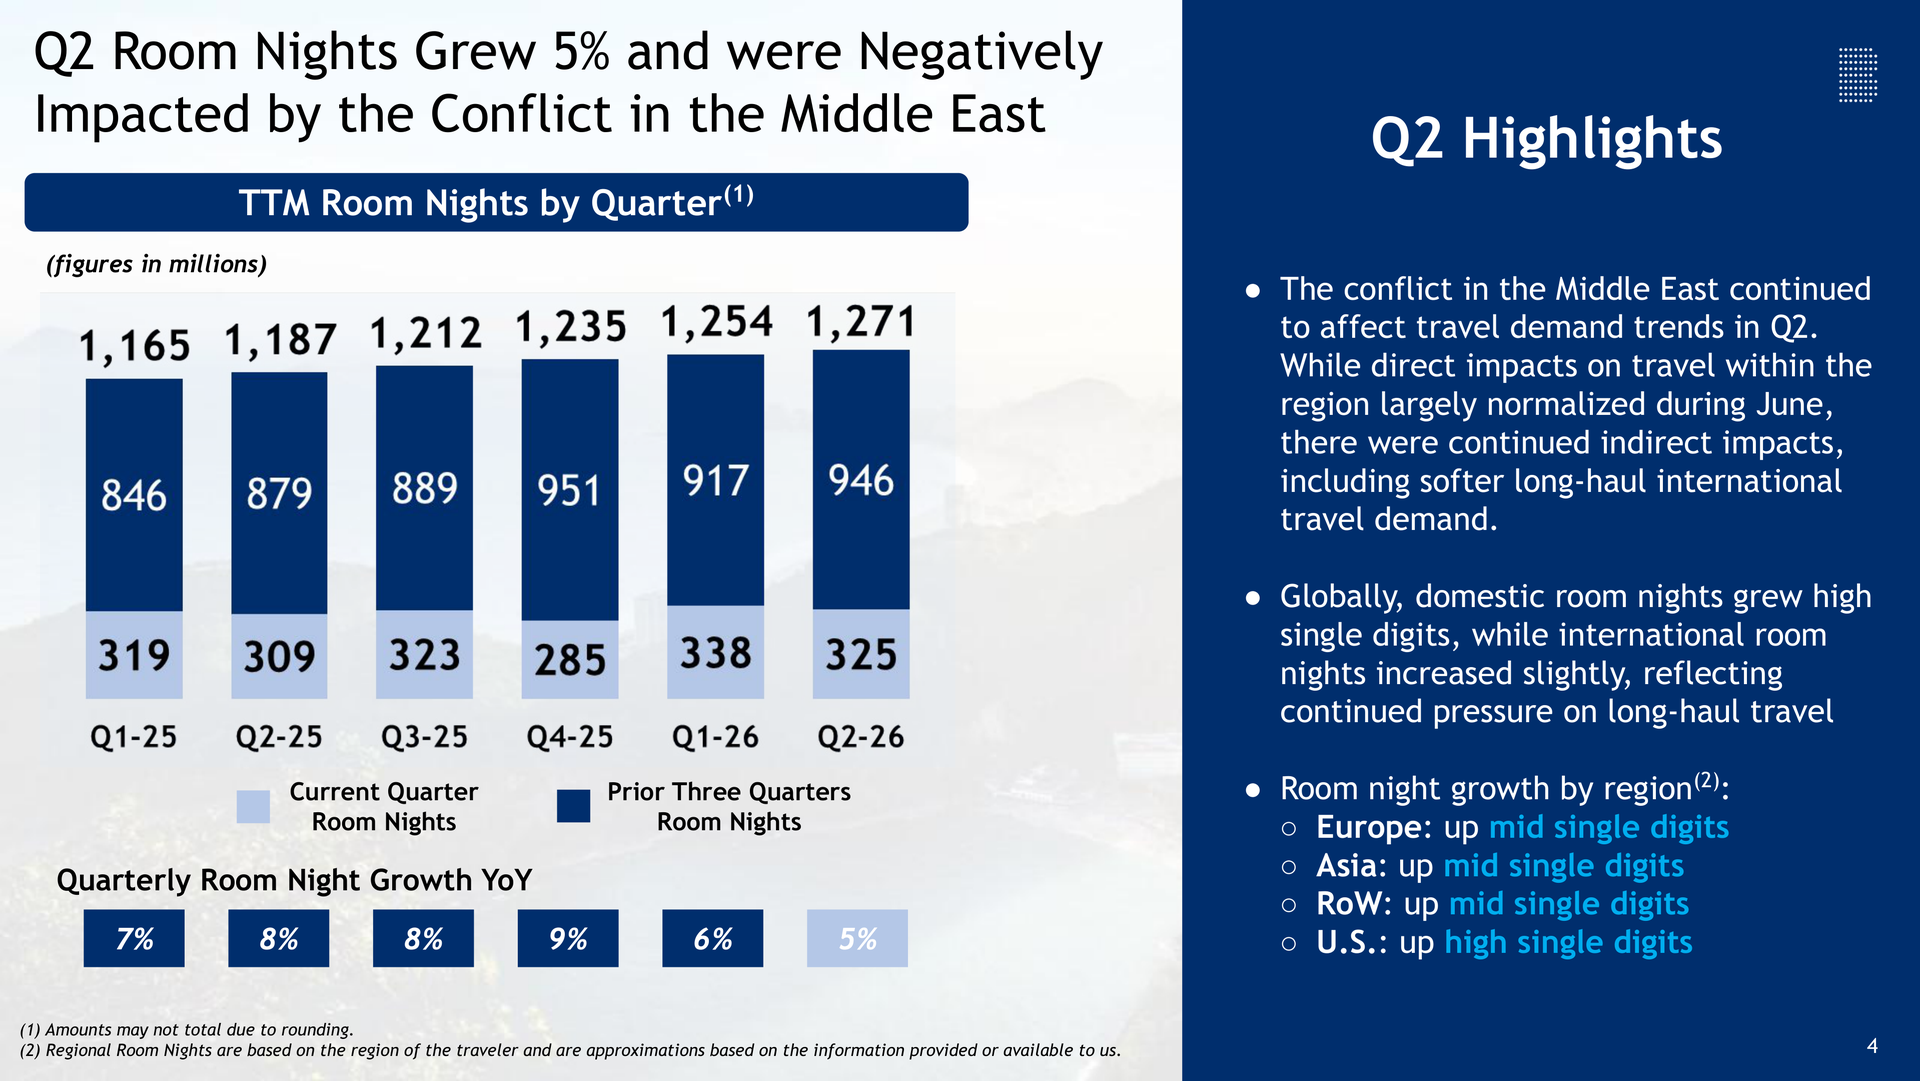
- Room night growth comes first. Third-quarter guidance is +3% to +5%, and the company assumes the indirect effects of the Middle East conflict continue through the quarter. If long-haul travel recovers and room nights clear the top of that range, the 8% revenue leg of the algorithm comes back. If they miss the bottom, buybacks carry more of the 15% EPS target.
- Buyback pace against prepayments is the second. First-half repurchases of $7.76 billion already exceed the $6.44 billion spent in all of 2025. At $163.45, the remaining $14.5 billion authorization would buy 11.8% of shares outstanding. Keeping this pace while summer prepayments flow back out in the second half requires more debt, and slowing it shrinks the share count contribution.
- Marketing efficiency is the third. Marketing grew +10.8% in the second quarter against revenue growth of +8.1%. If the direct mix starts rising again and marketing falls below the mid-4% range of gross bookings, margins hold. If more bookings arrive through search and AI assistants and marketing keeps outpacing revenue, earnings grow more slowly than sales.
What the Third-Quarter Filing Should Show
- The third-quarter report arrives in early November. The first number to check is deferred merchant bookings at September 30. In 2025 the balance fell $2.87 billion between June and September, and this year's June balance of $10.12 billion is larger.
- The second is third-quarter buyback spending. Capital return was $4.0 billion and $4.1 billion in the first two quarters, while in the third quarter of 2025 the company cut it to $1.0 billion. The cash flow statement will show whether the pace held and whether borrowing paid for it.
- One question this piece cannot settle is how much of the prepayment balance builds regardless of season. Year-end balances rose in each of the last four years, but if the merchant share stops climbing from around 70%, that growth slows too, and the 2026 annual report is where that shows.
Related Analysis
- Trip.com (TCOM) Stock Analysis: Antitrust Fine and Guidance: Booking's closest Asian competitor and the only peer that fell further this year, useful for comparing regulatory pressure in China with Booking's obligations under EU rules.
- Uber (UBER) Stock Analysis: Gross Bookings vs Revenue Gap: another platform where gross bookings and revenue tell different stories, a useful frame for Booking's merchant shift.
- Oracle (ORCL) Stock Analysis: Cash Flow and Prepayments: how customer prepayments inflate operating cash flow, the same mechanism behind Booking's deferred merchant bookings.
#BookingHoldings #BKNG #BKNGStock #OnlineTravel #ShareBuybacks #TravelStocks #USStocks #StockAnalysis #EquityResearch #GlobalStockBrief