
- Netflix (NASDAQ: NFLX) grew third-quarter revenue +11.8% to $12.87 billion at a 34.6% operating margin and bought back $4.80 billion of its own stock, the largest quarterly repurchase in its history. The shares still fell -6.6% in the week of the results. The third-quarter 10-Q and the shareholder letter explain the tension: the $9.50 billion of nine-month free cash flow includes the $2.8 billion termination fee Netflix collected in the first quarter after Warner Bros. Discovery walked away from their merger, and nine-month buybacks of $10.78 billion are larger than that free cash flow.
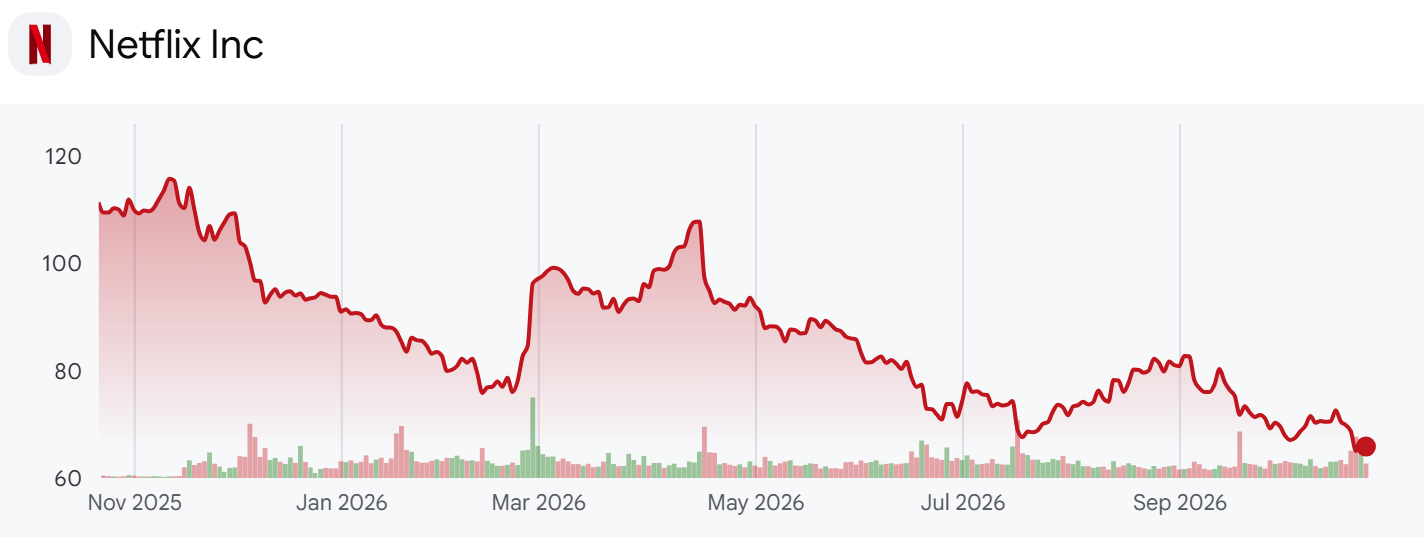
- Netflix sells series, films, and live events through subscriptions and advertising, and says its audience is approaching one billion people. At $65.85 a share and 4.106 billion shares on the 10-Q cover, the company is worth $270.40 billion, -50.2% below the weekly high of $132.31 set in the week of June 27, 2025. Free cash flow here is the company's non-GAAP measure, operating cash flow less purchases of property and equipment. Netflix does not disclose when the tax on the fee was paid, so this piece uses the $1.5 billion by which the company raised its 2026 free cash flow forecast in April, a raise it attributed primarily to the after-tax impact of the fee. P/E uses trailing twelve-month (TTM) GAAP diluted EPS.
Cost Timing and the Ad Revenue Cut in the Q3 Letter
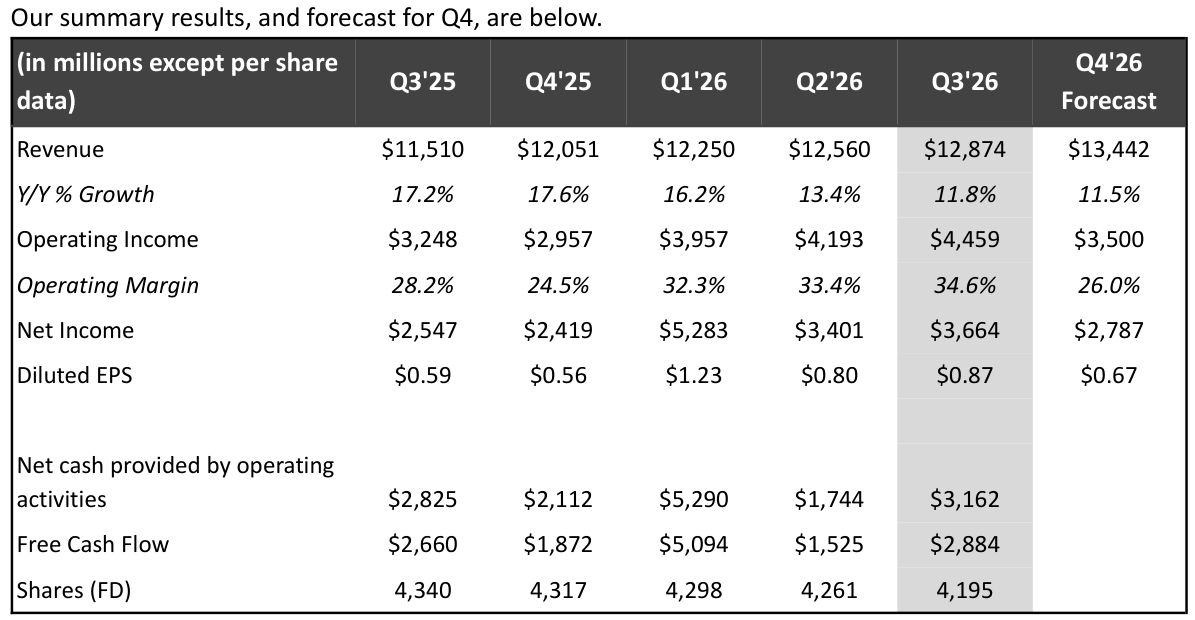
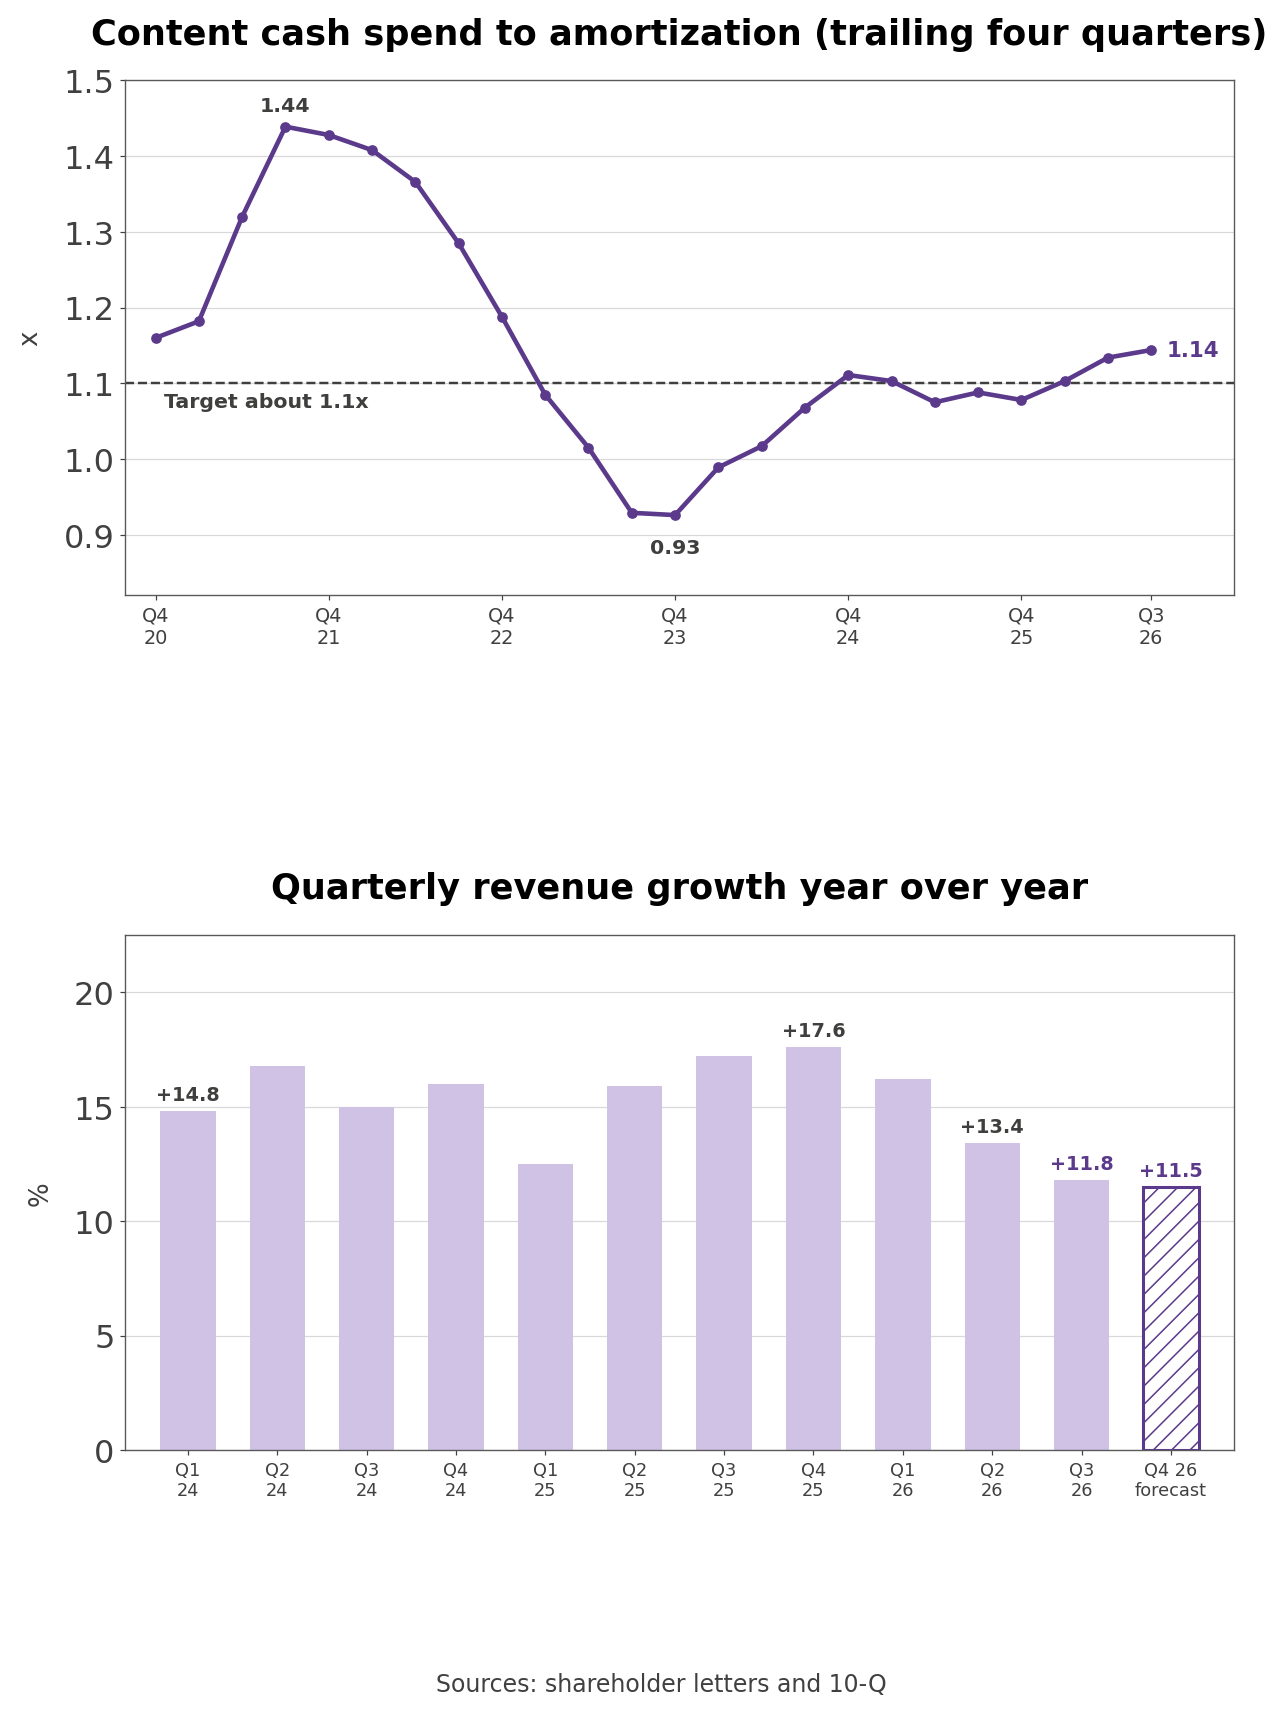
- The summary table on the first page of the third-quarter letter shows revenue growth slowing for three straight quarters, from 17.6% in the fourth quarter of 2025 to 16.2%, 13.4%, and 11.8%, with the fourth-quarter forecast at 11.5% on $13.44 billion of revenue. Operating margin of 34.6% was well above 28.2% a year earlier, and the letter says it came in "ahead of our forecast primarily due to the timing of expenses." The fourth-quarter forecast margin is 26.0%, which includes about 120 basis points from recently announced headcount reductions, against 24.5% a year earlier. Operating income rose 37% to $4.46 billion and diluted EPS rose 49% to $0.87. The letter credits growth in memberships, pricing, and advertising, and says churn improved year over year both globally and in the United States.
- Company disclosure (Q3 letter, 2026 outlook): Revenue of $51.1 billion, up 13% (12% at constant currency), and an operating margin of 31.5% versus 29.5% in 2025. Revenue sits 0.2% below the midpoint of the prior range because subscription revenue beat expectations while ad revenue is now expected at about $2.7 billion instead of about $3 billion, due to a "slightly slower than expected rollout of some ad product capabilities." Operating income is expected to grow more than 20%.
- On the call, co-chief executive Greg Peters said the ad business is still growing more than 80% this year, but that some new ad products and partner integrations arrived later than planned, a short-term hit he described as worth taking for a better long-term position. The January letter had said ad revenue more than doubled to over $1.5 billion in 2025 and was expected to roughly double again in 2026.
- The revenue range narrowed from $50.7 billion to $51.7 billion in January to $51.0 billion to $51.4 billion in July before settling at $51.1 billion. The 31.5% margin target never moved, but its contents did: in January it absorbed about $275 million of acquisition-related expenses for the Warner deal, and in October it absorbs about 30 basis points of headcount costs. Page 13 of the letter restates the nine-month margin at January exchange rates as 33.3%, against 33.5% as reported.
- Own calculation (operating income for 2026): Nine-month operating income of $12.61 billion plus the $3.50 billion fourth-quarter forecast gives $16.11 billion for 2026, up 20.9% from $13.33 billion. The margin steps down from 33.5% over nine months to 26.0% in the fourth quarter.
What the Content Accounting Slides Say About Cash
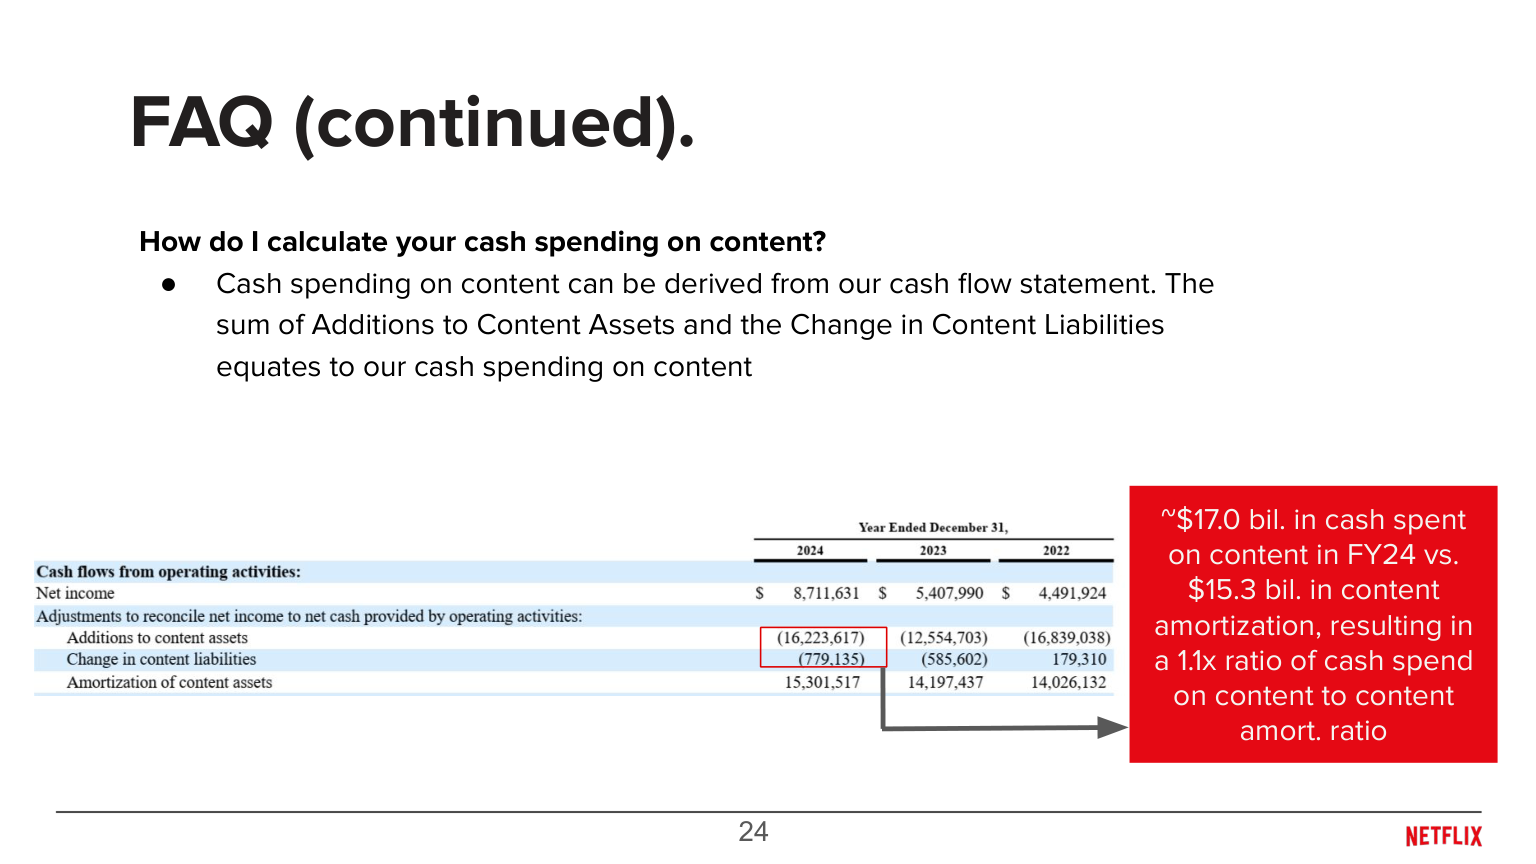
- Alongside its quarterly letters, the Netflix investor site hosts a 28-page content accounting overview from May 2025. Page 24 tells investors that "The sum of Additions to Content Assets and the Change in Content Liabilities equates to our cash spending on content," and illustrates it with 2024: about $17.0 billion spent in cash against $15.3 billion of amortization, a ratio of 1.1. Page 21 carries the headline "Cash costs for original content are more front end loaded," because Netflix funds production years before a title is released. Page 7 says every title is amortized on an accelerated basis tied to historical and estimated viewing, and that the schedule is reviewed quarterly.
- The third-quarter letter keeps the expectation of an annual cash content spend to amortization ratio of about 1.1. It also reports buying 63.9 million shares for $4.8 billion, "our largest quarter ever of stock repurchases," with $22.3 billion of authorization left. Gross debt ended the quarter at $15.3 billion and cash at $8.2 billion, after a $1 billion bond issued to fund a $1 billion maturity in the fourth quarter. The 2026 free cash flow forecast came down to about $12.0 billion from $12.5 billion because of a real estate transaction expected to close in the fourth quarter.
- The capital allocation order in the letter puts reinvestment and selective acquisitions first, a healthy balance sheet second, and repurchases with the excess. The first-quarter letter explained that "Our cash position is more elevated than normal due to the pause in our share repurchase program during the Warner Bros. transaction" and the receipt of the fee; Netflix then resumed buying with 13.5 million shares for $1.3 billion. In April the board added $25 billion to the remaining $6.8 billion, and the $4.7 billion bought in the second quarter was the record until the third quarter beat it. Non-GAAP net debt was $7.11 billion at the end of September.
- Own calculation (content cash versus amortization): Applying the page 24 method to the cash flow statements in the letters, nine-month content cash spending was $14.98 billion, up 18.5%, while amortization was $12.76 billion, up 9.5%. The ratio of 1.17 compares with 1.08 a year earlier, and the same method gives 1.11 for 2024, matching the slide.
- On a trailing four-quarter basis the ratio peaked at 1.44 in the third quarter of 2021, fell to 0.93 in the fourth quarter of 2023 after the writers' strike briefly halted new production, and has climbed back to 1.14. The January letter said the strike led to heavier licensing in 2023 and 2024 and a later decline in viewing of non-branded titles.
The Bull and Bear Case for Netflix Shares
- The bullish case rests on earnings and the share count. Operating income should grow more than 20% in 2026, churn improved in the third quarter, shares outstanding fell 2.7% this year from 4.222 billion to 4.106 billion, and P/E excluding the fee is 22.02, the 10th percentile of 83 months.
- The bearish case is about growth and cash. Revenue growth has slowed for three quarters in a row with a lower forecast for the fourth, the ad revenue forecast was cut 10%, nine-month buybacks were 113.5% of free cash flow even with the fee included, and cash fell from $12.3 billion at the end of March to $8.2 billion at the end of September.
- Outside view (sell-side research aggregate, October 2026): Of 100 analysts, 62 rate the stock Buy, 30 Hold, and 8 Sell, with an average price target of $91 and a range of $57 to $119. After the results Needham cut its rating from Buy to Hold, Wolfe Research moved from Outperform to Peer Perform, and Pivotal Research lowered its target from $96 to $65.
- The average target is 38.2% above the share price, yet no firm in the aggregate raised its view after the third-quarter report.
From a Warner Deal to a $2.8 Billion Breakup Fee
- Netflix reported its first paid membership decline, 0.2 million, in the first quarter of 2022, and the stock fell 51.1% that year. It launched an ad-supported plan in 12 countries that November, and the shares gained +65.1% in 2023 and +86.4% in 2024. A ten-for-one stock split took effect on November 14, 2025.
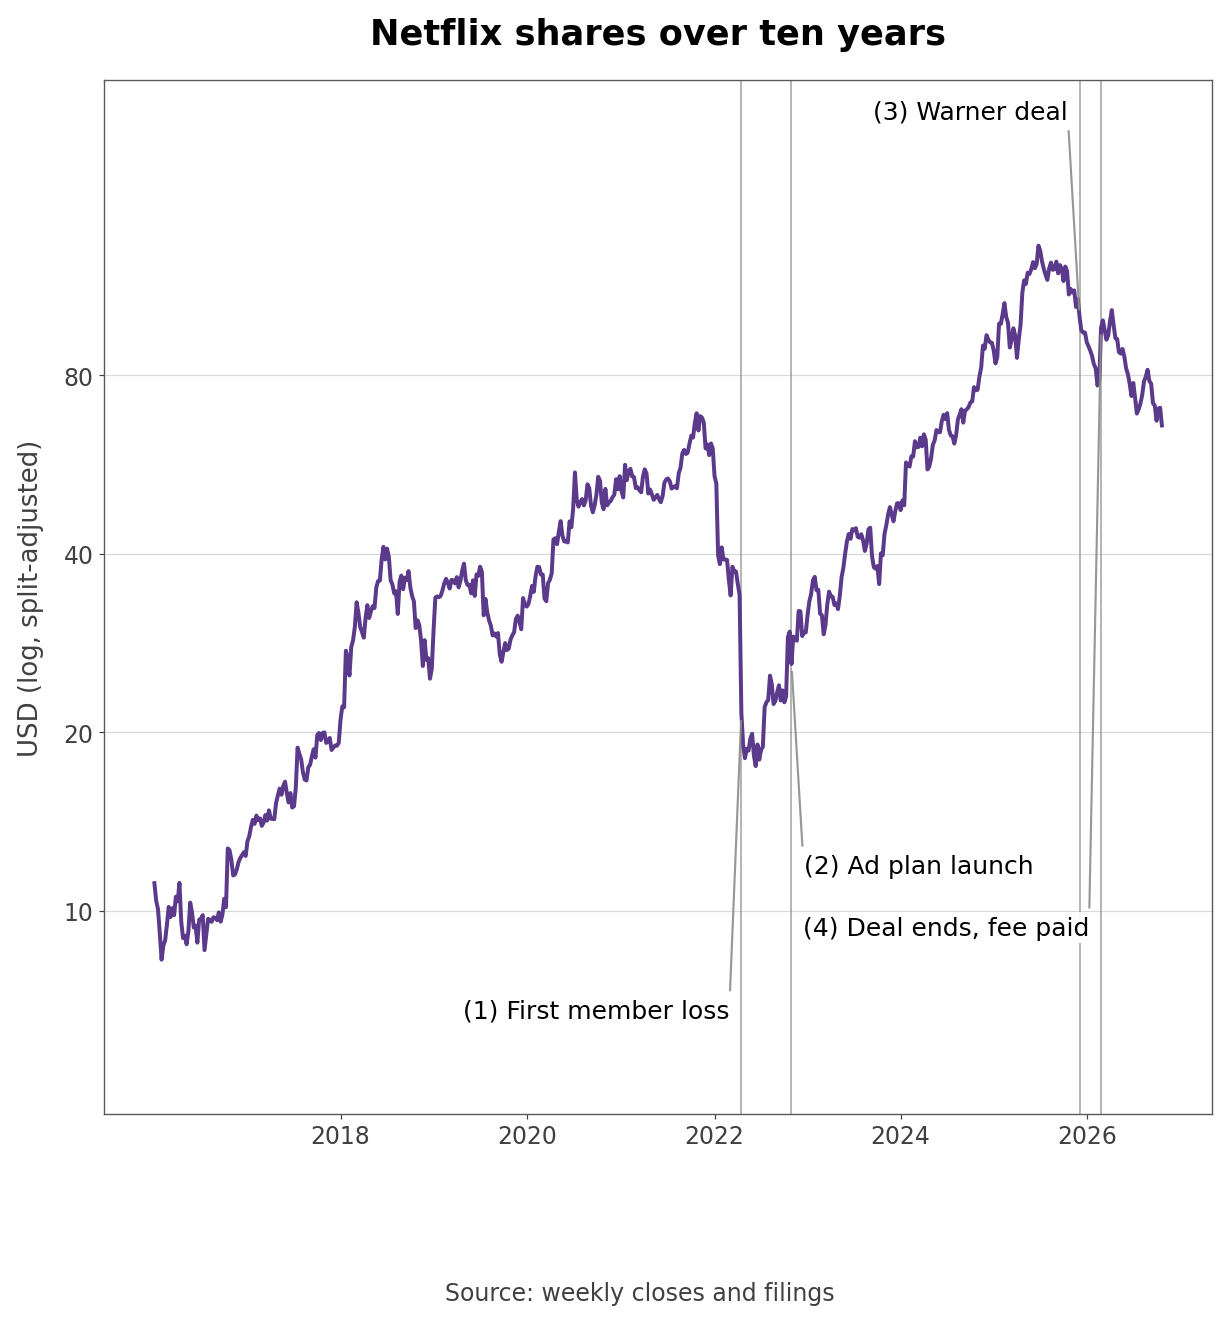
- On December 4, 2025, Netflix agreed to buy the studios and HBO Max and HBO businesses of Warner Bros. Discovery (WBD) and lined up a $59 billion bridge loan commitment. It paused buybacks while the deal was pending. On February 27, 2026, WBD terminated the agreement to sign with Paramount Skydance (PSKY), and PSKY paid the $2.8 billion termination fee to Netflix on behalf of WBD. Netflix booked it in interest and other income, which lifted first-quarter EPS to $1.23 against a forecast of $0.76.
- After declining to raise its offer, Netflix resumed repurchases. Buybacks went from $1.27 billion in the first quarter to $4.71 billion in the second and $4.80 billion in the third. The stock is down -30.3% in 2026.
How Much of the Buyback Does the Core Business Fund?
- The 2026 free cash flow forecast has moved four times: about $11 billion in January, about $12.5 billion in April to reflect the after-tax fee, unchanged in July, and about $12.0 billion in October because of the real estate deal. The January letter also said 2025 free cash flow beat its roughly $9 billion forecast because an expected deposit of about $700 million in a Brazilian tax dispute shifted from 2025 into 2026.
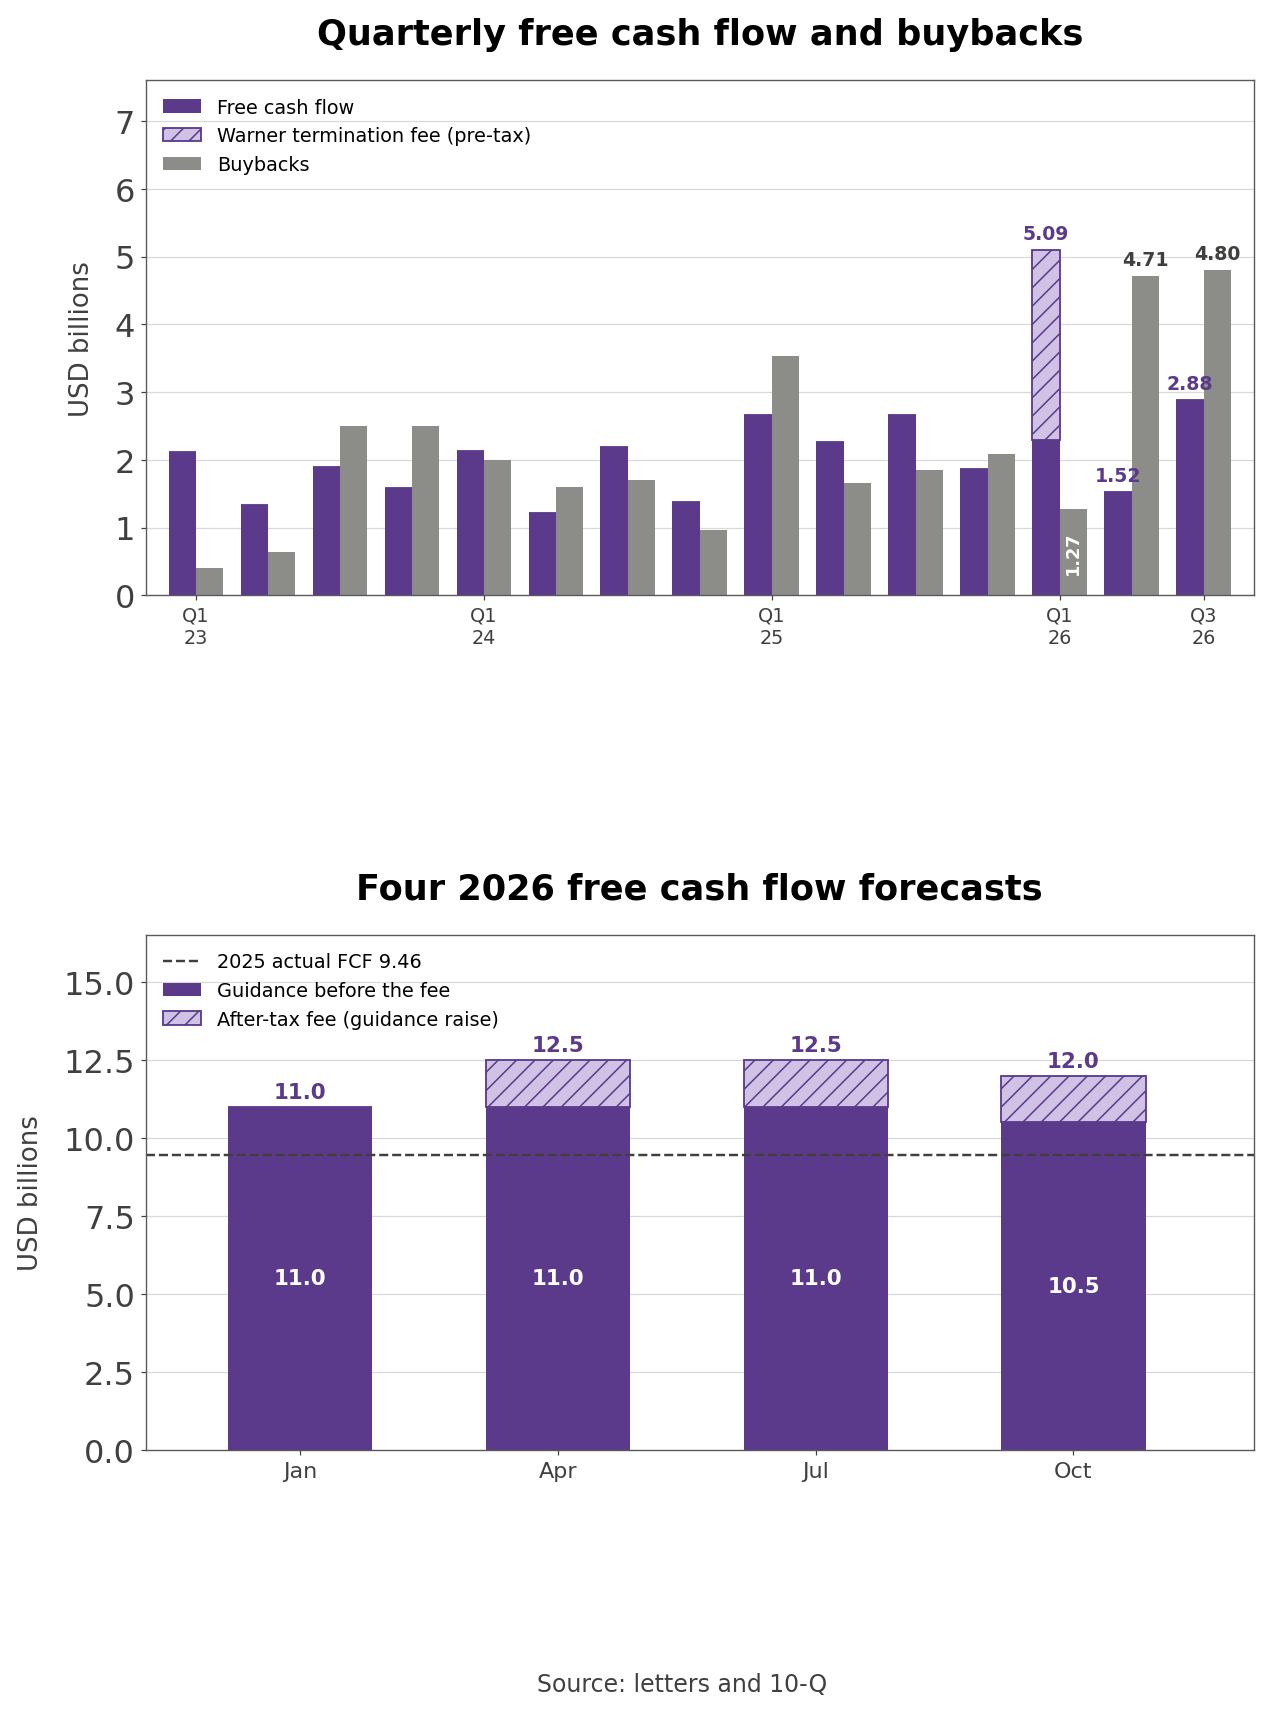
- Own calculation (free cash flow without the fee): Taking the $1.5 billion after-tax fee out of the $12.0 billion forecast leaves $10.5 billion, up 11.0% from $9.46 billion in 2025. Reversing the Brazil timing as well, removing about $700 million from 2025 and adding back the $729 million Brazil payment in the 10-Q, turns the comparison into $8.76 billion against $11.23 billion, up 28.2%, faster than 20.9% operating income growth.
- Applied to nine months, $9.50 billion of free cash flow less the $2.8 billion pre-tax fee plus the $729 million Brazil payment leaves $7.43 billion that is closer to the core business. Buybacks of $10.78 billion were 1.45 times that figure and 113.5% of reported free cash flow, against 92.9% in the first nine months of 2025.
- The 10-Q describes the Brazil outflow as "non-routine payments made in connection with non-income tax assessments in Brazil for prior tax periods." The second-quarter letter tied lower second-quarter free cash flow of $1.53 billion, against $2.27 billion a year earlier, to higher cash taxes linked in part to the fee, and the $586 million spent on an acquisition in the first quarter sits outside free cash flow.
- Meeting the forecast requires fourth-quarter free cash flow of $2.50 billion, against $1.87 billion a year earlier. If Netflix buys back as much in the fourth quarter as in the third and repays the $1 billion maturity, year-end cash would fall to about $4.9 billion.
Slower Growth in North America and a Smaller Ad Forecast
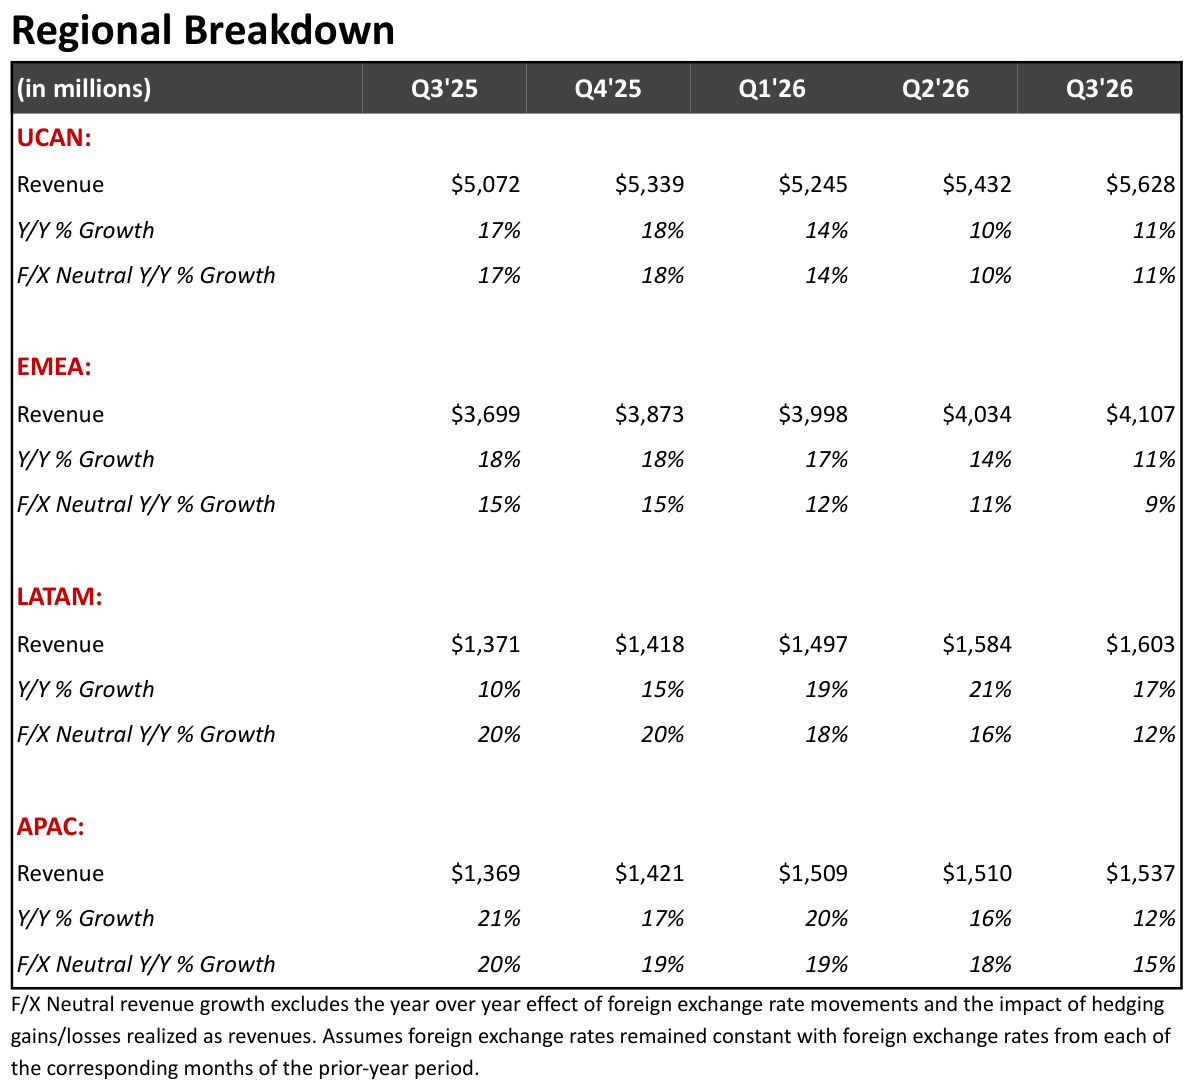
- Revenue growth in the United States and Canada (UCAN) slowed from 18% in the fourth quarter of 2025 to 10% in the second quarter of 2026, which the July letter said reflected only a partial-quarter effect of the latest price increase, and to 11% in the third quarter, the first full quarter of that increase. At constant currency, third-quarter growth was 9% in Europe, the Middle East and Africa (EMEA), 12% in Latin America, and 15% in Asia-Pacific.
- View hours grew 1.5% in 2025 and 2% in the first half of 2026. The third-quarter letter addressed investor concern about view-hour growth directly and pointed to member response to the 2026 price increases as evidence that engagement is healthy. Co-chief executive Ted Sarandos said on the call that content from outside the United States is working while execution in the U.S. needs to improve, and former Disney executive Peter Rice has joined as chief content officer. India was the bright spot, with view hours up +24% and revenue up about 18% at constant currency.
- The ad tier adds 15 countries in 2027, starting in March with nine in EMEA plus Colombia, Peru, and New Zealand. The roughly $2.7 billion ad forecast is about 5.3% of the $51.1 billion revenue forecast.
How Subscriptions and Ads Make Money
- Most revenue is monthly subscription fees, with the rest coming from ads sold on the ad-supported plan. Of $12.87 billion of third-quarter revenue, UCAN contributed $5.63 billion (43.7%), EMEA $4.11 billion, Latin America $1.60 billion, and Asia-Pacific $1.54 billion. Management describes three growth levers: more members, higher prices, and ads. Ads are sold through Netflix Ads Suite, its in-house technology; in the third quarter Netflix extended programmatic buying through connected TV marketplace deals worldwide, added partners MercadoLibre in Latin America and AdForm in EMEA, and expanded measurement of reach, frequency, and attribution inside the buying platforms advertisers use.
- Content is the main cost. Of $6.08 billion of third-quarter cost of revenues, content amortization was $4.24 billion; marketing was $837 million, technology and development $1.03 billion, and general and administrative $466 million. Page 6 of the accounting slides sorts the library into owned originals such as Stranger Things, Squid Game, and Bridgerton, licensed originals made by other studios but branded Netflix such as Wednesday and Emily in Paris, and second-run licensed shows.
- Own calculation (cost leverage): Content amortization was 32.9% of third-quarter revenue, down from 34.8% a year earlier. Technology and development grew fastest among the cost lines, up 21.0% to $1.03 billion from $854 million, and the 10-Q cites growth in advertising sales headcount as one driver of higher marketing costs.
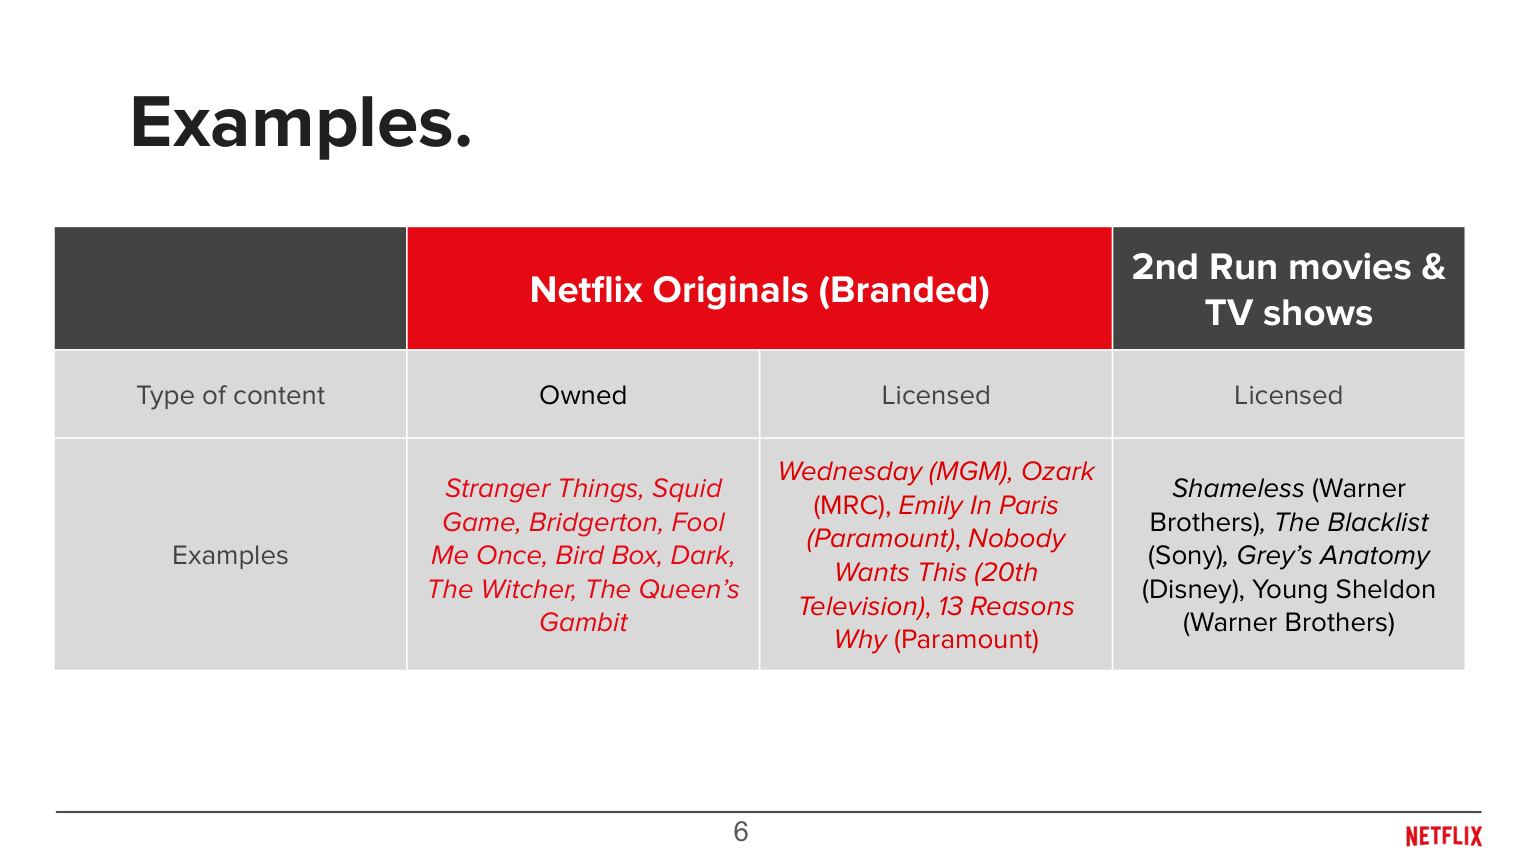
- Originals anchor the service and licensing fills it out. In the third quarter Netflix signed a new licensing deal with Disney that brought all five Ice Age films, and it launched a partnership in France that puts TF1 programming inside the Netflix app. Non-English titles now account for more than a third of viewing, up from under 10% a decade ago. The July letter said live programming would be just over 5% of 2026 content spend but about 1% of view hours, yet live events accounted for six of the top ten sign-up days in five years. The fourth quarter brings an NFL Thanksgiving Eve game, a Christmas Day doubleheader, and the Tyson Fury and Anthony Joshua fight.
- The January letter put the Netflix share of U.S. TV time at a record 9.0% in December 2025, still below 10% in its major markets, with linear TV at more than 40% of U.S. TV screen time. Members watched more than 97 billion hours in the first half of 2026. Off-balance-sheet commitments matter too: streaming content obligations rose to $25.22 billion from $24.04 billion at the start of the year, with $11.78 billion due within twelve months.
How the Streamer Compares With Four Media Peers
- Trailing twelve-month revenue is $123.01 billion at Comcast, $98.86 billion at Disney, $49.73 billion at Netflix, $36.12 billion at Warner Bros. Discovery, and $20.69 billion at Spotify. Growth ranges from Netflix at +14.7%, Spotify at 9.0%, and Disney at 4.6% to Comcast at -0.2% and Warner Bros. Discovery at -6.1%.
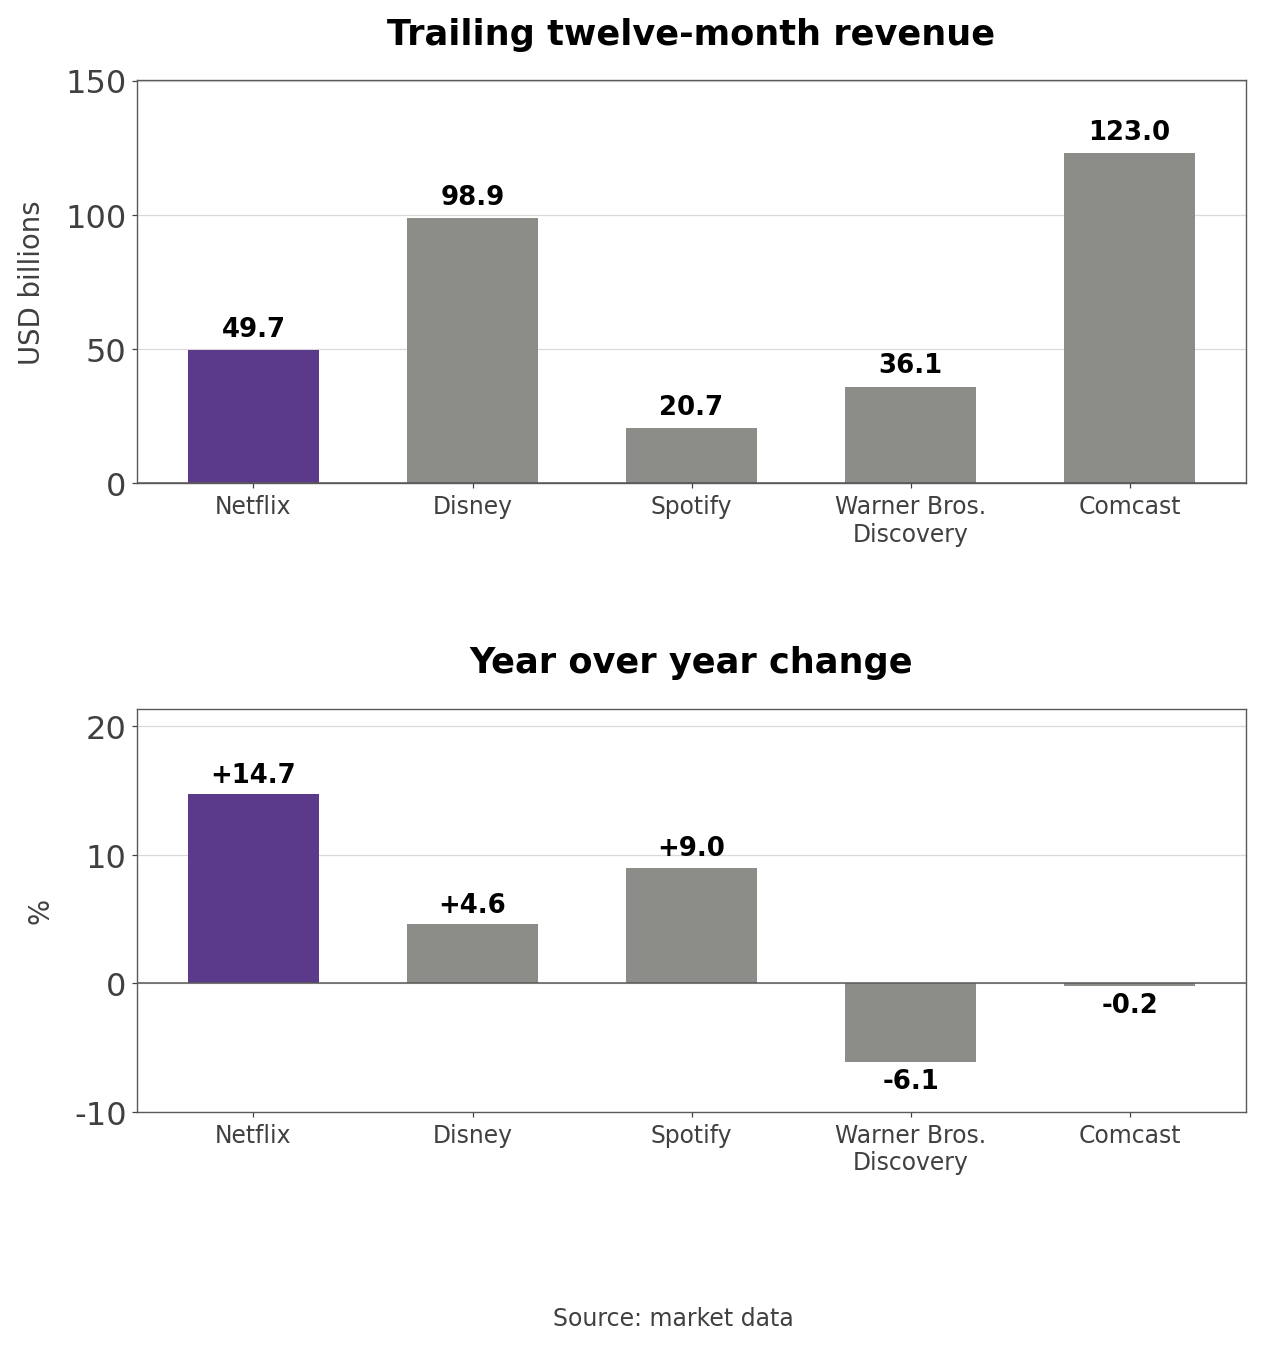
- Disney combines Disney+ and Hulu with parks and studios, and Comcast pairs cable and broadband with NBCUniversal and Peacock. Warner Bros. Discovery owns HBO Max and its studios and signed with PSKY after leaving the Netflix deal. Spotify sells music and podcasts through subscriptions and ads, the closest business model to Netflix. Because the business mix differs so much, the comparison uses EV/EBITDA and price to sales.
- EV/EBITDA is 36.77 at Spotify, 17.53 at Netflix, 13.79 at Warner Bros. Discovery, 11.22 at Disney, and 4.78 at Comcast. Price to sales is 5.81, 5.44, 2.15, 1.97, and 0.65 in the same order. Over the past year Warner Bros. Discovery gained 37.9%, while Disney slipped 0.1%, Spotify fell 10.8%, Comcast 18.5%, and Netflix -41.1%.
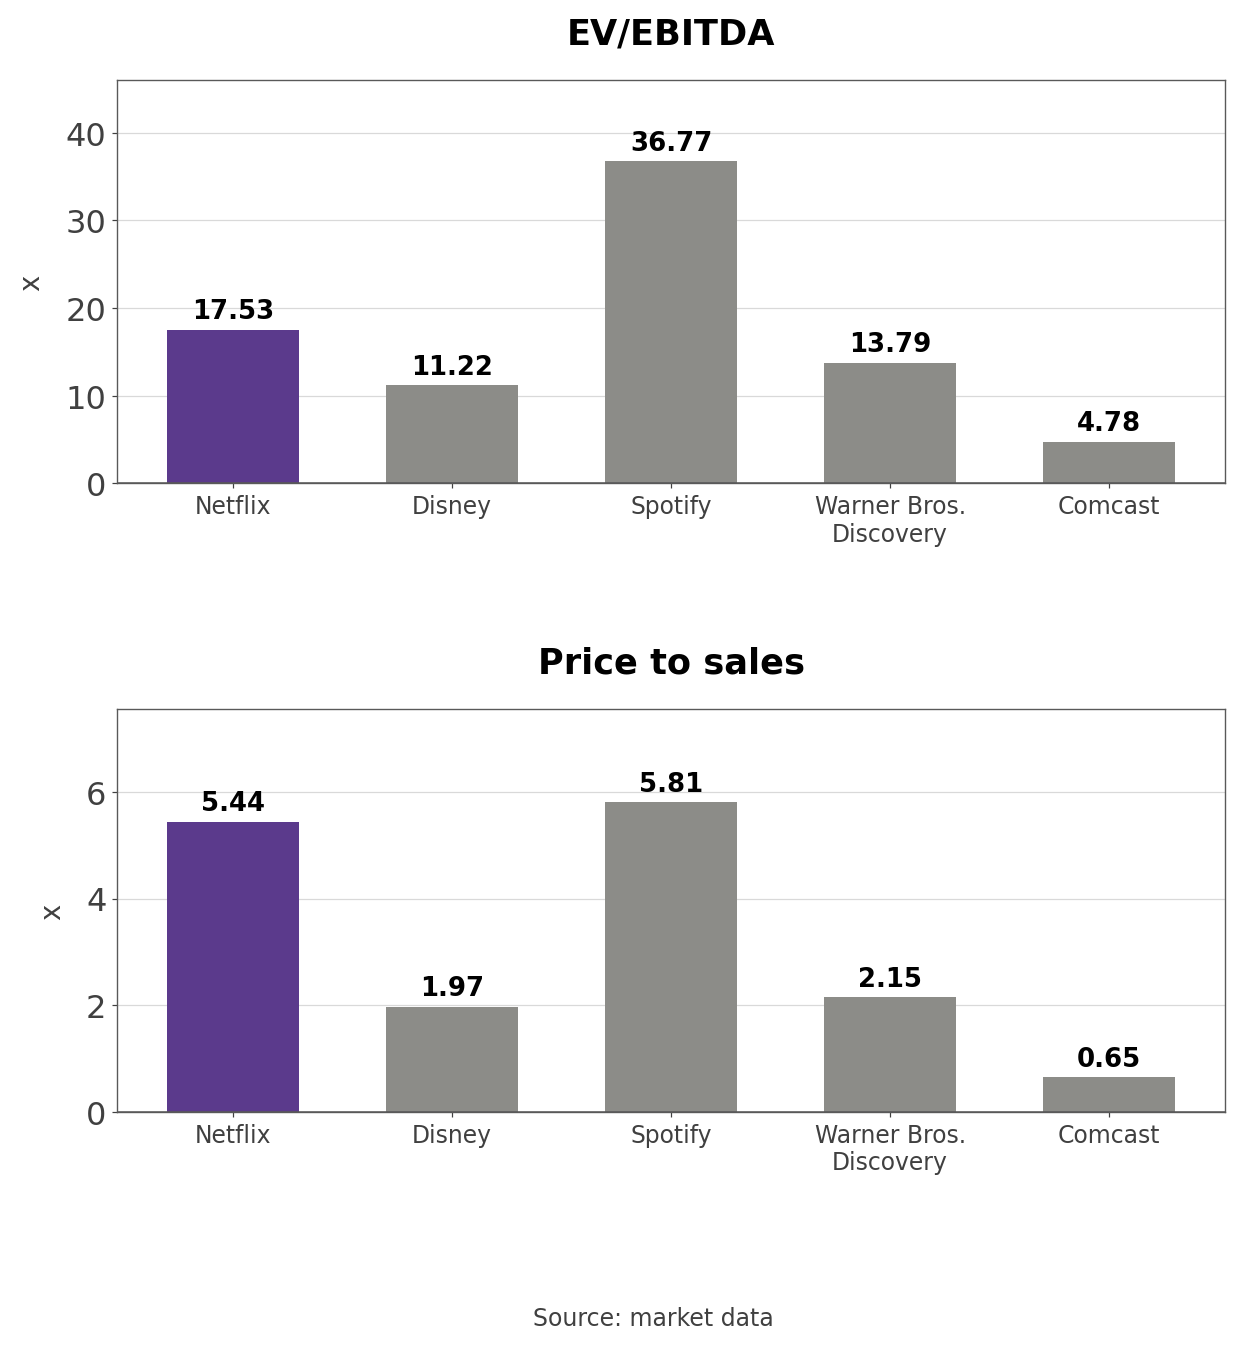
- The Netflix market value of $270.4 billion is 1.39 times that of Disney at $194.29 billion, on half the revenue. Netflix has the fastest growth of the five and the second-highest price to sales after Spotify, whose EV/EBITDA is 2.10 times that of Netflix.
P/E on GAAP EPS Over 83 Months
- On trailing GAAP diluted EPS of $3.46, Netflix trades at 19.03 times, the 5th percentile of the 83 months since December 2019, against a median of 44.95. The low was 15.54 in June 2022 and the high 89.35 in February 2020. That $3.46 includes the $1.23 first quarter that carried the fee.
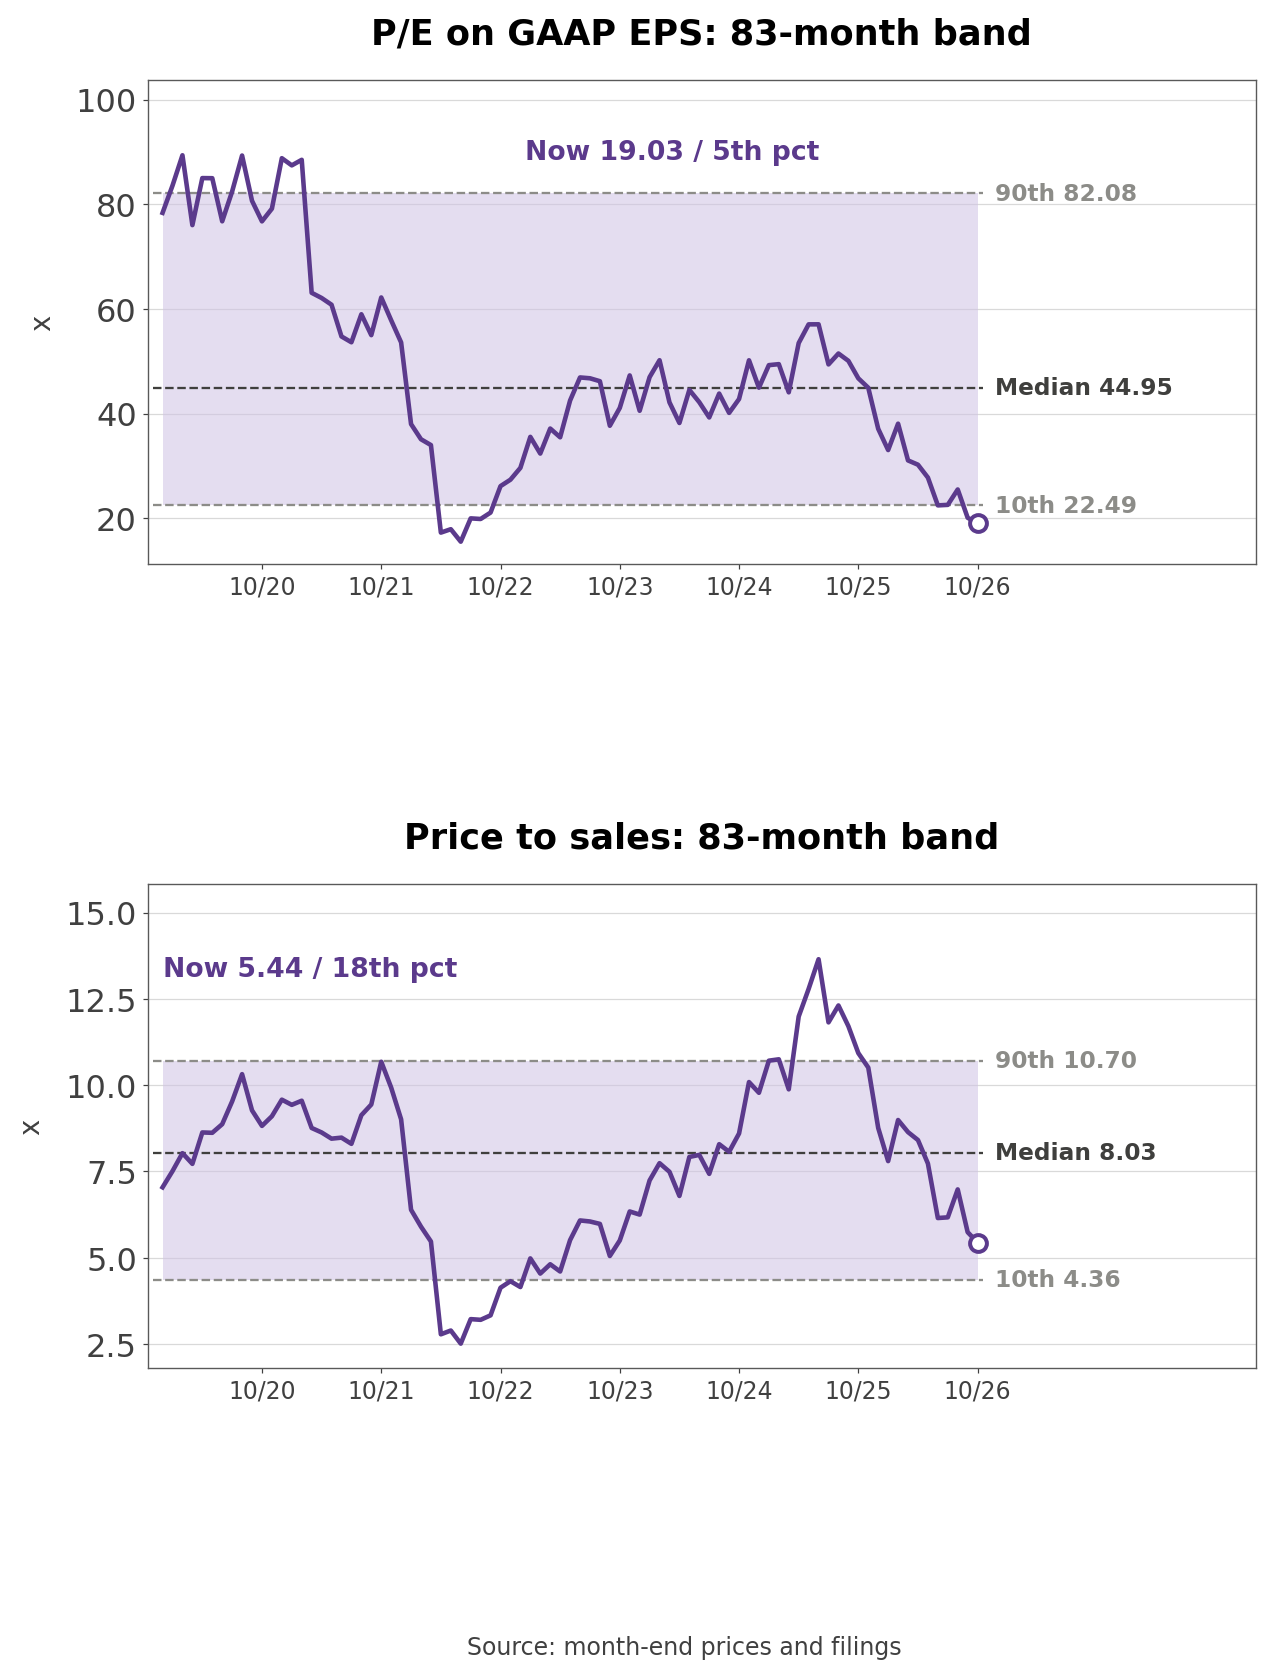
- Swapping in the $0.76 the company had forecast for that first quarter gives EPS of $2.99 and a P/E of 22.02, the 10th percentile. Price to sales is 5.44, the 18th percentile, against a median of 8.03. The share price is 12.3% below the $75.05 average Netflix paid in the third quarter: $72.45 in July, $77.00 in August, and $75.79 in September. Adding the $0.67 fourth-quarter EPS forecast gives $3.57 for 2026 and a P/E of 18.45 with the fee included.
Three Conditions That Move the Stock
- The content cash to amortization ratio was 1.17 for the first nine months. If the full year lands near the company forecast of about 1.1, the implied $2.50 billion of fourth-quarter free cash flow becomes realistic; a drift toward 1.2 would leave less cash for buybacks.
- Ad revenue is guided at about $2.7 billion for 2026. If the March 2027 launch in 12 new countries and fixes to the delayed ad products push revenue growth back above the 11.5% fourth-quarter forecast, the slowdown argument weakens; growth below 10% would put at risk the double-digit growth goal management reaffirmed on the call.
- Buyback pace was $4.80 billion in the third quarter, 1.66 times that quarter's $2.88 billion of free cash flow. Buybacks that fall back inside free cash flow in 2027 would preserve the $8.2 billion cash balance; keeping the pace with more borrowing would push net debt above $7.11 billion.
Headcount Cuts and the 2027 Margin Guide
- The numbers to watch in the fourth-quarter report are 2027 revenue and operating margin guidance, actual fourth-quarter free cash flow and content cash spending, and how much of the headcount savings reaches the 2027 margin. Chief financial officer Spence Neumann declined to quantify the 2027 cost effect and said full 2027 guidance, including margin, will come in January. Greg Peters described the cuts as fixing areas that were built quickly and overinvested. Because the cuts weigh 1.2 points on the fourth-quarter margin, the gap between the 2027 margin guide and the 31.5% of 2026 is the first measure of the savings.
- One question this piece cannot settle: once the fee and the cash saved during the Warner deal are spent, will the free cash flow left after content cash spending that is growing faster than amortization be enough to sustain buybacks near $4.7 billion a quarter?
Related Analysis
- Booking Holdings (BKNG) Stock: Buybacks Beyond Cash Flow: another company returning more than its free cash flow, a frame for Netflix buying back 1.45 times its core nine-month cash.
- KLA (KLAC) Stock: Net Income Up 19% and Cash Flow Flat: a case where reported earnings outran cash, useful next to Netflix content cash spending growing about twice as fast as amortization.
- T-Mobile (TMUS) Stock: Phone Metrics It Stopped Reporting: a subscription business judged on churn and pricing, the same levers Netflix cites for its revenue.
#Netflix #NFLXStock #StreamingStocks #ShareBuybacks #AdTier #MediaStocks #USStocks #StockAnalysis #EquityResearch #GlobalStockBrief
'US Stock Analysis' 카테고리의 다른 글
| General Motors (GM) Stock: EV Add-Backs and a $20B Buyback (0) | 2026.10.25 |
|---|---|
| SpaceX (SPCX) Stock: One Customer and a 90-Day Exit Clause (0) | 2026.10.24 |
| IBM (IBM) Stock: Organic Software Growth Is Just Over 4% (0) | 2026.10.24 |
| GE Aerospace (GE) Stock: Allowances Behind the Cash Flow (0) | 2026.10.24 |
| Schlumberger (SLB) Stock: Organic Sales Fall and a $4.1B Bet (0) | 2026.10.23 |


