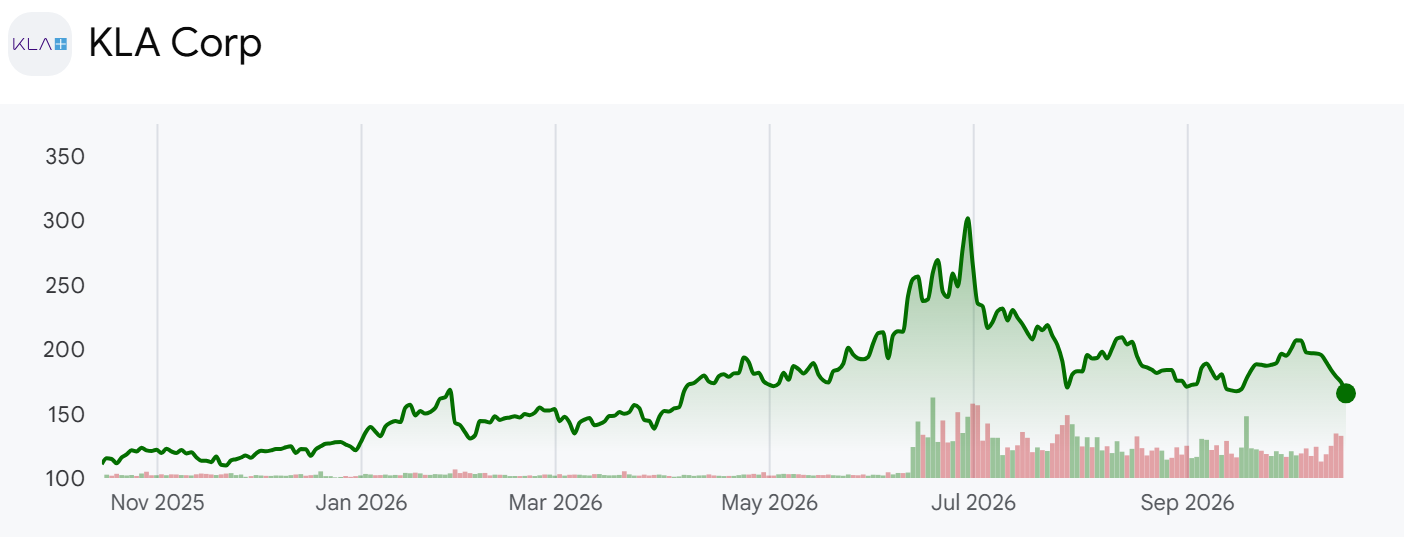
- KLA Corporation (NASDAQ: KLAC) grew fiscal 2026 revenue +11.7% to $13.58 billion and net income +18.9% to $4.83 billion, yet free cash flow rose only +0.5% to $3.77 billion. Growth in inventory and receivables explains 102.6% of the gap between earnings and cash. Purchase commitments to suppliers reached $5.97 billion at June 30, 2.5 times the year before, which means KLA has already paid for, or promised to pay for, a level of demand its customers still have to deliver. The shares are down -45.1% from the June 30 close of $301.71 to $165.74.
- KLA makes the tools chipmakers use to find defects on wafers and masks and to measure the patterns printed on them, a field known as process control, where it is the largest supplier. Its fiscal year ends in June, so fiscal 2026 runs from July 2025 to June 2026. Nothing in the company's filings explains why semiconductor equipment stocks spiked and then fell together after June, so this piece stays with what KLA reported and what its own slides claim.
KLA's 2030 Target Model
- Page 12 of the June-quarter earnings presentation, released July 28, sets two target models side by side: the 2026 model the company published earlier and the 2030 model introduced at its March 12 investor day.
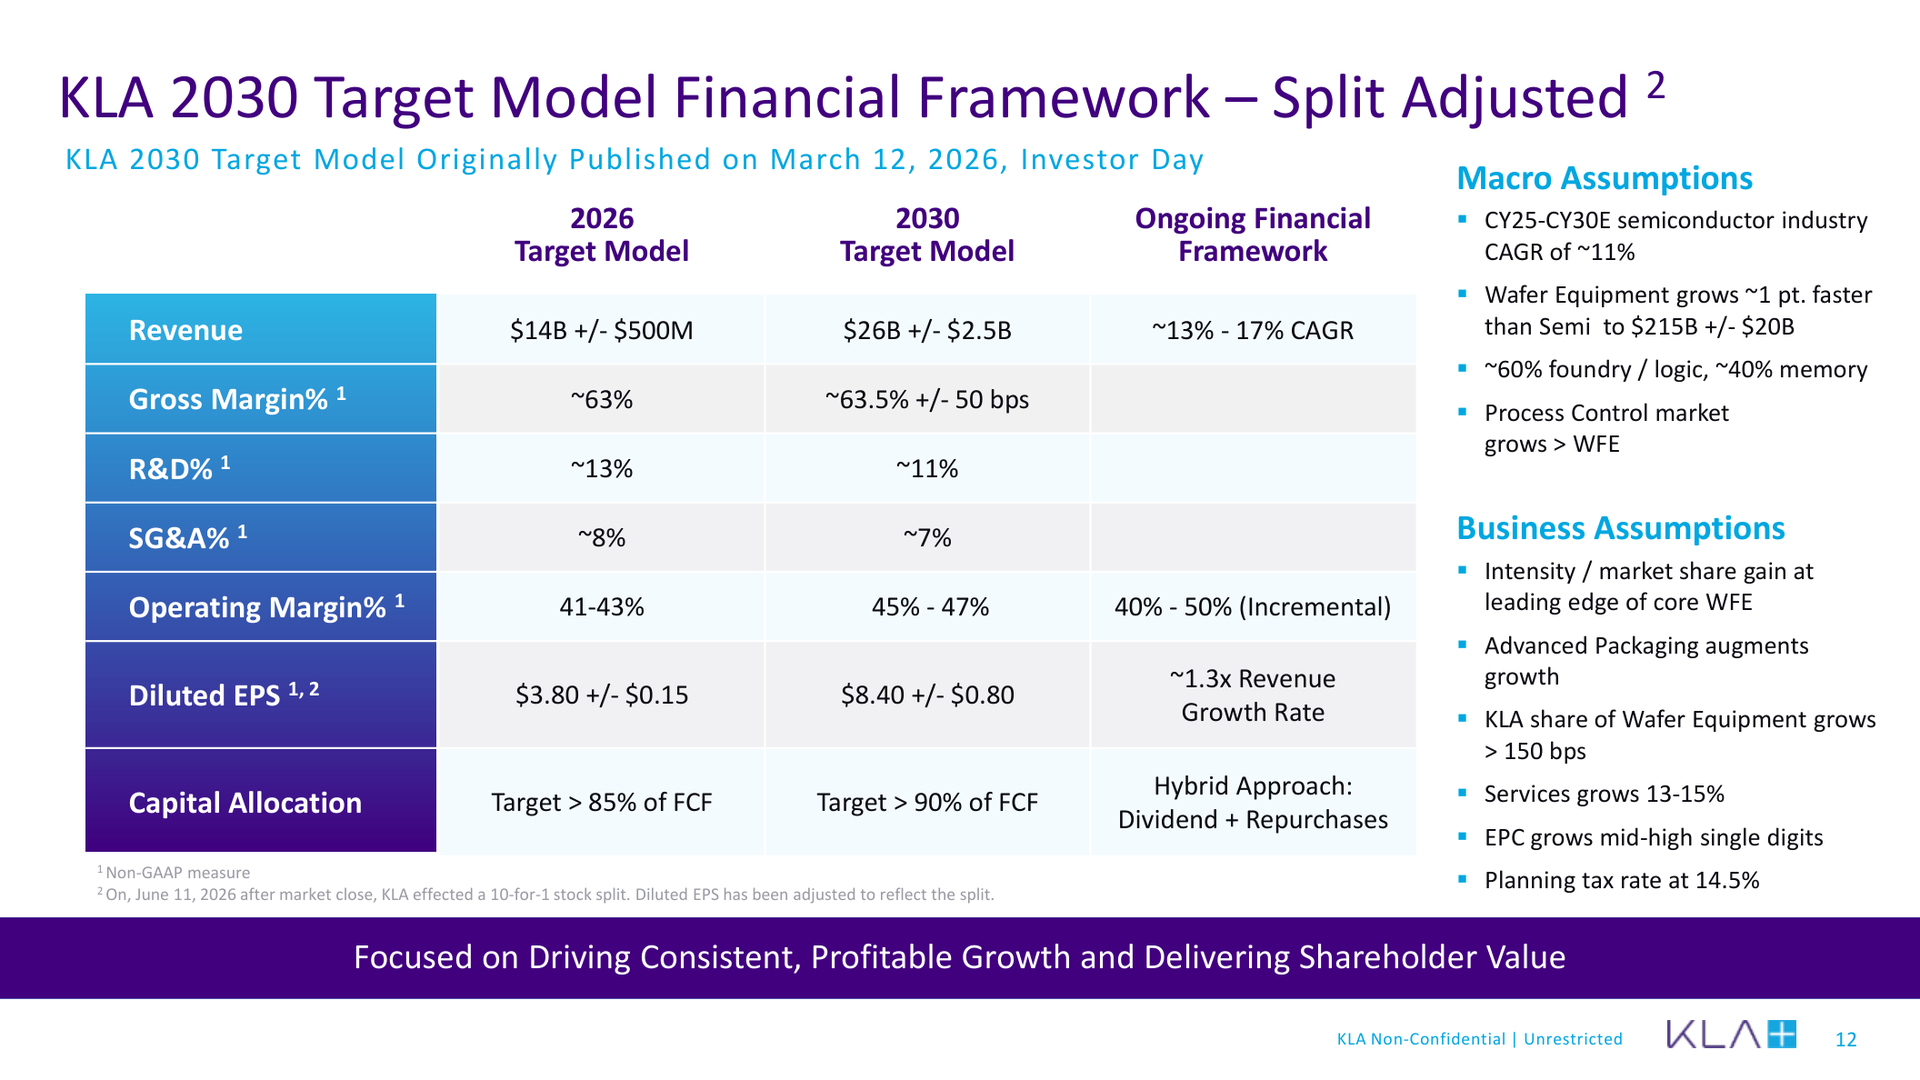
- Company disclosure (June-quarter 2026 earnings presentation, page 12): The 2030 target model calls for revenue of $26 billion plus or minus $2.5 billion, non-GAAP gross margin of about 63.5%, operating margin of 45% to 47%, and diluted EPS of $8.40 plus or minus $0.80, with more than 90% of free cash flow returned to shareholders. It assumes the semiconductor industry grows about 11% a year from 2025 to 2030, wafer equipment reaches $215 billion plus or minus $20 billion, and KLA's share of wafer equipment rises by more than 150 basis points.
- The 2026 model is already behind the company. It called for revenue of $14 billion plus or minus $500 million, and the July shareholder letter says revenue in the second half of calendar 2026 should be about 20% higher than in the first half.
- Own calculation (10-Q and 10-K quarterly revenue): First-half calendar 2026 revenue was $7.073 billion. Adding 20% for the second half gives about $15.56 billion for the year, $1.06 billion above the top of the 2026 range.
- The 2030 model is a bigger ask. Calendar 2025 revenue was $12.745 billion, and reaching $26 billion by 2030 takes a compound annual growth rate of 15.3%, near the middle of the 13% to 17% long-term range printed on the same slide.
- The margin path is on the slide too. R&D falls from about 13% of revenue in the 2026 model to about 11% in 2030, and SG&A from about 8% to about 7%. Those two lines carry most of the move in operating margin from 41% to 43% up to 45% to 47%. The framework also expects incremental operating margin of 40% to 50% and EPS growth of about 1.3 times revenue growth.
- The June quarter sits between the two models. Non-GAAP operating margin of 43.7% already clears the top of the 2026 range and is 1.3 points short of the 2030 floor. Non-GAAP gross margin of 62.4% is still a little below the 2026 model's 63%.
- Every assumption depends on customer spending. Wafer equipment has to outgrow the chip industry by about a point a year, process control has to outgrow wafer equipment, and KLA has to gain share inside it. The company splits the 2030 equipment market at roughly 60% foundry and logic and 40% memory.
- The last line on the slide is capital allocation. The 2026 model targeted returning more than 85% of free cash flow, and the 2030 model raises that to more than 90%.
The 90% Free Cash Flow Return Pledge
- The bottom of page 8 states the commitment in one line: over the long term, more than 90% of free cash flow goes back to shareholders through dividends and buybacks.
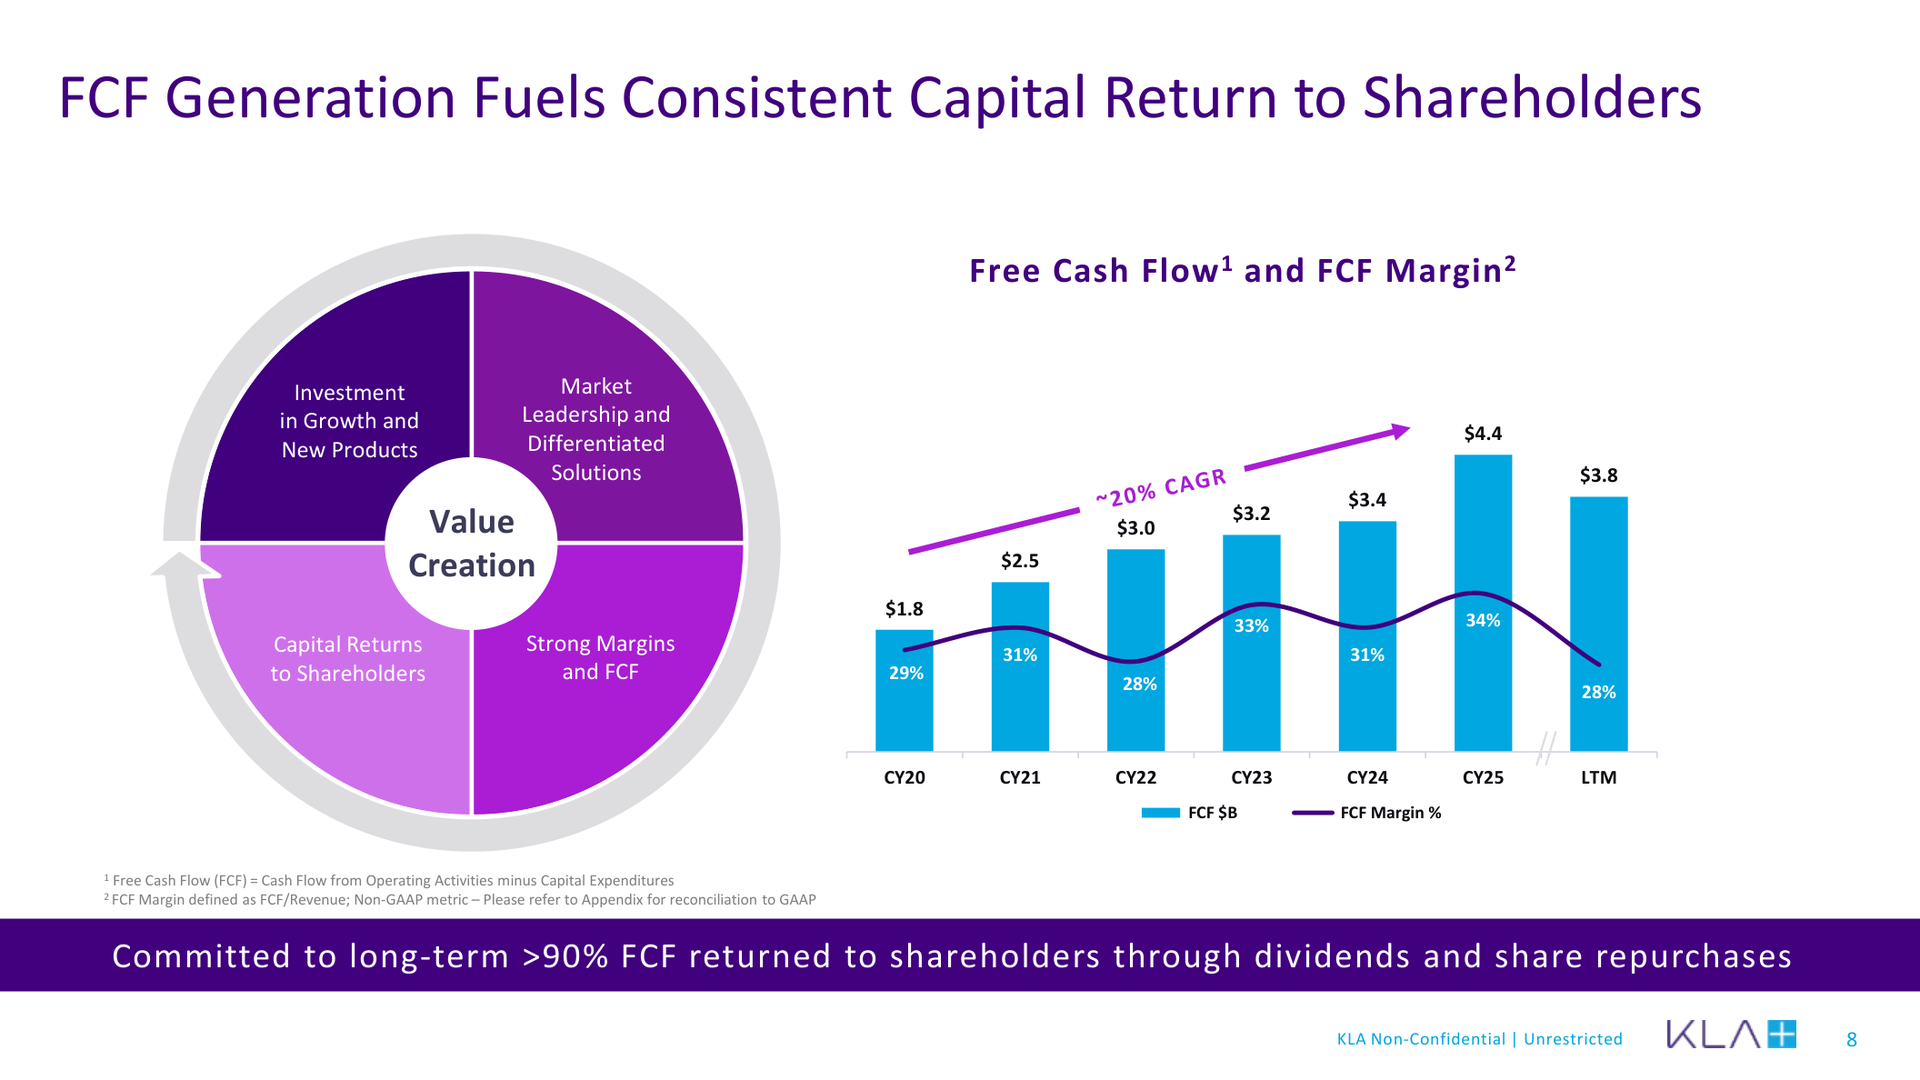
- The bars on the same page show free cash flow rising every calendar year from $1.8 billion in 2020 to $4.4 billion in 2025. The last bar breaks the pattern. Trailing twelve-month free cash flow through June was $3.8 billion, and free cash flow margin fell from 34% in 2025 to 28%.
- The shareholder letter names the cause on page 5. KLA says it has made meaningful investments in working capital and capital expenditures to support the current growth environment, and that given the expected scale of wafer equipment investment over the next several years, those investments will continue.
- The fiscal 2026 10-K cash flow statement puts numbers on the year. Buybacks took $2.290 billion and dividends $1.058 billion, a total of $3.348 billion, or 88.9% of free cash flow. That is 1.1 points short of the 90% target.
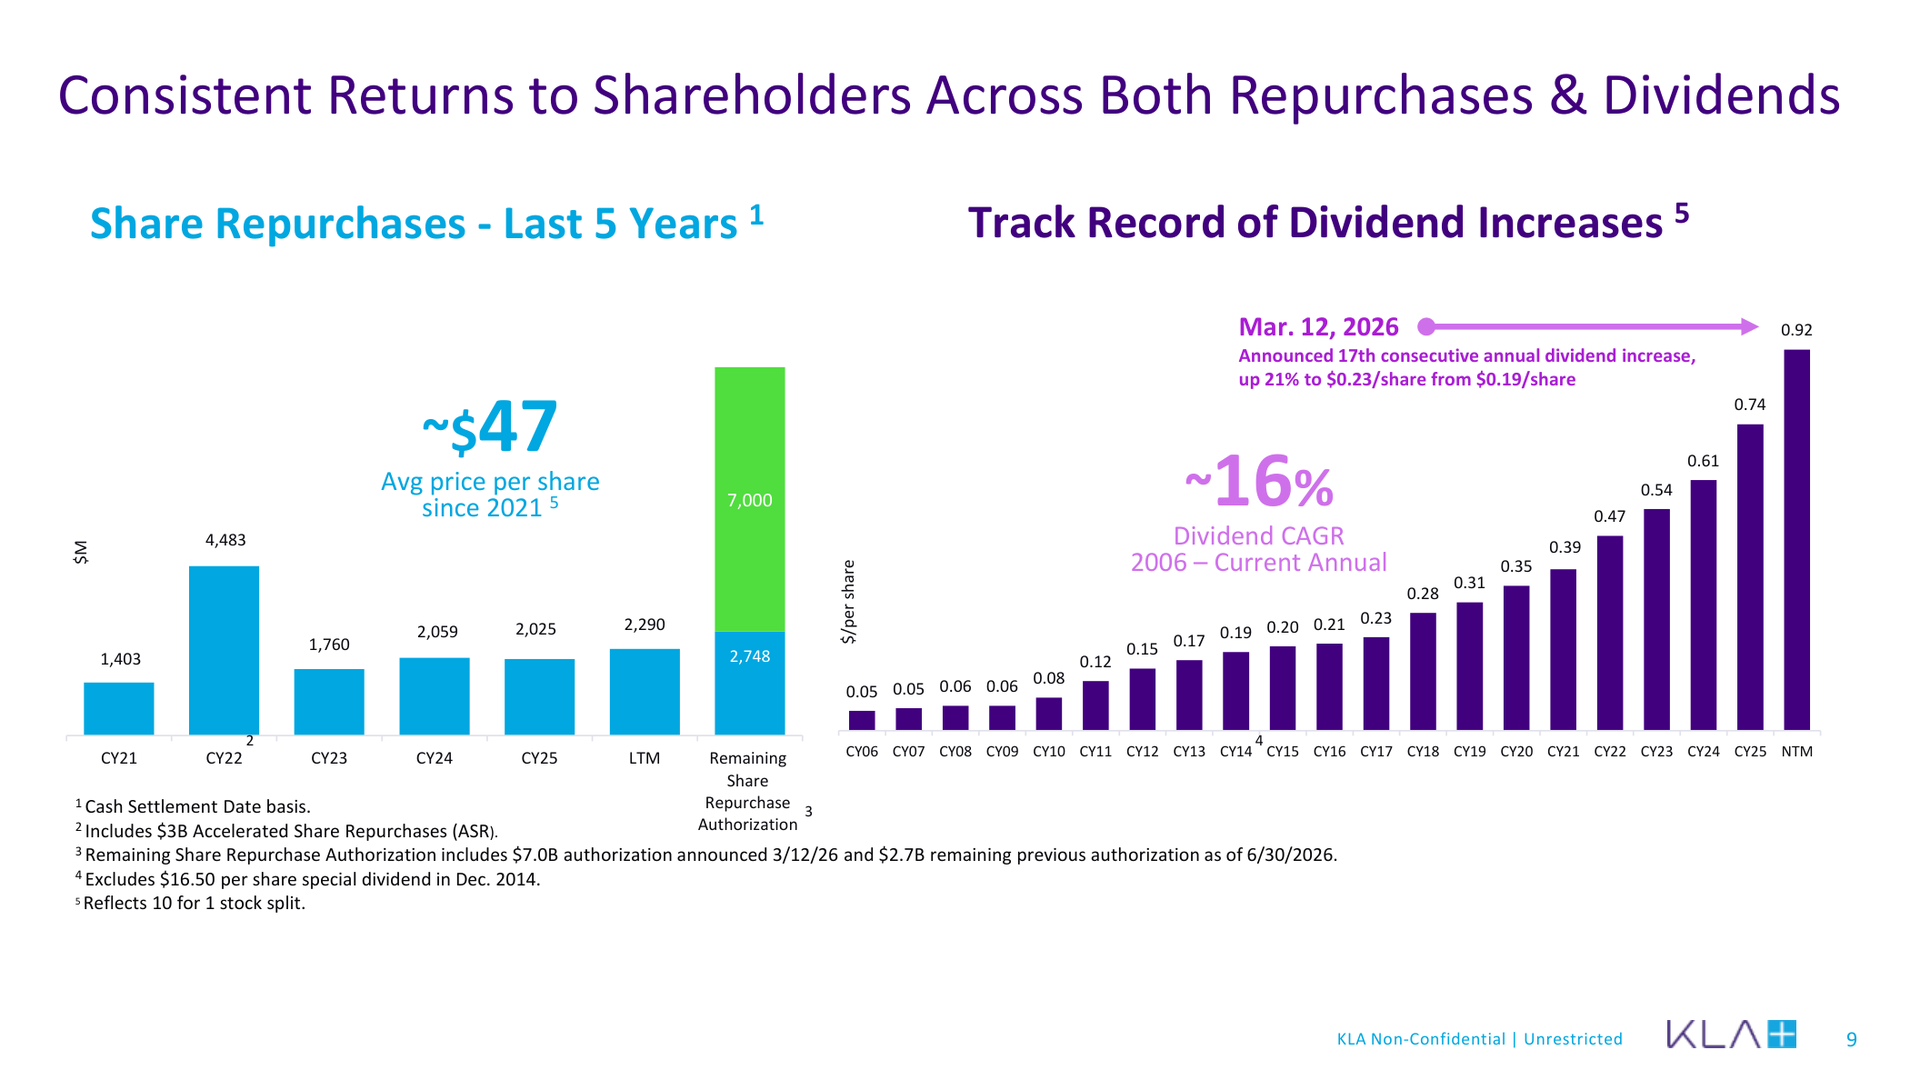
- Page 9 lists five years of repurchases: $1.403 billion in 2021, $4.483 billion in 2022 including a $3 billion accelerated repurchase, $1.760 billion in 2023, $2.059 billion in 2024, and $2.025 billion in 2025. The average price paid since 2021 is about $47 per share on a split-adjusted basis, and the stock at $165.74 is 3.5 times that level. A new $7.0 billion authorization approved on March 12 left about $9.7 billion available at June 30.
- Own calculation (10-K diluted share counts): Weighted diluted shares fell from 1.554 billion in fiscal 2021 to 1.320 billion in fiscal 2026, -15.1% over five years. Net income grew 2.3 times over the same period and EPS 2.7 times.
- The dividend went up +21% in March, the 17th consecutive annual increase. The split-adjusted quarterly dividend of $0.23 annualizes to $0.92, a yield of 0.56% at the current price.
- Page 7 shows the balance sheet behind the pledge. At June 30, cash and marketable securities totaled $4.902 billion against debt of $5.887 billion. The $5.95 billion of bonds carry a weighted average rate of 4.67% and a weighted average maturity of 18.1 years, rated A2 by Moody's and A- by S&P and Fitch. Net debt of $985 million equals 26% of a year's free cash flow.
The Market Case for Process Control
- The market's view of KLA fits in one sentence: the more complex AI chips become, the more steps need inspection, and KLA sells more of that inspection than anyone else.
- Part of that case shows up in the filings. In the June quarter, patterning revenue, which combines metrology and mask inspection, grew +61%, PCB and component inspection +96%, and services +17%. Taiwan revenue doubled in two years, and Korea grew +26.2% in fiscal 2026 on high-bandwidth memory investment.
- The other part has not shown up yet. The inventory, receivables, and purchase commitments KLA built ahead of that growth have not turned back into cash, and the 10-K says the company cannot assure that customers' elevated investment will continue.
- The investor day assumptions rest on the same logic: rising inspection intensity and share gains at the leading edge, with advanced packaging adding growth. All three sit in the business assumptions box on page 12.
From KLA-Tencor to the 10-for-1 Split
- KLA began as KLA-Tencor, formed in April 1997 when KLA Instruments and Tencor Instruments merged. The two companies had started operating in 1975 and 1976. The annual report filed in August 2019 is the first to carry the name KLA Corporation (formerly KLA-Tencor).
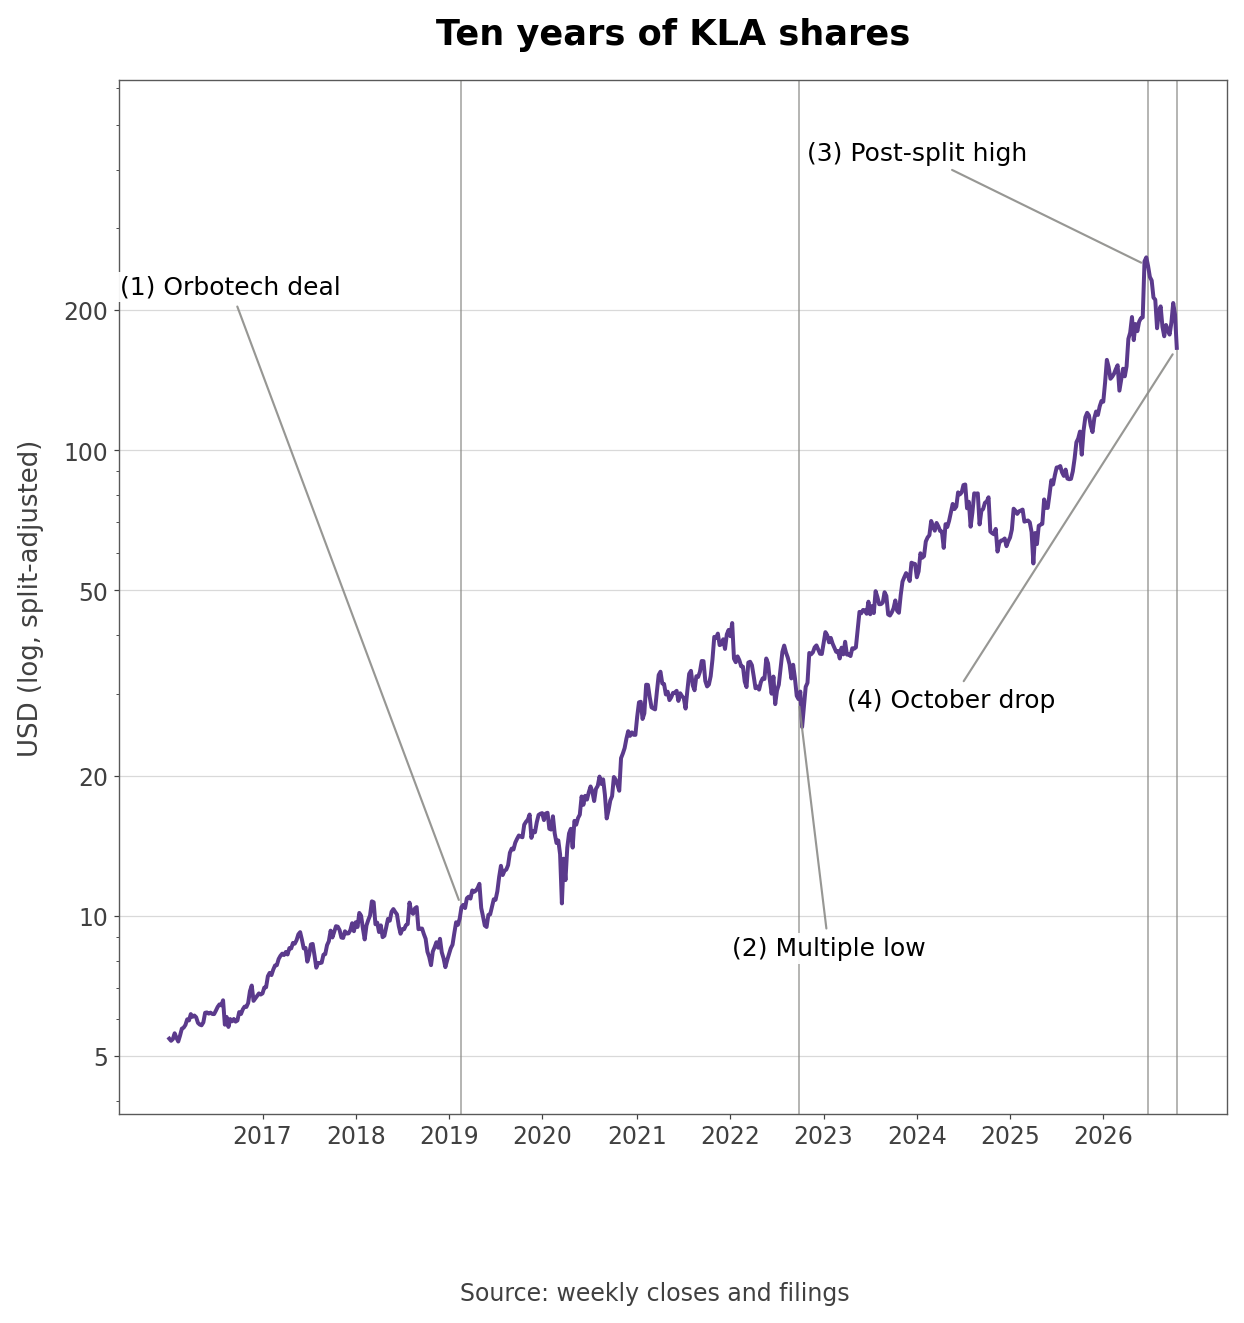
- The first marker is the February 20, 2019 close of the Orbotech acquisition, which brought in the specialty semiconductor process and PCB and component inspection businesses that now make up about 7% of revenue. The second is September 2022, when the P/E fell to 12.69x.
- In between, the cycle turned once. Fiscal 2024 revenue fell -6.5% to $9.812 billion and net income -18.5%. That was the only down year for revenue in nine, and revenue grew 3.9 times from $3.48 billion in fiscal 2017 to $13.58 billion in fiscal 2026.
- The third marker is June 2026. KLA announced a 10-for-1 stock split on May 7, effective after the close on June 11. The weekly close went from $192 to $254 in the split week, and the June 30 close was $301.71. The fourth is the slide that followed, including a -15.0% monthly decline in October alone.
- From the first week of the ten-year window at $5.45, the shares have risen about 30 times. They gained +100.1% in 2025 and are still up +36.4% for 2026.
Why Did Free Cash Flow Lag Net Income?
- Eight years of June fiscal-year cash flow statements side by side give the answer.
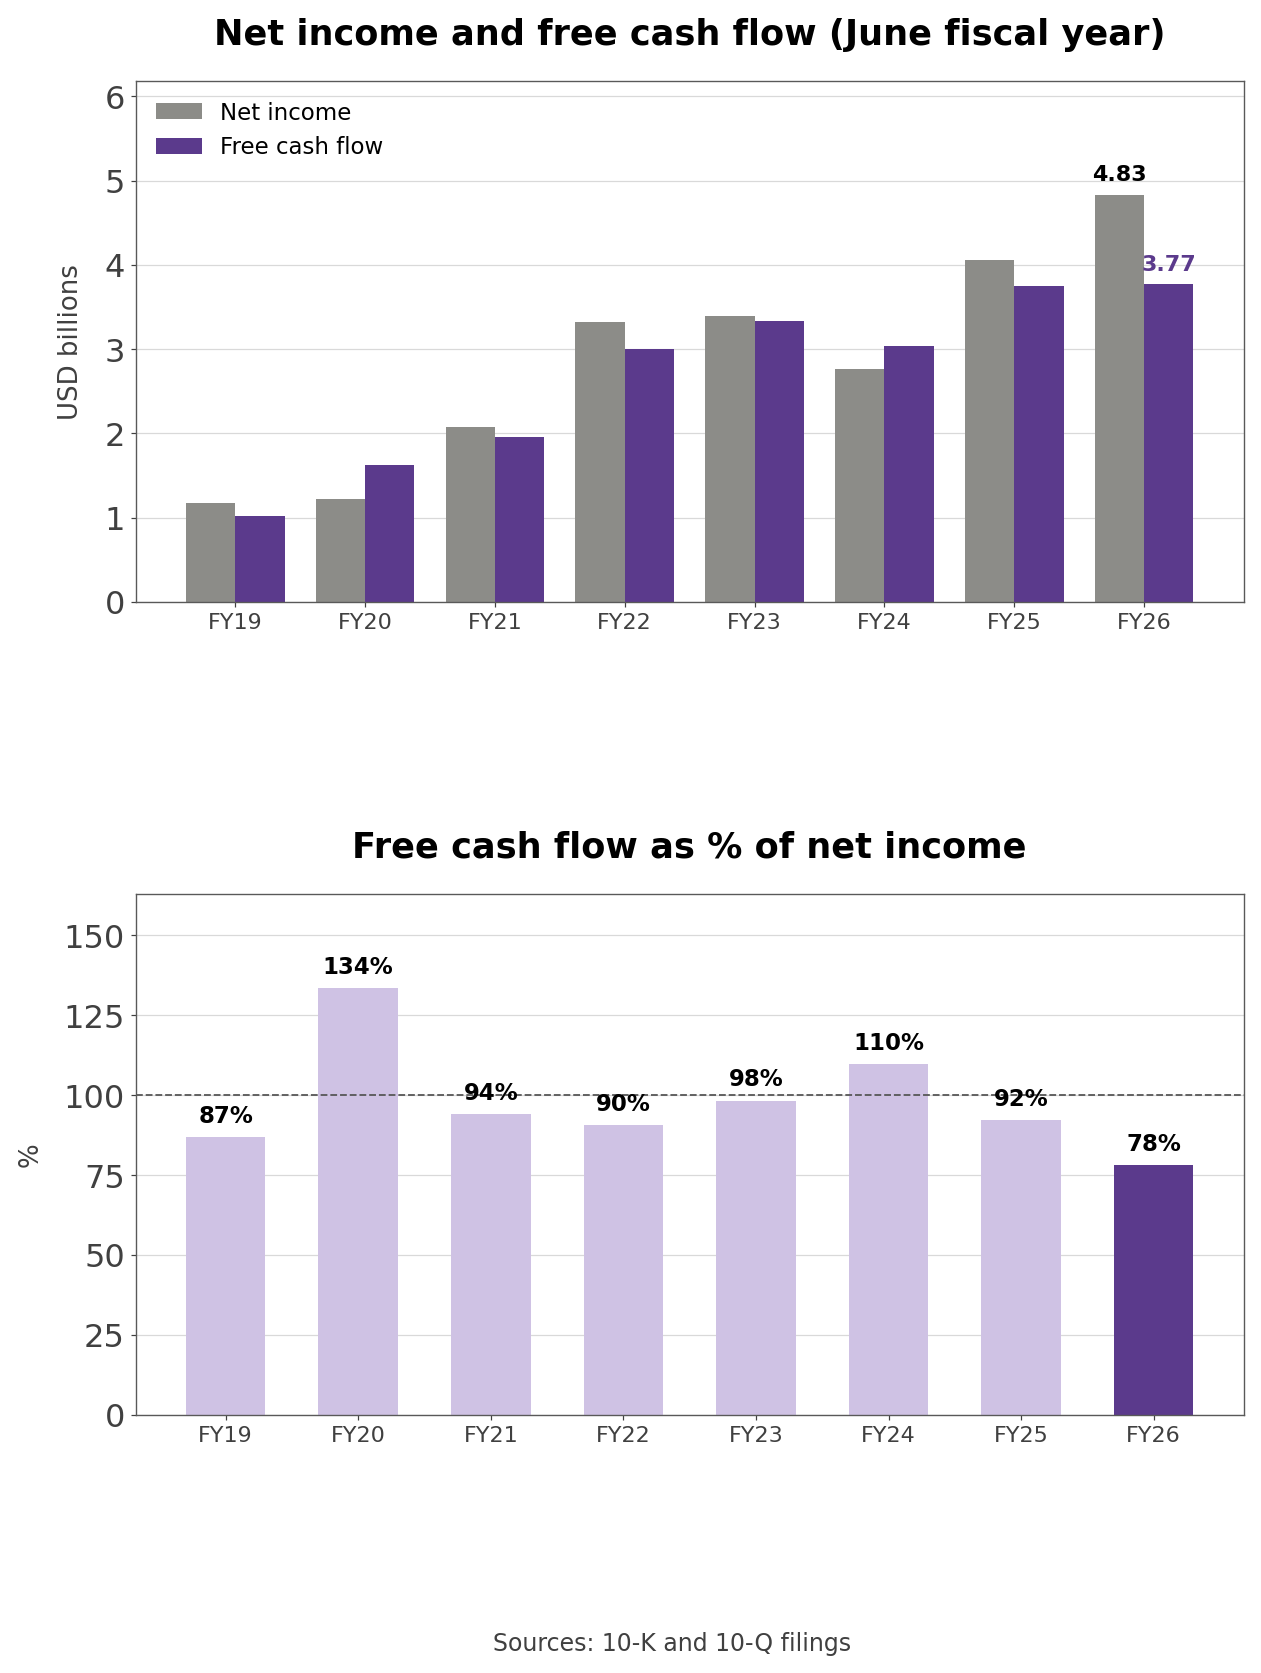
- Free cash flow as a share of net income was 109.8% in fiscal 2024, 92.2% in fiscal 2025, and 78.0% in fiscal 2026, the lowest of the eight years.
- Own calculation (10-K cash flow statements): The $1.064 billion gap between fiscal 2026 net income and free cash flow is 102.6% explained by the $466 million increase in inventory and the $625 million increase in receivables, which together total $1.091 billion.
- A year earlier inventory rose $155 million and receivables $431 million. This time inventory built three times as fast and receivables 1.5 times as fast. At June 30 inventory stood at $3.649 billion and receivables at $2.889 billion.
- The ratio has moved the other way before. In fiscal 2024, when revenue fell -6.5%, the inventory build shrank from $749 million to $164 million and free cash flow exceeded net income. In fiscal 2019, when receivables rose $354 million, the ratio was 86.9%. It has tracked how fast inventory and receivables pile up, and fiscal 2026 is the year both sped up at once.
- Splitting the year by quarter puts the slowdown in the last two. Subtracting cumulative 10-Q figures, free cash flow was $622 million in the March 2026 quarter against $990 million a year earlier, and $817 million in the June quarter against $1.065 billion. The two quarters together were -29.9%.
- The June quarter alone shows the gap most clearly. Non-GAAP net income was $1.39 billion and free cash flow $817 million, or 59% of it, while the company returned $876 million to shareholders in the same quarter, more than it generated.
Purchase Commitments 2.5 Times Higher
- A third number sits ahead of inventory and receivables. Each year the 10-K liquidity section reports what KLA has committed to buy from suppliers as of June 30.
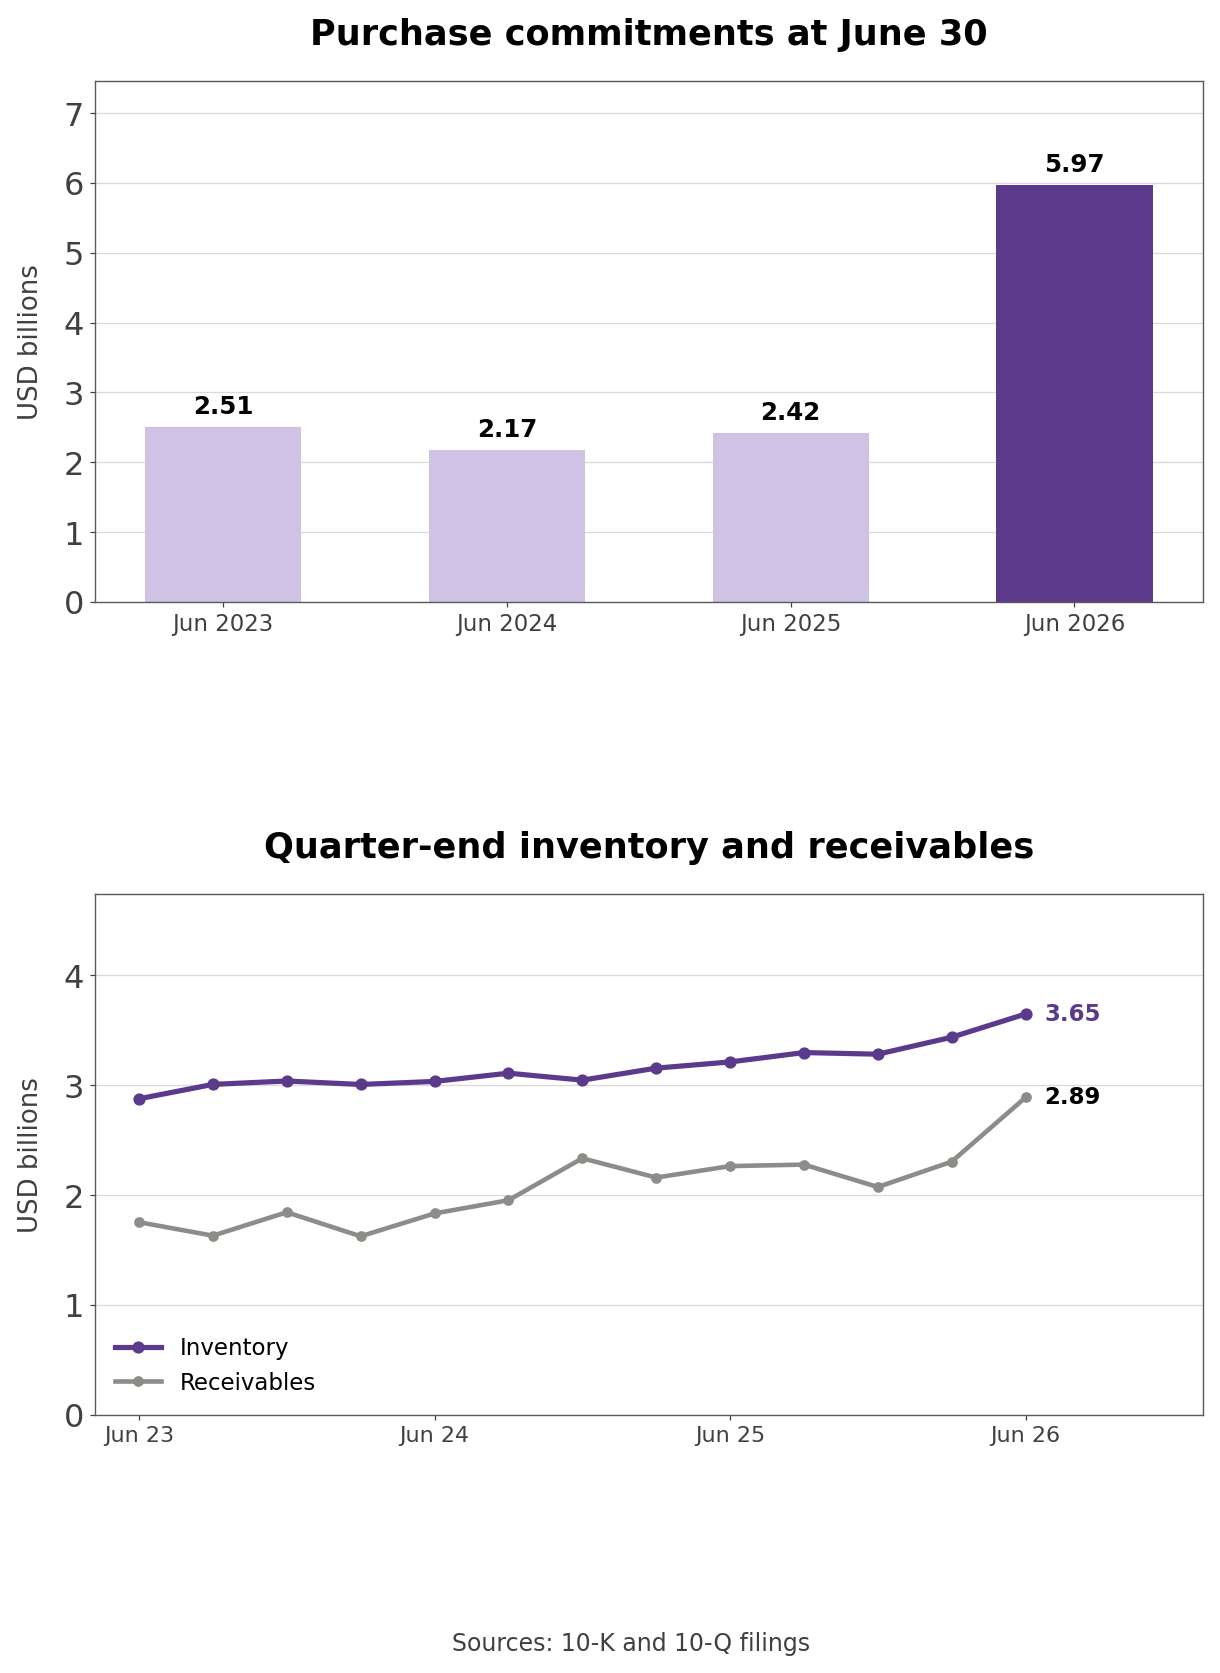
- Those commitments were $2.51 billion in 2023, $2.17 billion in 2024, and $2.42 billion in 2025. At June 30, 2026 they were $5.97 billion, 2.5 times the prior year, and the company says most will be paid within 12 months.
- Filing footnote (fiscal 2026 10-K, management's discussion): KLA increased purchase commitments to secure critical components, which may affect the timing and amount of costs and working capital needs. Working capital was $8.08 billion at June 30, up $1.46 billion from a year earlier.
- The company also gives its reason. In a supply chain with long lead times, it is adding capacity as the expected second-half revenue growth materializes. September-quarter revenue guidance of $4.0 billion is 9% above the June quarter.
- The same 10-K's risk factors carry the opposite sentence. Heavy investment in AI semiconductors has lifted customers' capital spending, but there is no assurance it will continue, and inventory and capacity bought ahead of demand may go unused or be delayed. The $5.97 billion is the amount KLA has committed in advance to that demand continuing.
- Customer prepayments have not grown at the same pace. Current contract liabilities rose from $1.424 billion at September 30, 2025 to $1.537 billion at June 30, 2026, an increase of $113 million over nine months, small next to the $3.55 billion rise in purchase commitments over a year.
How KLA Makes Money From Inspection and Metrology
- A leading-edge chip plant costs well over $10 billion, and the faster a fab raises yield, the sooner it earns that back. KLA sells the tools that manage yield. Its machines do not print circuits; they check whether the printing worked.
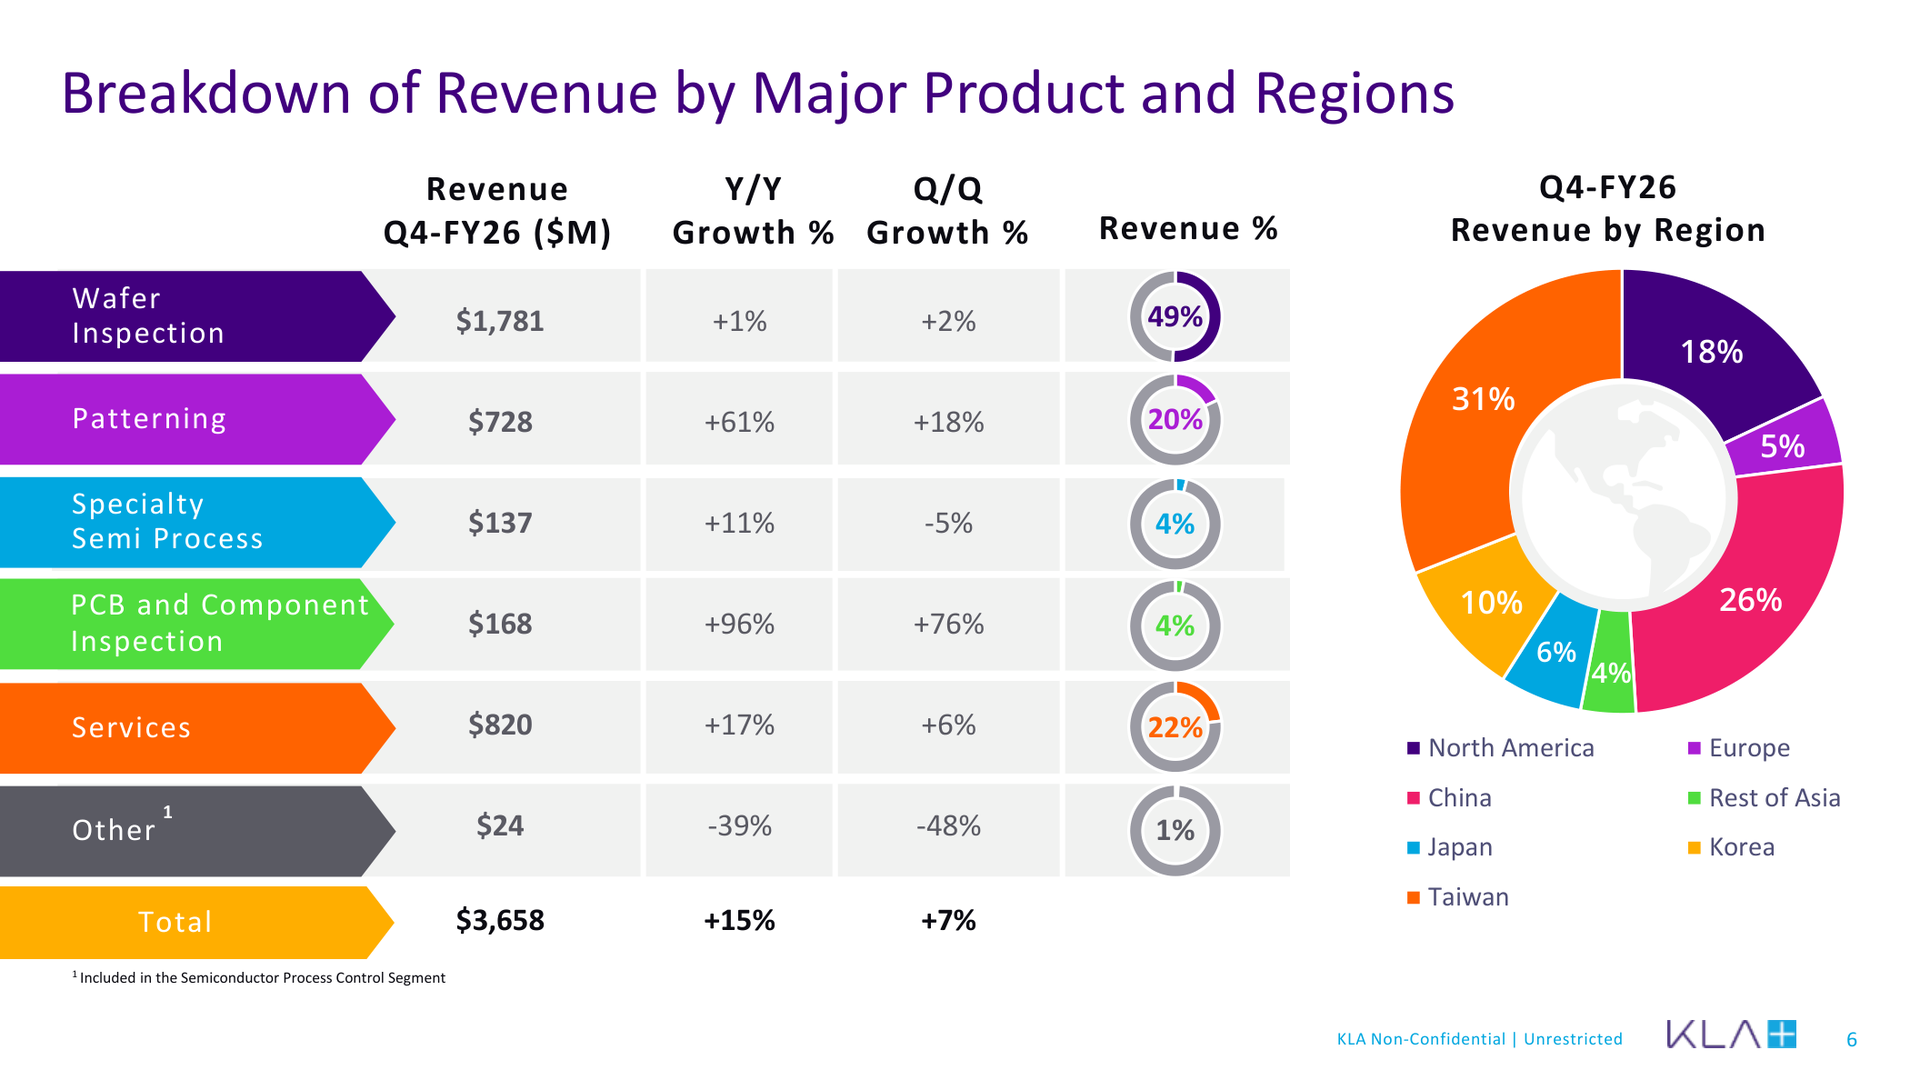
- Fiscal 2026 revenue by product was $6.631 billion from wafer inspection (49%), $2.707 billion from patterning (20%), $3.126 billion from services (23%), $503 million from specialty semiconductor process, and $460 million from PCB and component inspection.
- By reporting segment the picture is simpler. Of June-quarter revenue of $3.658 billion, semiconductor process control contributed $3.257 billion, or 89%, specialty semiconductor process 7%, and PCB and component inspection 4%.
- Wafer inspection finds defects on wafer surfaces between process steps. Patterning measures whether printed features match the design in size and placement. In the June quarter wafer inspection grew +1% and patterning +61%, so growth came from measuring rather than defect hunting.
- The earnings slides feature two flagship tools. The KLA 3935, part of the fifth-generation 39xx series, is a broadband plasma patterned wafer defect inspection system for leading-edge logic and foundry fabs, used for EUV print checks and line monitoring. The Kronos system finds defects in advanced wafer-level packaging.
- Services maintain and upgrade the installed base. The company says this is the 17th straight year of services growth, and the 2030 model assumes services grow 13% to 15% a year.
- Customers are concentrated. TSMC accounted for about 19% of fiscal 2026 revenue, up from 13% in fiscal 2024. In the June quarter 79% of semiconductor process control system revenue came from foundry and logic and 21% from memory, and the company expects memory to reach about 27% in the September quarter, about 90% of it DRAM.
- The 10-K names Applied Materials, ASML, Hitachi High-Tech, Lasertec, and Onto Innovation as competitors. KLA spent $1.532 billion on R&D in fiscal 2026, 11.3% of revenue, and 27% of its roughly 17,000 employees work in R&D. GAAP gross margin for the year was 61.3%.
Revenue Shift From China to Taiwan and Korea
- Two years changed the regional mix, and the 10-K regional table for fiscal 2024 and fiscal 2026 shows how far.
- China revenue barely moved, from $4.197 billion to $4.048 billion, while its share fell from 42.8% to 29.8%. Taiwan doubled from $1.738 billion to $3.644 billion, Korea went from $907 million to $1.834 billion, and North America from $1.071 billion to $1.757 billion.
- The June quarter goes a step further. Page 6 of the earnings presentation shows Taiwan at 31%, China 26%, North America 18%, Korea 10%, Japan 6%, and Europe 5%. China is still the largest region for the full year, but Taiwan led in the quarter.
- Company disclosure (fiscal 2026 10-K): China revenue was roughly flat as continued investment in mature-node capacity by Chinese chipmakers was largely offset by export controls affecting certain advanced technology sales. Taiwan grew +13.7% on AI and high-performance computing demand, and Korea +26.2% on high-bandwidth memory and advanced DRAM investment.
- Of the $3.767 billion of revenue added over two years, China contributed -$148 million and Taiwan $1.906 billion. KLA's growth is coming from outside China, mostly from the region where TSMC operates.
How KLA Compares With Three Equipment Peers
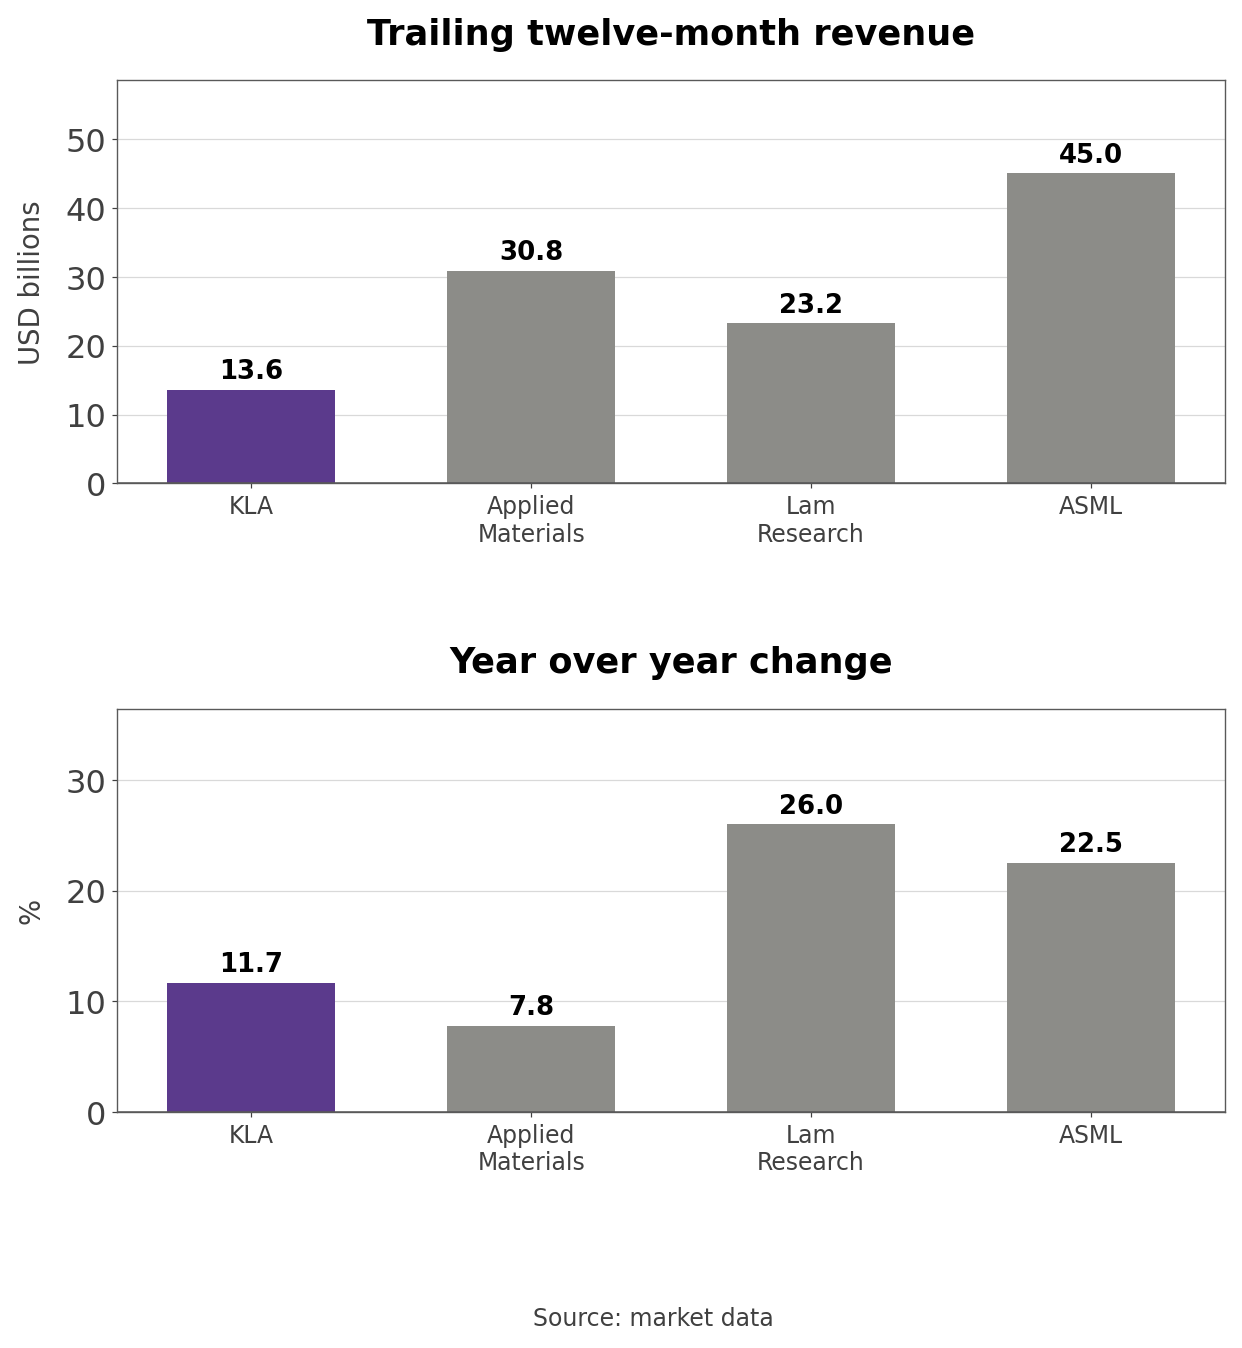
- Trailing twelve-month revenue is $13.58 billion at KLA, $30.84 billion at Applied Materials, $23.23 billion at Lam Research, and $44.98 billion at ASML. Lam at +26.0% and ASML at +22.5% are growing faster than KLA at +11.7%, and Applied at +7.8% is slower. KLA is the smallest of the four, at 30% of ASML's revenue and 44% of Applied's.
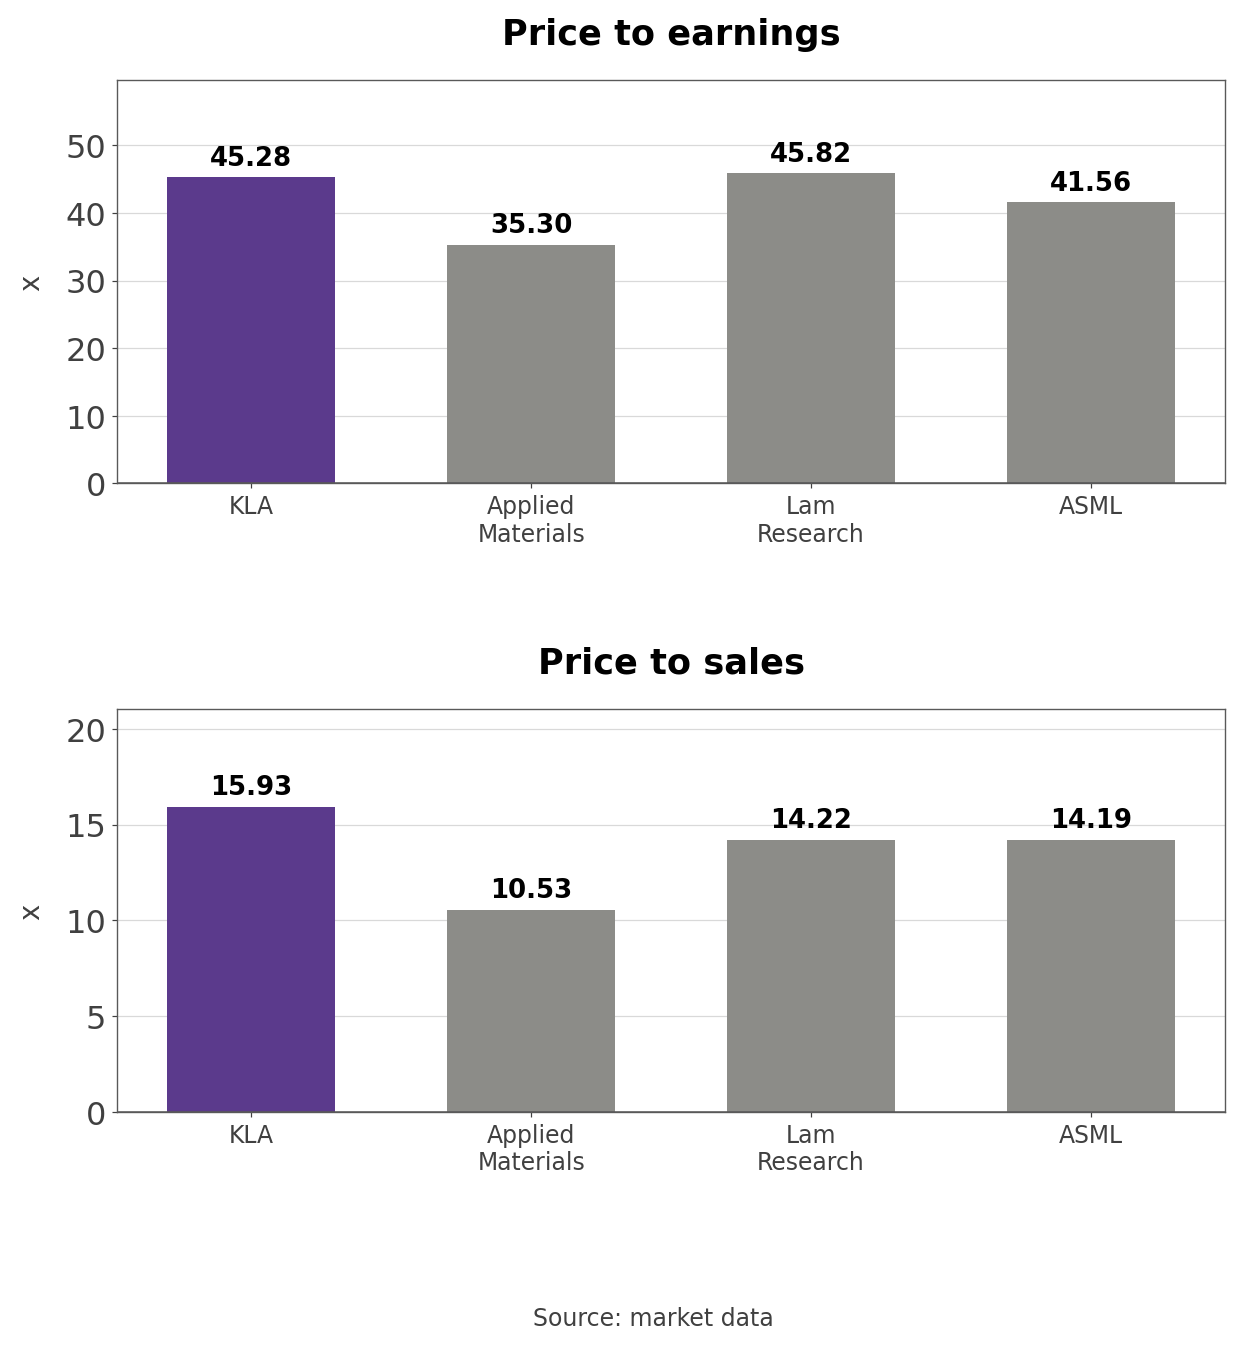
- From the same market data source, P/E is 45.28x for KLA, 35.30x for Applied, 45.82x for Lam, and 41.56x for ASML. KLA's price-to-sales ratio of 15.93x is the highest of the four, although its growth rate ranks third.
- Dividing P/E by trailing revenue growth gives 3.9 for KLA, 4.5 for Applied, 1.8 for Lam, and 1.8 for ASML. Per point of growth, only Applied costs more than KLA.
- The stocks moved as a group. On month-end closes since June 30, KLA is down -45.0%, Applied -43.3%, Lam -39.0%, and ASML -17.4%. Over one year KLA is up +37.9%, Applied +76.6%, Lam +68.4%, and ASML +55.6%, so KLA gained the least.
KLAC P/E and P/S Bands Over 61 Months
- A P/E of 45.28x sits at the 90th percentile of the 61-month window. The median is 28.56x, the high was 70.06x in June 2026, and the low was 12.69x in September 2022.
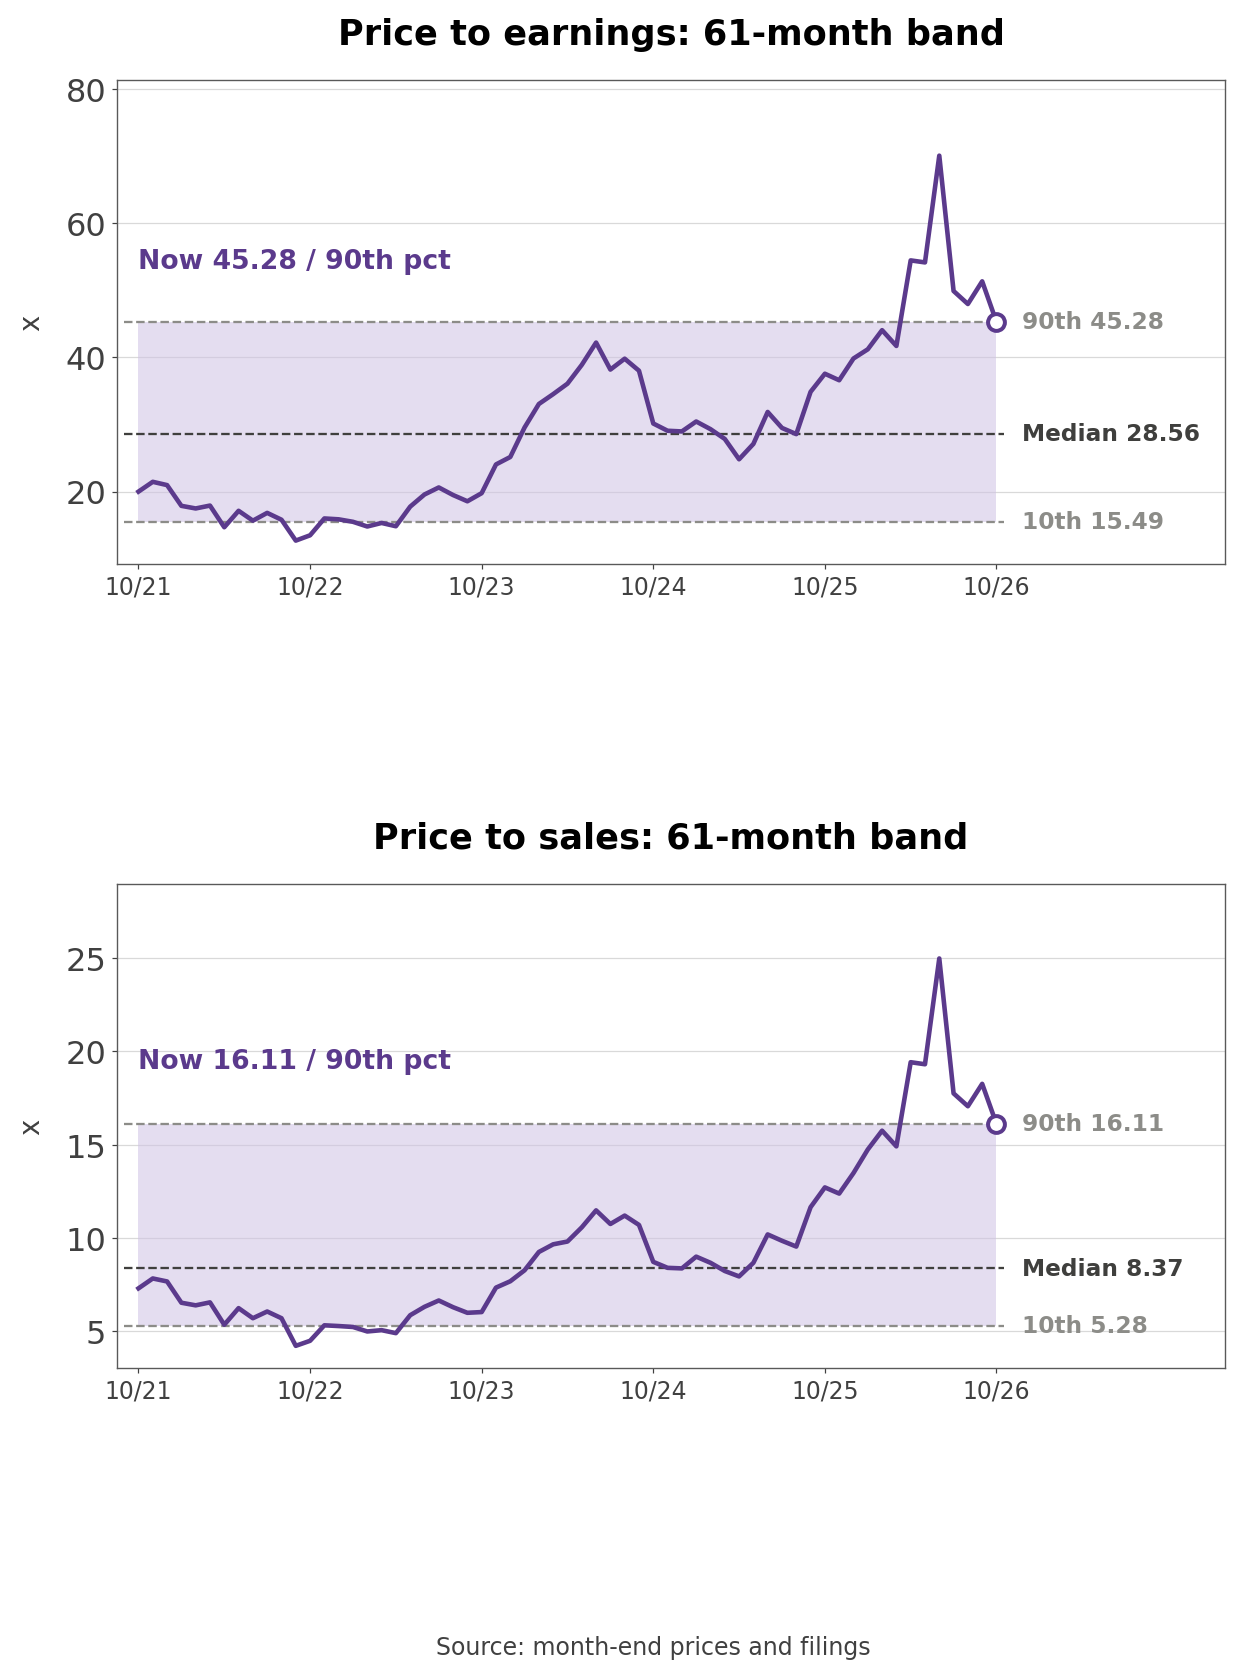
- Price-to-sales of 16.11x is close to twice the 61-month median of 8.37x. Even after the -45.1% drop from June 30, both multiples sit in the upper part of the five-year range. Price-to-book comes out around 34x on equity of only $6.35 billion, so it is left out of the band.
- At $165.74 and 1.3065 billion shares outstanding on the August 3 cover page, market capitalization is $216.55 billion. Divided by fiscal 2026 net income of $4.831 billion, the P/E is 44.83x. The band's 45.28x uses quarterly diluted weighted shares and runs slightly higher, and another aggregator shows 46.45x using twelve months through March.
- Against the 2030 target EPS of $8.40, the current price is 19.7x, between the 61-month 10th percentile of 15.49x and the median of 28.56x. That multiple measures how much of the 2030 target the price already carries.
Three Conditions That Move the Stock
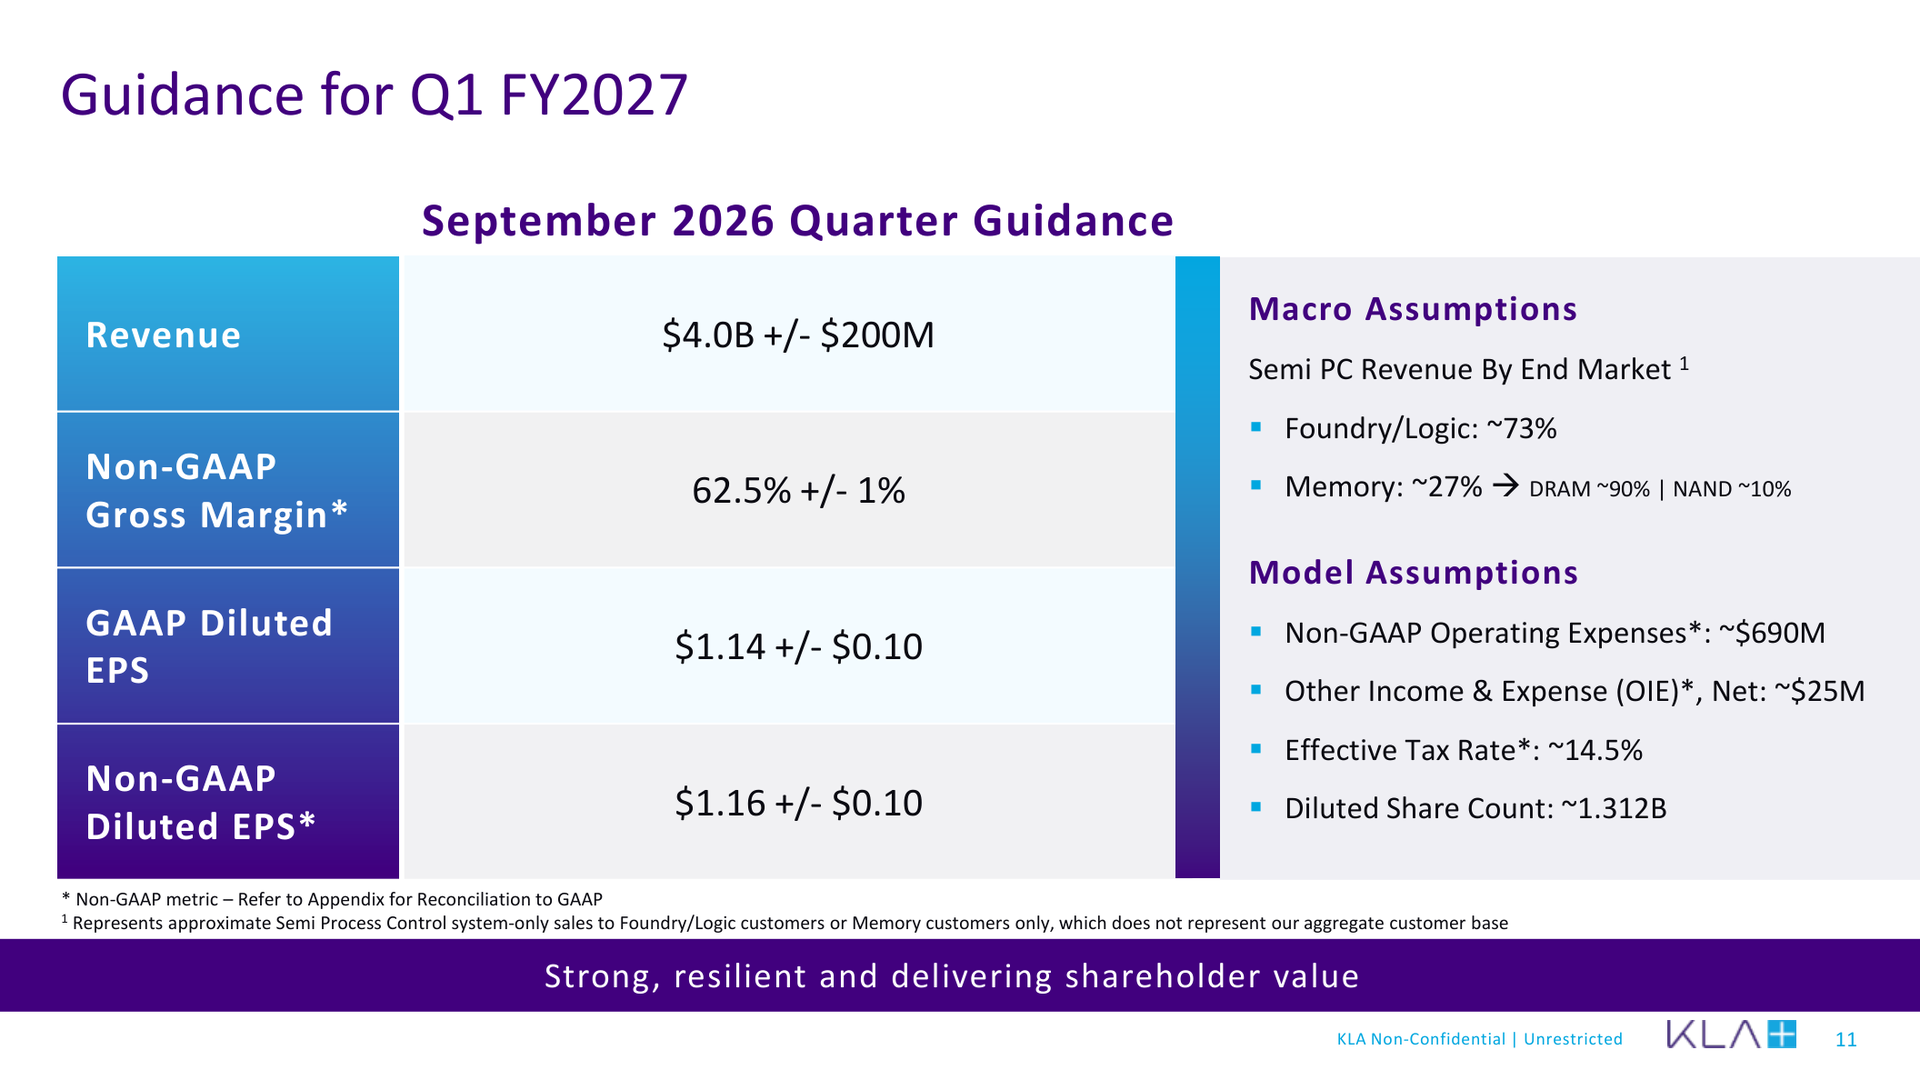
- Customer spending comes first. KLA guided September-quarter revenue to $4.0 billion plus or minus $200 million and non-GAAP EPS to $1.16 plus or minus $0.10, and it expects the second half of calendar 2026 to be about 20% above the first. If that holds and the 2027 outlook extends it, the first step toward the 2030 model is in place. If customers delay, purchase commitments and inventory become the first burden.
- Cash conversion is the second. Free cash flow is 78% of net income while the company promises to return more than 90%. If inventory and receivables turn into revenue and conversion returns to the 90% range, the pledge and the investment can coexist. If conversion stays here, buybacks slow or net debt of $985 million grows.
- China and customer concentration are the third. China revenue of $4.05 billion held flat under export controls, but advanced-node sales remain blocked, and TSMC alone is about 19% of revenue. Wider restrictions or a schedule change at one customer would move the revenue outlook with them.
What the First-Quarter Filing Should Show
- The fiscal 2027 first-quarter report, covering July through September, is due in late October. The first numbers to check are whether revenue reached the $4.0 billion guidance and what share of net income turned into free cash flow.
- The second is inventory and receivables. If the June 30 balances of $3.649 billion and $2.889 billion grow more slowly than revenue, the past year's investment has started coming back as cash. If they grow faster, the opposite is happening.
- One question this piece cannot settle is how much of the $5.97 billion in purchase commitments backs orders KLA has already received. The 10-K reports only the total and does not tie commitments to orders. If commitments run ahead of orders, that gap is the size of the risk when customer spending turns, and the next filing is where commitments and contract liabilities can be read together.
Related Analysis
- Applied Materials (AMAT) Stock Analysis: Guidance Record: the largest equipment peer and the one KLA trails least on valuation, useful for comparing how a broad toolmaker and a process control specialist report the same customer cycle.
- TSMC (TSM) Stock: 60% Margins and Guidance It Keeps Beating: KLA's largest customer at about 19% of revenue, whose capital spending plans decide much of the September-quarter outlook discussed here.
- NVIDIA (NVDA) Stock Analysis: Guarantees and Cash Flow: another AI supplier where earnings ran ahead of cash, a useful frame for KLA's inventory and receivables build.
#KLA #KLAC #KLACStock #SemiconductorEquipment #ProcessControl #ChipStocks #USStocks #StockAnalysis #EquityResearch #GlobalStockBrief
'US Stock Analysis' 카테고리의 다른 글
| Halozyme (HALO) Stock: 2033 Convertible Notes, Dilution (0) | 2026.09.21 |
|---|---|
| Illumina (ILMN) Stock Analysis: Organic Growth vs M&A (0) | 2026.09.20 |
| AutoZone (AZO) Stock Analysis: ROIC Down 11 Quarters (0) | 2026.09.17 |
| NVIDIA (NVDA) Stock Analysis: $105B Guarantee, Cash Flow (0) | 2026.09.17 |
| Lennar (LEN) Stock Analysis: 12.9% Incentives, 0.89x P/B (0) | 2026.09.15 |


